efficient inactivation of ms-2 virus in water by ...mdula/efficient inactivation of ms-2 virus in...
TRANSCRIPT

Accepted Manuscript
Efficient inactivation of MS-2 virus in water by hydrodynamic cavitation
Janez Kosel, Ion Gutiérrez-Aguirre, Nejc Rački, Maja Ravnikar, Matevž Dular
PII: S0043-1354(17)30650-4
DOI: 10.1016/j.watres.2017.07.077
Reference: WR 13120
To appear in: Water Research
Received Date: 22 May 2017
Revised Date: 07 July 2017
Accepted Date: 31 July 2017
Please cite this article as: Janez Kosel, Ion Gutiérrez-Aguirre, Nejc Rački, Maja Ravnikar, Matevž Dular, Efficient inactivation of MS-2 virus in water by hydrodynamic cavitation, Water Research(2017), doi: 10.1016/j.watres.2017.07.077
This is a PDF file of an unedited manuscript that has been accepted for publication. As a service to our customers we are providing this early version of the manuscript. The manuscript will undergo copyediting, typesetting, and review of the resulting proof before it is published in its final form. Please note that during the production process errors may be discovered which could affect the content, and all legal disclaimers that apply to the journal pertain.

ACCEPTED MANUSCRIPT
1
1 Efficient inactivation of MS-2 virus in water by hydrodynamic cavitation
2
3 Janez Kosel1,2, Ion Gutiérrez-Aguirre2, Nejc Rački2, Maja Ravnikar2, Matevž Dular1*
4
5 1Department of Power Engineering, Faculty of Mechanical Engineering, University of
6 Ljubljana, Aškerčeva 6, 1000 Ljubljana, Slovenia
7 2National Institute of Biology, Večna pot 111, 1000 Ljubljana, Slovenia
8
9 *Correspondence to: [email protected]
10
11 Abstract
12 The aim of this study was to accurately quantify the impact of hydrodynamic cavitation on the
13 infectivity of bacteriophage MS2, a norovirus surrogate, and to develop a small scale reactor
14 for testing the effect of hydrodynamic cavitation on human enteric viruses, which cannot be
15 easily prepared in large quantities. For this purpose, 3 mL scale and 1 L scale reactors were
16 constructed and tested. Both devices were efficient in generating hydrodynamic cavitation and
17 in reducing the infectivity of MS2 virus. Furthermore, they reached more than 4 logs
18 reductions of viral infectivity, thus confirming the scalability of hydrodynamic cavitation for
19 this particular application. As for the mechanism of page inactivation, we suspect that
20 cavitation generated OH- radicals formed an advanced oxidation process, which could have
21 damaged the host's recognition receptors located on the surface of the bacteriophage.
22 Additional damage could arise from the high shear forces inside the cavity. Moreover, the
23 effectiveness of the cavitation was higher for suspensions containing low initial viral titers
24 that are in similar concentration to the ones found in real water samples. According to this,

ACCEPTED MANUSCRIPT
2
25 cavitation generators could prove to be a useful tool for treating virus- contaminated
26 wastewaters in the future.
27
28 Keywords: MS2 bacteriophage; norovirus surrogate; hydrodynamic cavitation; Venturi type
29 constriction; phage infectivity
30
31
32
33 1. Introduction
34 The presence of enteric viruses (noroviruses, sapoviruses, rotaviruses, enteric adenoviruses,
35 and astroviruses) in water is a major risk for public health. They can survive for a long time in
36 water and may still cause an infection even in their highly diluted state (Haas et al., 1993).
37 Water disinfection can be achieved by chemical and physical procedures. Each procedure has
38 pros and cons and is used according to its cost and efficiency of the treatment. For example,
39 the widely used chlorine is very effective, however it may cause the formation of mutagenic
40 by-products (Simpson and Hayes, 1998). Similarly, raising temperatures can be expensive and
41 ineffective (Miller, 2012). Ultraviolet (UV) disinfection techniques have proved effective in
42 the inactivation of viruses, especially with the addition of hydrogen peroxide (H2O2) in
43 moderate dose (Ciriminna et al., 2016; Sun et al., 2016). Nevertheless, the effectiveness of
44 UV treatment could be hindered by absorbing particles and microorganisms that are captured
45 inside aggregates of particulate matter can be at least partially protected from UV light
46 (Oliver and Cosgrove, 1975). Consequently, new advanced techniques are being examined,
47 and hydrodynamic cavitation is one of such options (Dular et al., 2016).
48

ACCEPTED MANUSCRIPT
3
49 Cavitation, i.e. the appearance of vapour cavities inside an initially homogeneous liquid
50 medium, occurs if the pressure is lowered below vapour pressure. The liquid medium is then
51 disrupted at one or several points and "cavities" appear, their shape being strongly dependent
52 on the structure of the flow. The vapour structures are unstable, and when they reach a region
53 of increased pressure, they often collapse violently. As a result, strong shear flows, jets, high
54 local temperatures, shock waves, rapid depressurization and supersonic flow can appear
55 (Shamsborhan et al., 2010). Studies have shown that there is a great potential to utilize
56 cavitation in various important applications in the fields of biology (Šarc et al., 2016),
57 chemistry (Gogate, 2008), medicine (Zupanc et al., 2014), in environmental protection
58 (Gogate and Pandit, 2004), in liquid food applications such as beer (Albanese et al., 2016) and
59 for the intensification of various other chemical and physical processes (Carpenter et al.,
60 2016a).
61
62 Recently Su et al. (2010) have shown that acoustic cavitation can be employed to inactivate
63 viruses. Their results seem promising but acoustic cavitation in general has some serious
64 drawbacks: i) operating a piezo transducer for a prolonged period of time is extremely energy
65 consuming, ii) inability to treat larger volumes of water in a continuous mode, only batch
66 operations are possible, and iii) scale-up to industrial scale is difficult and neither well
67 understood nor yet proven.
68
69 On the other hand, there are many reports on successes in exploitation of hydrodynamic
70 cavitation, where the evaporation results from pressure decrease due to the local acceleration
71 of the flow. Hydrodynamic cavitation holds great potential for industrial designs because it
72 can be incorporated into a continuous flow process and can be easily scaled-up allowing for a
73 cost-effective cleaning system (Arrojo et al., 2008; Carpenter et al., 2016a). The use of

ACCEPTED MANUSCRIPT
4
74 hydrodynamic cavitation for water disinfection has only been examined for a limited number
75 of indicator bacteria, however its impact on viral infectivity has not yet been researched
76 (Arrojo et al., 2008; Loraine et al., 2012; Šarc et al., 2016) beyond preliminary promising
77 results with rotavirus (Dular et al., 2016) that only measured viral nucleic acid reduction and
78 not infectivity.
79
80 In our study, we investigated the effect of hydrodynamic cavitation on a widely used
81 surrogate for waterborne viruses, the MS2 bacteriophage. This F-specific RNA coliphage is
82 small, non-enveloped and spherical, which means that it is generally resistant to chemical
83 disinfectants and environmental factors such as temperature changes, desiccation, and osmotic
84 pressure. Because of its excellent durability, it is routinely used as a quantitative marker and a
85 fecal bioindicator (EPA, 2001; ISO10705-1, 1995) for the effectiveness of antiviral and
86 antiseptic agents, and the efficiency of water treatment plants and filtration devices (Jolis et
87 al., 1999; Lykins et al., 1994; Oppenheimer et al., 1997).
88
89 2. Materials and methods
90
91 Firstly, a small scale hydrodynamic cavitation reactor with a sample volume of only 3 mL
92 was built. Larger volumes of environmental water samples with high enough amounts of real
93 enteric viruses as to be measured in infectivity assays are extremely difficult to obtain, due to
94 typically low virus concentrations in the environment (Albinana-Gimenez et al., 2009).
95 Moreover, the impossibility of propagating important waterborne viruses (i.e. noroviruses) in
96 cell culture makes it difficult to prepare large, artificially inoculated water volumes.
97 Therefore, a small water sample of 3 mL enables both the detailed investigation of the
98 dynamics of cavitating flow and its effect on the virus infectivity. Finally, in order to confirm

ACCEPTED MANUSCRIPT
5
99 that the results obtained at lower scale, can be extrapolated to larger volumes, we approached
100 the issue of up scaling the reactor. For this purpose, a hydrodynamic cavitation reactor with a
101 sample volume of 1L was used (Zupanc et al., 2013).
102
103 2.1 Small scale hydrodynamic cavitation reactor
104 The 3 mL hydrodynamic cavitation reactor (3mL HCR) shown in Figure 1, consists of two 3
105 mL reservoirs (1 and 2), connected by a single-hole orifice plate with a constant diameter (h)
106 of 0.2 mm (r = 0.1 mm) along its entire length of 2 mm (3) in which cavitation is formed in a
107 similar way as in a Venturi type constriction. The sample is forced from one reservoir to the
108 other by two pistons (4 and 5). Each passing of a 3 mL sample (V) through the orifice, from
109 one reservoir to the other, takes approximately 3 seconds (t). As it passes through the
110 constriction with an upstream pressure of 5 bars, it accelerates to a velocity (v) of
111 approximately 31 m/s (Q = V/t = (3×10⁻⁶ m3)/(3 s); S = ×r2 = ×(1×10⁻⁴ m)2; v = Q/S =
112 (1×10⁻⁶ m3/s)/(3.1×10-8 m2)), which causes a drop in pressure and subsequent cavitation.
113 Hydrodynamic cavitation plays a crucial role for the reduction of viability of microorganisms
114 (Šarc et al., 2017). For the above settings the cavitation number (σ) of 1.03 was calculated
115 according to (Šarc et al., 2016). The shear rate ( ) generated was approximately 1.5×10⁵ s-1 ( ˙ 𝛾 𝛾
116 = v/h). The middle bore segment was made out of acrylic glass to observe the cavitation
117 dynamics using a high speed camera (Photron SA-Z).
118

ACCEPTED MANUSCRIPT
6
119
120 Figure 1: Scheme of 3 mL hydrodynamic cavitation reactor and the principle of operation.
121 See text for the explanation of numbered components.
122
123 The two pistons (4 and 5) are driven by a linear motor at 24 V (6) and push the fluid through
124 the bore in a synchronized fashion – as one pushes against the fluid, the other retracts creating
125 suction.
126
127 The operation of the reactor is automated; therefore, it can operate for a pre-set number of
128 sample passes. The suspension sample is injected into the reactor through a needle with a
129 syringe (7). For each sampling time point, the reactor has to be fully emptied into a fresh
130 syringe and 1.8 mL of the released suspension is mixed with 0.6 mL of 4 times concentrated
131 phage stored buffer (4 x SM) and stored at -80 °C. The 4 x SM buffer consisted of 400 mM of
132 NaCl, 32 mM of MgSO4.7H2O, 200 mM of Tris base (pH7.5; 1 M) and 0.04 % of gelatin
133 (Dawson et al., 2005; John et al., 2011). The gelatin used in SM buffer helps to stabilize the

ACCEPTED MANUSCRIPT
7
134 phage particles while storage and chloroform maintains the sterility of phage stock by
135 hindering bacterial growth without causing any harm to phage.
136
137 2.2 Scaled-up hydrodynamic cavitation reactor
138 The scaled up 1 L hydrodynamic cavitation reactor (1 L HCR) is presented in Figure 2. It was
139 first described by Zupanc et al. (Zupanc et al., 2013) for the removal of pharmaceuticals from
140 wastewater.
141
142
143 Figure 2: Scheme of 1 L hydrodynamic cavitation reactor, principle of operation and liquid
144 circulation phases. See text for explanation. (Graphics were adapted from Zupanc et al.
145 (2013)).
146
147 The functionality is very similar to that in the smaller device but instead of the pistons the
148 fluid is pushed through the constriction by compressed air. The reactor is comprised of two

ACCEPTED MANUSCRIPT
8
149 reservoirs, a symmetrical Venturi type constriction (1 mm high (h) and 5 mm wide (w)),
150 which is connecting both reservoirs (again it was made of acrylic glass so that cavitation
151 could be observed using a high speed camera), and a 3-way valve, which automatically
152 controls the flow of the pressurised air through the reservoirs.
153
154 Before operation, a one litre sample is introduced into the right reservoir (Fig. 2A) while the
155 left one remains empty. By opening the 3-way valve, the right reservoir is pressurised (up to 7
156 bar of initial pressure), which forces the sample to flow through the constriction into the left
157 reservoir (Figure 2B), where constant pressure is maintained at 1 bar. The passing of a 1 L
158 water sample (V) from one reservoir to the other takes 7.5 seconds (t). As the flow passes
159 through the constriction with an upstream pressure of 6 bars, it accelerates to a velocity of
160 approximately 27.0 m/s (Q = (1×10⁻³ m3)/(7.5 s); S = h×w = 0.001 m×0.005 m; v = (1.33×10⁻⁴
161 m3/s)/(5×10-6 m2)), causing a local drop in the static pressure, which results in cavitation
162 (Figure 2B). Cavitation intensity was estimated by cavitation number (σ) at 1.5 and shear rate
163 ( ) was calculated to be 2.7×10⁴ s-1. When the right reservoir is empty (Figure 2C), the 3-way 𝛾
164 valve redirects the pressurised air flow to the left reservoir, which forces the sample back to
165 the right reservoir, making it cavitate again. (Figure 2D).
166
167 When sampling, 10 mL of suspension was released and 9 mL of it was mixed with 3 mL of 4
168 x SM buffer and stored at -80 °C. The sampling was done carefully, avoiding collection of
169 any trapped dead volume that was not fully pushed through the cavitation device, i.e. volume
170 locked inside the sampling pipe.
171
172 2.3 MS2 virus propagation and infectivity assay
ACCEPTED MANUSCRIPT
9
173 Methods for culture, propagation and quantification of MS2 bacteriophage were in
174 accordance with the standard method of the International Organization for Standardization,
175 (ISO10705-1, 1995). The only difference was using a new host bacterial strain Escherichia
176 coli CB390 with a few media modifications introduced by Guzmán et al. (2008). The host
177 Escherichia coli CB390 and the MS2 bacteriophage ATCC 15597-B1 were kindly provided
178 to us by the authors mentioned above.
179 The host bacterial strain E. coli CB390 was cultured at 37 °C on TYGA solid media (15 g L-1
180 of Difco agar; 10 g L-1 of tryptone (Difco), 1 g L-1 of yeast extract (Difco), 8 g L-1 of NaCl,
181 100 mg L-1 of ampicillin (Sigma) and 1.93 g L-1 of MgCl2.6H20. An overnight culture was
182 prepared in a 15 mL glass tube containing 4 mL of TYGB medium (TYGA without the agar)
183 and was incubated at 37 °C and 250 rpm. Then, 160 µl of the overnight culture was inoculated
184 into fresh TYGB medium and after 2 more hours of aerobic incubation the log phase host
185 culture was ready to use.
186 The MS2 stock was prepared in three propagation cycles. For each cycle, 200 µL of filtered
187 phage suspension (0.22 µm filter, Millipore Corp.) was inoculated into 4 mL of log phase host
188 culture. After an overnight incubation (37 °C and 250 rpm), 1 mL of suspension was
189 centrifuged at 4000 x g for 20 min and the supernatant was passed through a 0.22 µm
190 Millipore filter. For the next cycle, 200 µL of filtrate was further inoculated into a fresh log
191 phase host culture. The final filtered stock contained ~11.70 log10 PFU mL-1. To prepare a
192 high titer working suspension, MS2 concentrate was diluted in tap water to a concentration of
193 ~8.70 log10 PFU mL-1. For low bacteriophage titers, the propagated suspension was firstly
194 diluted 1.10-6 times in 1 x SM buffer and finally diluted in tap water to a concentration of
195 ~2.70 log10 PFU mL-1.
196 For virus quantification, a double-layer plaque assay was used and for each technical
197 repetition 5 mL of melted ssTYGA medium (TYGA with 7 g L-1 of Difco agar) was prepared

ACCEPTED MANUSCRIPT
10
198 in a 15 mL glass tube and was placed into a water bath at 52 °C. Then 100 µL of log phase
199 host culture and 1 mL of premixed sample (or its dilution) were added into the tube. For the
200 blank sample 1 mL of 1 x SM buffer was used instead. The tube was then covered, briefly
201 shaken and the mixture was poured onto a TYGA petri plate. After an overnight incubation
202 the number of plaques was counted and their concentration was calculated by considering the
203 dilution factor and plating volume (PFU/mL). For each sample four technical repetitions were
204 prepared. All the reported values are the mean value of two independent biological treatments,
205 and the error bars represent standard deviations.
206
207 2.4 Operational controls
208 Before and after each cavitation run, both reactors were cleaned by a washing protocol, which
209 consisted of 10 passes with tap water, 100 passes with 5 % (v/v) sodium dodecyl sulphate
210 (sigma, USA), and 10 additional passes with tap water. The last step was repeated 6 times and
211 for each time fresh tap water was used. To determine the effectiveness of bacteriophage
212 removal between cavitation experiments, the tap water from the last wash was sampled and
213 analysed using the phage infectivity assay.
214 Additionally, before each cavitation run, the effect of possible virus attachment on the interior
215 steel surfaces of the cavitation reactors was tested. For this purpose, samples of the MS2
216 suspension were taken immediately before and after filling the reactors, and the MS2
217 infectivity quantification was compared between both.
218 During the whole course of operation, the reactor and sample temperatures were monitored
219 using a PT100 A type resistance thermometer with an uncertainty of ± 0.2 °C.
220
221 To exclude potential effects on the phage infectivity due to physical factors, other than
222 cavitation, that may also occur alongside the cavitation runs, we performed a series of control

ACCEPTED MANUSCRIPT
11
223 tests in both cavitation reactors. Firstly, the possible effect of pumping the sample from one
224 reservoir to another on MS2 bacteriophage infectivity was assessed. For this purpose 771 non-
225 cavitating passes were made in both HCRs. In the case of 3 mL HCR this was done by
226 reducing the voltage of the linear motor to 5 V (velocity of 11 m/s; shear rate of = 5.5×10⁴ s-𝛾
227 1, the passing of 3 mL took 8 seconds) at which cavitation did not develop. For the 1 L HCR,
228 the driving pressure was reduced to 3 bars (from 7 bars) and the Venturi constriction was
229 replaced by a pipe with a diameter of 12 mm. The flow velocity was only 2.8 m/s (the passing
230 of 1 L took 3 seconds; r = 6 mm), shear rate was = 2.3×10² s-1 and cavitation development 𝛾
231 was not observable.
232
233 Secondly, because 1 L HCR is powered by compressed air that is pressurized, the effect of
234 pressure was tested. For this, the right reservoir was separated, sealed with a valve and filled
235 with 1 L of phage suspension and was pressurized at 7 bars by compressed air for 90 min.
236
237 3. Results
238
239 3.1 Analysis of cavitation conditions in the reactors
240 Hydrodynamic cavitation in the Venturi constriction of the 3 mL HCR is presented in Figure
241 3. In the cavitation image frames, which were filmed by a high-speed camera at the rate of
242 20000 frames per second, the water flows from the left to the right side and the whole filming
243 sequence is 0.2 ms long (Figure 3; left side). For a better understanding, we have
244 schematically illustrated the cavitation dynamics in the Venturi constriction (Figure 3; right
245 side).

ACCEPTED MANUSCRIPT
12
246 Due to the small size of the bore and very high local velocities of the flow (31 m/s), the
247 images are of poor quality. Nevertheless, they sufficiently confirm the development of the
248 cavitation and its dynamics (Figure 3; left side).
249
250
251 Figure 3: Sequence of images of cavitation inside the Venturi constriction of a small scale 3
252 mL hydrodynamic cavitation reactor (left) and schematic representation of cavitation
253 dynamics (right).
254
255 The cavitation bubbles first appear as the fluid enters the bore (due to the backlight
256 illumination bubbles appear dark in the image). The vapour structure gradually grows towards
257 the end of the bore and it becomes unstable (Figure 3; frames 1 and 2). At this point, in the
258 ending phase of the cavitation the cloud tears off from the rest of the attached cavity (Figure
259 3; frame 3) and violently collapses shortly after, causing a shockwave that suppresses the

ACCEPTED MANUSCRIPT
13
260 attached cavity (Figure 3; frame 4). At this point a new cavity begins to form and the process
261 repeats itself (Figure 3; frame 5).
262
263 For the 1 L HCR, the typical cavitation structure dynamics behind the Venturi constriction is
264 presented in Figure 4. The water flows from the left to the right and the time step between
265 successive image frames is 1/6000 s long (Fig. 4; left side). The whole filmed sequence is
266 approximately 1 ms long.
267
268
269 Figure 4: Sequence of images of cavitation inside the Venturi constriction of a scaled-up 1 L
270 hydrodynamic cavitation reactor (left) and schematic representation of cavitation dynamics
271 (right).
272
273 Cavitation first appears just downstream the constriction, that is at the throat of the Venturi
274 section (Fig. 4; frame 1). It then grows up until the cavitation cloud starts to separate from the
275 attached cavity (Fig. 4; frame 5). The cloud is then carried by the flow into a region with a

ACCEPTED MANUSCRIPT
14
276 higher-pressure where it violently collapses creating a shock wave (Fig. 4; frame 8). The
277 wave suppresses the attached cavity, which almost disappears, but it recuperates shortly later.
278 The process is then periodically repeated with a frequency of approximately 1 kHz.
279
280 3.2 Influence of hydrodynamic cavitation on the infectivity of MS2 virus
281 The effect of hydrodynamic cavitation, developed in the 3 mL HCR, on the infectivity of
282 MS2 bacteriophage is presented in Figure 5. In these experiments, the sample was exposed to
283 cavitation for approximately 1 hour, during which 1040 passes were made. At high initial
284 bacteriophage titers (8.8 log10 PFU mL-1) the phage infectivity was reduced to 7.8 log10 PFU
285 mL-1 after 416 passes and to 4.6 log10 PFU mL-1 after 1040 passes through the cavitation
286 zone. According to these measurements a 4.2 logs reduction was achieved at the end of the
287 experiments. For low initial bacteriophage titers (2.7 log10 PFU mL-1) a steady decrease in
288 phage infectivity was observed until 416 passes of the sample. At this point, the phage count
289 was reduced to 0.9 log10 PFU mL-1. After 524 passes no plaques were observed (Figure 5).
290
ACCEPTED MANUSCRIPT
15
291
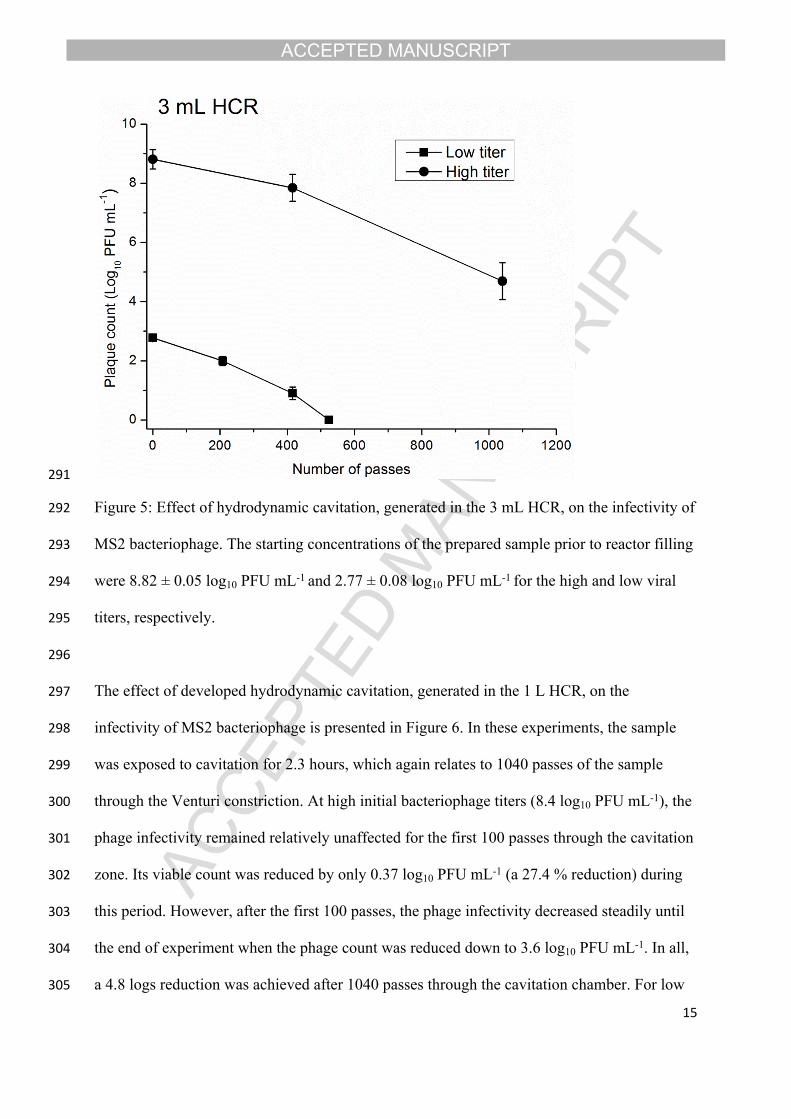
292 Figure 5: Effect of hydrodynamic cavitation, generated in the 3 mL HCR, on the infectivity of
293 MS2 bacteriophage. The starting concentrations of the prepared sample prior to reactor filling
294 were 8.82 ± 0.05 log10 PFU mL-1 and 2.77 ± 0.08 log10 PFU mL-1 for the high and low viral
295 titers, respectively.
296
297 The effect of developed hydrodynamic cavitation, generated in the 1 L HCR, on the
298 infectivity of MS2 bacteriophage is presented in Figure 6. In these experiments, the sample
299 was exposed to cavitation for 2.3 hours, which again relates to 1040 passes of the sample
300 through the Venturi constriction. At high initial bacteriophage titers (8.4 log10 PFU mL-1), the
301 phage infectivity remained relatively unaffected for the first 100 passes through the cavitation
302 zone. Its viable count was reduced by only 0.37 log10 PFU mL-1 (a 27.4 % reduction) during
303 this period. However, after the first 100 passes, the phage infectivity decreased steadily until
304 the end of experiment when the phage count was reduced down to 3.6 log10 PFU mL-1. In all,
305 a 4.8 logs reduction was achieved after 1040 passes through the cavitation chamber. For low

ACCEPTED MANUSCRIPT
16
306 initial bacteriophage titers (2.7 log10 PFU mL-1), the phage infectivity rapidly dropped and
307 after 156 passes through the cavitation zone the phage count was reduced to only 0.9 log10
308 PFU mL-1 (a 98.4 % reduction). Finally, after 208 passes no plaques were observed (Figure
309 6).
310
311
312 Figure 6: Effect of the hydrodynamic cavitation generated in the 1 L HCR on the infectivity
313 of MS2 bacteriophage. The starting concentrations of the prepared sample prior to reactor
314 filling were 8.46 ± 0.05 log10 PFU mL-1 and 2.83 ± 0.06 log10 PFU mL-1 for the high and low
315 viral titers, respectively.
316
317 3.3 Analysis of other possible influences
318 The washing protocol employed for 3 mL and 1 L HCRs successfully removed all
319 bacteriophages between different cavitation runs. Thus, no plaques were observed on any of
320 the cleaning control plates.

ACCEPTED MANUSCRIPT
17
321 Additionally, we found that plaque counts in samples that were taken immediately before and
322 after filling the 3 mL and 1 L HCRs with MS2 working suspension differed only slightly (for
323 3 mL HCR: a difference of 0.04 log10 PFU mL-1 and 0.09 log10 PFU mL-1 for low and high
324 phage titer, respectively; for 1 L HCR: a difference of 0.13 log10 PFU mL-1 and 0.03 PFU mL-
325 1 for low and high phage titer, respectively). Therefore, only a small number of MS2
326 bacteriophage particles attached to the inner surfaces of the 3 mL and 1 L HCRs.
327
328 The temperature of the sample was monitored before and after the cavitation run in the 3 mL
329 and 1 L HCRs. On average the pre- and post- treatment measured temperatures were 22.0 °C
330 and 28.5 °C, respectively. The meaning of such temperature range with regards to possible
331 effects on the virus under consideration will be explained in the discussion.
332
333 The experiments that were performed to assess the sole impact of sample pumping (771 non-
334 cavitating passes) on the MS2 high titer suspension showed that the virus infectivity was
335 reduced by only 0.07 log10 PFU mL-1 and 0.06 log10 PFU mL-1 after 38 min (for 3 mL HCR)
336 and 90 min (for 1 L HCR), respectively (Table 1).
337 Additionally, experiments performed in the 1 L HCR to assess the sole effect of 7 bars of
338 pressure on high titer phage suspension showed a reduction of only 0.05 log10 PFU mL-1 after
339 a 90 min long exposure period. This reduction lies within the experimental error of the
340 method. These results are shown in Table 1.
341
342
343
344

ACCEPTED MANUSCRIPT
18
345 Table 1: Testing the effect of sample pumping and the effect of pressure on virus infectivity.
346 All these experiments were performed in the absence of cavitation.
Plaque countSample inside the HCR
[Log10 PFU/mL]
Prepared sample
(before treatment)
Treated sample Reduction
Effect of 771 passes without cavitation
1 L-HCR
(90 min of operation)
8.64 ± 0.03 8.58 ± 0.04 8.52 ± 0.05 0.06
3 mL-HCR
(38 min of operation)
8.41 ± 0.07 8.13 ± 0.04 8.06 ± 0.03 0.07
The sole effect of 7 bars of pressure
1 L-HCR
(for 90 min)
8.62 ± 0.04 8.68 ± 0.05 8.63 ± 0.06 0.05
347
348
349 4. Discussion
350
351 Our aim was to accurately quantify the exclusive effect of hydrodynamic cavitation that is
352 generated inside a specific Venturi constriction on the inactivation of MS2 bacteriophage.
353 Therefore all other possible physical factors that occur alongside the cavitation runs and could
354 also harm the virus were carefully checked (high temperatures, high pressures, other sources
355 of cavitation and constant sample transitions and pumping).
356
357 During every cavitation run, in both HCRs, the temperature of the MS2 suspension did not
358 increase significantly and was always below 29 °C. According to Khalil et al. (2016)
ACCEPTED MANUSCRIPT
19
359 temperatures ranging below 30 °C have no significant effect on the infectivity of the MS2
360 bacteriophage even for longer time periods that stretch for up to 3 days.
361 The 3 mL HCR and 1 L HCR are designed in a way that enables to precisely quantify the
362 extent of the cavitation treatment (exact number of passes through the Venturi constriction).
363 The propellant force for both reactors was generated independently of any devices that could
364 also generate additional cavitation or shear forces (i.e., water pumps). Consequently, the
365 whole inactivation of MS2 bacteriophages can be assigned solely to the cavitating conditions
366 developed in the Venturi constriction.
367 Furthermore, we have found that pumping of the MS2 suspension, in the absence of
368 cavitation, inside the 3 mL and 1 L HCRs, did not have a significant impact on virus
369 infectivity. Similar observations were made for the impact of 7 bars of pressure inside the
370 isolated and pressurized reservoir of the 1 L HCR. Both control tests showed that there are no
371 auxiliary causes that contribute to the measured log reductions and that those can indeed be
372 attributed uniquely to the effect of hydrodynamic cavitation.
373
374 The 3 mL HCR proved to be an efficient generator of hydrodynamic cavitation. Our high-
375 speed photographic evidence was pivotal in validating its capability of developing a typical
376 hydrodynamic cavitation structure. Moreover its structure developed in a similar way to the
377 one that was present inside the 1 L HCR. Furthermore, during cavitation inside the 3 mL
378 HCR, the infectivity of high titer MS2 suspension was reduced by 4.2 logs. In less than an
379 hour of treatment the reduction was significant and met the US environmental protection
380 agency's standard (EPA) for virus removal for water purifiers, in which it is stipulated that
381 methods ensuring 4 logs reduction (≥ 99.99 %) of pathogenic viruses should be used for water
382 treatment (EPA, 2006). Therefore the 3 mL HCR reactor proved to be a suitable tool to study
ACCEPTED MANUSCRIPT
20
383 the effect of hydrodynamic cavitation on real enteric viruses found in wastewaters, which are
384 highly diluted and are difficult to obtain in large volumes. Furthermore, this proves that
385 hydrodynamic cavitation can be effective even in comparison to UV disinfection were 4 log
386 reduction is achieved for 6 log10 PFU mL-1 of initial MS2 titer after only 30 min of treatment
387 (Sun et al., 2016). Nonetheless, we have to realise that for a reduction of this magnitude,
388 perfect conditions need to be assured for UV treatments (only 10 mL of clear MS2 suspension
389 in an open Petri plate and an optical path length of only 44 mm).
390
391
392 The mechanisms of hydrodynamic cavitation that result in virus infectivity inactivation are
393 unknown. Hydrodynamic cavitation could cause structural damage to the viral coat, capsid
394 protein, virus genome (nucleic acid) or to the host recognition receptors that are present on the
395 viral capsid. Even a slight damage to the recognition receptors could result in the loss of
396 infectivity of the virus (Scherba et al., 1991). Cavitation acts as a biocide through chemical
397 (generation of OH- radicals; (Riesz and Kondo, 1992)) and through physical mechanisms
398 (shock waves, pressure gradients, shear forces, extreme local temperatures of 5000 K; (von
399 Eiff et al., 2000)). The generated OH- could lead to a phenomenon called the advanced
400 oxidation processes (AOP), which in turn could destroy organic molecules on the surface of
401 viruses, such as recognition receptors (Albanese et al., 2015; Carpenter et al., 2016b;
402 Klavarioti et al., 2009). Moreover, the elevated local temperatures could resolve in pyrolysis
403 and decomposition of organic material and finally, pressure pulsations and high shear forces
404 could break surface molecules. Finally, the very high shear rates generated inside the 3 mL
405 HCR ( = 1.5×10⁵ s-1) and inside the 1L HCR ( = 2.7×10⁴ s-1) could also add to the viral 𝛾 𝛾
406 destruction.
407
ACCEPTED MANUSCRIPT
21
408 In comparison to the cavitation runs performed in the 3 mL HCR, phage infectivity of high
409 titer suspension was reduced noticeably faster in the 1 L HCR, in which a 4.8 logs reduction
410 was achieved in the end. Our previous experience with bacteria (Šarc et al., 2016) and
411 pharmaceuticals (Zupanc et al., 2014, 2013) have shown that scaled-up reactors are more
412 effective in comparison to small scale installations. The reason for this lies in the fact that the
413 hydrodynamic cavitation aggressiveness increases as the size of the reactor increases. With an
414 increase in the size of the constriction/bore the maximum cavity radius increases (the radius
415 that results just before the collapsing of a cloud) resulting in a higher-pressure pulse. This
416 alteration in the cavity behaviour is due to an increased scale of turbulence (Moholkar and
417 Pandit, 1997). Therefore, the higher effectivity of the 1 L HCR in comparison to 3 mL HCR is
418 due to the differences in the turbulence characteristics that changes the cavity dynamics.
419 Moreover, although the flow velocities for the 3 mL HCR (31 m/s) and 1L HCR (27.0 m/s)
420 were similar, they did not reflect in similar shear rates ( = 1.5×10⁵ s-1 for the 3 mL HCR and 𝛾
421 = 2.7×10⁴ s-1 for the 1 L HCR). Since the shear rate is higher in the 3 mL HCR and the 𝛾
422 efficiency is better in the 1L HCR the mechanism of the virus inactivation cannot be
423 attributed to the shear flow by itself – cavitation plays a decisive role in the process. The
424 impact of geometry on the effectiveness of cavitation reactors was observed by Rajoriya et al.
425 (2017) and Badve et al. (2015) and this factor could add to a better effectivity of the 1L HCR.
426
427 Furthermore, our results show that both in the 3ml HCR and 1L HCR, when low titers were
428 cavitated, the infectivity reduction was faster than for high MS2 titers, reaching 50 % after
429 only 95 (4.8 min of operation) and 52 cavitation passes (6.5 min of operation) for the 3ml
430 HCR and 1L HCR, respectively. No plaque count was reached after 524 passes (26.2 min) in
431 the 3ml HCR and after 208 passes (26.0 min) in the 1L HCR. Such efficiency for low viral
ACCEPTED MANUSCRIPT
22
432 titers makes hydrodynamic cavitation an efficient tool for wastewaters disinfection, because
433 viruses in these waters are usually highly diluted. For example MS2 concentrations obtained
434 from real-world wastewaters (1 - 4 log10 PFU mL-1) and sewage impacted wetlands (~1.5
435 log10 PFU mL-1) were found to be relatively low (Keegan, 2010; Li et al., 2012). Moreover,
436 hydrodynamic cavitation is known to be more efficient for treating lower concentrations of E.
437 coli (Arrojo et al., 2008; Loraine et al., 2012) and ultrasonic cavitation is more effective when
438 lower concentrations of MS2 phage (Su et al., 2010) and human myelomonocytic lymphoma
439 cells (Feril et al., 2003) are used. Because cavitation is a stochastic phenomenon, the chaotic
440 environment behind the constriction should prove to be more hostile for higher concentrations
441 of microorganisms. Therefore it is difficult to explain our observations and the observations
442 of studies that are mentioned above (Arrojo et al., 2008; Loraine et al., 2012) because they
443 prove to be the exact opposite of expected. Nevertheless a possible explanation was proposed
444 by Majumdar et al. (Majumdar et al., 1998) who speculates that slightly increased viscosity of
445 solutions with high microbial particle densities inhibits cavitation.
446 5. Conclusions
447 The paper is a first confirmation that hydrodynamic cavitation can indeed inactivate
448 waterborne viruses to levels defined in water safety directives. This could be due to OH-
449 radicals that form an AOP during the cavitation process and due to high shear forces inside
450 the cavitation structure. In addition we have also shown that the HCR scaling was extremely
451 efficient. The number of sample passes that were needed to achieve the above reductions
452 could possibly be even lower if the hydrodynamic cavitation treatment is applied in
453 combination with other disinfection procedures that do not hamper the chemical purity of
454 water (UV, ozone treatment) reaching a synergistic deactivation effect (Gogate and Patil,
455 2015).

ACCEPTED MANUSCRIPT
23
456 The 3ml HCR developed in this study will enable measuring the effect of cavitation for other
457 waterborne viruses that, unlike MS2, are difficult to propagate in high amounts. This includes
458 human viruses like Norovirus, Hepatitis A virus, and plant viruses which can cause problems
459 in hydroponic systems such as Pepino mosaic virus and Cucumber green mild mottle virus.
460 These viruses can now be treated in the 3 mL HCR as its sample volume is small and we have
461 proven that it generates similar cavitation forces as the 1 L HCR. More experiments with
462 additional viruses will, of course, be needed to further confirm hydrodynamic cavitation as an
463 efficient tool for deactivation of viruses present in water samples.
464
465
466
467
468
469
470
471
472
473 References
474 Albanese, L., Ciriminna, R., Meneguzzo, F., Pagliaro, M., 2016. Beer-brewing powered by
475 controlled hydrodynamic cavitation: Theory and real-scale experiments.
476 doi:10.1016/j.jclepro.2016.11.162
477 Albanese, L., Ciriminna, R., Meneguzzo, F., Pagliaro, M., 2015. Energy efficient inactivation
478 of Saccharomyces cerevisiae via controlled hydrodynamic cavitation. Energy Sci. Eng.
479 3, 221–238. doi:10.1002/ese3.62
480 Albinana-Gimenez, N., Clemente-Casares, P., Calgua, B., Huguet, J.M., Courtois, S.,

ACCEPTED MANUSCRIPT
24
481 Girones, R., 2009. Comparison of methods for concentrating human adenoviruses,
482 polyomavirus JC and noroviruses in source waters and drinking water using quantitative
483 PCR. J. Virol. Methods 158, 104–109. doi:10.1016/j.jviromet.2009.02.004
484 Arrojo, S., Benito, Y., Martínez Tarifa, A., 2008. A parametrical study of disinfection with
485 hydrodynamic cavitation. Ultrason. Sonochem. 15, 903–908.
486 doi:10.1016/j.ultsonch.2007.11.001
487 Badve, M.P., Bhagat, M.N., Pandit, A.B., 2015. Microbial disinfection of seawater using
488 hydrodynamic cavitation. Sep. Purif. Technol. 151, 31–38.
489 doi:10.1016/j.seppur.2015.07.020
490 Carpenter, J., Badve, M., Rajoriya, S., George, S., Saharan, V.K., Pandit, A.B., Gao, N.,
491 Parande, M., Ashokkumar, M., Pandit, A., 2016a. Hydrodynamic cavitation: an
492 emerging technology for the intensification of various chemical and physical processes
493 in a chemical process industry. Rev. Chem. Eng. 0, 1. doi:10.1515/revce-2016-0032
494 Carpenter, J., Badve, M., Rajoriya, S., George, S., Saharan, V.K., Pandit, A.B., Gao, N.,
495 Parande, M., Ashokkumar, M., Pandit, A., 2016b. Hydrodynamic cavitation: an
496 emerging technology for the intensification of various chemical and physical processes
497 in a chemical process industry. Rev. Chem. Eng. 0, 1. doi:10.1515/revce-2016-0032
498 Ciriminna, R., Albanese, L., Meneguzzo, F., Pagliaro, M., 2016. Hydrogen Peroxide: A Key
499 Chemical for Today’s Sustainable Development. ChemSusChem 9, 3374–3381.
500 doi:10.1002/cssc.201600895
501 Dawson, D.J., Paish, A., Staffell, L.M., Seymour, I.J., Appleton, H., 2005. Survival of viruses
502 on fresh produce, using MS2 as a surrogate for norovirus. J. Appl. Microbiol. 98, 203–
503 209. doi:10.1111/j.1365-2672.2004.02439.x
504 Dular, M., Griessler-Bulc, T., Gutierrez-Aguirre, I., Heath, E., Kosjek, T., Krivograd
505 Klemenčič, A., Oder, M., Petkovšek, M., Rački, N., Ravnikar, M., Šarc, A., Širok, B.,

ACCEPTED MANUSCRIPT
25
506 Zupanc, M., Žitnik, M., Kompare, B., 2016. Use of hydrodynamic cavitation in
507 (waste)water treatment. Ultrason. Sonochem. 29, 577–588.
508 doi:10.1016/j.ultsonch.2015.10.010
509 EPA, 2006. EPA Final Ground Water Rule of October 11th 2006. United States Environ.
510 Prot. Agency.
511 EPA, 2001. Method 1602: Male-specific (F+) and somatic coliphage in water by single agar
512 layer (SAL) procedure, in: Office of Water, EPA 821-R-01-029. Washington, D.C.
513 Feril, L.B., Kondo, T., Ogawa, R., Zhao, Q.-L., 2003. Dose-dependent inhibition of
514 ultrasound-induced cell killing and free radical production by carbon dioxide. Ultrason.
515 Sonochem. 10, 81–4.
516 Gogate, P.R., 2008. Cavitational reactors for process intensification of chemical processing
517 applications: A critical review. Chem. Eng. Process. Process Intensif. 47, 515–527.
518 doi:10.1016/j.cep.2007.09.014
519 Gogate, P.R., Pandit, A.B., 2004. A review of imperative technologies for wastewater
520 treatment I: oxidation technologies at ambient conditions. Adv. Environ. Res. 8, 501–
521 551. doi:10.1016/S1093-0191(03)00032-7
522 Gogate, P.R., Patil, P.N., 2015. Combined treatment technology based on synergism between
523 hydrodynamic cavitation and advanced oxidation processes. Ultrason. Sonochem. 25,
524 60–69. doi:10.1016/j.ultsonch.2014.08.016
525 Guzmán, C., Moce-Llivina, L., Lucena, F., Jofre, J., 2008. Evaluation of Escherichia coli Host
526 Strain CB390 for Simultaneous Detection of Somatic and F-Specific Coliphages. Appl.
527 Environ. Microbiol. 74, 531–534. doi:10.1128/AEM.01710-07
528 Haas, C.N., Rose, J.B., Gerba, C., Regli, S., 1993. Risk Assessment of Virus in Drinking
529 Water. Risk Anal. 13, 545–552. doi:10.1111/j.1539-6924.1993.tb00013.x
530 ISO10705-1, 1995. International Organization for Standardization. Water quality: detection

ACCEPTED MANUSCRIPT
26
531 and enumeration of F-specific RNA bacteriophages. Geneva.
532 John, S.G., Mendez, C.B., Deng, L., Poulos, B., Kauffman, A.K.M., Kern, S., Brum, J., Polz,
533 M.F., Boyle, E.A., Sullivan, M.B., 2011. A simple and efficient method for
534 concentration of ocean viruses by chemical flocculation. Environ. Microbiol. Rep. 3,
535 195–202. doi:10.1111/j.1758-2229.2010.00208.x
536 Jolis, D., Hirano, R., Pitt, P., 1999. Tertiary Treatment Using Microfiltration and UV
537 Disinfection for Water Reclamation. Water Environ. Res. 71, 224–231.
538 doi:10.2175/106143098X121789
539 Keegan, A., 2010. Pathogen Risk Indicators for Wastewater and Biosolids. Water Intell.
540 Online 9. doi:10.2166/9781843393597
541 Khalil, I., Irorere, V., Radecka, I., Burns, A., Kowalczuk, M., Mason, J., Khechara, M., 2016.
542 Poly-γ-Glutamic Acid: Biodegradable Polymer for Potential Protection of Beneficial
543 Viruses. Materials (Basel). 9, 28. doi:10.3390/ma9010028
544 Klavarioti, M., Mantzavinos, D., Kassinos, D., 2009. Removal of residual pharmaceuticals
545 from aqueous systems by advanced oxidation processes. Environ. Int. 35, 402–417.
546 doi:10.1016/j.envint.2008.07.009
547 Li, Y.L., Deletic, A., Alcazar, L., Bratieres, K., Fletcher, T.D., McCarthy, D.T., 2012.
548 Removal of Clostridium perfringens, Escherichia coli and F-RNA coliphages by
549 stormwater biofilters. Ecol. Eng. 49, 137–145. doi:10.1016/j.ecoleng.2012.08.007
550 Loraine, G., Chahine, G., Hsiao, C.-T., Choi, J.-K., Aley, P., 2012. Disinfection of gram-
551 negative and gram-positive bacteria using DynaJets® hydrodynamic cavitating jets.
552 Ultrason. Sonochem. 19, 710–717. doi:10.1016/j.ultsonch.2011.10.011
553 Lykins, B.W., Koffskey, W.E., Patterson, K.S., 1994. Alternative Disinfectants for Drinking
554 Water Treatment. J. Environ. Eng. 120, 745–758. doi:10.1061/(ASCE)0733-
555 9372(1994)120:4(745)

ACCEPTED MANUSCRIPT
27
556 Majumdar, S., Kumar, P.S., Pandit, A.B., 1998. Effect of liquid-phase properties on
557 ultrasound intensity and cavitational activity. Ultrason. Sonochem. 5, 113–118.
558 doi:10.1016/S1350-4177(98)00019-4
559 Miller, R.S., 2012. A Review of Common Disinfection Techniques and What ASHRAE
560 Proposed 188P Means to You. American Society of Sanitary Engineering, Westlake, pp.
561 12–15.
562 Moholkar, V.S., Pandit, A.B., 1997. Bubble behavior in hydrodynamic cavitation: Effect of
563 turbulence. AIChE J. 43, 1641–1648. doi:10.1002/aic.690430628
564 Oliver, B.G., Cosgrove, E.G., 1975. The disinfection of sewage treatment plant effluents
565 using ultraviolet light. Can. J. Chem. Eng. 53, 170–174. doi:10.1002/cjce.5450530203
566 Oppenheimer, J.A., Jacangelo, J.G., Laîné, J.-M., Hoagland, J.E., 1997. Testing the
567 equivalency of ultraviolet light and chlorine for disinfection of wastewater to
568 reclamation standards. Water Environ. Res. 69, 14–24. doi:10.2175/106143097X125137
569 Rajoriya, S., Bargole, S., Saharan, V.K., 2017. Degradation of reactive blue 13 using
570 hydrodynamic cavitation: Effect of geometrical parameters and different oxidizing
571 additives. Ultrason. Sonochem. 37, 192–202. doi:10.1016/j.ultsonch.2017.01.005
572 Riesz, P., Kondo, T., 1992. Free radical formation induced by ultrasound and its biological
573 implications. Free Radic. Biol. Med. 13, 247–70.
574 Šarc, A., Oder, M., Dular, M., 2016. Can rapid pressure decrease induced by supercavitation
575 efficiently eradicate Legionella pneumophila bacteria?
576 http://dx.doi.org/10.1080/19443994.2014.979240 57, 2184–2194.
577 Šarc, A., Stepišnik-Perdih, T., Petkovšek, M., Dular, M., 2017. The issue of cavitation
578 number value in studies of water treatment by hydrodynamic cavitation. Ultrason.
579 Sonochem. 34, 51–59. doi:10.1016/j.ultsonch.2016.05.020
580 Scherba, G., Weigel, R.M., O’Brien, W.D., Jr, 1991. Quantitative assessment of the

ACCEPTED MANUSCRIPT
28
581 germicidal efficacy of ultrasonic energy. Appl. Environ. Microbiol. 57, 2079–84.
582 Shamsborhan, H., Coutier-Delgosha, O., Caignaert, G., Abdel Nour, F., 2010. Experimental
583 determination of the speed of sound in cavitating flows. Exp. Fluids 49, 1359–1373.
584 doi:10.1007/s00348-010-0880-6
585 Simpson, K.L., Hayes, K.P., 1998. Drinking water disinfection by-products: an Australian
586 perspective. Water Res. 32, 1522–1528. doi:10.1016/S0043-1354(97)00341-2
587 Su, X., Zivanovic, S., D’Souza, D.H., 2010. Inactivation of Human Enteric Virus Surrogates
588 by High-Intensity Ultrasound. Foodborne Pathog. Dis. 7, 1055–1061.
589 doi:10.1089/fpd.2009.0515
590 Sun, P., Tyree, C., Huang, C.-H., 2016. Inactivation of Escherichia coli , Bacteriophage MS2,
591 and Bacillus Spores under UV/H 2 O 2 and UV/Peroxydisulfate Advanced Disinfection
592 Conditions. Environ. Sci. Technol. 50, 4448–4458. doi:10.1021/acs.est.5b06097
593 von Eiff, C., Overbeck, J., Haupt, G., Herrmann, M., Winckler, S., Richter, K.D., Peters, G.,
594 Spiegel, H.U., 2000. Bactericidal effect of extracorporeal shock waves on
595 Staphylococcus aureus. J. Med. Microbiol. 49, 709–12. doi:10.1099/0022-1317-49-8-709
596 Zupanc, M., Kosjek, T., Petkovšek, M., Dular, M., Kompare, B., Širok, B., Blažeka, Ž.,
597 Heath, E., 2013. Removal of pharmaceuticals from wastewater by biological processes,
598 hydrodynamic cavitation and UV treatment. Ultrason. Sonochem. 20, 1104–1112.
599 doi:10.1016/j.ultsonch.2012.12.003
600 Zupanc, M., Kosjek, T., Petkovšek, M., Dular, M., Kompare, B., Širok, B., Stražar, M.,
601 Heath, E., 2014. Shear-induced hydrodynamic cavitation as a tool for pharmaceutical
602 micropollutants removal from urban wastewater. Ultrason. Sonochem. 21, 1213–1221.
603 doi:10.1016/j.ultsonch.2013.10.025
604

ACCEPTED MANUSCRIPT
ACCEPTED MANUSCRIPT
Highlights
The first proof that hydrodynamic cavitation inactivates viruses
More than 4 log reduction of viral infectivity is achieved
The methodology can be scaled up and exploited for continuous water treatment