efficient group limited registration number: … accounting policies and other explanatory notes, in...
TRANSCRIPT

EFFICIENT GROUP LIMITED
Registration number: 2006/036947/06
Group and Company Annual Financial Statements
for the year ended 31 August 2017
Published on 13 November 2017
The annual financial statements were prepared by:
Yazeed Patel CA(SA)
Group Financial Manager
The financial statements have been audited in compliance with the applicable requirements of section 30 of the Companies Act of South Africa

EFFICIENT GROUP LIMITEDGroup and Company Annual Financial Statements
Contents Page
Directors' responsibility and approval 2
Audit and risk committee report 3 to 5
Statement of compliance by the company secretary 6
Directors' report 7 to 11
Independent auditor's report 12 to 16
Statements of financial position 17
Statements of comprehensive income 18
Statements of changes in equity 19 to 20
Statements of cash flows 21
Significant accounting policies 22 to 34
Notes to the financial statements 35 to 76
Analysis of shareholders 77
The reports and statements set out below comprise the annual financial statements of Efficient Group Ltd (the Company) andof the Company its subsidiaries (the Group), presented to the shareholders of the Company:
The following supplementary information does not form part of the financial statements and is unaudited:
1
EFF"ICIENT GROUP LIMITED Group and Company Annual Financial Statements
Directors' responsiblllty and approval for the year ended 31 August 20l7
The directors are responsible for the preparation and fair pre51mtat10n of the Group and Company annual financial statements of Efficient Group Ltd, comprisinQ the statements of financial position at 31 August 2017, the statements of comprehensive income, chanoes In equity end cash flows for the year then ended, and the notes to the fln11.ncl11.I statements which Include slgnlflcant accounting policies and other explanatory notes, In accordance with International Financial Reporting Standards (IFRS) and the requirements of the Companie& Act of South Africa. In addition, the directors ere responsible for preparing the directors' report.
The directors are also responsible for such Internal control as they determine necessary to enable the preparation of financial statements that are free from material misstatement, whether due to fraud or error, and for malntalnln,;i adequate accounting records and an effective system of risk management as well as the preparation of the supplementary schedule Included In these financial statements.
The directors have made an assessment of the ability of the Group and Company to continue as going concerns and' have no reason to belleve that the bus inesses wDI not be golno concerns In the year ahead.
The auditor ls responsible for reporting on whether the Group and Company flnanclal statements are falr1y presented in accordance with the applicable flnimcial reporting framework.
Approval of the Group and Company annual financial :.tetements
The Group and Company annual flnanclal statements of Efficient Group Ltd, as Identified In the first pareoraph, were approved by the board of directors on 9 November 2017 and are signed by:
/40 t� Dr sr BooyH� Mr H Weldhue Authorised di r Authorised director Chairman oft Board Chief Executive Officer 9 November 7 9 November 20!7
2


EFFICIENT GROUP LIMITEDGroup and Company Annual Financial Statements
Directors' report
1
2
Number of shares'000
Cents per share R'000
Authorised:
361 350 0,000277 1,0000
Issued:
90 593 0,000277 0,2507
Operating results
The financial statements presented on pages 17 to 76 set out fully the financial position, results of operations and cash flows of the Group andCompany for the year ended 31 August 2017. At the reporting date, the Group's and Company's current liabilities exceed its current assets.Management assessed the Group and Company's cash flow forecasts and its access to secured credit, which includes the realisation of netdeferred tax assets of R10.97 million (2016: R10.34 million) for the Group and R778 115 (2016: R1.43 million) for the Company during the next 12months. Based on the cash flow forecast and the timing of cash inflows and outflows, management is of the opinion that the Group will be ableto settle its short-term commitments as and when they become due. As the ultimate holding company of the Group, the Company will also beable to settle its short-term commitments as and when they become due.
The Group's profit for the year amounted to R46.89 million (2016: R37.52 million) and the Company's profit for the year amounted to R82.67million (2016: loss for the year of R3.90 million).
Acquisitions
During the current year, the Group acquired four (2016: 15) financial advisory client bases from various independent financial advisors for a totalpurchase price of R3.86 million (2016: R6.40 million) through Efficient Financial Services (Pty) Ltd which will be settled in cash on varying datesbased on the respective agreements, including the business of Vital Consult National Holdings (Pty) Ltd as a going concern on 1 March 2017.Stead Wealth Management (Pty) Ltd also acquired one financial advisory client base during the year. These acquisitions were accounted for asbusiness combinations.
The Group acquired the entire issued share capital of Vital Consult Wealth Management (Pty) Ltd for a consideration of R1 million. Interests werealso acquired in the businesses of W-Allen White Brokers (Pty) Ltd and Secure Capital Investments (Pty) Ltd for considerations of R3.77 millionand R7.81 million respectively. The consideration for Secure Capital Investments (Pty) Ltd includes a non-controlling interest portion of R1.75million.
for the year ended 31 August 2017
The directors submit their report for the year ended 31 August 2017.
Efficient Group Ltd (the Company), (registration number 2006/036947/06) is a public company incorporated in the Republic of South Africa.The Company's registered address is 81 Dely Road, Hazelwood, Pretoria, 0081.
Review of activities
Main business and operations
The Company is the holding company of the Efficient Group subsidiaries. The Company's subsidiaries' main activities are that of assetmanagement, asset administration, asset consultation and offering of financial services.
The Private Clients business within Efficient Select (Pty) Ltd was merged with that of Uhuru Asset Management (Pty) Ltd, to form a company,Efficient Private Clients (Pty) Ltd, in which the Group acquired a 50.1% interest. The purchase consideration was R6.61 million, of which R4.76million related to non-controlling interests.
In addition to the above, the Group acquired Efficient Independent Distribution Services (Pty) Ltd, a dormant company with no identifiableassets and liabilities, at a purchase consideration of Rnil.
Share capital
During the current year, the number of shares authorised and in issue remained unchanged.
At 31 August 2017
At 31 August 2017
7

EFFICIENT GROUP LIMITEDGroup and Company Annual Financial Statements
Directors' reportfor the year ended 31 August 2017
3
+
+
+
4
5
6
Executive
H Weidhase
AT de Klerk
DD Roodt
RH Walton
Non-executive
SF Booysen (1) Chairman
LC Cele (1)
L Taylor (1)
JA Mabena
J Rosen (1)
AP du Preez
MM du Preez (alternate to Mr AP du Preez)
SDL Rushton (alternate to JA Mabena)
OJ Goosen (2)
I Groenewald (Alternate to OJ Goosen)
B Ngonyama (1)
Borrowing limitations
In terms of the Memorandum of Incorporation of the Company, the directors may exercise all the powers of the Company to borrow money, asthey consider appropriate. The following borrowings were entered into by the Group during the current year:
During March 2017 Efficient Capital (Pty) Ltd entered into an amortising term loan agreement with Standard Bank of South Africa Ltd amountingto R9.60 million to finance the acquisition of the Group's Dely property.The Company continued to utilise the facility available with Standard Bank of South Africa Ltd to fund the construction of the Dely offices. Draw-downs of R9.90 million were made during the year on this facility.
During the current year, the Group secured a bank overdraft facility of R10 million with Standard Bank of South Africa Ltd.
Distribution to shareholders
Chief Executive Officer 2006-11-27 -
Chief Financial Officer 2008-03-27 -
Dividends of 5.47 cent per share and 1.63 cent per share were declared and paid in December 2016 (2015: 6.15 cent per share) and May 2017(2016: 1.58 per share) respectively, by the Company to its shareholders.
Share-incentive scheme
In terms of the share-incentive scheme, the share-based payment expense for the current year recognised in profit or loss was R461 644 (2016:R1.32 million) for the Group and R29 045 (2016: R688 000) for the Company.
Directors
The directors of the Company during the year and at the date of this report are as follows:
Date appointed Date resigned
2010-08-30 -
2011-03-15 23/08/2017
2012-08-30 -
2006-11-27 -
2013-08-12 -
2009-09-01 -
2017-05-08 -
2017-05-08 -
2017-08-23 -
2013-04-10 -
2013-08-04 2017-08-23
2013-08-04 2017-05-08
2017-08-23 -
The non-executive directors' contracts do not provide for a fixed-term employment period.
(1) These non-executive directors are independent.
(2) OJ Goosen was initially appointed as an alternate director to AP du Preez on 8 May 2017. However, upon the resignation of AP du Preez as a non-executivedirector on 23 August 2017, OJ Goosen was appointed to the board as a non-executive director.
8
EFFICIENT GROUP LIMITEDGroup and Company Annual Financial Statements
Directors' reportfor the year ended 31 August 2017
7
Direct'000
Indirect'000
Total'000 %
Direct'000
Indirect'000
Total'000 %
Ordinary shares
Executive
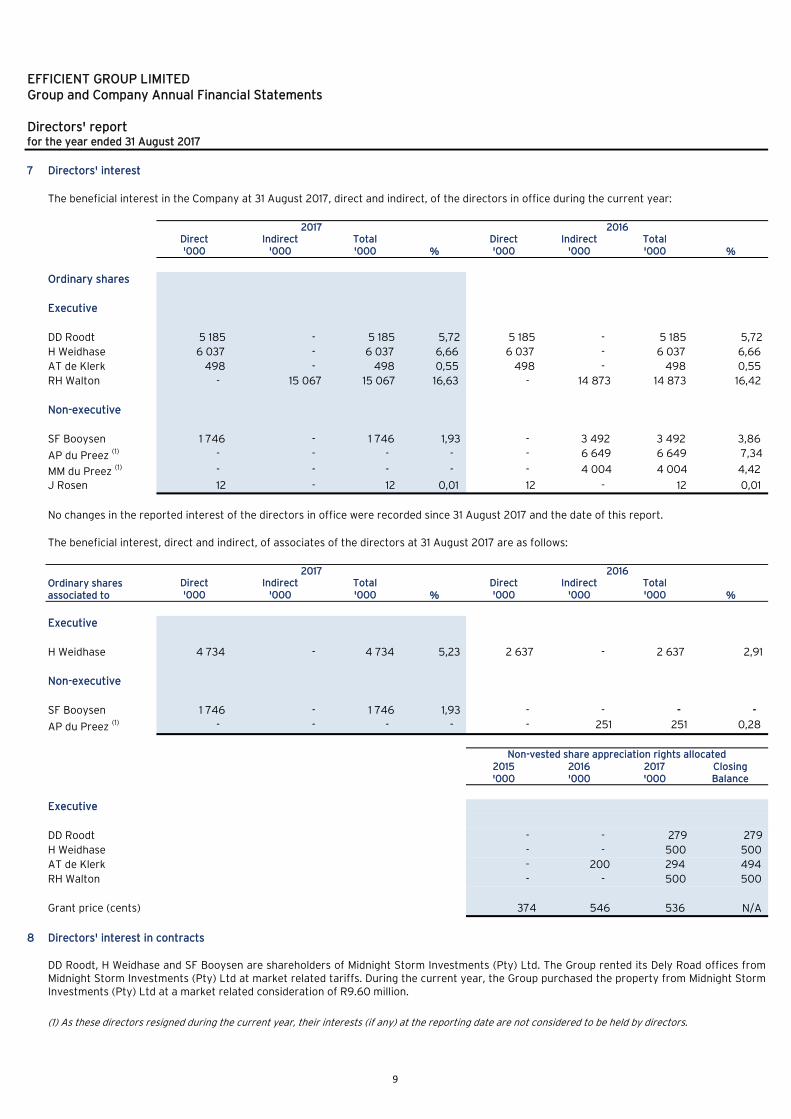
DD Roodt 5 185 - 5 185 5,72 5 185 - 5 185 5,72
H Weidhase 6 037 - 6 037 6,66 6 037 - 6 037 6,66
AT de Klerk 498 - 498 0,55 498 - 498 0,55
RH Walton - 15 067 15 067 16,63 - 14 873 14 873 16,42
Non-executive
SF Booysen 1 746 - 1 746 1,93 - 3 492 3 492 3,86
AP du Preez (1) - - - - - 6 649 6 649 7,34
MM du Preez (1) - - - - - 4 004 4 004 4,42
J Rosen 12 - 12 0,01 12 - 12 0,01
Ordinary shares associated to
Direct'000
Indirect'000
Total'000 %
Direct'000
Indirect'000
Total'000 %
Executive
H Weidhase 4 734 - 4 734 5,23 2 637 - 2 637 2,91
Non-executive
SF Booysen 1 746 - 1 746 1,93 - - - -
AP du Preez (1) - - - - - 251 251 0,28
2015'000
2016'000
2017'000
ClosingBalance
Executive
DD Roodt - - 279 279
H Weidhase - - 500 500
AT de Klerk - 200 294 494
RH Walton - - 500 500
Grant price (cents) 374 546 536 N/A
8
(1) As these directors resigned during the current year, their interests (if any) at the reporting date are not considered to be held by directors.
The beneficial interest in the Company at 31 August 2017, direct and indirect, of the directors in office during the current year:
2017 2016
No changes in the reported interest of the directors in office were recorded since 31 August 2017 and the date of this report.
The beneficial interest, direct and indirect, of associates of the directors at 31 August 2017 are as follows:
2017 2016
Directors' interest
Non-vested share appreciation rights allocated
Directors' interest in contracts
DD Roodt, H Weidhase and SF Booysen are shareholders of Midnight Storm Investments (Pty) Ltd. The Group rented its Dely Road offices fromMidnight Storm Investments (Pty) Ltd at market related tariffs. During the current year, the Group purchased the property from Midnight StormInvestments (Pty) Ltd at a market related consideration of R9.60 million.
9

EFFICIENT GROUP LIMITEDGroup and Company Annual Financial Statements
Directors' reportfor the year ended 31 August 2017
9
81 Dely Road
Hazelwood
Pretoria
0081
10
Ultimate share-
holding (1)
100%100%100%100%100%100%100%100%100%100%
70,48%70,48%70,48%70,48%70,48%70,48%
100%50,10%
50,01%100%100%100%51%51%
100%-
(1) The ultimate shareholding above indicates the shareholding held by the Group at the highest sub-group level.
Subsidiaries within the Group
Entity Held through (2)
Efficient Financial Services (Pty) Ltd Direct shareholdingEfficient Wealth (Pty) Ltd Direct shareholding
Company secretary and professional advice
All directors have unlimited access to the services of the company secretary, who in turn has access to the appropriate resources in theprovision of this support. All directors are also entitled to seek independent professional advice with regards to the affairs of the Company. Thecompany secretary is Mr J Nyahuye was appointed on 1 December 2015.
Business and postal address:
Boutique Collective Investments (RF) (Pty) Ltd Direct shareholdingBoutique Investment Partners (Pty) Ltd Direct shareholdingInstit (Pty) Ltd Direct shareholding
Twist Street Securities (Pty) Ltd Indirect shareholding - Efficient Wealth (Pty) LtdEfficient Infund Consult (Pty) Ltd Indirect shareholding - Efficient Wealth (Pty) LtdEfficient Select (Pty) Ltd Direct shareholding
Stead Wealth Management (Pty) Ltd Indirect shareholding - Select Manager (Pty) LtdExceed Asset Management (Pty) Ltd Indirect shareholding - Select Manager (Pty) LtdExceed Private Clients (Pty) Ltd Indirect shareholding - Select Manager (Pty) Ltd
Naviga Solutions (Pty) Ltd Direct shareholdingTwist Street Collective Investments (Pty) Ltd Indirect shareholding - Naviga Solutions (Pty) LtdSelect Manager (Pty) Ltd Direct shareholding
Efficient Private Clients (Pty) Ltd Direct shareholding (combined shareholding with EfficientSelect (Pty) Ltd)
Efficient Board of Executors (Pty) Ltd Direct shareholdingVital Consult Wealth Management (Pty) Ltd Direct shareholding
W-Allen White Brokers (Pty) Ltd Indirect shareholding - Select Manager (Pty) Ltd
Secure Capital Investments (Pty) Ltd (3) Indirect shareholding - Select Manager (Pty) Ltd
Efficient Independent Distribution Services (Pty) Ltd Direct shareholding
Efficient Select Swaziland (Pty) Ltd (4) Indirect shareholding - Efficient Group Swaziland (Pty) Ltd
Midnight Masquerade Investments (Pty) Ltd Direct shareholdingEfficient Group Share Trust Direct control
Efficient Capital (Pty) Ltd Direct shareholdingEfficient Group Central Services (Pty) Ltd Indirect shareholding - Efficient Capital (Pty) LtdEfficient Group Swaziland (Pty) Ltd Direct shareholding
(2) Direct shareholding/control implies that the subsidiary is owned or controlled by the Company.
(3) Select Manager (Pty) Ltd has a 51% interest in this entity.
(4) Efficient Group Swaziland (Pty) Ltd has a 51% interest in this entity.
10

EFFICIENT GROUP LIMITEDGroup and Company Annual Financial Statements
Directors' reportfor the year ended 31 August 2017
11
12
+
+
+
On 25 January 2017, the Company held its annual general meeting and it was resolved that:
non-executive directors of the Company are paid fees for the services rendered as directors of the Company and the amounts paid and payablewere approved;
the directors are authorised to approve that the Company provides any direct or indirect financial assistance to any company or corporationthat is related or interrelated, under certain conditions; and
the directors are authorised to buy back ordinary shares up to a maximum of 20% in aggregate of the Company's issued ordinary share capitalas at 25 January 2017.
Events after the reporting date
No significant events occurred subsequent to the reporting date that requires any additional disclosure or adjustments to the annual financialstatements, other than the financial support approved for various subsidiaries within the Group as per note 37 to the financial statements.
Special resolutions
11


EFFICIENT GROUP LIMITEDGroup and Company Annual Financial Statements
Statements of financial positionat 31 August 2017
2017 2016 2017 2016Notes R'000 R'000 R'000 R'000
ASSETS
Non-current assets
Property and equipment 2 52 198 27 353 291 366
Goodwill 3 153 056 155 050 - -
Intangible assets 4 130 565 132 365 - -
Investments in subsidiaries 5 - - 313 991 292 923
Investments in equity-accounted associates 6 6 638 11 726 5 364 10 502
Other investments 7 323 1 383 - -
Loans receivable 8 - 3 436 24 544 30 566
Deferred tax assets 9 14 703 12 172 1 497 1 719
357 483 343 485 345 687 336 076
Current assets
Other investments 7 4 302 6 503 2 000 1 042
Short-term portion of loans receivable 8 1 084 3 741 29 449 19 137
Trade and other receivables 10 110 203 79 676 18 094 4 220
Cash and cash equivalents 11 106 936 90 118 2 131 3 200
Current tax receivable 950 550 - -
223 475 180 588 51 674 27 599
Total assets 580 958 524 073 397 361 363 675
EQUITY AND LIABILITIES
Equity
Share capital and share premium 12 150 325 150 325 263 530 263 530
Treasury share reserve 13,1 (532) (440) - -
Accumulated income (losses) 13,2 111 487 72 530 51 486 (24 752)
Fair value adjustment reserve 13,3 1 58 - -
Revaluation reserve 13,4 1 125 - - -
Equity attributable to equity holders of the parent 262 406 222 473 315 016 238 778
Non-controlling interests 14 5 592 (2 443) - -
Total equity 267 998 220 030 315 016 238 778
Non-current liabilities
Loans and borrowings 15 28 011 85 465 4 950 70 456
Provisions 16 133 - - -
Deferred tax liabilities 9 32 707 30 991 - -
60 851 116 456 4 950 70 456
Current liabilities
Short-term portion of loans and borrowings 15 70 283 47 847 63 552 32 827
Provisions 16 342 - - -
Trade and other payables 17 171 879 139 547 5 011 21 614
Current tax payable 710 193 - -
Cash and cash equivalents 11 8 895 - 8 832 -
252 109 187 587 77 395 54 441
Total liabilities 312 960 304 043 82 345 124 897
Total equity and liabilities 580 958 524 073 397 361 363 675
Net asset value per share (cents) 290,68 246,28
Net tangible asset value per share (cents) 16,20 (30,86)
Group Company
17

EFFICIENT GROUP LIMITEDGroup and Company Annual Financial Statements
Statements of Comprehensive Income for the year ended 31 August 2017for the year ended 31 August 2017
2017 2016 2017
Restated
2016 (1)
Notes R'000 R'000 R'000 R'000
Revenue (1) 18 1 002 096 879 978 84 307 48 099
Operating expenses (957 622) (830 566) (17 668) (22 963) Operating profit 19 44 474 49 412 66 639 25 136
Dividend income on other investments 152 226 - 100
Profit on disposal of equipment 134 25 26 -
Profit on disposal of customer contracts and customer relationships 139 - - - Other income (expenses) 20 4 448 (915) 3 234 (1 159)
Fair value adjustment of investment designated at fair value throughprofit or loss (8) 108 (8) 25 Realised fair value adjustment on available-for-sale investments 161 - - - Gain on derecognition of loan payable to non-controlling interest 20 1 577 - - -
Re-measurement of loans and borrowings at fair value through profit orloss
20
22 558 (6 589) 21 982 (4 661) Impairment of goodwill 21,1 (9 324) - - - Impairment of intangible assets 21,2 (118) - - - Impairment of investments in subsidiaries 21,3 - - - (21 153)
Impairment of investments in equity-accounted associates 21,4 (5 265) - (5 265) - Impairments on loans receivable, net of reversals 21,5 - - (422) -
Share of profits from investments in equity-accounted associates, net oftaxation 1 037 1 823 327 575 Operating profit (loss) before net finance income 59 965 44 090 86 513 (1 137) Net finance income (costs) 1 850 10 270 (3 620) (2 770) Finance income 22,1 7 934 13 900 331 461
Finance costs 22,2 (6 084) (3 630) (3 951) (3 231)
Profit (loss) before taxation 61 815 54 360 82 893 (3 907) Taxation 23 (14 924) (16 845) (222) 4
Profit (loss) for the year 46 891 37 515 82 671 (3 903)
Other comprehensive income
Items that may be reclassified subsequently to profit or lossUnrealised fair value adjustments of available-for-sale investments 135 61 - -
Realised fair value adjustment of available-for-sale investmentsreclassified to profit or loss
(161) - - -
Related taxation (31) - - -
(57) 61 - - Items that may not be reclassified subsequently to profit or lossRevaluation of property 1 563 - - -
Related taxation (438) - - - 1 125 - - -
Other comprehensive income, net of taxation 1 068 61 - -
Total comprehensive income for the year 47 959 37 576 82 671 (3 903)
Profit for the year attributable to:Equity holders of the parent 47 798 37 538
Non-controlling interests (907) (23) 46 891 37 515
Total comprehensive income for the year attributable to:Equity holders of the parent 48 866 37 599 Non-controlling interests (907) (23)
47 959 37 576
Basic and diluted earnings per share (cents) 24 52,95 41,55
Group Company
(1) The comparative information has been restated as a result of a re-presentation between dividend and finance income and revenue. Revenue waserroneously classified as dividend and finance income in the prior year. Refer to note 18 of the notes to the financial statements.
18


EFFICIENT GROUP LIMITEDGroup and Company Annual Financial Statements
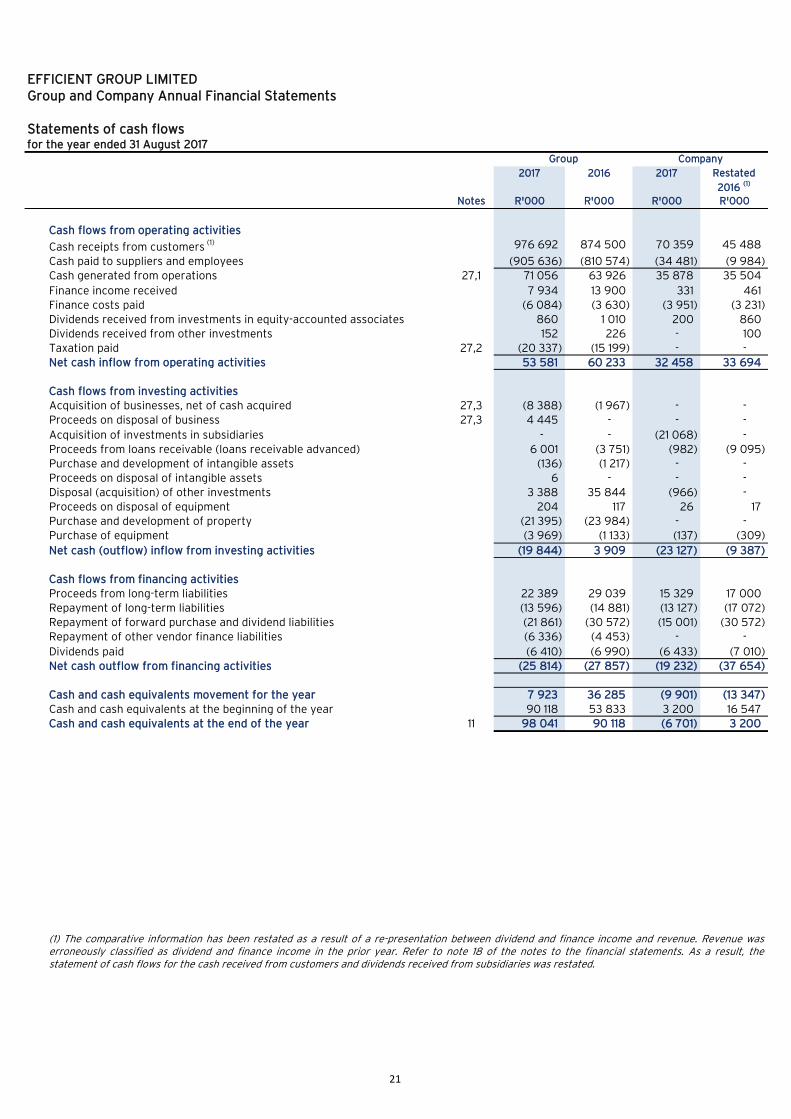
Statements of cash flowsfor the year ended 31 August 2017
2017 2016 2017 Restated
2016 (1)
Notes R'000 R'000 R'000 R'000
Cash flows from operating activities
Cash receipts from customers (1) 976 692 874 500 70 359 45 488
Cash paid to suppliers and employees (905 636) (810 574) (34 481) (9 984) Cash generated from operations 27,1 71 056 63 926 35 878 35 504
Finance income received 7 934 13 900 331 461
Finance costs paid (6 084) (3 630) (3 951) (3 231) Dividends received from investments in equity-accounted associates 860 1 010 200 860 Dividends received from other investments 152 226 - 100 Taxation paid 27,2 (20 337) (15 199) - -Net cash inflow from operating activities 53 581 60 233 32 458 33 694
Cash flows from investing activitiesAcquisition of businesses, net of cash acquired 27,3 (8 388) (1 967) - - Proceeds on disposal of business 27,3 4 445 - - -
Acquisition of investments in subsidiaries - - (21 068) -
Proceeds from loans receivable (loans receivable advanced) 6 001 (3 751) (982) (9 095) Purchase and development of intangible assets (136) (1 217) - -Proceeds on disposal of intangible assets 6 - - -
Disposal (acquisition) of other investments 3 388 35 844 (966) -
Proceeds on disposal of equipment 204 117 26 17 Purchase and development of property (21 395) (23 984) - - Purchase of equipment (3 969) (1 133) (137) (309)
Net cash (outflow) inflow from investing activities (19 844) 3 909 (23 127) (9 387)
Cash flows from financing activities
Proceeds from long-term liabilities 22 389 29 039 15 329 17 000 Repayment of long-term liabilities (13 596) (14 881) (13 127) (17 072) Repayment of forward purchase and dividend liabilities (21 861) (30 572) (15 001) (30 572)
Repayment of other vendor finance liabilities (6 336) (4 453) - -
Dividends paid (6 410) (6 990) (6 433) (7 010) Net cash outflow from financing activities (25 814) (27 857) (19 232) (37 654)
Cash and cash equivalents movement for the year 7 923 36 285 (9 901) (13 347)
Cash and cash equivalents at the beginning of the year 90 118 53 833 3 200 16 547
Cash and cash equivalents at the end of the year 11 98 041 90 118 (6 701) 3 200
Group Company
(1) The comparative information has been restated as a result of a re-presentation between dividend and finance income and revenue. Revenue waserroneously classified as dividend and finance income in the prior year. Refer to note 18 of the notes to the financial statements. As a result, thestatement of cash flows for the cash received from customers and dividends received from subsidiaries was restated.
21

EFFICIENT GROUP LIMITEDGroup and Company Annual Financial Statements
Significant accounting policiesfor the year ended 31 August 2017
1 Presentation of financial statements
1.1 Standards in issue, not yet effective
Effective for the year commencing 1 September 2017
+
+
Effective for the year commencing 1 September 2018
+
+
+
+
+
Effective for the year commencing 1 September 2019
+
+
This Standard is not likely to have an impact on the Company's financial statements.
IFRS 15 Revenue from Contracts with Customers
This new Standard is likely to have impact on the Group, which will include a possible change in the timing of when revenue isrecognised, especially in the Group's Financial Services cluster. The Group will not implement retrospective application for thisStandard and will record any necessary adjustments in equity on 1 September 2018. The Group has established a Project FocusTeam to review the impact of this Standard in more detail and is currently in the process of performing a more detailedassessment of the impact of this Standard.
The principal accounting policies applied in the preparation of these financial statements are set out below. These policies havebeen applied consistently to all the years presented, excluding the accounting policies for new Standards that are effective for thefirst time as referred to in the notes to the financial statements where applicable.
The financial statements of Efficient Group Ltd (the Company) and the financial statements of Efficient Group Ltd and itssubsidiaries (the Group) have been prepared in accordance with the International Financial Reporting Standards (IFRS) and SAICAFinancial Reporting Guides as issued by the Accounting Practices Committee and Financial Reporting Pronouncements as issuedby the Financial Reporting Standards Council and the requirements of the Companies Act of South Africa. The financial statementsare prepared on a going concern basis using the historical cost convention, except for the fair value adjustments in relation to landand buildings, available-for-sale investments, investments at fair value and loans and borrowings at fair value. The financialstatements are presented in South African Rand. References to the Group shall include the Company, unless otherwise stated.
A number of new Standards, amendments to Standards and Interpretations are effective for annual periods beginning on or after 1January 2017, and have not been applied in preparing these Group and Company financial statements. The Group and Company donot plan to adopt these Standards early. These will be adopted in the year that they become mandatory unless otherwise indicated.The new Standards and amendments to Standards and Interpretations relevant to the Group, are listed below:
The above Standards are not expected to have a material impact on the financial statements, except for the potential impact ofIFRS 9 and IFRS 15. More information on these Standards and their potential impact follows.
This Standard replaces IAS 11 Construction Contracts, IAS 18 Revenue, IFRIC 13 Customer Loyalty Programmes, IFRIC 15Agreements for the Construction of Real Estate, IFRIC 18 Transfer of Assets from Customers and SIC-31 Revenue – Barter ofTransactions Involving Advertising Services.
The Standard contains a single model that applies to contracts with customers and two approaches to recognising revenue: at apoint in time or over time. The model features a contract-based five-step analysis of transactions to determine whether, how muchand when revenue is recognised.
Disclosure Initiatives (Amendments to IAS 7)
Recognition of Deferred Tax Assets for Unrealised Losses (Amendments to IAS 12)
IFRS 15 Revenue from Contracts with Customers
IFRS 9 Financial Instruments
Classification and Measurement of Share-based Payment Transactions (Amendments to IFRS 2)
Transfers of Investment Property (Amendments to IAS 40)
IFRIC 22 Foreign Currency Transactions and Advance Considerations
IFRS 16 Leases
IFRIC 23 Uncertainty over Income Tax Treatments
22
EFFICIENT GROUP LIMITEDGroup and Company Annual Financial Statements
Significant accounting policiesfor the year ended 31 August 2017
1.1 Standards in issue, not yet effective (continued)
1.2 Basis of consolidation
Business combinations
Subsidiaries
Forward purchase agreements
+
+
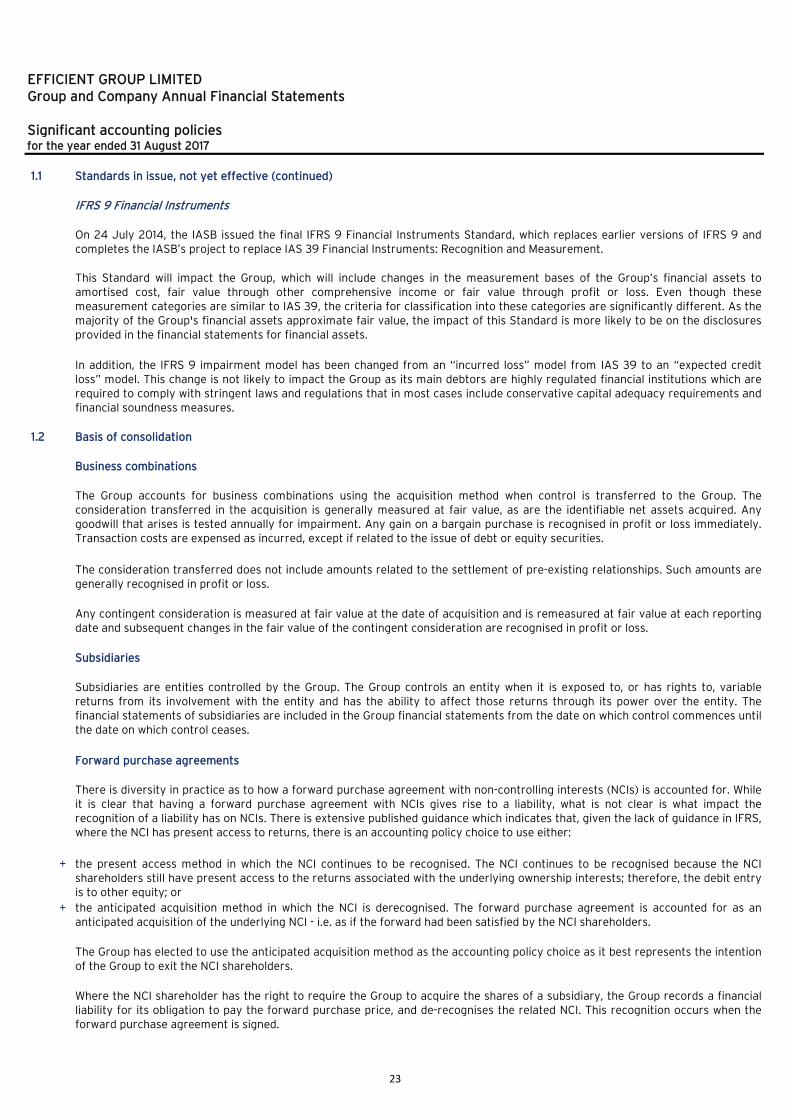
IFRS 9 Financial Instruments
Subsidiaries are entities controlled by the Group. The Group controls an entity when it is exposed to, or has rights to, variablereturns from its involvement with the entity and has the ability to affect those returns through its power over the entity. Thefinancial statements of subsidiaries are included in the Group financial statements from the date on which control commences untilthe date on which control ceases.
The Group has elected to use the anticipated acquisition method as the accounting policy choice as it best represents the intentionof the Group to exit the NCI shareholders.
On 24 July 2014, the IASB issued the final IFRS 9 Financial Instruments Standard, which replaces earlier versions of IFRS 9 andcompletes the IASB’s project to replace IAS 39 Financial Instruments: Recognition and Measurement.
This Standard will impact the Group, which will include changes in the measurement bases of the Group’s financial assets toamortised cost, fair value through other comprehensive income or fair value through profit or loss. Even though thesemeasurement categories are similar to IAS 39, the criteria for classification into these categories are significantly different. As themajority of the Group's financial assets approximate fair value, the impact of this Standard is more likely to be on the disclosuresprovided in the financial statements for financial assets.
The Group accounts for business combinations using the acquisition method when control is transferred to the Group. Theconsideration transferred in the acquisition is generally measured at fair value, as are the identifiable net assets acquired. Anygoodwill that arises is tested annually for impairment. Any gain on a bargain purchase is recognised in profit or loss immediately.Transaction costs are expensed as incurred, except if related to the issue of debt or equity securities.
Where the NCI shareholder has the right to require the Group to acquire the shares of a subsidiary, the Group records a financialliability for its obligation to pay the forward purchase price, and de-recognises the related NCI. This recognition occurs when theforward purchase agreement is signed.
The consideration transferred does not include amounts related to the settlement of pre-existing relationships. Such amounts aregenerally recognised in profit or loss.
Any contingent consideration is measured at fair value at the date of acquisition and is remeasured at fair value at each reportingdate and subsequent changes in the fair value of the contingent consideration are recognised in profit or loss.
There is diversity in practice as to how a forward purchase agreement with non-controlling interests (NCIs) is accounted for. Whileit is clear that having a forward purchase agreement with NCIs gives rise to a liability, what is not clear is what impact therecognition of a liability has on NCIs. There is extensive published guidance which indicates that, given the lack of guidance in IFRS,where the NCI has present access to returns, there is an accounting policy choice to use either:
the present access method in which the NCI continues to be recognised. The NCI continues to be recognised because the NCIshareholders still have present access to the returns associated with the underlying ownership interests; therefore, the debit entryis to other equity; or
the anticipated acquisition method in which the NCI is derecognised. The forward purchase agreement is accounted for as ananticipated acquisition of the underlying NCI - i.e. as if the forward had been satisfied by the NCI shareholders.
In addition, the IFRS 9 impairment model has been changed from an “incurred loss” model from IAS 39 to an “expected creditloss” model. This change is not likely to impact the Group as its main debtors are highly regulated financial institutions which arerequired to comply with stringent laws and regulations that in most cases include conservative capital adequacy requirements andfinancial soundness measures.
23

EFFICIENT GROUP LIMITEDGroup and Company Annual Financial Statements
Significant accounting policiesfor the year ended 31 August 2017
1.2 Basis of consolidation (continued)
Forward purchase agreements (continued)
Structured entities
Non-controlling interests (NCIs)
Interests in associates
Transactions eliminated on consolidation
Intra-group balances and transactions, and any unrealised income and expenses arising from intra-group transactions, areeliminated.
Subsequent to this recognition, the forward purchase liability is re-measured as a financial liability at fair value through profit orloss, with changes in the carrying amount of the liability recorded in profit or loss.
When the forward purchase agreement is exercised, the amount paid by the Group will be recognised as a reduction in the forwardpurchase liability.
A shareholders' agreement between the Group and the NCI shareholder of a subsidiary within the Group for which a forward exists,may require the relevant subsidiary to declare dividends in terms of a specific dividend policy. The estimated future dividendspayable to the NCI until acquisition of the NCI shareholding, is recognised as a liability in the Group's financial statements. Thisliability is re-measured as a financial liability through profit or loss.
A structured entity shall be consolidated when the substance of the relationship between the Group and the structured entityindicates that the structured entity is controlled by the Group.
NCIs are initially measured at their proportionate share of the acquiree’s identifiable net assets at the date of acquisition. Changesin the Group’s interest in a subsidiary that do not result in a loss of control are accounted for as equity transactions.
Investments in subsidiaries are carried at cost less impairment adjustments in the separate financial statements of the Company.
Associates are those entities in which the Group has significant influence, but not control or joint control, over the financial andoperating policies.
Interests in associates are accounted for using the equity-method. They are initially recognised at cost, which includes transactioncosts. Subsequent to initial recognition, the Group financial statements include the Group’s share of the changes in net assets ofthe equity-accounted investees less any impairments, until the date on which significant influence ceases. The Group’s share of theprofit or loss and other comprehensive income (OCI) of equity-accounted investees is recognised in profit or loss and OCIrespectively.
When the Group's share of losses in an associate equals or exceeds its interest in the associate, including any other unsecuredreceivables, the Group does not recognise further losses, unless it has incurred obligations or made payments on behalf of theassociate.
At the commencement of the prior year, the Group elected to early adopt the amendments to IAS 27 Equity Method in theSeparate Financial Statements. As a result, investments in associates are accounted for using the equity-method in the separatefinancial statements of the investor entity in the Group directly holding the interest in the associate. Prior to this date, investmentsin associates were carried at cost less impairment adjustments in the investor entity's separate financial statements.
Where the forward purchase agreement is entered into as part of a business combination, the forward purchase is accounted foras a financial liability and is recognised as a component of the consideration transferred. No NCI is recorded.
24

EFFICIENT GROUP LIMITEDGroup and Company Annual Financial Statements
Significant accounting policiesfor the year ended 31 August 2017
1.2 Basis of consolidation (continued)
Common control transactions
1.3 Use of judgements and estimates
Judgements
+
Assumptions and estimation uncertainties
+
+
+
Measurement of fair value
+
+
+
The preparation of the Group and Company financial statements necessitates the use of estimates, assumptions and judgementsthat affect the reported amounts of assets and liabilities at the reporting date, as well as the reported income and expenses forreporting periods. Although estimates are based on management's best knowledge and judgment of current facts at the reportingdate, the actual outcome may differ from these estimates. Estimates and underlying assumptions are reviewed on an ongoingbasis. Revisions to estimates are recognised prospectively.
Information about judgements made in applying accounting policies that have the most significant effects on the amountsrecognised in the consolidated financial statements is included in the following notes:
Notes 5 and 6 - Consolidation and equity-accounting: Whether the Group has de facto control or significant influence over aninvestee.
Information about assumptions and estimation uncertainties that have a significant risk of resulting in a material adjustmentduring the current year is included in the following notes:
A business combination involving entities or businesses under common control is a business combination in which all of thecombining entities or businesses are ultimately controlled by the same party or parties both before and after the combination, andcontrol is not transitory. Common control transactions are accounted for using book-value accounting whereby all assets acquiredand all liabilities assumed are recognised at their carrying amounts in the financial statements of the Group, at the acquisitiondate. Any excess or premium paid for the acquisition of the net assets of the business acquired shall be recognised directly inequity.
Notes 3, 5, 6 and 21 - Impairment testing: Key assumptions underlying the measurement of recoverable amounts;
Notes 9 and 23 - Recognition of deferred tax assets: Availability of future taxable profit against which tax losses carried forwardcan be used; and
Notes 15.2, 15.3 and 15.6 - Remeasurement of liabilities at fair value through profit or loss: Key assumptions and variablesunderlying the calculation of the forward purchase liabilities, dividend liability and contingent consideration liabilities.
A number of the Group's accounting policies and disclosures require the measurement of fair values, for both financial and non-financial assets and liabilities.
The Group has an established control framework with respect to the measurement of fair values. Management has overallresponsibility for overseeing all significant fair value measurement.
Management regularly reviews significant unobservable inputs and valuation adjustments. If third party information, such asbroker quotes or pricing services, is used to measure fair values, management assesses the evidence obtained from the thirdparties to support the conclusion that such valuations meet the requirements of IFRS, including the level in the fair value hierarchyin which such valuations should be classified. Significant valuation issues are reported to the Group Audit Committee.
When measuring the fair value of an asset or liability, the Group uses market observable data as far as possible. Fair values arecategorised into different levels in a fair value hierarchy based on the inputs used in the valuation techniques as follows:
Level 1: Unadjusted quoted prices in active markets for identical assets or liabilities;
Level 2: Inputs, other than quoted prices included in Level 1, that are observable for assets or liabilities, either directly (i.e. asprices) or indirectly (i.e. derived from prices); and
Level 3: Inputs for assets or liabilities that are not based on observable market data.
25
EFFICIENT GROUP LIMITEDGroup and Company Annual Financial Statements
Significant accounting policiesfor the year ended 31 August 2017
1.3 Use of judgements and estimates (continued)
+
+
+
+
+
1.4 Goodwill
1.5 Intangible assets
Internally developed intangible assets
Acquired through business combinations
Amortisation
The estimated useful lives in years for the current year and prior year are as follows:
+ Trade names 3 to 20 years
+ Customer contracts and customer relationships 10 to 20 years
+ Computer software 4 to 7 years
Expenditure on research activities is recognised in profit or loss as incurred.
Intangible assets acquired through business combinations include trade, customer and marketing-related intangible assets, andhave finite useful lives. These intangible assets are measured at cost less accumulated amortisation and any accumulatedimpairment losses.
Amortisation is calculated to write off the cost of intangible assets less their estimated residual values using the straight-linemethod over their estimated useful lives, and is recognised in profit or loss.
Amortisation methods, useful lives and residual values are reviewed at each reporting date and adjusted if appropriate.
Subsequent expenditure is capitalised only when it increases the future economic benefits embodied in the specific asset to whichit relates. All other expenditure, including expenditure on internally generated goodwill and brands, is recognised in profit or lossas incurred.
Note 36 - Analysis of financial assets and liabilities.
Goodwill arising on the acquisition of subsidiaries is measured at cost less accumulated impairment losses and is tested forimpairment at least annually.
Development expenditure is capitalised only if the expenditure can be measured reliably, the product or process is technically andcommercially feasible, future economic benefits are probable and the Group intends to and has sufficient resources to completedevelopment and to use or sell the asset. Subsequent to initial recognition, development expenditure is measured at cost lessaccumulated amortisation and any accumulated impairment losses.
The Group recognises transfers between levels of the fair value hierarchy at the end of the reporting period during which thechange has occurred.
Further information about the assumptions made and inputs used in measuring fair values is included in the following notes:
Note 7 - Other investments;
Note 8 - Loans receivable;
Note 15 - Loans and borrowings;
Note 34 - Share-incentive schemes; and
If the inputs used to measure the fair value of an asset or liability fall into different levels of the fair value hierarchy, then the fairvalue measurement is categorised in its entirety in the same level of fair value hierarchy as the lowest level input that is significantto the entire measurement.
26

EFFICIENT GROUP LIMITEDGroup and Company Annual Financial Statements
Significant accounting policiesfor the year ended 31 August 2017
1.6 Property and equipment
Recognition and measurement
Depreciation
Furniture, fixtures and office equipment 3 to 6 years
Computer equipment 3 years
Leasehold improvements 5 years
Buildings 30 years
Other assets (electricity generators) 5 years
Depreciation methods, useful lives and residual values are reviewed at each reporting date and adjusted if appropriate.
Items of equipment are measured at cost less accumulated depreciation and any accumulated impairment losses. Property (landand buildings) is recognised at cost. Buildings are subsequently carried at a revalued amount being its fair value at the date of therevaluation less any subsequent accumulated depreciation and subsequent accumulated impairment losses. Land is subsequentlycarried at a revalued amount being its fair value at the date of the revaluation less any subsequent accumulated impairmentlosses.
Subsequent expenditure is capitalised only if it is probable that the future economic benefits associated with the expenditure willflow to the Group.
Any gain or loss on disposal of an item of property and equipment is recognised in profit or loss.
Depreciation is calculated to write off the cost of items of equipment and buildings less their estimated residual values using thestraight-line method over their estimated useful lives, and is generally recognised in profit or loss. Land and assets underconstruction are not depreciated.
The estimated useful lives in years of property, plant and equipment for current year and prior year are as follows:
Cumulative revaluation adjustments recognised in the revaluation reserve are transferred to accumulated income when theproperty is disposed of or is no longer classified as owner-occupied in the Group's financial statements.
Upon revaluation of the Group's property, any increases in the carrying amount of the property due to its fair value is recordeddirectly in equity in the revaluation reserve, through other comprehensive income. Any decreases in the carrying amount of theproperty to its fair value is recorded directly in equity in the revaluation reserve, through other comprehensive income to theextent that there is a cumulative increase in the property's value recognised in the revaluation reserve.
Where there is no cumulative increase in recognised in the revaluation reserve or where a decrease in the carrying amount of theproperty due to revaluation exceeds previous increases recognised in the revaluation reserve, such a decrease is recognised inprofit or loss as an impairment loss. Where an impairment loss has been previously recognised in profit or loss on the Group'sproperty and the carrying amount of the property increases to its fair value, such an increase is first recognised in profit or loss asa reversal of previous impairment losses recognised. Once the increase recognised in profit or loss approximates previousimpairment losses recognised, any additional increase in the carrying amount to its revalued amount is recognised directly inequity in the revaluation reserve, through other comprehensive income.
When property is revalued, the property's accumulated depreciation is eliminated against the gross carrying amount of theproperty and the net carrying amount is restated to the property's fair value (revalued amount).
27

EFFICIENT GROUP LIMITEDGroup and Company Annual Financial Statements
Significant accounting policiesfor the year ended 31 August 2017
1.7 Share capital
Ordinary shares
Repurchase and reissue of ordinary shares (treasury shares)
1.8 Financial instruments
+
+
+
+
+
Recognition and derecognition
Offsetting
Measurement
Ordinary shares are classified as equity. Incremental costs directly attributable to the issue of ordinary shares are recognised as adeduction from equity, net of income tax.
When shares recognised as equity are repurchased, the amount of the consideration paid, which includes directly attributablecosts, is recognised as a deduction from equity. Repurchased shares are classified as treasury shares and are presented in thetreasury share reserve. When treasury shares are subsequently sold or reissued, the amount received is recognised as an increasein equity and the resulting surplus or deficit on the transaction is presented within share premium.
The Group classifies financial assets and liabilities into the following categories at initial recognition:
Financial assets at fair value through profit or loss;
Available-for-sale investments;
Financial assets at fair value through profit or loss
Loans and receivables;
Financial liabilities at fair value through profit or loss; and
Other financial liabilities at amortised cost.
The Group initially recognises loans and receivables and debt securities issued on the date when they are originated. All otherfinancial assets and financial liabilities are initially recognised on the trade date when the Group becomes a party to thecontractual provisions of the instrument.
The Group derecognises a financial asset when the contractual rights to the cash flows from the asset expire, or it transfers therights to receive the contractual cash flows in a transaction in which substantially all of the risks and rewards of ownership of thefinancial asset are transferred, or it neither transfers nor retains substantially all of the risks and rewards of ownership and doesnot retain control over the transferred asset. Any interest in such derecognised financial assets that is created or retained by theGroup is recognised as a separate asset or liability.
The Group derecognises a financial liability when its contractual obligations are discharged or cancelled, or expire.
Financial assets and liabilities are offset and the net amount presented in the statement of financial position when, and only when,the Group currently has a legally enforceable right to offset the amounts and intends either to settle them on a net basis or torealise the asset and settle the liability simultaneously.
A financial asset is classified as at fair value through profit or loss if it is classified as held-for-trading or is designated as such oninitial recognition. Directly attributable transaction costs are recognised in profit or loss as incurred. Financial assets at fair valuethrough profit or loss are measured at fair value and changes therein, including any interest or dividend income, are recognised inprofit or loss.
28
EFFICIENT GROUP LIMITEDGroup and Company Annual Financial Statements
Significant accounting policiesfor the year ended 31 August 2017
1.8 Financial instruments (continued)
Measurement (continued)
1.9 Impairment
Financial assets
+
+
+
+
+
+
Available-for-sale investments
Loans and receivables
Financial liabilities at fair value through profit or loss
Other financial liabilities at amortised cost
These assets are initially measured at fair value plus any directly attributable transaction costs. Subsequent to initial recognition,they are measured at fair value and changes therein, other than impairment losses and foreign currency differences on debtinstruments, are recognised in other comprehensive income and accumulated in the fair value adjustment reserve directly inequity. When these assets are derecognised, the gain or loss accumulated in equity is reclassified to profit or loss, as a realised fairvalue adjustment.
These assets are initially measured at fair value plus any directly attributable transaction costs and include loans receivable, tradeand other receivables and cash and cash equivalents. Subsequent to initial recognition, they are measured at amortised cost usingthe effective interest method.
Trade receivables are presented net of an impairment provision (allowance for credit losses) which is raised when indicators ofimpairment suggest that the receivable might not be collected. Movements in the impairment provision are recognised in profit orloss and uncollectable receivables are written off against the impairment provision. Recoveries of amounts previously written offare credited to profit or loss.
A financial liability is classified as at fair value through profit or loss if it is classified as held-for-trading or is designated as such oninitial recognition. Directly attributable transaction costs are recognised in profit or loss as incurred. Financial liabilities at fairvalue through profit or loss are measured at fair value and changes therein, including any interest expense, are recognised in profitor loss.
Restructuring of an amount due to the Group on terms that the Group would not consider otherwise;
Indications that a debtor or issuer will enter bankruptcy;
Adverse changes in the payment status of borrowers or issuers;
The disappearance of an active market for a security because of financial difficulties; and
Observable data indicating that there is a measurable decrease in the expected cash flows from a group of financial assets.
Other financial liabilities are initially measured at fair value less any directly attributable transaction costs. Subsequent to initialrecognition, these liabilities are measured at amortised cost using the effective interest method.
Where the carrying amount of financial instruments approximates their fair values and where the effects of discounting are notconsidered to be material, no such discounting is applied.
The Group holds no derivative financial instruments.
Financial assets not classified as at fair value through profit or loss, including an interest in an equity-accounted investee, areassessed at each reporting date to determine whether there is objective evidence of impairment.
Objective evidence that financial assets are impaired includes:
Default or delinquency by a debtor;
29
EFFICIENT GROUP LIMITEDGroup and Company Annual Financial Statements
Significant accounting policiesfor the year ended 31 August 2017
1.9 Impairment (continued)
Financial assets (continued)
Non-financial assets
Financial assets measured at amortised cost
Available-for-sale investments
The Group considers evidence of impairment for these assets at both an individual asset and a collective level. All individuallysignificant assets are individually assessed for impairment. Those found not to be impaired are then collectively assessed for anyimpairment that has been incurred but not yet individually identified. Assets that are not individually significant are collectivelyassessed for impairment. Collective assessment is carried out by grouping together assets with similar risk characteristics.
The recoverable amount of an asset or CGU is the greater of its value-in-use and its fair value less costs to sell. Value-in-use isbased on the estimated future cash flows, discounted to their present value using a pre-tax discount rate that reflects currentmarket assessments of the time value of money and the risks specific to the asset or CGU.
An impairment loss is recognised if the carrying amount of an asset or CGU exceeds its recoverable amount.
Impairment losses are recognised in profit or loss. They are allocated first to reduce the carrying amount of any goodwill allocatedto the CGU, and then to reduce the carrying amounts of the other assets in the CGU on a pro rata basis.
An impairment loss in respect of goodwill is not reversed. For other assets, an impairment loss is reversed only to the extent thatthe asset’s carrying amount does not exceed the carrying amount that would have been determined, net of depreciation oramortisation, if no impairment loss had been recognised.
In assessing collective impairment, the Group uses historical information on the timing of recoveries and the amount of lossincurred, and makes an adjustment if current economic and credit conditions are such that the actual losses are likely to begreater or lesser than suggested by historical trends.
An impairment loss is calculated as the difference between an asset’s carrying amount and the present value of the estimatedfuture cash flows discounted at the asset’s original effective interest rate. Losses are recognised in profit or loss and reflected inan allowance account. When the Group considers that there are no realistic prospects of recovery of the asset, the relevantamounts are written off. If the amount of impairment loss subsequently decreases and the decrease can be related objectively toan event occurring after the impairment was recognised, then the previously recognised impairment loss is reversed throughprofit or loss.
Impairment losses on available-for-sale investments are recognised by reclassifying the losses accumulated in the fair valueadjustment reserve to profit or loss. The amount reclassified is the difference between the acquisition cost (net of any principalrepayment and amortisation) and the current fair value, less any impairment loss previously recognised in profit or loss. If the fairvalue of an impaired available-for-sale investment subsequently increases and if the increase can be related objectively to an eventoccurring after the impairment loss was recognised, the impairment losses recognised in profit or loss for the investment isreversed through profit or loss.
At each reporting date, the Group reviews the carrying amounts of its non-financial assets (other than deferred tax assets) todetermine whether there is any indication of impairment. If any such indication exists, then the asset’s recoverable amount isestimated. This includes the Group's investments in equity-accounted associates. Goodwill is tested annually for impairment.
For impairment testing, assets (including intangible assets) are grouped together into the smallest group of assets that generatescash inflows from continuing use that are largely independent of the cash inflows of other assets or cash-generating-units (CGUs).Goodwill arising from a business combination is allocated to CGUs or groups of CGUs that are expected to benefit from thesynergies of the combination.
Refer to accounting policy 1.6 for more detail regarding impairment losses on revalued property.
30

EFFICIENT GROUP LIMITEDGroup and Company Annual Financial Statements
Significant accounting policiesfor the year ended 31 August 2017
1.10 Leases
1.11 Taxation
Current tax
Deferred tax
1.12 Employee benefits
Short-term employee benefits
At inception of an arrangement, the Group determines whether the arrangement is a lease or contains a lease.
Receipts and payments made under operating leases are recognised in profit or loss on a straight-line basis over the term of thelease. Lease incentives granted are recognised as an integral part of the total lease expense, over the term of the lease.
Unrecognised deferred tax assets are reassessed at each reporting date and recognised to the extent that it has become probablethat future taxable profits will be available against which they can be used.
Deferred tax is measured at the tax rates that are expected to be applied to temporary differences when they reverse, using taxrates enacted or substantively enacted at the reporting date.
The measurement of deferred tax reflects the tax consequences that would follow from the manner in which the Group expects, atthe reporting date, to recover or settle the carrying amount of its assets and liabilities.
Deferred tax assets and liabilities are offset only if certain criteria are met.
Short-term employee benefits are expensed as the related service is provided. A liability is recognised for an amount expected tobe paid if the Group has a present legal or constructive obligation to pay this amount as a result of past service provided by theemployee and the obligation can be estimated reliably. These liabilities include provisions for profit-sharing and other incentives.
The expected cost of compensated absences is recognised as an expense as employees render services that increase theirentitlement or, in the case of non-accumulating absences, when the absence occurs.
The Group's taxation charge comprises current and deferred tax. It is recognised in profit or loss except to the extent that itrelates to a business combination, or items recognised directly in equity or in other comprehensive income.
Current tax comprises the expected tax payable or receivable on the taxable income or loss for the reported period and anyadjustment to the tax payable or receivable in respect of previous periods. The amount of current tax payable or receivable is thebest estimate of the tax amount expected to be paid or received that reflects uncertainty related to income taxes, if any. It ismeasured using tax rates enacted or substantively enacted at the reporting date.
Current tax assets and liabilities are offset only if certain criteria are met.
Deferred tax is recognised in respect of temporary differences between the carrying amounts of assets and liabilities for financialreporting purposes, and the amounts used for taxation purposes.
Deferred tax is not recognised for temporary differences on the initial recognition of assets or liabilities in a transaction that is nota business combination and that affects neither accounting nor taxable profit or loss.
Deferred tax assets are recognised for unused tax losses, unused tax credits and deductible temporary differences to the extentthat it is probable that future taxable profits will be available against which they can be used. Future taxable profits are determinedbased on business plans for individual subsidiaries in the Group. Deferred tax assets are reviewed at each reporting date and arereduced to the extent that it is no longer probable that the related tax benefit will be realised; such reductions are reversed whenthe probability of future taxable profits improves.
Obligations for contributions to defined contribution retirement benefit plans are expensed as the related service is provided.
31

EFFICIENT GROUP LIMITEDGroup and Company Annual Financial Statements
Significant accounting policiesfor the year ended 31 August 2017
1.12 Employee benefits (continued)
Share-based payment arrangements
1.13 Provisions, guarantees and contingent assets and liabilities
+
+
1.14 Dividends
1.15 Finance income and finance costs
+
+
Provisions are recognised when the Group has a present obligation as a result of a past event, it is probable that an outflow ofresources embodying economic benefits will be required to settle the obligation and a reliable estimate can be made of theobligation.
Provisions are calculated by discounting the expected future cash flows at a pre-tax rate that reflects current market assessmentsof the time value of money and the risks specific to the liability. The unwinding of the discount is recognised as finance cost.
Contingent assets and contingent liabilities are not recognised on the statement of financial position, but are separately disclosedin the notes to the financial statements.
A provision for onerous contracts is measured at the present value of the lower of the expected cost of terminating the contractand the expected net cost of continuing with the contract.
Guarantees that do not meet the definition of financial guarantee contracts are not recognised on the statement of financialposition, but are separately disclosed in the notes to the financial statements.
Dividends are recognised in the statement of changes in equity when they are declared by the Group. Cash dividend payments aredisclosed as cash flows from financing activities in the statement of cash flows.
Dividend income is recognised in profit or loss on the date on which the Group’s right to receive payment is established.
The Group’s finance income and finance costs comprise:
interest income earned on bank balances, other investments and loan receivables; and
interest expense incurred on bank overdrafts and credit cards and loans and borrowings;
Financial guarantees are contracts that require the Group to make specified payments to reimburse the holder for a loss that itincurs because a specified debtor fails to make payment when it is due in accordance with the terms of the debt instrument.Financial guarantee liabilities are initially recognised at fair value. Subsequent to initial recognition, the financial guaranteeliabilities are measured at the higher of:
the amount recognised initially less, when appropriate, cumulative amortisation recognised in accordance with IAS 18 Revenue.
the amount determined in accordance with IAS 37 Provisions, Contingent Liabilities and Contingent Assets; and
Interest income and interest expense are recognised using the effective interest method, during the period in which the interestincome is earned or interest expense is incurred.
The fair value of the amount payable to employees in respect of share appreciation rights (SARs), which are settled in cash, isrecognised as an expense with a corresponding increase in liabilities, over the period during which the employees becomeunconditionally entitled to payment. The liability is remeasured at each reporting date and at settlement date based on the fairvalue of the SARs. Any changes in the liability are recognised in profit or loss.
32
EFFICIENT GROUP LIMITEDGroup and Company Annual Financial Statements
Significant accounting policiesfor the year ended 31 August 2017
1.16 Revenue
+
+
+
+
+ economic, research and presentation fees;+
+ interest income earned from loans to subsidiaries for the Company.
+
+ dividend income earned from subsidiaries for the Company;+
1.17 Segment reporting
+
+
+
+
1.18 Net asset value per share and net tangible asset value per share
Revenue for the Group comprises:
income earned from the execution of fiduciary services;
fixed and performance fees charged for portfolio management services;
fees for asset and liability administration and asset consultation;
Other: Activities by the Company and its supporting entities assisting to carry out the Group's head-office function; EfficientCapital (Pty) Ltd, Efficient Group Central Services (Pty) Ltd, the Efficient Group Share Trust and consolidation entries. In addition,the Company's equity-accounted associate, AS Sure Investments (Pty) Ltd is also included in this operating segment.
Net asset value per share is calculated as the total assets of the Group attributable to the equity holders of the parent, less thetotal liabilities of the Group attributable to the equity holders of the parent (net asset value), divided by the total number ofordinary shares issued by the Group at the reporting date, after deduction of the total number of ordinary treasury shares held bythe Group at the reporting date (net ordinary shares issued). Net tangible asset value per share is calculated as the net asset valueattributable to the equity holders of the parent at the reporting date, less goodwill and intangible assets, plus deferred taxliabilities related to intangible assets, divided by the net ordinary shares issued at the reporting date.
commission income earned through the provision of financial services;
Performance fee revenue is recognised when certain targets are achieved in accordance with service level agreements withclients. All other revenue is recognised when the related service is provided.
rental income from the Group's properties;
Operating segments have been identified using the management approach as required by IFRS 8 Operating Segments, in terms ofwhich segment classification is determined according to the basis on which the Chief Operating Decision Maker reviews theoperating results. The Group operates in the following business segments, referred to as clusters:
Financial Services: The core business entails the delivery of comprehensive financial planning and investment managementexpertise for the benefit of individual and corporate clients;
Services and Solutions: This cluster creates products and services for the Group's distribution network. The products and servicesoffered are independent investment solutions and fiduciary services;
Investments: Asset management, administration and consultation services are offered through a range of unit trust funds, funds offunds and structured solutions; and
Revenue is measured at the fair value of the consideration received or receivable, net of any clawback provisions related to therevenue.
Dividend income and interest income recognised within revenue are recognised on the basis described in accounting policy 1.14 and1.15 respectively.
Revenue for the Company comprises:
administration and support fees from the Company's subsidiaries;
interest income earned from portfolio management services directly related to the Group's operations; and
33
EFFICIENT GROUP LIMITEDGroup and Company Annual Financial Statements
Significant accounting policiesfor the year ended 31 August 2017
1.19 Changes in accounting policies
Standards, Amendments and Interpretations adopted during the year
+
+
+
+
The above Standards, Interpretations and Amendments did not have a material impact on the Group's financial statements whenthey became effective.
The following Standards, Amendments and Interpretations relevant to the Group became effective during the current year:
Clarification of Acceptable Methods of Depreciation and Amortisation (Amendments to IAS 16 and IAS 38);
Disclosure Initiative (Amendments to IAS 1);
Equity Method in Separate Financial Statements (Amendments to IAS 27); and
Investment Entities: Applying the Consolidation Exception (Amendments to IFRS 10, IFRS 12 and IAS 28).
34

EFFICIENT GROUP LIMITEDGroup and Company Annual Financial Statements
Notes to the financial statements
for the year ended 31 August 2017
2 Property and equipment
Cost or revalued amount
Accumulated depreciation
and impairments
Carrying amount
R'000 R'000 R'000
2017 - Group
10 560 - 10 560
36 255 - 36 255
4 522 (2 342) 2 180
6 984 (4 937) 2 047
1 725 (569) 1 156
60 046 (7 848) 52 198
2016 - Group
21 096 - 21 096
2 888 - 2 888
3 815 (2 748) 1 067
5 594 (4 304) 1 290
1 945 (933) 1 012
35 338 (7 985) 27 353
2017 - Company
177 (171) 6
1 482 (1 197) 285
206 (206) - 1 865 (1 574) 291
2016 - Company
462 (444) 18
1 352 (1 004) 348
497 (497) -
206 (206) -
2 517 (2 151) 366
Reconciliation of property and equipment
Opening balance Transfers Disposals Additions Revaluations Depreciation
Closing balance
R'000 R'000 R'000 R'000 R'000 R'000 R'000
2017 - Group
- - - 9 600 960 - 10 560
21 096 2 888 - 11 795 603 (127) 36 255
2 888 (2 888) - - - - -
1 061 7 (48) 1 580 - (420) 2 180
1 296 (7) (22) 1 819 - (1 039) 2 047
1 012 - - 570 - (426) 1 156
27 353 - (70) 25 364 1 563 (2 012) 52 198
Land
Buildings
Assets under construction
Furniture, fixtures and office equipment
Computer equipment
Leasehold improvements
Leasehold improvements
Furniture, fixtures and office equipment
Computer equipment
Other assets
Furniture, fixtures and office equipment
Computer equipment
Leasehold improvements
Other assets
Land
Buildings
Furniture, fixtures and office equipment
Computer equipment
Leasehold improvements
Buildings
Assets under construction
Furniture, fixtures and office equipment
Computer equipment
35
EFFICIENT GROUP LIMITEDGroup and Company Annual Financial Statements
Notes to the financial statements
for the year ended 31 August 2017
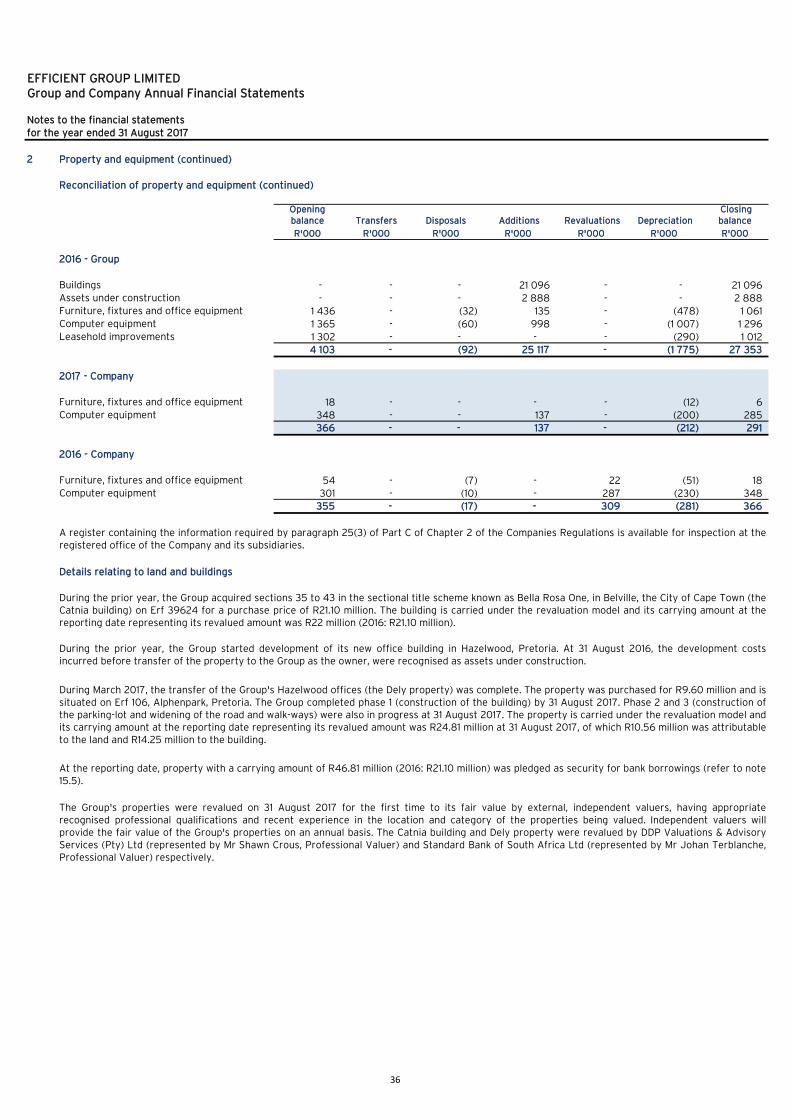
2 Property and equipment (continued)
Reconciliation of property and equipment (continued)
Opening balance Transfers Disposals Additions Revaluations Depreciation
Closing balance
R'000 R'000 R'000 R'000 R'000 R'000 R'000
2016 - Group
- - - 21 096 - - 21 096
- - - 2 888 - - 2 888
1 436 - (32) 135 - (478) 1 061
1 365 - (60) 998 - (1 007) 1 296
1 302 - - - - (290) 1 012
4 103 - (92) 25 117 - (1 775) 27 353
2017 - Company
18 - - - - (12) 6
348 - - 137 - (200) 285 366 - - 137 - (212) 291
2016 - Company
54 - (7) - 22 (51) 18
301 - (10) - 287 (230) 348
355 - (17) - 309 (281) 366
Details relating to land and buildings
Buildings
Assets under construction
Furniture, fixtures and office equipment
Computer equipment
Leasehold improvements
Furniture, fixtures and office equipment
Computer equipment
Furniture, fixtures and office equipment
Computer equipment
A register containing the information required by paragraph 25(3) of Part C of Chapter 2 of the Companies Regulations is available for inspection at theregistered office of the Company and its subsidiaries.
During March 2017, the transfer of the Group's Hazelwood offices (the Dely property) was complete. The property was purchased for R9.60 million and issituated on Erf 106, Alphenpark, Pretoria. The Group completed phase 1 (construction of the building) by 31 August 2017. Phase 2 and 3 (construction ofthe parking-lot and widening of the road and walk-ways) were also in progress at 31 August 2017. The property is carried under the revaluation model andits carrying amount at the reporting date representing its revalued amount was R24.81 million at 31 August 2017, of which R10.56 million was attributableto the land and R14.25 million to the building.
The Group's properties were revalued on 31 August 2017 for the first time to its fair value by external, independent valuers, having appropriaterecognised professional qualifications and recent experience in the location and category of the properties being valued. Independent valuers willprovide the fair value of the Group's properties on an annual basis. The Catnia building and Dely property were revalued by DDP Valuations & AdvisoryServices (Pty) Ltd (represented by Mr Shawn Crous, Professional Valuer) and Standard Bank of South Africa Ltd (represented by Mr Johan Terblanche,Professional Valuer) respectively.
During the prior year, the Group started development of its new office building in Hazelwood, Pretoria. At 31 August 2016, the development costsincurred before transfer of the property to the Group as the owner, were recognised as assets under construction.
During the prior year, the Group acquired sections 35 to 43 in the sectional title scheme known as Bella Rosa One, in Belville, the City of Cape Town (theCatnia building) on Erf 39624 for a purchase price of R21.10 million. The building is carried under the revaluation model and its carrying amount at thereporting date representing its revalued amount was R22 million (2016: R21.10 million).
At the reporting date, property with a carrying amount of R46.81 million (2016: R21.10 million) was pledged as security for bank borrowings (refer to note15.5).
36

EFFICIENT GROUP LIMITEDGroup and Company Annual Financial Statements
Notes to the financial statements
for the year ended 31 August 2017
2 Property and equipment (continued)
Details relating to land and buildings (continued)
+
+
+
+
+
+
2017 2016
R'000 R'000
3 Goodwill
Recognised on acquisition of business combinations 153 056 155 050
Efficient Financial Services (Pty) Ltd 12 862 13 051 Efficient Wealth (Pty) Ltd 22 148 17 590 Efficient Select (Pty) Ltd 8 369 8 369 Naviga Solutions (Pty) Ltd 25 118 29 674 Select Manager (Pty) Ltd 66 954 65 166 Stead Wealth Management (Pty) Ltd 4 127 15 112
Exceed Asset Management (Pty) Ltd (1)6 088 6 088
W-Allen White Brokers (Pty) Ltd 1 016 - Secure Capital Investments (Pty) Ltd 4 237 - Efficient Private Clients (Pty) Ltd 1 851 - Vital Consult Wealth Management (Pty) Ltd 286 -
153 056 155 050
Reconciliation of goodwill
Balance at the beginning of the year 155 050 153 275 Acquisitions through business combinations 8 598 1 775 Disposals (1 268) - Impairments (9 324) - Balance at the end of the year 153 056 155 050
Group
Vacancy rates on average of 2.50% for the Catnia building and 3% for the Dely property; and
Risk-adjusted capitalisation rates of 9% for the Catnia building and 9.25% for the Dely property.
The estimated fair value would increase (decrease) if:
the risk-adjusted capitalisation rates were lower (higher).
expected market rental growth were higher (lower);
the vacancy rates were lower (higher); or
Had no revaluation to fair value taken place, the carrying amount of the Group's properties would have been R20.98 million (2016: R21.10 million) for theCatnia building, R9.60 million for the land component of the Dely property and R14.67 million for the building constructed on the Dely property.
In determining the fair value of the Group's properties, the property portfolio is considered to be categorised as a Level 3 on the fair value hierarchy. Thevaluation model used to value both properties was the income approach model. This model determines the market value based on capitalisation of theproperty's first year net operating income. The capitalisation rate is best determined by referring to market transactions of comparable properties as itis based on information derived from market analysis.
The following represent the significant unobservable inputs for determining the fair value of the properties:
The valuation model does not assume that significant rent-free periods are anticipated for the Group's leases to realise its net operating income.
All gains and/or losses are accounted for in profit or loss, except for the revaluation of property, which is accounted for in other comprehensive income.
The residual values of the Catnia building and the building on the Dely property amounted to R17.62 million (2016: R21.10 million) and R12.67 millionrespectively.
Expected market rental growth on average of 6.50% for both properties;
The aggregate carrying amounts of goodwill allocated to each cash-generating-unit are as follows:
(1) During the prior year, this cash-generating-unit included fellow-subsidiary, Exceed Private Clients (Pty) Ltd. On 1 September 2016, Exceed Private Clients (Pty) Ltd soldits business to Exceed Asset Management (Pty) Ltd, after which it ceased to trade.
37

EFFICIENT GROUP LIMITEDGroup and Company Annual Financial Statements
Notes to the financial statements
for the year ended 31 August 2017
3 Goodwill (continued)
Impairment testing of cash-generating-units containing goodwill
+ The relationship between the discount rate and the terminal growth rate;
+ The forecast period;+ Nature of the factors affecting growth;
+ Historical growth; and
+ Peer comparison and market norms.
The growth rate used does not exceed the long-term average rate for the market in which the Group operates.
2017 2016
% %
Efficient Financial Services (Pty) Ltd 23,66% 24,90%Efficient Wealth (Pty) Ltd 25,20% 23,50%Efficient Select (Pty) Ltd 25,40% 27,01%Naviga Solutions (Pty) Ltd 25,15% 23,50%Select Manager (Pty) Ltd 24,66% 23,70%Stead Wealth Management (Pty) Ltd 25,05% 23,40%Exceed Asset Management (Pty) Ltd 24,75% 23,50%W-Allen White Brokers (Pty) Ltd 24,90% -Secure Capital Investments (Pty) Ltd 24,65% -Efficient Private Clients (Pty) Ltd 23,70% -Vital Consult Wealth Management (Pty) Ltd 25,45% -
The discount rates above approximated the Group's weighted average cost of capital and was adjusted for cash-generating-unit (investment) specificrisks based on the respective entity as well as effects to determine the rate, pre-tax.
For the purpose of impairment testing, goodwill is allocated to cash-generating-units which represent the lowest level within the Group at which thegoodwill is monitored for internal management purposes.
For each of the cash-generating-units included in the Investments cluster and the Services and Solutions cluster, the key assumptions used in the value-in-use calculations are the amount of assets under management as well as portfolio performance against benchmarks.
The recoverable amount for all the cash-generating-units and investments was based on a value-in-use calculation, which uses post-tax cash flowprojections based on financial budgets approved by management covering a five-year period.
Values assigned to key assumptions in all impairment tests reflect past experience, increased for expected efficiency improvements.
The table below summarises the pre-tax discount rates at which cash flows were discounted at for the purposes of impairment testing per cash-generating-unit (or investment):
For each of the cash-generating-units included in the Financial Services cluster, the key assumptions used in the value-in-use calculations are the amountof assets under advise, number of independent financial advisors, the average income per advisor as well as portfolio performance against benchmarks.
The carrying amounts of the cash-generating-units relating to Select Manager (Pty) Ltd and Stead Wealth Management (Pty) Ltd was determined to behigher than their recoverable amounts at 31 August 2017 and impairment losses of R6.87 million and R2.45 million were recognised respectively on thesecash-generating-units in profit or loss. The recoverable amounts at 31 August 2017 for these cash-generating-units were R88.45 million and R7.40 millionrespectively. At 31 August 2016, the carrying amounts of these cash-generating-units was determined to be lower than the recoverable amounts and noimpairment losses were recognised.
A key estimate used in the Group's investment and cash-generating-unit (goodwill and intangible assets) impairment testing calculations is the expectedgrowth in future cash flows beyond the projection period (terminal growth rate). Management considered the following factors and determined that4.50% (2016: 4.50%) would be an appropriate growth rate to use in these calculations:
The goodwill and intangible assets allocation for Efficient Wealth (Pty) Ltd and its former subsidiary, Naviga Solutions (Pty) Ltd was re-assessed duringthe current year to reflect the appropriate allocation of these cash-generating-units, which were acquired as a group of companies. The sale of NavigaSolutions (Pty) Ltd by Efficient Wealth (Pty) Ltd to the Company during the current year, amongst others, was one of the contributing factors to re-assess these two cash-generating-units. The re-allocation was done based on each cash-generating-unit's proportionate share of the combined value-in-use free-cash flow valuation.
The goodwill and intangible assets allocation for Select Manager (Pty) Ltd and its subsidiary, Stead Wealth Management (Pty) Ltd was re-assessed duringthe current year to reflect the appropriate allocation of these cash-generating-units based on a change in business-model which affected the cash flowsof each of these cash-generating-units estimated on the initial allocation of the goodwill. The re-allocation was done based on each cash-generating-unit's proportionate share of the combined value-in-use free-cash flow valuation.
38

EFFICIENT GROUP LIMITEDGroup and Company Annual Financial Statements
Notes to the financial statements
for the year ended 31 August 2017
3 Goodwill (continued)
Impairment testing of cash-generating-units containing goodwill (continued)
4 Intangible assets
Cost
Accumulated amortisation
and impairments
Carrying amount
R'000 R'000 R'000
2017 - Group
Trade names 5 902 (4 541) 1 361 Customer contracts and customer relationships 191 116 (66 833) 124 283 Computer software 8 794 (3 873) 4 921
205 812 (75 247) 130 565
2016 - Group
Trade names 5 902 (3 877) 2 025 Customer contracts and customer relationships 176 029 (52 185) 123 844 Computer software 8 672 (2 176) 6 496
190 603 (58 238) 132 365
Reconciliation of intangible assets
Opening balance Impairments Disposals
Acquired through business
combinations Additions Amortisation Closing balance
R'000 R'000 R'000 R'000 R'000 R'000 R'000
2017 - Group
Trade names 2 025 - - - - (664) 1 361
123 844 (118) (4 438) 20 008 - (15 013) 124 283 Computer software 6 496 - (6) - 136 (1 705) 4 921
132 365 (118) (4 444) 20 008 136 (17 382) 130 565
2016 - Group
Trade names 3 228 - - - - (1 203) 2 025
130 921 - - 6 398 - (13 475) 123 844 Computer software 6 816 - - - 1 217 (1 537) 6 496
140 965 - - 6 398 1 217 (16 215) 132 365
Management believes that any reasonable possible change in key assumptions on which the recoverable amounts were based would not cause thecarrying amounts of the cash-generating-units attributable to Select Manager (Pty) Ltd and Stead Wealth Management (Pty) Ltd to significantly exceedits recoverable amount after the impairment for the current year was recognised.
Management believes that any reasonable possible change in key assumptions on which the recoverable amounts for all other cash-generating-unitstested for impairment, is based would not cause these cash-generating-units' carrying amounts to exceed their recoverable amounts.
Customer contracts and customer relationships
Customer contracts and customer relationships
The carrying amounts of all other cash-generating-units assessed for impairment was determined to be lower than their recoverable amounts and noimpairment losses were recognised (2016: Rnil).
39

EFFICIENT GROUP LIMITEDGroup and Company Annual Financial Statements
Notes to the financial statements
for the year ended 31 August 2017
4 Intangible assets (continued)
5 Investments in subsidiaries
2017 2016
% %
Efficient Financial Services (Pty) Ltd (1)
Direct 100% 100%
Efficient Wealth (Pty) Ltd (1)Direct 100% 100%
Twist Street Securities (Pty) Ltd (2)Indirect 100% 100%
Efficient Infund Consult (Pty) Ltd (2), (3)Indirect 100% 100%
Efficient Select (Pty) Ltd (1) Direct 100% 100%
Efficient International Investments (Pty) Ltd (4)Indirect - 100%
Boutique Collective Investments (RF) (Pty) Ltd (1)Direct 100% 100%
Boutique Investment Partners (Pty) Ltd (1)Direct 100% 100%
Instit (Pty) Ltd (1)
Direct 100% 100%
Naviga Solutions (Pty) Ltd (1), (5)Direct 100% 100%
Twist Street Collective Investments (Pty) Ltd (6)Indirect 100% 100%
Select Manager (Pty) Ltd (1)Direct 70,48% 70,48%
Stead Wealth Management (Pty) Ltd (7)
Indirect 70,48% 70,48%
Exceed Asset Management (Pty) Ltd (7)Indirect 70,48% 70,48%
Exceed Private Clients (Pty) Ltd (7)Indirect 70,48% 70,48%
W-Allen White Brokers (Pty) Ltd (7)Indirect 70,48% -
Secure Capital Investments (Pty) Ltd (7)Indirect 70,48% -
Efficient Independent Distribution Services (Pty) Ltd (1)Direct 100% -
Efficient Private Clients (Pty) Ltd (8)Direct 50,10% -
Efficient Board of Executors (Pty) Ltd (1)Direct 50,01% 50,01%
Vital Consult Wealth Management (Pty) Ltd (1) Direct 100% -
The majority of the computer software relates to the FutureSight computer software program owned by Naviga Solutions (Pty) Ltd, that is beingdeveloped in-house to service the Group's financial service businesses.
Principal place of business
Republic of South Africa
Republic of South Africa
Republic of South Africa
Republic of South Africa
Republic of South Africa
Republic of South Africa
Republic of South Africa
The following subsidiaries are controlled by the Group through a majority voting rights. The Group has power over these subsidiaries, rights to thevariable returns earned from its involvement with the subsidiaries, and the ability to use its power over the subsidiaries to affect these returns.
The table below details the ownership interest in subsidiaries and represents the legal ownership at the highest sub-group level controlled by the Groupat the reporting date:
Republic of South Africa
Republic of South Africa
Republic of South Africa
Republic of South Africa
Held directly or indirectly by
Company
Republic of South Africa
Republic of South Africa
The remaining useful life of the trade names are between 1 and 18 years (2016: 1 and 19 years), customer contracts and customer relationships, between 1and 18 years (2016: 1 and 19 years) and computer software between 2 and 5 years (2016: 3 and 6 years).
Ownership interest
The impairment of customer contracts and customer relationships was recognised during the current year amounting to R118 334 (2016: Rnil) was due toEfficient Wealth (Pty) Ltd not retaining a specific client to which the intangible asset related to when it was recognised in profit or loss.
Republic of South Africa
Republic of South Africa
The disposal of customer contracts and customer relationships during the current year relates to a disposal of a portion of a business of EfficientFinancial Services (Pty) Ltd.
Republic of South Africa
Republic of South Africa
Republic of South Africa
Republic of South Africa
Republic of South Africa
Republic of South Africa
40

EFFICIENT GROUP LIMITEDGroup and Company Annual Financial Statements
Notes to the financial statements
for the year ended 31 August 2017
5 Investments in subsidiaries (continued)
2017 2016
% %
Efficient Capital (Pty) Ltd (1)
Direct 100% 100%
Efficient Group Central Services (Pty) Ltd (9)Indirect 100% 80%
Efficient Group Swaziland (Pty) Ltd (1)
Direct 51% 51%
Efficient Select Swaziland (Pty) Ltd (10)
Indirect 51% 51%
Midnight Masquerade Investments (Pty) Ltd (1)
Direct 100% 100%
Efficient Group Share Trust (11) Direct - -
2017 2016
R'000 R'000
Carrying amount of investments in subsidiaries
Efficient Financial Services (Pty) Ltd 62 718 47 326 Efficient Wealth (Pty) Ltd 58 573 112 031 Efficient Select (Pty) Ltd 25 158 25 158 Boutique Collective Investments (RF) (Pty) Ltd 900 900 Naviga Solutions (Pty) Ltd 57 059 - Select Manager (Pty) Ltd 107 508 107 508 Efficient Private Clients (Pty) Ltd 1 852 - Vital Consult Wealth Management (Pty) Ltd 222 - Efficient Capital (Pty) Ltd 1 -
313 991 292 923
2017 2016
R'000 R'000
292 923 314 076
21 068 -
- (21 153) 313 991 292 923
Refer to notes 27.3 and 28 for further detail relating to the consideration paid or payable for subsidiaries acquired during the current year.
(4) The investment in this subsidiary was held by Efficient Select (Pty) Ltd prior to its deregistration which took place during the current year.
(6) The investment in this subsidiary is held by Naviga Solutions (Pty) Ltd.
(5) The investment in this subsidiary was held by Efficient Wealth (Pty) Ltd during the prior year. The Company acquired the investment during the current year. As aresult, a portion of the investment held in Efficient Wealth (Pty) Ltd by the Company, has been transferred to Naviga Solutions (Pty) Ltd.
Ownership interest
Republic of South Africa
Republic of South Africa
(9) The investment in this subsidiary is held by Efficient Capital (Pty) Ltd. Efficient Group Central Services (Pty) Ltd had a name change during the current year. Thissubsidiary was previously called Efficient Asset Finance (Pty) Ltd.
Company
Investments in subsidiaries are carried at cost less accumulated impairment losses. The Group holds a majority of voting rights in all subsidiaries at thehighest sub-group level.
Swaziland
Principal place of business
Republic of South Africa
Republic of South Africa
Swaziland
(2) The investments in these subsidiaries are held by Efficient Wealth (Pty) Ltd.
Company
(3) Efficient Infund Consult (Pty) Ltd had a name change during the current year. This subsidiary was previously called Efficient Fiduciary Services (Pty) Ltd. Subsequentto the reporting date, Efficient Infund Consult (Pty) Ltd also changed its name to Efficient Benefits Consulting (Pty) Ltd.
Held directly or indirectly by
Company
(7) The investment in these subsidiaries are held by Select Manager (Pty) Ltd. Select Manager (Pty) Ltd has a 100% ownership interest in all of its subsidiaries except forSecure Capital Investments (Pty) Ltd, in which it has 51% of the ownership interest. Thus, the Group effectively controls 35.94% of Secure Capital Investments (Pty) Ltdbased on the legal structure.
(1) The investment in these subsidiaries are held by the Company.
(8) The investment in this subsidiary is held by the Company (19.40%) and Efficient Select (Pty) Ltd (30.70%).
The Company's investments are reconciled as follows:
Balance at the beginning of the year
Impairment of investments
Balance at the end of the year
(10) The investment in this subsidiary is held by Efficient Group Swaziland (Pty) Ltd. Efficient Group Swaziland (Pty) Ltd has a 51% ownership interest in this subsidiary,thus the Group effectively controls 26% of this subsidiary based on the legal structure.(11) The trust is considered to be a subsidiary as it is a structured entity established by the Company and the Company appoints the trustees of the trust. Therefore, thetrust is controlled by the Company.
The aggregate net profit after tax of the Group's subsidiaries for the current year amounted to R62.93 million (2016: R59.20 million) and the aggregatenet loss after tax amounted to R8.36 million (2016: R7.90 million), including the portion attributable to non-controlling interests. The afore-mentionedamounts exclude the results of the Company, the effects of any intergroup-eliminations and any consolidation entries.
Investments acquired (including increases to previously-held investments)
41
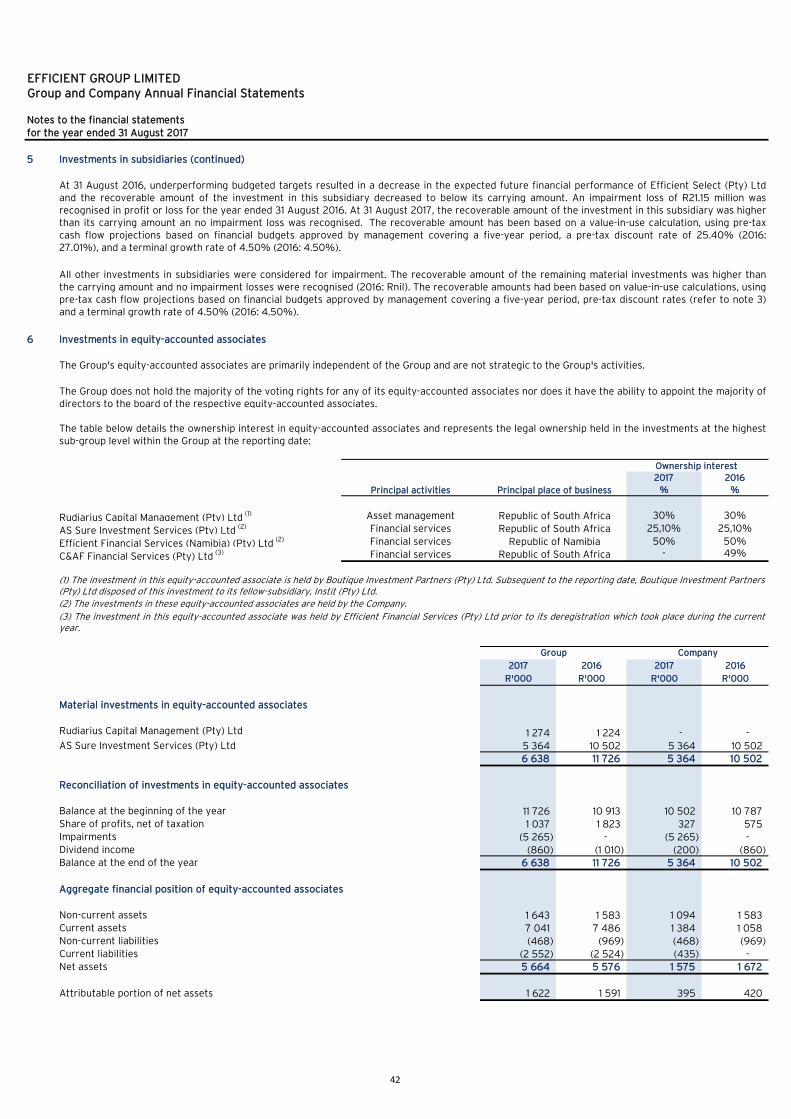
EFFICIENT GROUP LIMITEDGroup and Company Annual Financial Statements
Notes to the financial statements
for the year ended 31 August 2017
5 Investments in subsidiaries (continued)
6 Investments in equity-accounted associates
The Group's equity-accounted associates are primarily independent of the Group and are not strategic to the Group's activities.
2017 2016
% %
30% 30%
25,10% 25,10%
50% 50%- 49%
2017 2016 2017 2016
R'000 R'000 R'000 R'000
Material investments in equity-accounted associates
Rudiarius Capital Management (Pty) Ltd 1 274 1 224 - - AS Sure Investment Services (Pty) Ltd 5 364 10 502 5 364 10 502
6 638 11 726 5 364 10 502
Reconciliation of investments in equity-accounted associates
Balance at the beginning of the year 11 726 10 913 10 502 10 787 Share of profits, net of taxation 1 037 1 823 327 575 Impairments (5 265) - (5 265) - Dividend income (860) (1 010) (200) (860) Balance at the end of the year 6 638 11 726 5 364 10 502
Aggregate financial position of equity-accounted associates
Non-current assets 1 643 1 583 1 094 1 583 Current assets 7 041 7 486 1 384 1 058 Non-current liabilities (468) (969) (468) (969) Current liabilities (2 552) (2 524) (435) - Net assets 5 664 5 576 1 575 1 672
Attributable portion of net assets 1 622 1 591 395 420
Financial services
Financial services
Group Company
(1) The investment in this equity-accounted associate is held by Boutique Investment Partners (Pty) Ltd. Subsequent to the reporting date, Boutique Investment Partners(Pty) Ltd disposed of this investment to its fellow-subsidiary, Instit (Pty) Ltd.
(2) The investments in these equity-accounted associates are held by the Company.
(3) The investment in this equity-accounted associate was held by Efficient Financial Services (Pty) Ltd prior to its deregistration which took place during the currentyear.
All other investments in subsidiaries were considered for impairment. The recoverable amount of the remaining material investments was higher thanthe carrying amount and no impairment losses were recognised (2016: Rnil). The recoverable amounts had been based on value-in-use calculations, usingpre-tax cash flow projections based on financial budgets approved by management covering a five-year period, pre-tax discount rates (refer to note 3)and a terminal growth rate of 4.50% (2016: 4.50%).
Efficient Financial Services (Namibia) (Pty) Ltd (2)
C&AF Financial Services (Pty) Ltd (3)
Principal activities
Asset management
Financial services
Republic of South Africa
Ownership interest
Republic of South Africa
AS Sure Investment Services (Pty) Ltd (2)
Republic of Namibia
Principal place of business
At 31 August 2016, underperforming budgeted targets resulted in a decrease in the expected future financial performance of Efficient Select (Pty) Ltdand the recoverable amount of the investment in this subsidiary decreased to below its carrying amount. An impairment loss of R21.15 million wasrecognised in profit or loss for the year ended 31 August 2016. At 31 August 2017, the recoverable amount of the investment in this subsidiary was higherthan its carrying amount an no impairment loss was recognised. The recoverable amount has been based on a value-in-use calculation, using pre-taxcash flow projections based on financial budgets approved by management covering a five-year period, a pre-tax discount rate of 25.40% (2016:27.01%), and a terminal growth rate of 4.50% (2016: 4.50%).
The table below details the ownership interest in equity-accounted associates and represents the legal ownership held in the investments at the highestsub-group level within the Group at the reporting date:
The Group does not hold the majority of the voting rights for any of its equity-accounted associates nor does it have the ability to appoint the majority ofdirectors to the board of the respective equity-accounted associates.
Republic of South Africa Rudiarius Capital Management (Pty) Ltd (1)
42
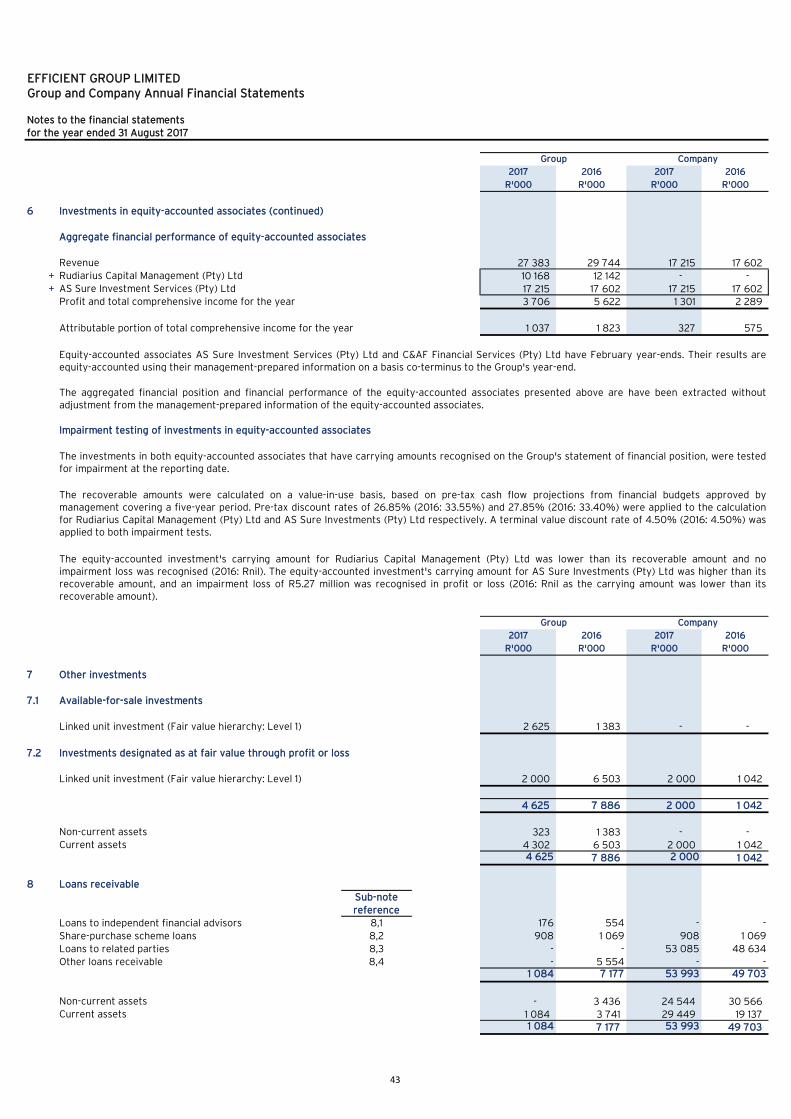
EFFICIENT GROUP LIMITEDGroup and Company Annual Financial Statements
Notes to the financial statements
for the year ended 31 August 2017
2017 2016 2017 2016
R'000 R'000 R'000 R'000
6 Investments in equity-accounted associates (continued)
Aggregate financial performance of equity-accounted associates
Revenue 27 383 29 744 17 215 17 602 + Rudiarius Capital Management (Pty) Ltd 10 168 12 142 - - + AS Sure Investment Services (Pty) Ltd 17 215 17 602 17 215 17 602
Profit and total comprehensive income for the year 3 706 5 622 1 301 2 289
Attributable portion of total comprehensive income for the year 1 037 1 823 327 575
Impairment testing of investments in equity-accounted associates
2017 2016 2017 2016
R'000 R'000 R'000 R'000
7 Other investments
7.1 Available-for-sale investments
Linked unit investment (Fair value hierarchy: Level 1) 2 625 1 383 - -
7.2 Investments designated as at fair value through profit or loss
Linked unit investment (Fair value hierarchy: Level 1) 2 000 6 503 2 000 1 042
4 625 7 886 2 000 1 042
Non-current assets 323 1 383 - - Current assets 4 302 6 503 2 000 1 042
4 625 7 886 2 000 1 042
8 Loans receivable
Sub-note
reference
Loans to independent financial advisors 8,1 176 554 - -
Share-purchase scheme loans 8,2 908 1 069 908 1 069
Loans to related parties 8,3 - - 53 085 48 634
Other loans receivable 8,4 - 5 554 - - 1 084 7 177 53 993 49 703
Non-current assets - 3 436 24 544 30 566 Current assets 1 084 3 741 29 449 19 137
1 084 7 177 53 993 49 703
Group
The recoverable amounts were calculated on a value-in-use basis, based on pre-tax cash flow projections from financial budgets approved bymanagement covering a five-year period. Pre-tax discount rates of 26.85% (2016: 33.55%) and 27.85% (2016: 33.40%) were applied to the calculationfor Rudiarius Capital Management (Pty) Ltd and AS Sure Investments (Pty) Ltd respectively. A terminal value discount rate of 4.50% (2016: 4.50%) wasapplied to both impairment tests.
The equity-accounted investment's carrying amount for Rudiarius Capital Management (Pty) Ltd was lower than its recoverable amount and noimpairment loss was recognised (2016: Rnil). The equity-accounted investment's carrying amount for AS Sure Investments (Pty) Ltd was higher than itsrecoverable amount, and an impairment loss of R5.27 million was recognised in profit or loss (2016: Rnil as the carrying amount was lower than itsrecoverable amount).
Equity-accounted associates AS Sure Investment Services (Pty) Ltd and C&AF Financial Services (Pty) Ltd have February year-ends. Their results areequity-accounted using their management-prepared information on a basis co-terminus to the Group's year-end.
Group
The investments in both equity-accounted associates that have carrying amounts recognised on the Group's statement of financial position, were testedfor impairment at the reporting date.
Company
Company
The aggregated financial position and financial performance of the equity-accounted associates presented above are have been extracted withoutadjustment from the management-prepared information of the equity-accounted associates.
43
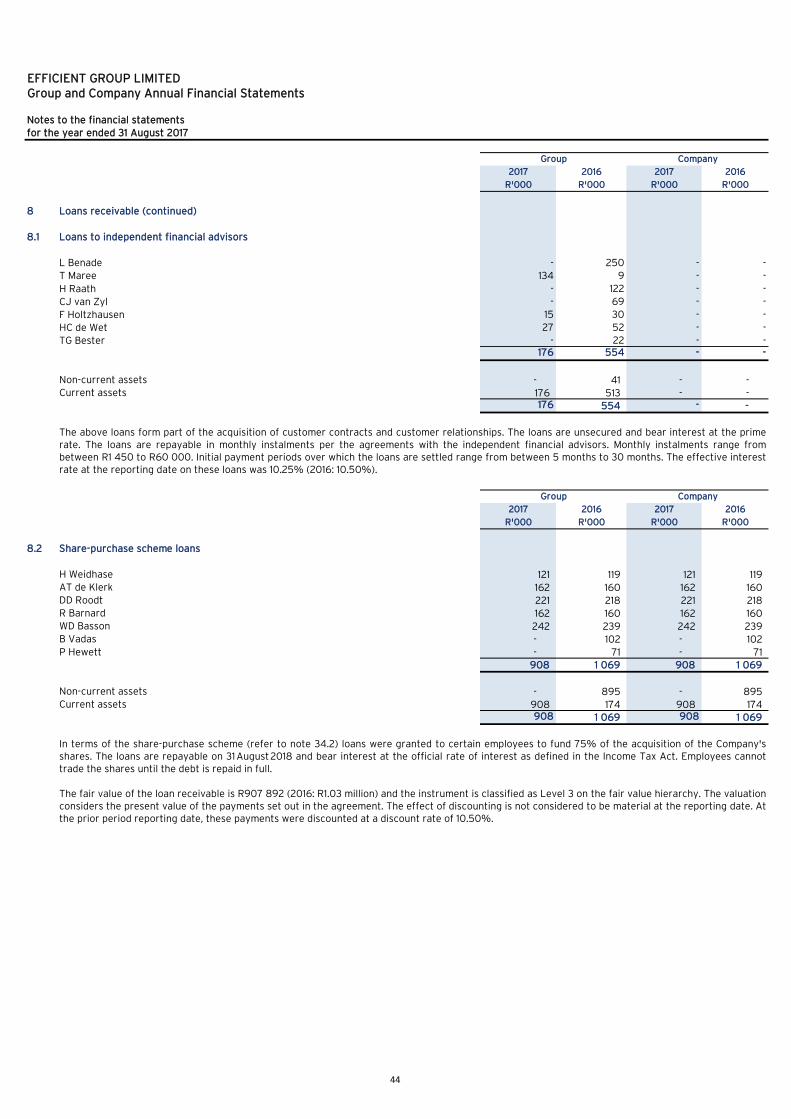
EFFICIENT GROUP LIMITEDGroup and Company Annual Financial Statements
Notes to the financial statements
for the year ended 31 August 2017
2017 2016 2017 2016
R'000 R'000 R'000 R'000
8 Loans receivable (continued)
8.1 Loans to independent financial advisors
L Benade - 250 - -
T Maree 134 9 - -
H Raath - 122 - -
CJ van Zyl - 69 - -
F Holtzhausen 15 30 - -
HC de Wet 27 52 - -
TG Bester - 22 - - 176 554 - -
Non-current assets - 41 - - Current assets 176 513 - -
176 554 - -
2017 2016 2017 2016
R'000 R'000 R'000 R'000
8.2 Share-purchase scheme loans
H Weidhase 121 119 121 119 AT de Klerk 162 160 162 160 DD Roodt 221 218 221 218 R Barnard 162 160 162 160 WD Basson 242 239 242 239 B Vadas - 102 - 102
P Hewett - 71 - 71
908 1 069 908 1 069
Non-current assets - 895 - 895 Current assets 908 174 908 174
908 1 069 908 1 069
Company
In terms of the share-purchase scheme (refer to note 34.2) loans were granted to certain employees to fund 75% of the acquisition of the Company'sshares. The loans are repayable on 31 August 2018 and bear interest at the official rate of interest as defined in the Income Tax Act. Employees cannottrade the shares until the debt is repaid in full.
The fair value of the loan receivable is R907 892 (2016: R1.03 million) and the instrument is classified as Level 3 on the fair value hierarchy. The valuationconsiders the present value of the payments set out in the agreement. The effect of discounting is not considered to be material at the reporting date. Atthe prior period reporting date, these payments were discounted at a discount rate of 10.50%.
Group Company
The above loans form part of the acquisition of customer contracts and customer relationships. The loans are unsecured and bear interest at the primerate. The loans are repayable in monthly instalments per the agreements with the independent financial advisors. Monthly instalments range frombetween R1 450 to R60 000. Initial payment periods over which the loans are settled range from between 5 months to 30 months. The effective interestrate at the reporting date on these loans was 10.25% (2016: 10.50%).
Group
44

EFFICIENT GROUP LIMITEDGroup and Company Annual Financial Statements
Notes to the financial statements
for the year ended 31 August 2017
2017 2016 2017 2016
R'000 R'000 R'000 R'000
8 Loans receivable (continued)
8.3 Loans to related parties
Term loans
Efficient Financial Services (Pty) Ltd - - - 16 892
Working capital loans
Efficient Financial Services (Pty) Ltd - - 15 695 12 779 Efficient Select (Pty) Ltd - - 6 573 3 861 Efficient Capital (Pty) Ltd - - 13 767 3 000 Select Manager (Pty) Ltd - - 3 815 - Efficient Private Clients (Pty) Ltd - - 1 309 - Vital Consult Wealth Management (Pty) Ltd - - 188 -
- - 41 347 19 640
Other loans
Efficient Select (Pty) Ltd - - - 67 Vital Consult Wealth Management (Pty) Ltd - - 779 - Efficient Capital (Pty) Ltd - - 10 420 10 888 Efficient Group Central Services (Pty) Ltd - - - 657 Efficient Group Share Trust - - 539 490
- - 11 738 12 102
- - 53 085 48 634
Non-current assets - - 24 544 29 671 Current assets - - 28 541 18 963
- - 53 085 48 634
The other loans are unsecured and interest-free with no repayment terms. At 31 August 2017, the Company has agreed not to recall the loan payable byVital Consult Wealth Management (Pty) Ltd at least until 30 November 2018. The fair value of this loan at 31 August 2017 was R691 307. The fair valuehierarchy is Level 3. The valuation considered the present value of the payment agreed upon by the parties, discounted using a rate of 10.25%.
The term loan receivable from Efficient Financial Services (Pty) Ltd was unsecured, interest-free and had no repayment terms, other than the Companyagreeing not to recall repayment before 30 September 2017. This loan was settled during the current year and its fair value at 31 August 2016 was R15.08 million. The fair value hierarchy was Level 3. The valuation considered the present value of the payment agreed upon by the parties, discounted using arate of 10.50%.
Group Company
The working capital loans receivable from Efficient Financial Services (Pty) Ltd, Efficient Select (Pty) Ltd and Vital Consult Wealth Management (Pty) Ltdbear interest at the JIBAR rate plus 3.75% and the effective interest rate for these loans at the reporting date was 10.83% (2016: 11.10%). These loans donot have any fixed repayment terms, however, the Company has agreed at 31 August 2017 not to recall payment on these loans at least up to 30November 2018.
The working capital loan receivable from Efficient Capital (Pty) Ltd bears interest at the JIBAR rate plus 2.95%. The effective interest rate on this loan atthe reporting date was 10.03% (2016: 10.30%). This loan has no fixed repayment terms.
The working capital loans are unsecured and interest-bearing.
The working capital loan receivable from Efficient Private Clients (Pty) Ltd, advanced during the current year bears interest at the prime rate and has nofixed terms of repayment. At 31 August 2017, the Company has agreed with this subsidiary not to recall payment on this loan at least up to 30 September2018. The effective interest rate at the reporting date on this loan was 10.25%. The intention of the Company not to recall payment on this loan is subjectto the other shareholders of this subsidiary also honouring their agreement to do the same.
The working capital loan receivable from Select Manager (Pty) Ltd, advanced during the current year, bears interest at the prime interest rate plus 2%(effectively 12.25% at the reporting date). This loan is repayable on 1 March 2018 as agreed to by the subsidiary with the Company and its othershareholders. In addition to the repayment of this loan, any balance payable on the loan at repayment date, will also be deducted from the forwardpurchase phase two liability per note 15.2.
45
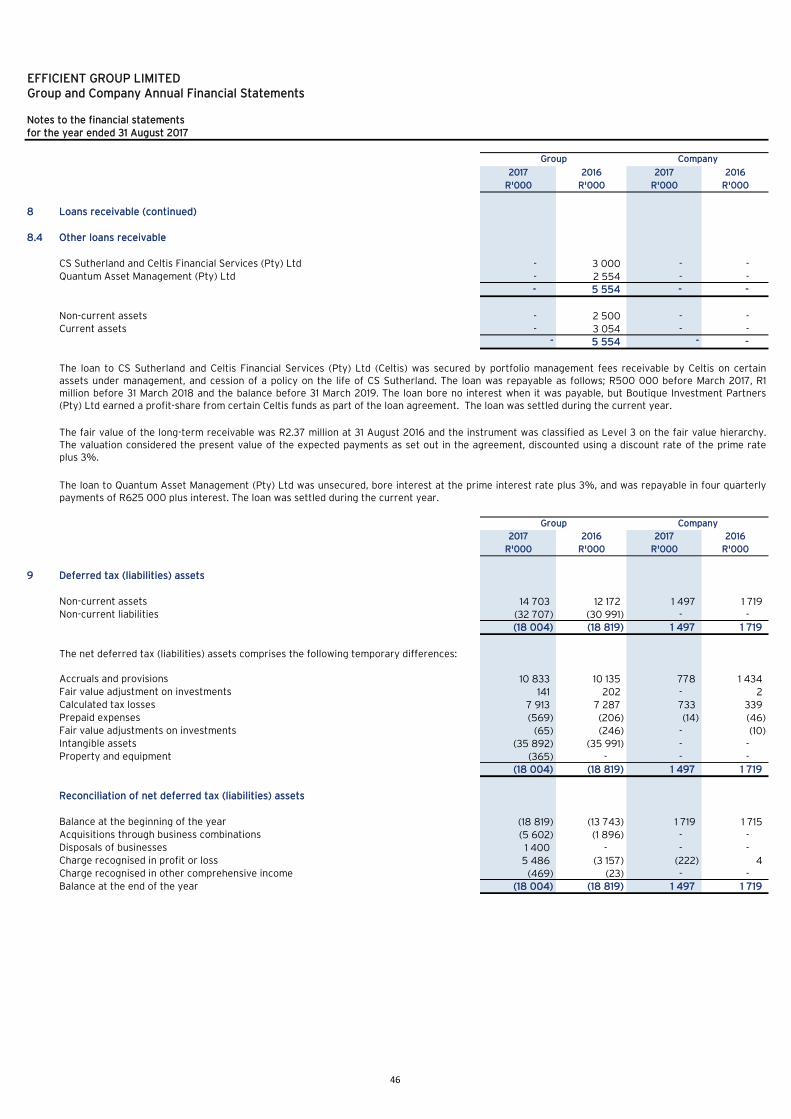
EFFICIENT GROUP LIMITEDGroup and Company Annual Financial Statements
Notes to the financial statements
for the year ended 31 August 2017
2017 2016 2017 2016
R'000 R'000 R'000 R'000
8 Loans receivable (continued)
8.4 Other loans receivable
- 3 000 - -
- 2 554 - -
- 5 554 - -
Non-current assets - 2 500 - - Current assets - 3 054 - -
- 5 554 - -
2017 2016 2017 2016
R'000 R'000 R'000 R'000
9 Deferred tax (liabilities) assets
Non-current assets 14 703 12 172 1 497 1 719 Non-current liabilities (32 707) (30 991) - -
(18 004) (18 819) 1 497 1 719
Accruals and provisions 10 833 10 135 778 1 434 Fair value adjustment on investments 141 202 - 2 Calculated tax losses 7 913 7 287 733 339 Prepaid expenses (569) (206) (14) (46) Fair value adjustments on investments (65) (246) - (10) Intangible assets (35 892) (35 991) - - Property and equipment (365) - - -
(18 004) (18 819) 1 497 1 719
Reconciliation of net deferred tax (liabilities) assets
Balance at the beginning of the year (18 819) (13 743) 1 719 1 715 Acquisitions through business combinations (5 602) (1 896) - - Disposals of businesses 1 400 - - - Charge recognised in profit or loss 5 486 (3 157) (222) 4 Charge recognised in other comprehensive income (469) (23) - - Balance at the end of the year (18 004) (18 819) 1 497 1 719
The fair value of the long-term receivable was R2.37 million at 31 August 2016 and the instrument was classified as Level 3 on the fair value hierarchy.The valuation considered the present value of the expected payments as set out in the agreement, discounted using a discount rate of the prime rateplus 3%.
CS Sutherland and Celtis Financial Services (Pty) Ltd
The loan to CS Sutherland and Celtis Financial Services (Pty) Ltd (Celtis) was secured by portfolio management fees receivable by Celtis on certainassets under management, and cession of a policy on the life of CS Sutherland. The loan was repayable as follows; R500 000 before March 2017, R1million before 31 March 2018 and the balance before 31 March 2019. The loan bore no interest when it was payable, but Boutique Investment Partners(Pty) Ltd earned a profit-share from certain Celtis funds as part of the loan agreement. The loan was settled during the current year.
Group Company
Quantum Asset Management (Pty) Ltd
Group Company
The net deferred tax (liabilities) assets comprises the following temporary differences:
The loan to Quantum Asset Management (Pty) Ltd was unsecured, bore interest at the prime interest rate plus 3%, and was repayable in four quarterlypayments of R625 000 plus interest. The loan was settled during the current year.
46

EFFICIENT GROUP LIMITEDGroup and Company Annual Financial Statements
Notes to the financial statements
for the year ended 31 August 2017
9 Deferred tax (liabilities) assets (continued)
2017 2016 2017 2016
R'000 R'000 R'000 R'000
10 Trade and other receivables
Trade receivables 95 599 75 688 16 617 3 942 Staff loans 840 1 22 - Prepaid expenses 1 920 1 514 51 174 Prepaid commission clawback 3 061 - - - Deposits 656 451 - - VAT receivable 2 588 363 - - Other receivables 5 539 1 659 1 404 104
110 203 79 676 18 094 4 220
11 Cash and cash equivalents
Cash on hand 13 10 - 1 Call bank accounts 78 197 58 151 187 85 Current bank accounts 28 726 31 957 1 944 3 114 Bank overdrafts (8 895) - (8 832) -
98 041 90 118 (6 701) 3 200
Current assets 106 936 90 118 2 131 3 200 Current liabilities (8 895) - (8 832) -
98 041 90 118 (6 701) 3 200
12 Share capital and share premium
Share capital
Authorised361 350 000 ordinary shares of R 0.00000277 each 1 1 1 1
Issued90 592 973 ordinary shares of R 0.00000277 each - - - -
Share premium
Share premium on shares issued 150 325 150 325 263 530 263 530
Refer to note 17 for further detail relating to the prepaid commission clawback.
Group Company
Deferred tax assets includes an amount of R10.97 million (2016: R10.34 million) for the Group and R778 115 (2016: R1.43 million) for the Company, relatingto temporary differences on current assets and current liabilities. Deferred tax assets includes an amount of R7.91 million (2016: R7.28 million) for theGroup and R733 395 (2016: R337 593) for the Company, relating to temporary differences on non-current assets and non-current liabilities. The deferredtax assets relating to current assets and current liabilities are expected to realise within 12 months.
The interest rate on surplus cash held included in the bank balances at the reporting datewas 7.56% (2016: 7.60%). The Group incurs interest on its bank overdraft facility at a rateof 11.25% (2016: not applicable).
The unissued ordinary shares are under the control of the directors in terms of a resolution of shareholders passed at the last annual general meeting.This authority remains in force until the next annual general meeting.
Deferred tax liabilities includes an amount of R634 365 (2016: R452 000) for the Group and R14 358 (2016: R53 857) for the Company, relating totemporary differences on current assets and current liabilities. Deferred tax liabilities includes an amount of R36.26 million (2016: R35.99 million) for theGroup, relating to temporary differences on non-current assets and non-current liabilities. The deferred tax liabilities relating to current assets andcurrent liabilities are expected to be settled within 12 months.
The utilisation of the deferred tax asset raised on calculated losses is dependent on future taxable profits in excess of the profits arising from thereversal of existing taxable temporary differences. Management is confident that the deferred tax assets recognised will be recovered in future yearsbased on approved budgets and forecasts.
47

EFFICIENT GROUP LIMITEDGroup and Company Annual Financial Statements
Notes to the financial statements
for the year ended 31 August 2017
13 Nature of reserves
13.1 Treasury share reserve
13.2 Accumulated income (losses)
13.3 Fair value adjustment reserve
13.4 Revaluation reserve
14 Non-controlling interests
The table below sets out the subsidiaries of the Group which have non-controlling interests (NCIs):
2017 2016
% %
74% 74%
- 20%
49,99% 49,99%
49,90% -
49% -
Financial position and financial performance of subsidiaries with NCIs
Efficient Board of
Executors (Pty) Ltd
Efficient PrivateClients
(Pty) Ltd
Secure Capital
Investments(Pty) Ltd
NCI -49.99%
NCI - 49.90%
NCI -49%
R'000 R'000 R'000
2017 - Group
Revenue 1 387 8 465 841
(Loss) profit and total comprehensive income for the year (23) (1 862) 69
(11) (929) 34
Non-current assets 17 11 292 4 387 Current assets 36 3 261 564 Non-current liabilities - (4 460) (1 199) Current liabilities (100) (2 418) (110) Net (liabilities) assets (47) 7 675 3 642
Net (liabilities) assets attributable to NCIs (23) 3 830 1 785
Financial Services Republic of South Africa
Efficient Select Swaziland (Pty) Ltd (1)
Efficient Group Central Services (Pty) Ltd (2)
This reserve represents cumulative earnings or losses incurred through profit or loss, net of dividends declared and cumulative transfers from othercomponents in equity.
Services and Solutions
Efficient Board of Executors (Pty) Ltd
Efficient Private Clients (Pty) Ltd
(1) The holding company of this subsidiary, Efficient Group Swaziland (Pty) Ltd also has a NCI of 49%, however, this holding company did not have any net assets ortotal comprehensive income during the current and prior years.
Republic of South AfricaOther
Services and Solutions
The revaluation reserve relates to the revaluation of property and represents cumulative revaluation adjustments recognised in other comprehensiveincome.
Operating segment Principal place of business
Investments
Republic of South Africa
Republic of South Africa
Swaziland
The following table summarises the financial information of subsidiaries with NCIs prepared in accordance with IFRS. The information is presentedincluding the effects of consolidation entries processed in the Group's financial statements which affects the non-controlling interests.
NCI ownership interest
The fair value reserve comprises the cumulative net change in the fair value (unrealised fair value adjustments) of available-for-sale investments until theassets are derecognised or impaired. This is recognised in equity through other comprehensive income. Upon realisation of these fair value adjustments,the same are transferred from the fair value adjustment reserve to accumulated income through profit or loss.
(Loss) profit and total comprehensive income for the year attributable to NCIs
Secure Capital Investments (Pty) Ltd
The Efficient Group Share Trust holds 320 668 (2016: 260 834) shares in the Company. These shares are disclosed in the treasury share reserve.
(2) The operating segment in which Efficient Group Central Services (Pty) Ltd operates changed due to it being the Group's administration and support services companyduring the current year, compared to it being established to provide asset-finance previously (previously in the Financial Services cluster).
48
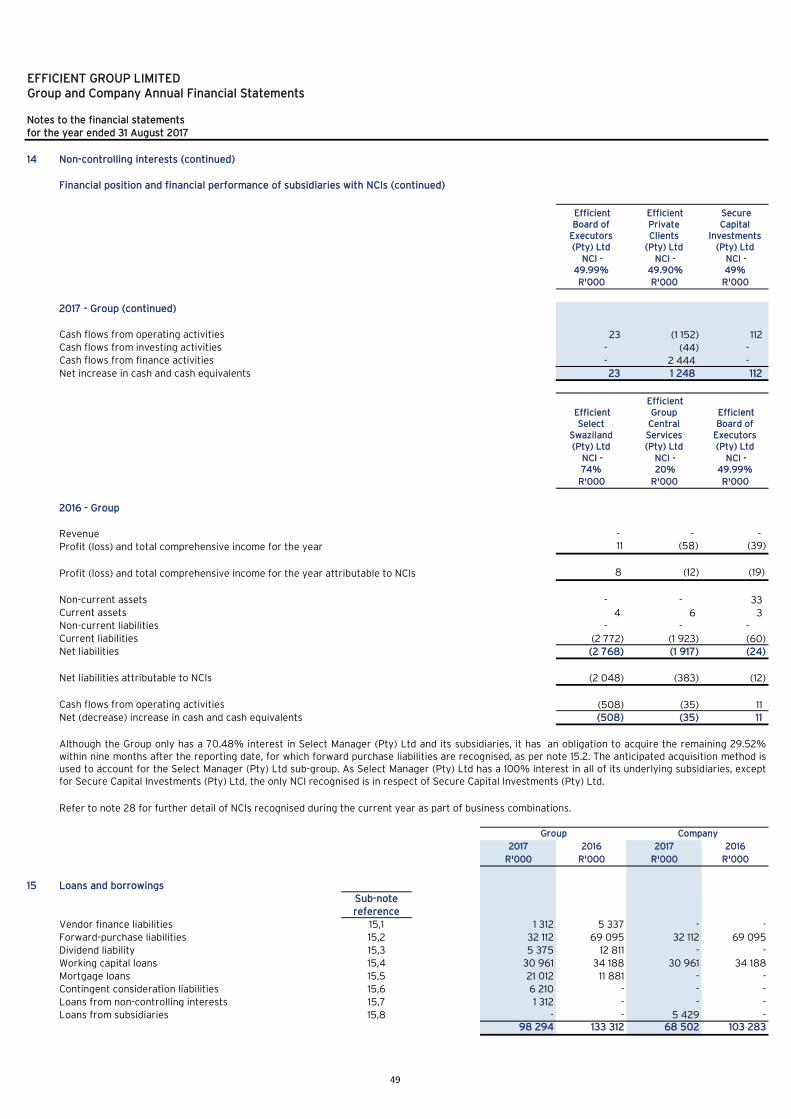
EFFICIENT GROUP LIMITEDGroup and Company Annual Financial Statements
Notes to the financial statements
for the year ended 31 August 2017
14 Non-controlling interests (continued)
Financial position and financial performance of subsidiaries with NCIs (continued)
Efficient Board of
Executors (Pty) Ltd
Efficient PrivateClients
(Pty) Ltd
Secure Capital
Investments(Pty) Ltd
NCI -49.99%
NCI - 49.90%
NCI -49%
R'000 R'000 R'000
2017 - Group (continued)
Cash flows from operating activities 23 (1 152) 112 Cash flows from investing activities - (44) - Cash flows from finance activities - 2 444 -
23 1 248 112
Efficient Select
Swaziland (Pty) Ltd
EfficientGroup
CentralServices(Pty) Ltd
Efficient Board of
Executors (Pty) Ltd
NCI -74%
NCI - 20%
NCI -49.99%
R'000 R'000 R'000
2016 - Group
Revenue - - -
Profit (loss) and total comprehensive income for the year 11 (58) (39)
8 (12) (19)
Non-current assets - - 33 Current assets 4 6 3 Non-current liabilities - - - Current liabilities (2 772) (1 923) (60) Net liabilities (2 768) (1 917) (24)
Net liabilities attributable to NCIs (2 048) (383) (12)
Cash flows from operating activities (508) (35) 11 (508) (35) 11
2017 2016 2017 2016
R'000 R'000 R'000 R'000
15 Loans and borrowings
Sub-note
reference
Vendor finance liabilities 15,1 1 312 5 337 - -
Forward-purchase liabilities 15,2 32 112 69 095 32 112 69 095
Dividend liability 15,3 5 375 12 811 - -
Working capital loans 15,4 30 961 34 188 30 961 34 188
Mortgage loans 15,5 21 012 11 881 - -
Contingent consideration liabilities 15,6 6 210 - - -
Loans from non-controlling interests 15,7 1 312 - - -
Loans from subsidiaries 15,8 - - 5 429 - 98 294 133 312 68 502 103 283
Refer to note 28 for further detail of NCIs recognised during the current year as part of business combinations.
Although the Group only has a 70.48% interest in Select Manager (Pty) Ltd and its subsidiaries, it has an obligation to acquire the remaining 29.52%within nine months after the reporting date, for which forward purchase liabilities are recognised, as per note 15.2. The anticipated acquisition method isused to account for the Select Manager (Pty) Ltd sub-group. As Select Manager (Pty) Ltd has a 100% interest in all of its underlying subsidiaries, exceptfor Secure Capital Investments (Pty) Ltd, the only NCI recognised is in respect of Secure Capital Investments (Pty) Ltd.
Net increase in cash and cash equivalents
Profit (loss) and total comprehensive income for the year attributable to NCIs
Net (decrease) increase in cash and cash equivalents
Group Company
49

EFFICIENT GROUP LIMITEDGroup and Company Annual Financial Statements
Notes to the financial statements
for the year ended 31 August 2017
2017 2016 2017 2016
R'000 R'000 R'000 R'000
15 Loans and borrowings (continued)
Non-current liabilities 28 011 85 465 4 950 70 456 Current liabilities 70 283 47 847 63 552 32 827
98 294 133 312 68 502 103 283
15.1 Vendor finance liabilities
1 312 5 337 - -
Non-current liabilities 1 202 1 657 - - Current liabilities 110 3 680 - -
1 312 5 337 - -
2017 2016 2017 2016
R'000 R'000 R'000 R'000
15.2 Forward purchase liabilities
Phase one liability - 14 210 - 14 210 Phase two liability 32 112 54 885 32 112 54 885
32 112 69 095 32 112 69 095
Non-current liabilities - 54 885 - 54 885
Current liabilities 32 112 14 210 32 112 14 210
32 112 69 095 32 112 69 095
69 095 95 006 69 095 95 006
(15 001) (30 572) (15 001) (30 572)
(21 982) 4 661 (21 982) 4 661
32 112 69 095 32 112 69 095
2017 2016 2017 2016
R'000 R'000 R'000 R'000
15.3
Dividend liability 5 375 12 811 - -
Non-current liabilities - 1 977 - Current liabilities 5 375 10 834 -
5 375 12 811 - -
These loans form part of the acquisition of intangible assets. The loans are unsecured, interest-free and repayable at various instalment dates andamounts. The last instalment is payable in 2019. The fair value of the outstanding liabilities at the reporting date is R1.24 million (2016: R4.94 million). Thefair value hierarchy is Level 3. The valuation considers the present value of the payments set out in the agreements, discounted using a discount rate of10.25% (2016: 10.50%).
Group Company
The phase one and two liabilities relate to the acquisition of Select Manager (Pty) Ltd and its subsidiaries. It is classified as at fair value through profit orloss and is repayable on 1 March 2018. The fair value hierarchy is Level 3. The valuation considers the present value of the expected payments set out inthe contract. The payments were discounted using a discount rate of 7.75% at 31 August 2016. No discounting was applied at 31 August 2017 due to theshort period in which the phase two liability will be settled after the reporting date.
Company
Group Company
Reconciliation of forward purchase liabilities
Balance at the beginning of the year
Payments and settlements during the year
Re-measurement adjustments recognised in profit or loss
Balance at the end of the year
The unobservable inputs for calculating the forward purchase liabilities include budgets and forecasts, the conversion ratio of independent financialadvisor book buys, profit targets and free-cash flows. The fair value and carrying amount of the liabilities would increase or decrease with any reasonable change in the inputs used.
Group
Dividend liability
Loans for the acquisition of customer contracts and customer relationships
50

EFFICIENT GROUP LIMITEDGroup and Company Annual Financial Statements
Notes to the financial statements
for the year ended 31 August 2017
2017 2016 2017 2016
R'000 R'000 R'000 R'000
15 Loans and borrowings (continued)
15.3
12 811 15 336 - -
(6 860) (4 453) - -
(576) 1 928 - -
5 375 12 811 - -
2017 2016 2017 2016
R'000 R'000 R'000 R'000
15.4 Working capital loans
Facility A 5 738 13 388 5 738 13 388 Facility B 5 573 9 250 5 573 9 250
Facility C 6 750 8 550 6 750 8 550
Facility D 12 900 3 000 12 900 3 000
30 961 34 188 30 961 34 188
Non-current liabilities 4 950 15 571 4 950 15 571
Current liabilities 26 011 18 617 26 011 18 617
30 961 34 188 30 961 34 188
2017 2016 2017 2016
R'000 R'000 R'000 R'000
15.5 Mortgage loans
11 643 11 881 - -
9 369 - - - 21 012 11 881 - -
Company
Company
Catnia building loan
Dely property loan
Balance at the beginning of the year
Group Company
Dividend liability (continued)
Reconciliation of dividend liability
Payments and settlements during the year
Re-measurement adjustments recognised in profit or loss
Balance at the end of the year
The loans relate to an amortising term loan from Standard Bank of South Africa Ltd to assist the subsidiaries with their respective working capitalrequirements, and consists of four loan facilities. The loans are guaranteed by Efficient Financial Services (Pty) Ltd, Efficient Wealth (Pty) Ltd, BoutiqueInvestment Partners (Pty) Ltd and Naviga Solutions (Pty) Ltd. These loans are subject to certain loan covenants, all of which have been met during thecurrent and prior years.
Facility A bears interest at JIBAR plus 3.75% per annum and is repayable in 16 equal and quarterly payments of R1.91 million plus interest accrued for theperiod. This facility shall be fully repaid by 31 May 2018. The effective interest rate at the reporting date was 10.83% (2016: 11.10%).
The liability relates to the future dividends expected to be paid to legal non-controlling shareholders of Select Manager (Pty) Ltd, until the Groupacquires the remaining 20.52% from these shareholders as per the forward purchase agreement. The liability is classified as at fair value through profitor loss. The fair value hierarchy is Level 3. The valuation considers the present value of the expected payments set out in the dividend policy per theshareholders' agreement. The expected payments at 31 August 2016 were discounted using a discount rate of 7.75%. No discounting was applied to theexpected payments due at 31 August 2017, due to the short period in which the liability will be settled after the reporting date. The unobservable inputsfor calculating the dividend liability include budgets and forecasts, planned independent financial advisor book buys, profit targets and free-cash flows.The fair value and carrying amount of the liability would increase or decrease with any reasonable change in the inputs used.
Group
Facility B bears interest at JIBAR plus 3.50% per annum and is repayable in 12 variable quarterly capital payments plus interest accrued for the period.This facility shall be fully repaid by 28 February 2018. The effective interest rate at the reporting date was 10.58% (2016: 10.85%).
Facility C bears interest at JIBAR plus 3.95% per annum and is repayable in 20 quarterly and equal capital payments of R450 000 plus interest accruedfor the period. This facility shall be fully repaid by 31 May 2021. The effective interest rate at the reporting date was 11.03% (2016: 11.30%).
Facility D is to finance renovations at the Group's Dely property in Hazelwood, Pretoria. The facility bears interest at JIBAR plus 2.95% per annum andbased on the current terms is due for settlement by 30 November 2017. The effective interest rate at the reporting date was 10.03% (2016: 10.30%).
Group
51

EFFICIENT GROUP LIMITEDGroup and Company Annual Financial Statements
Notes to the financial statements
for the year ended 31 August 2017
2017 2016 2017 2016
R'000 R'000 R'000 R'000
15 Loans and borrowings (continued)
15.5
Non-current liabilities 19 780 11 375 - - Current liabilities 1 232 506 - -
21 012 11 881 - -
2017 2016 2017 2016
R'000 R'000 R'000 R'000
15.6
Wayne Allen-White 1 876 - - -
Jacques Jacobs 4 334 - - -
6 210 - - -
Non-current liabilities 767 - - -
Current liabilities 5 443 - - -
6 210 - - -
2017 2016 2017 2016
R'000 R'000 R'000 R'000
15.7
DD Roodt 652 - - - AH Ernst 396 - - E Viljoen 264 - - -
1 312 - - -
Non-current liabilities 1 312 - - - Current liabilities - - - -
1 312 - - -
The liability payable to Wayne Allen-White for the acquisition of W-Allen White Brokers (Pty) Ltd is contractually due to be settled at 31 May 2018.
The Catnia building loan bears interest at the prime interest rate less 1%. The capital is repayable in 60 escalating monthly instalments and shall be fullyrepaid by 31 May 2021. The effective interest rate on this loan at the reporting date was 9.25% (2016: 9.50%).
Company
The Dely property loan, which was advanced during the current year, bears interest at the prime interest rate less 0.75%. The capital is repayable in 60escalating monthly instalments and shall be fully repaid by 31 March 2022. The effective interest rate on this loan at the reporting date was 9.50%.
The above liabilities represent the balance of the purchase price payable for the acquisition of W-Allen White Brokers (Pty) Ltd and Secure CapitalInvestments (Pty) Ltd, which were acquired during the current year by Select Manager (Pty) Ltd. Refer to note 28. The amount payable is dependent onthe value of additional assets invested by the clients of W-Allen White Brokers (Pty) Ltd and Secure Capital Investments (Pty) Ltd in the CollectiveInvestment Schemes managed by Select Manager (Pty) Ltd, up to the measurement date; as well as an earnings multiple as stipulated in the purchaseagreement. No interest is charged on these liabilities.
The liability payable to Jacques Jacobs for the acquisition of Secure Capital Investments (Pty) Ltd is contractually due to be settled in two instalmentsamounting to R3.57 million and R766 800 which are due on 28 February 2018 and 28 February 2021 respectively.
The liabilities are recognised at fair value and represents management's best estimate of the amounts payable under the acquisition agreements. Thefair value hierarchy for this liability is Level 3. The valuation considers the present value of expected payments to be made. The effect of discounting ofthis liability was not considered to be material. The fair value and carrying amount of the liabilities would increase or decrease with any reasonablechange in the inputs used. There were no gains or losses recognised during the current year for these liabilities.
Loans from non-controlling interests
Group
Contingent consideration liabilities
Both loans are amortising term loans payable by Efficient Capital (Pty) Ltd from Standard Bank of South Africa Ltd and are secured by property with acarrying amount of R46.81 million (2016: R21.10 million). Refer to note 2.
Group Company
Mortgage loans (continued)
Group Company
52
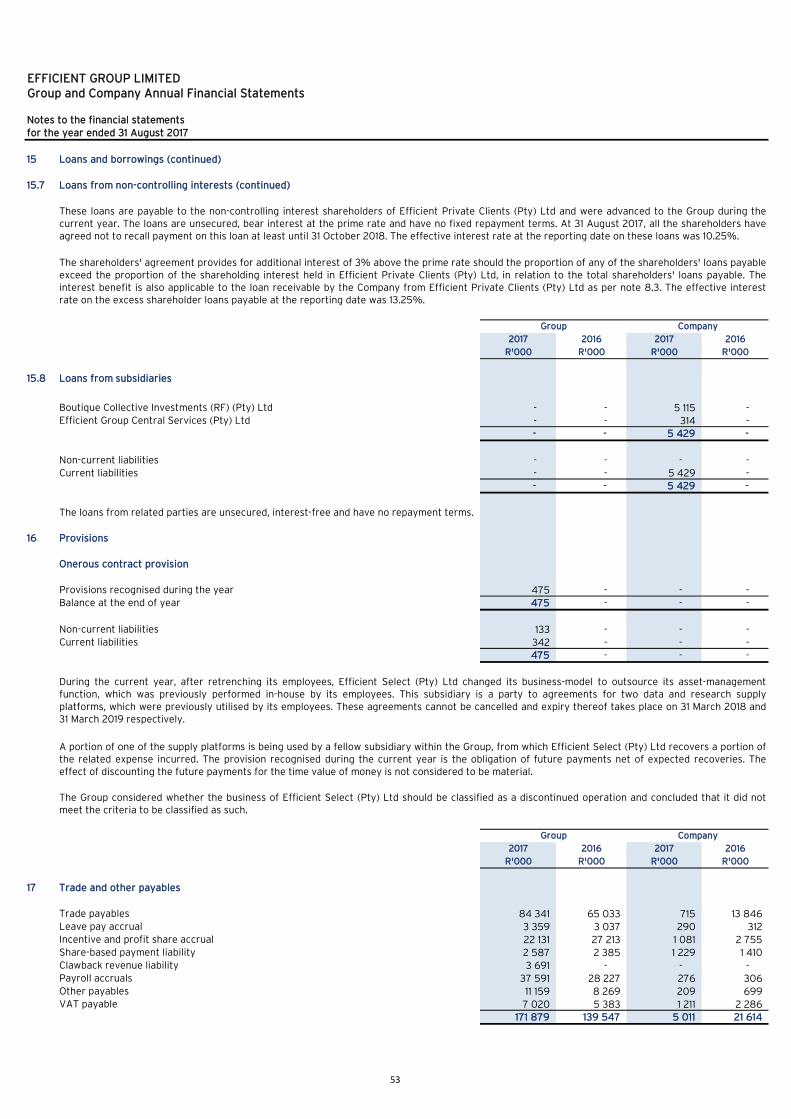
EFFICIENT GROUP LIMITEDGroup and Company Annual Financial Statements
Notes to the financial statements
for the year ended 31 August 2017
15 Loans and borrowings (continued)
15.7
2017 2016 2017 2016
R'000 R'000 R'000 R'000
15.8
Boutique Collective Investments (RF) (Pty) Ltd - - 5 115 - Efficient Group Central Services (Pty) Ltd - - 314 -
- - 5 429 -
Non-current liabilities - - - -
Current liabilities - - 5 429 -
- - 5 429 -
16
Provisions recognised during the year 475 - - - Balance at the end of year 475 - - -
Non-current liabilities 133 - - - Current liabilities 342 - - -
475 - - -
2017 2016 2017 2016
R'000 R'000 R'000 R'000
17 Trade and other payables
Trade payables 84 341 65 033 715 13 846 Leave pay accrual 3 359 3 037 290 312 Incentive and profit share accrual 22 131 27 213 1 081 2 755 Share-based payment liability 2 587 2 385 1 229 1 410 Clawback revenue liability 3 691 - - - Payroll accruals 37 591 28 227 276 306 Other payables 11 159 8 269 209 699 VAT payable 7 020 5 383 1 211 2 286
171 879 139 547 5 011 21 614
A portion of one of the supply platforms is being used by a fellow subsidiary within the Group, from which Efficient Select (Pty) Ltd recovers a portion ofthe related expense incurred. The provision recognised during the current year is the obligation of future payments net of expected recoveries. Theeffect of discounting the future payments for the time value of money is not considered to be material.
Group Company
During the current year, after retrenching its employees, Efficient Select (Pty) Ltd changed its business-model to outsource its asset-managementfunction, which was previously performed in-house by its employees. This subsidiary is a party to agreements for two data and research supplyplatforms, which were previously utilised by its employees. These agreements cannot be cancelled and expiry thereof takes place on 31 March 2018 and31 March 2019 respectively.
Loans from subsidiaries
Onerous contract provision
Provisions
The shareholders' agreement provides for additional interest of 3% above the prime rate should the proportion of any of the shareholders' loans payableexceed the proportion of the shareholding interest held in Efficient Private Clients (Pty) Ltd, in relation to the total shareholders' loans payable. Theinterest benefit is also applicable to the loan receivable by the Company from Efficient Private Clients (Pty) Ltd as per note 8.3. The effective interestrate on the excess shareholder loans payable at the reporting date was 13.25%.
Group Company
The Group considered whether the business of Efficient Select (Pty) Ltd should be classified as a discontinued operation and concluded that it did notmeet the criteria to be classified as such.
Loans from non-controlling interests (continued)
These loans are payable to the non-controlling interest shareholders of Efficient Private Clients (Pty) Ltd and were advanced to the Group during thecurrent year. The loans are unsecured, bear interest at the prime rate and have no fixed repayment terms. At 31 August 2017, all the shareholders haveagreed not to recall payment on this loan at least until 31 October 2018. The effective interest rate at the reporting date on these loans was 10.25%.
The loans from related parties are unsecured, interest-free and have no repayment terms.
53
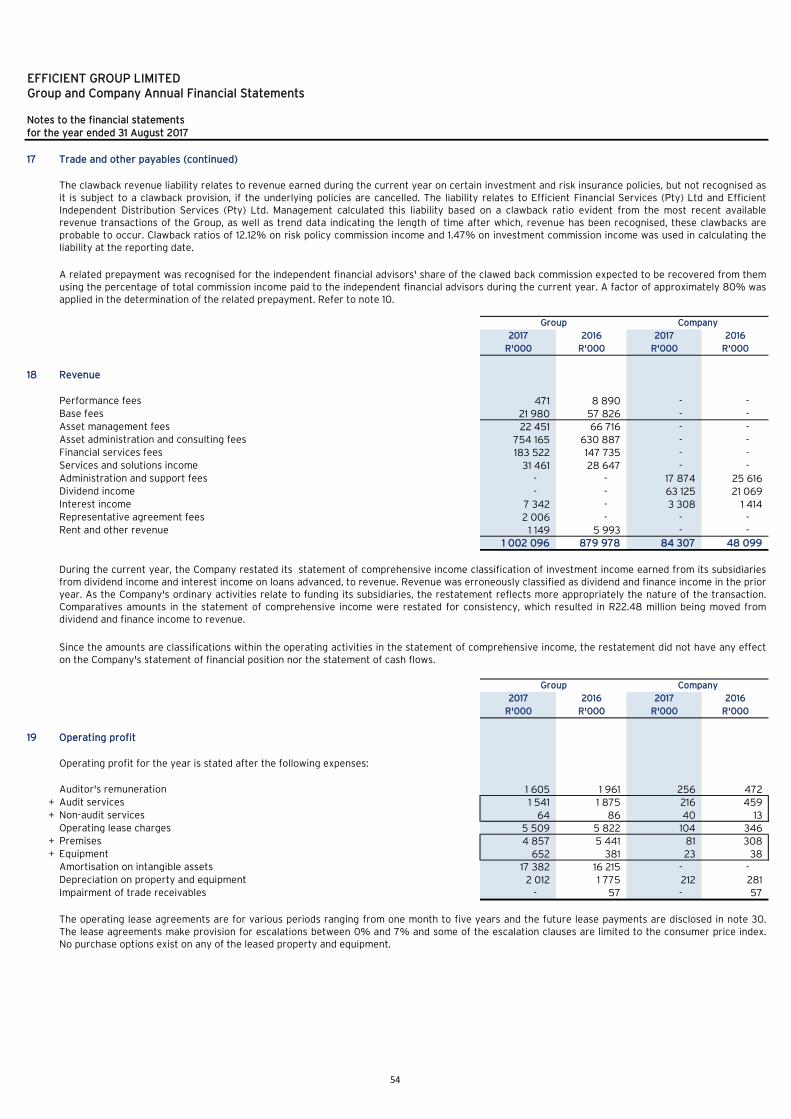
EFFICIENT GROUP LIMITEDGroup and Company Annual Financial Statements
Notes to the financial statements
for the year ended 31 August 2017
17 Trade and other payables (continued)
2017 2016 2017 2016
R'000 R'000 R'000 R'000
18 Revenue
Performance fees 471 8 890 - - Base fees 21 980 57 826 - - Asset management fees 22 451 66 716 - - Asset administration and consulting fees 754 165 630 887 - - Financial services fees 183 522 147 735 - - Services and solutions income 31 461 28 647 - - Administration and support fees - - 17 874 25 616 Dividend income - - 63 125 21 069 Interest income 7 342 - 3 308 1 414 Representative agreement fees 2 006 - - - Rent and other revenue 1 149 5 993 - -
1 002 096 879 978 84 307 48 099
2017 2016 2017 2016
R'000 R'000 R'000 R'000
19 Operating profit
Operating profit for the year is stated after the following expenses:
Auditor's remuneration 1 605 1 961 256 472 + Audit services 1 541 1 875 216 459 + Non-audit services 64 86 40 13
Operating lease charges 5 509 5 822 104 346 + Premises 4 857 5 441 81 308 + Equipment 652 381 23 38
Amortisation on intangible assets 17 382 16 215 - - Depreciation on property and equipment 2 012 1 775 212 281 Impairment of trade receivables - 57 - 57
Company
During the current year, the Company restated its statement of comprehensive income classification of investment income earned from its subsidiariesfrom dividend income and interest income on loans advanced, to revenue. Revenue was erroneously classified as dividend and finance income in the prioryear. As the Company's ordinary activities relate to funding its subsidiaries, the restatement reflects more appropriately the nature of the transaction.Comparatives amounts in the statement of comprehensive income were restated for consistency, which resulted in R22.48 million being moved fromdividend and finance income to revenue.
The operating lease agreements are for various periods ranging from one month to five years and the future lease payments are disclosed in note 30.The lease agreements make provision for escalations between 0% and 7% and some of the escalation clauses are limited to the consumer price index.No purchase options exist on any of the leased property and equipment.
A related prepayment was recognised for the independent financial advisors' share of the clawed back commission expected to be recovered from themusing the percentage of total commission income paid to the independent financial advisors during the current year. A factor of approximately 80% wasapplied in the determination of the related prepayment. Refer to note 10.
Group
The clawback revenue liability relates to revenue earned during the current year on certain investment and risk insurance policies, but not recognised asit is subject to a clawback provision, if the underlying policies are cancelled. The liability relates to Efficient Financial Services (Pty) Ltd and EfficientIndependent Distribution Services (Pty) Ltd. Management calculated this liability based on a clawback ratio evident from the most recent availablerevenue transactions of the Group, as well as trend data indicating the length of time after which, revenue has been recognised, these clawbacks areprobable to occur. Clawback ratios of 12.12% on risk policy commission income and 1.47% on investment commission income was used in calculating theliability at the reporting date.
Since the amounts are classifications within the operating activities in the statement of comprehensive income, the restatement did not have any effecton the Company's statement of financial position nor the statement of cash flows.
Company
Group
54
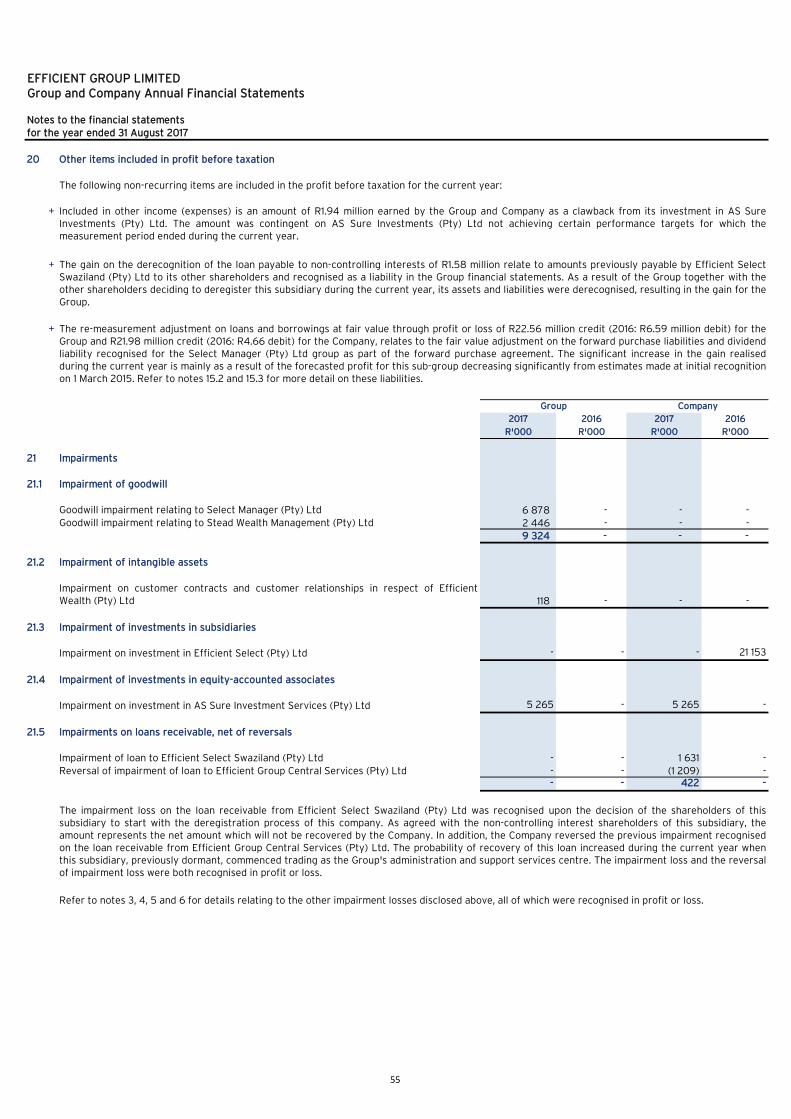
EFFICIENT GROUP LIMITEDGroup and Company Annual Financial Statements
Notes to the financial statements
for the year ended 31 August 2017
20 Other items included in profit before taxation
+
+
+
2017 2016 2017 2016
R'000 R'000 R'000 R'000
21 Impairments
21.1 Impairment of goodwill
Goodwill impairment relating to Select Manager (Pty) Ltd 6 878 - - - Goodwill impairment relating to Stead Wealth Management (Pty) Ltd 2 446 - - -
9 324 - - -
21.2 Impairment of intangible assets
118 - - -
21.3 Impairment of investments in subsidiaries
Impairment on investment in Efficient Select (Pty) Ltd - - - 21 153
21.4 Impairment of investments in equity-accounted associates
Impairment on investment in AS Sure Investment Services (Pty) Ltd 5 265 - 5 265 -
21.5 Impairments on loans receivable, net of reversals
Impairment of loan to Efficient Select Swaziland (Pty) Ltd - - 1 631 -
Reversal of impairment of loan to Efficient Group Central Services (Pty) Ltd - - (1 209) - - - 422 -
Group Company
The following non-recurring items are included in the profit before taxation for the current year:
Included in other income (expenses) is an amount of R1.94 million earned by the Group and Company as a clawback from its investment in AS SureInvestments (Pty) Ltd. The amount was contingent on AS Sure Investments (Pty) Ltd not achieving certain performance targets for which themeasurement period ended during the current year.
The gain on the derecognition of the loan payable to non-controlling interests of R1.58 million relate to amounts previously payable by Efficient SelectSwaziland (Pty) Ltd to its other shareholders and recognised as a liability in the Group financial statements. As a result of the Group together with theother shareholders deciding to deregister this subsidiary during the current year, its assets and liabilities were derecognised, resulting in the gain for theGroup.
The re-measurement adjustment on loans and borrowings at fair value through profit or loss of R22.56 million credit (2016: R6.59 million debit) for theGroup and R21.98 million credit (2016: R4.66 debit) for the Company, relates to the fair value adjustment on the forward purchase liabilities and dividendliability recognised for the Select Manager (Pty) Ltd group as part of the forward purchase agreement. The significant increase in the gain realisedduring the current year is mainly as a result of the forecasted profit for this sub-group decreasing significantly from estimates made at initial recognitionon 1 March 2015. Refer to notes 15.2 and 15.3 for more detail on these liabilities.
The impairment loss on the loan receivable from Efficient Select Swaziland (Pty) Ltd was recognised upon the decision of the shareholders of thissubsidiary to start with the deregistration process of this company. As agreed with the non-controlling interest shareholders of this subsidiary, theamount represents the net amount which will not be recovered by the Company. In addition, the Company reversed the previous impairment recognisedon the loan receivable from Efficient Group Central Services (Pty) Ltd. The probability of recovery of this loan increased during the current year whenthis subsidiary, previously dormant, commenced trading as the Group's administration and support services centre. The impairment loss and the reversalof impairment loss were both recognised in profit or loss.
Impairment on customer contracts and customer relationships in respect of EfficientWealth (Pty) Ltd
Refer to notes 3, 4, 5 and 6 for details relating to the other impairment losses disclosed above, all of which were recognised in profit or loss.
55
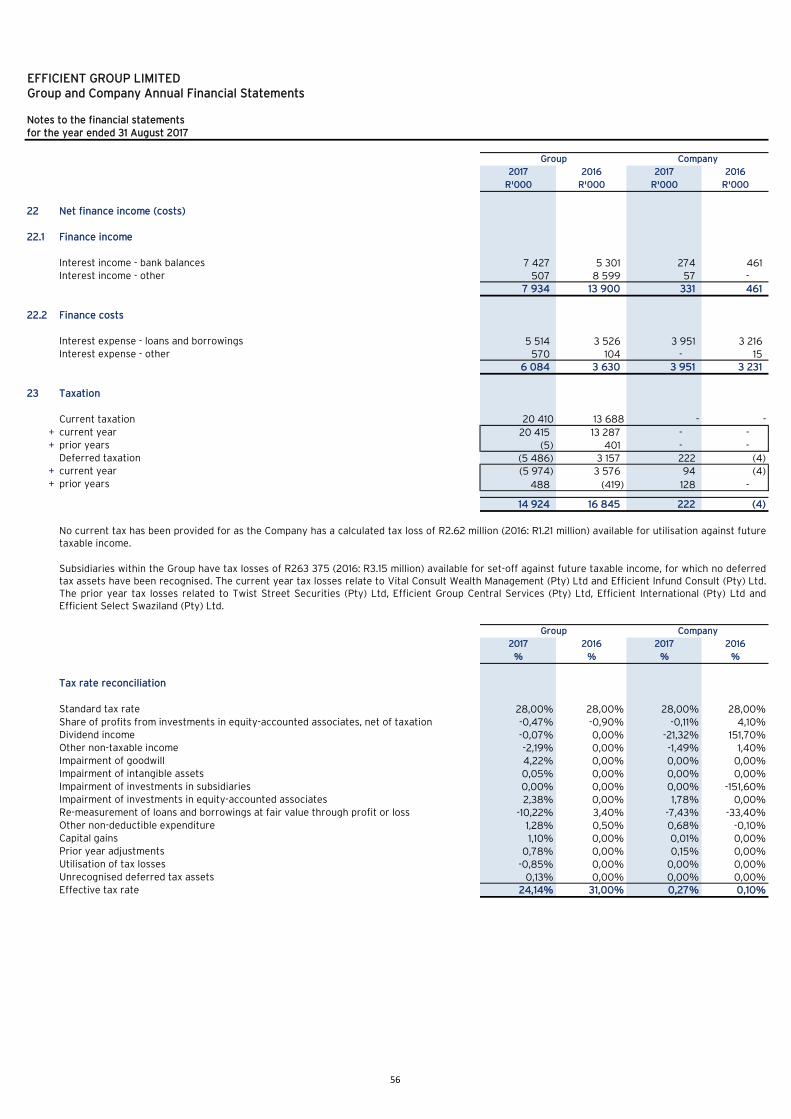
EFFICIENT GROUP LIMITEDGroup and Company Annual Financial Statements
Notes to the financial statements
for the year ended 31 August 2017
2017 2016 2017 2016
R'000 R'000 R'000 R'000
22
22.1 Finance income
Interest income - bank balances 7 427 5 301 274 461 Interest income - other 507 8 599 57 -
7 934 13 900 331 461
22.2 Finance costs
Interest expense - loans and borrowings 5 514 3 526 3 951 3 216 Interest expense - other 570 104 - 15
6 084 3 630 3 951 3 231
23 Taxation
Current taxation 20 410 13 688 - -
+ current year 20 415 13 287 - - + prior years (5) 401 - -
Deferred taxation (5 486) 3 157 222 (4) + current year (5 974) 3 576 94 (4) + prior years 488 (419) 128 -
14 924 16 845 222 (4)
2017 2016 2017 2016
% % % %
Tax rate reconciliation
Standard tax rate 28,00% 28,00% 28,00% 28,00%
-0,47% -0,90% -0,11% 4,10%Dividend income -0,07% 0,00% -21,32% 151,70%Other non-taxable income -2,19% 0,00% -1,49% 1,40%Impairment of goodwill 4,22% 0,00% 0,00% 0,00%Impairment of intangible assets 0,05% 0,00% 0,00% 0,00%Impairment of investments in subsidiaries 0,00% 0,00% 0,00% -151,60%Impairment of investments in equity-accounted associates 2,38% 0,00% 1,78% 0,00%Re-measurement of loans and borrowings at fair value through profit or loss -10,22% 3,40% -7,43% -33,40%Other non-deductible expenditure 1,28% 0,50% 0,68% -0,10%Capital gains 1,10% 0,00% 0,01% 0,00%Prior year adjustments 0,78% 0,00% 0,15% 0,00%Utilisation of tax losses -0,85% 0,00% 0,00% 0,00%Unrecognised deferred tax assets 0,13% 0,00% 0,00% 0,00%Effective tax rate 24,14% 31,00% 0,27% 0,10%
Net finance income (costs)
Subsidiaries within the Group have tax losses of R263 375 (2016: R3.15 million) available for set-off against future taxable income, for which no deferredtax assets have been recognised. The current year tax losses relate to Vital Consult Wealth Management (Pty) Ltd and Efficient Infund Consult (Pty) Ltd.The prior year tax losses related to Twist Street Securities (Pty) Ltd, Efficient Group Central Services (Pty) Ltd, Efficient International (Pty) Ltd andEfficient Select Swaziland (Pty) Ltd.
Group Company
Share of profits from investments in equity-accounted associates, net of taxation
Group Company
No current tax has been provided for as the Company has a calculated tax loss of R2.62 million (2016: R1.21 million) available for utilisation against futuretaxable income.
56

EFFICIENT GROUP LIMITEDGroup and Company Annual Financial Statements
Notes to the financial statements
for the year ended 31 August 2017
24 Earnings per share
2017 2016
Number of Number of
'000 '000
Weighted average number of ordinary shares in issue for all earnings
Ordinary shares in issue at the beginning of the year 90 593 90 593 Effect of treasury shares acquired during the year (60) (13) Effect of treasury shares held from the beginning of the year (261) (228) Weighted average number of ordinary shares at the end of the year 90 272 90 352
2017 2016
R'000 R'000
Earnings and diluted earnings - Attributable earnings
Net profit for the year attributable to equity holders of the parent 47 798 37 538
Headline earnings
Attributable earnings 47 798 37 538 Profit on disposal of equipment (134) (25) Taxation on disposal of equipment 38 7 Profit on disposal of customer contracts and customer relationships (139) - Taxation on disposal of customer contracts and customer relationships 31 - Impairment of goodwill 9 324 - Impairment of intangible assets 118 - Impairment of investments in equity-accounted associates 5 265 - Headline earnings 62 301 37 520
Earnings per share
2017 2016
Cents Cents
'000 '000
Basic and diluted earnings per share 52,95 41,55
Headline and diluted headline earnings per share 69,01 41,53
25 Dividends per share
2017 2016 2017 2016
R'000 R'000 R'000 R'000
26 Employee costs
Salaries and wages 206 733 183 184 10 931 13 793 Share-based payment expense 462 1 322 29 688
207 195 184 506 10 960 14 481
Basic and diluted earnings per share is calculated by dividing the profit attributable to equity holders of the parent by the weighted average number ofordinary shares in issue during the year.
Dividends of 5.47 cents per share and 1.63 cents per share were declared and paid in December 2016 (2016: 6.15 cents per share paid in December 2015)and May 2017 (2016: 1.59 cents per share paid in May 2016) respectively, by the Company to its shareholders.
Employee costs consist of short-term benefits, share-based payments and profit-share payments to staff, directors and prescribed officers. No long-termand post-employment benefits are payable to any employee.
Group Company
The Group does not have any potential dilutive ordinary shares to take into account in determining the diluted earnings per share and diluted headlineearnings per share for neither the current year nor the prior year.
Group
Group
Group
57
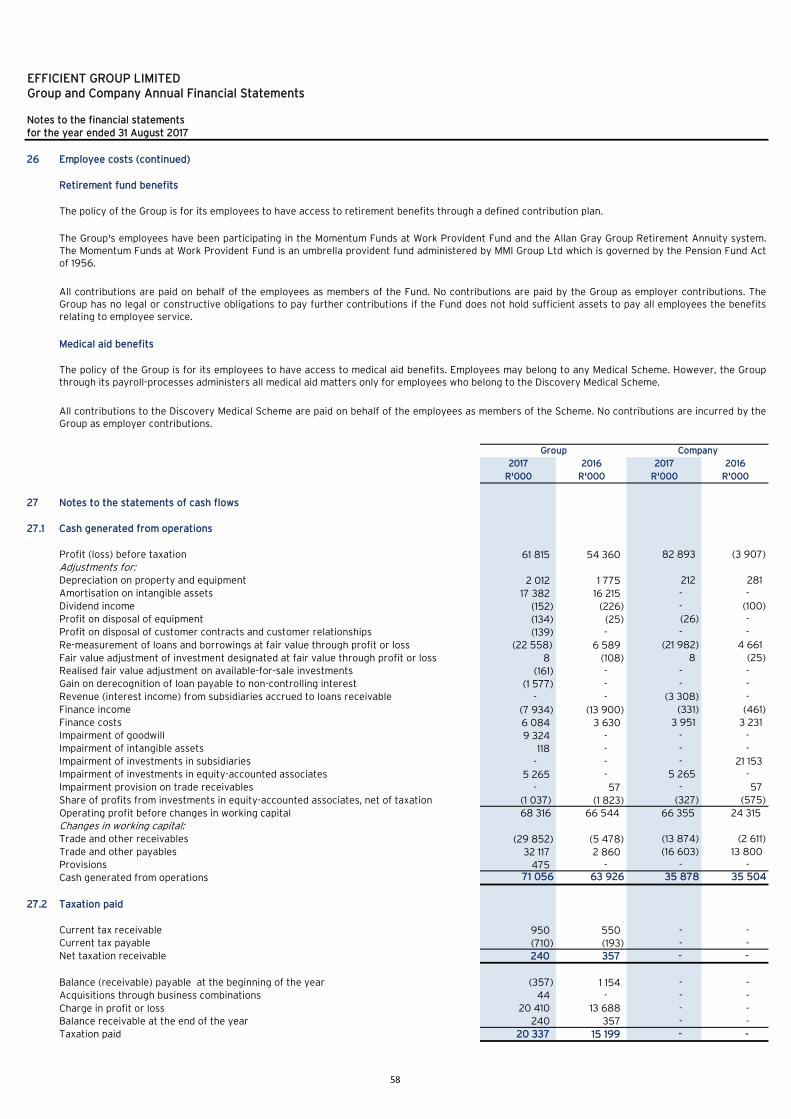
EFFICIENT GROUP LIMITEDGroup and Company Annual Financial Statements
Notes to the financial statements
for the year ended 31 August 2017
26 Employee costs (continued)
Retirement fund benefits
Medical aid benefits
2017 2016 2017 2016
R'000 R'000 R'000 R'000
27 Notes to the statements of cash flows
27.1 Cash generated from operations
Profit (loss) before taxation 61 815 54 360 82 893 (3 907)
Adjustments for:Depreciation on property and equipment 2 012 1 775 212 281
Amortisation on intangible assets 17 382 16 215 - -
Dividend income (152) (226) - (100)
Profit on disposal of equipment (134) (25) (26) -
Profit on disposal of customer contracts and customer relationships (139) - - -
(22 558) 6 589 (21 982) 4 661
8 (108) 8 (25)
Realised fair value adjustment on available-for-sale investments (161) - - -
Gain on derecognition of loan payable to non-controlling interest (1 577) - - -
Revenue (interest income) from subsidiaries accrued to loans receivable - - (3 308) -
Finance income (7 934) (13 900) (331) (461)
Finance costs 6 084 3 630 3 951 3 231
Impairment of goodwill 9 324 - - -
Impairment of intangible assets 118 - - -
Impairment of investments in subsidiaries - - - 21 153
Impairment of investments in equity-accounted associates 5 265 - 5 265 -
Impairment provision on trade receivables - 57 - 57
(1 037) (1 823) (327) (575)
68 316 66 544 66 355 24 315 Changes in working capital:Trade and other receivables (29 852) (5 478) (13 874) (2 611)
Trade and other payables 32 117 2 860 (16 603) 13 800
Provisions 475 - - -
Cash generated from operations 71 056 63 926 35 878 35 504
27.2 Taxation paid
Current tax receivable 950 550 - - Current tax payable (710) (193) - - Net taxation receivable 240 357 - -
Balance (receivable) payable at the beginning of the year (357) 1 154 - - Acquisitions through business combinations 44 - - -
20 410 13 688 - - Balance receivable at the end of the year 240 357 - - Taxation paid 20 337 15 199 - -
The policy of the Group is for its employees to have access to medical aid benefits. Employees may belong to any Medical Scheme. However, the Groupthrough its payroll-processes administers all medical aid matters only for employees who belong to the Discovery Medical Scheme.
Fair value adjustment of investment designated at fair value through profit or loss
Re-measurement of loans and borrowings at fair value through profit or loss
Group Company
The policy of the Group is for its employees to have access to retirement benefits through a defined contribution plan.
Share of profits from investments in equity-accounted associates, net of taxation
Charge in profit or loss
All contributions to the Discovery Medical Scheme are paid on behalf of the employees as members of the Scheme. No contributions are incurred by theGroup as employer contributions.
Operating profit before changes in working capital
The Group's employees have been participating in the Momentum Funds at Work Provident Fund and the Allan Gray Group Retirement Annuity system.The Momentum Funds at Work Provident Fund is an umbrella provident fund administered by MMI Group Ltd which is governed by the Pension Fund Actof 1956.
All contributions are paid on behalf of the employees as members of the Fund. No contributions are paid by the Group as employer contributions. TheGroup has no legal or constructive obligations to pay further contributions if the Fund does not hold sufficient assets to pay all employees the benefitsrelating to employee service.
58

EFFICIENT GROUP LIMITEDGroup and Company Annual Financial Statements
Notes to the financial statements
for the year ended 31 August 2017
2017 2016 2017 2016
R'000 R'000 R'000 R'000
27 Notes to the statements of cash flows (continued)
27.3 Acquisition and disposal of businesses
Acquisition of businesses, net of cash acquired
Trade and other receivables 675 - - - Intangible assets 20 008 6 398 - - Deferred tax liabilities (5 602) (1 775) - - Trade and other payables (215) - - - Current tax payable (44) - - - Cash and cash equivalents 92 - - - Net identifiable assets acquired 14 914 4 623 - - Goodwill 8 598 1 775 - - Non-controlling interests recognised at acquisition (6 511) - - - Loans receivable recognised as part of the purchase price - 151 - - Loans and borrowings recognised as part of the purchase price (8 521) (4 582) - - Cash acquired (92) - - - Net cash paid on acquisition of businesses 8 388 1 967 - -
Proceeds on disposal of business
Intangible assets (4 438) - - - Goodwill (1 268) - - - Deferred tax liabilities 1 400 - - - Net identifiable assets disposed (4 306) - Profit on disposal of customer contracts and customer relationships (139) - Net cash received on disposal of business (4 445) - - -
28 Details of business combinations
Efficient Private Clients
(Pty) Ltd
W-Allen White Brokers (Pty)
Ltd
Secure Capital Investments
(Pty) Ltd
VitalConsultWealth
Management (Pty) Ltd
Various financial
advisory client bases Total
R'000 R'000 R'000 R'000 R'000 R'000
Net tangible identifiable assets - 142 386 (20) - 508
Intangible assets 6 612 3 627 4 428 1 020 4 321 20 008
Deferred tax liabilities on intangible assets (1 851) (1 016) (1 240) (286) (1 209) (5 602)
Net identifiable assets 4 761 2 753 3 574 714 3 112 14 914
Goodwill acquired 1 851 1 016 4 236 286 1 209 8 598
Consideration transferred 6 612 3 769 7 810 1 000 4 321 23 512
The consideration transferred is made up as follows:
Cash 1 852 1 893 1 725 1 000 2 010 8 480
Contingent consideration liabilities - 1 876 4 334 - - 6 210
Vendor finance liabilities - - - - 2 311 2 311
Non-controlling interests 4 760 - 1 751 - - 6 511 6 612 3 769 7 810 1 000 4 321 23 512
During the current year, the Group, acquired various businesses in the Republic of South Africa, either by subscribing for ordinary shares (directly orindirectly) in the entities controlling the businesses, by acquiring the businesses as going concerns or by only acquiring the financial advisory client bases(customer contracts and customer relationships). No significant acquisition costs have been incurred by the Group during its acquisitions. Any incidentalcosts incurred by the Group, were expensed.
Details of the assets, liabilities and consideration transferred for the Group's acquisitions executed during the current year are stated below:
The acquisitions all contribute to the Group's strategy to increase its local footprint in the Financial Services industry.
The business disposed of as indicated above relates to a financial advisory client base in the Vredendal area. The cancellation was agreed to by allparties to the original agreement and was effective from 31 July 2017.
Group Company
59
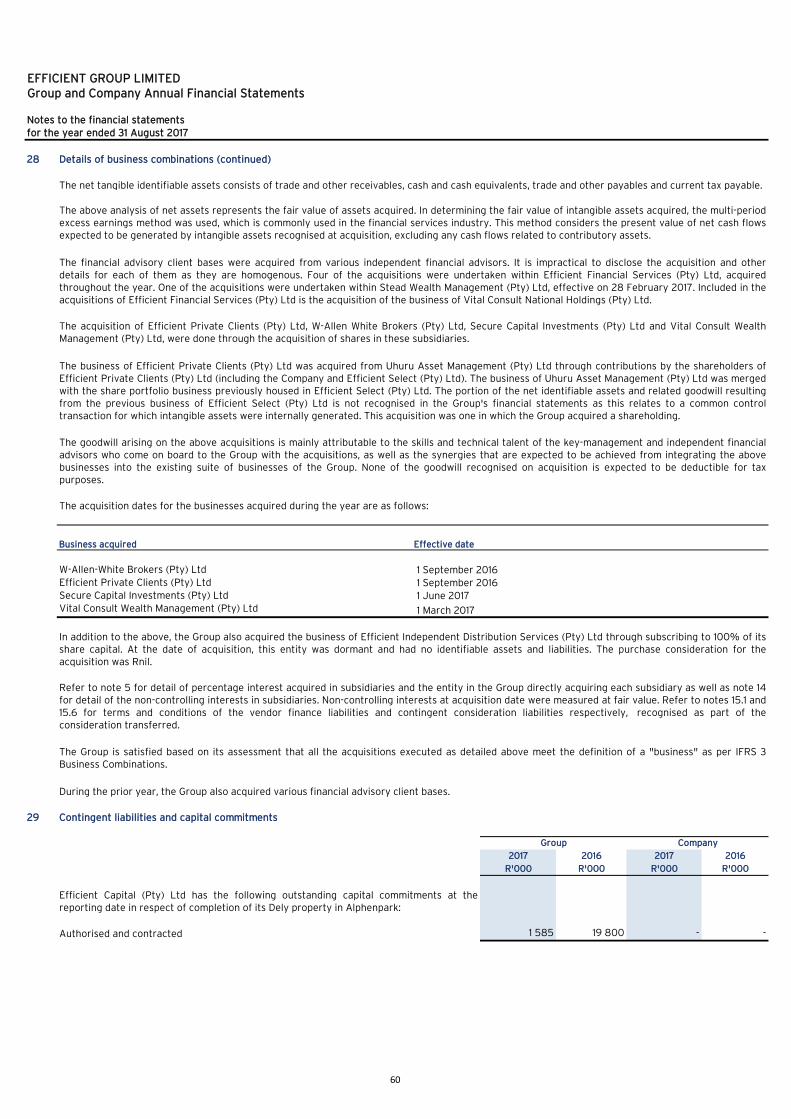
EFFICIENT GROUP LIMITEDGroup and Company Annual Financial Statements
Notes to the financial statements
for the year ended 31 August 2017
28 Details of business combinations (continued)
Business acquired Effective date
29 Contingent liabilities and capital commitments
2017 2016 2017 2016
R'000 R'000 R'000 R'000
Authorised and contracted 1 585 19 800 - -
The business of Efficient Private Clients (Pty) Ltd was acquired from Uhuru Asset Management (Pty) Ltd through contributions by the shareholders ofEfficient Private Clients (Pty) Ltd (including the Company and Efficient Select (Pty) Ltd). The business of Uhuru Asset Management (Pty) Ltd was mergedwith the share portfolio business previously housed in Efficient Select (Pty) Ltd. The portion of the net identifiable assets and related goodwill resultingfrom the previous business of Efficient Select (Pty) Ltd is not recognised in the Group's financial statements as this relates to a common controltransaction for which intangible assets were internally generated. This acquisition was one in which the Group acquired a shareholding.
Vital Consult Wealth Management (Pty) Ltd 1 June 2017
1 March 2017
Efficient Private Clients (Pty) Ltd
W-Allen-White Brokers (Pty) Ltd
The net tangible identifiable assets consists of trade and other receivables, cash and cash equivalents, trade and other payables and current tax payable.
The financial advisory client bases were acquired from various independent financial advisors. It is impractical to disclose the acquisition and otherdetails for each of them as they are homogenous. Four of the acquisitions were undertaken within Efficient Financial Services (Pty) Ltd, acquiredthroughout the year. One of the acquisitions were undertaken within Stead Wealth Management (Pty) Ltd, effective on 28 February 2017. Included in theacquisitions of Efficient Financial Services (Pty) Ltd is the acquisition of the business of Vital Consult National Holdings (Pty) Ltd.
The goodwill arising on the above acquisitions is mainly attributable to the skills and technical talent of the key-management and independent financialadvisors who come on board to the Group with the acquisitions, as well as the synergies that are expected to be achieved from integrating the abovebusinesses into the existing suite of businesses of the Group. None of the goodwill recognised on acquisition is expected to be deductible for taxpurposes.
Secure Capital Investments (Pty) Ltd
The Group is satisfied based on its assessment that all the acquisitions executed as detailed above meet the definition of a "business" as per IFRS 3Business Combinations.
Refer to note 5 for detail of percentage interest acquired in subsidiaries and the entity in the Group directly acquiring each subsidiary as well as note 14for detail of the non-controlling interests in subsidiaries. Non-controlling interests at acquisition date were measured at fair value. Refer to notes 15.1 and15.6 for terms and conditions of the vendor finance liabilities and contingent consideration liabilities respectively, recognised as part of theconsideration transferred.
The above analysis of net assets represents the fair value of assets acquired. In determining the fair value of intangible assets acquired, the multi-periodexcess earnings method was used, which is commonly used in the financial services industry. This method considers the present value of net cash flowsexpected to be generated by intangible assets recognised at acquisition, excluding any cash flows related to contributory assets.
The acquisition dates for the businesses acquired during the year are as follows:
1 September 2016
The acquisition of Efficient Private Clients (Pty) Ltd, W-Allen White Brokers (Pty) Ltd, Secure Capital Investments (Pty) Ltd and Vital Consult WealthManagement (Pty) Ltd, were done through the acquisition of shares in these subsidiaries.
1 September 2016
In addition to the above, the Group also acquired the business of Efficient Independent Distribution Services (Pty) Ltd through subscribing to 100% of itsshare capital. At the date of acquisition, this entity was dormant and had no identifiable assets and liabilities. The purchase consideration for theacquisition was Rnil.
During the prior year, the Group also acquired various financial advisory client bases.
Efficient Capital (Pty) Ltd has the following outstanding capital commitments at thereporting date in respect of completion of its Dely property in Alphenpark:
Group Company
60
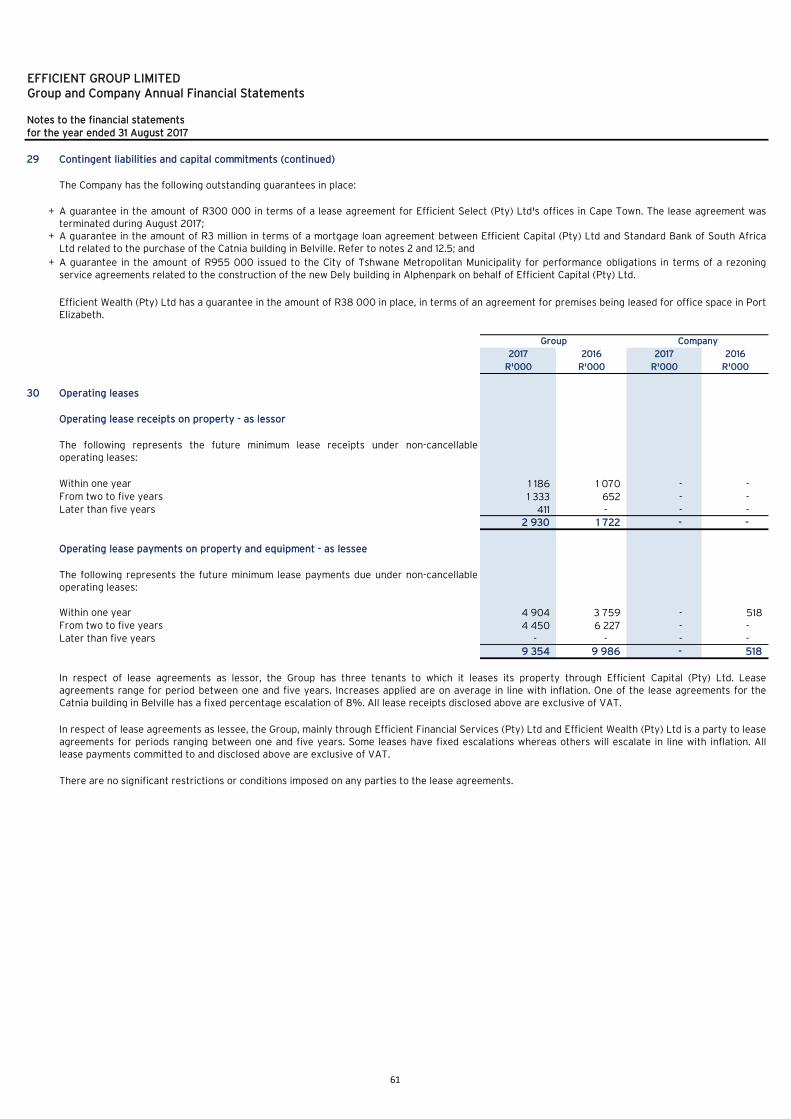
EFFICIENT GROUP LIMITEDGroup and Company Annual Financial Statements
Notes to the financial statements
for the year ended 31 August 2017
29 Contingent liabilities and capital commitments (continued)
The Company has the following outstanding guarantees in place:
+
+
+
2017 2016 2017 2016
R'000 R'000 R'000 R'000
30 Operating leases
Operating lease receipts on property - as lessor
Within one year 1 186 1 070 - - From two to five years 1 333 652 - - Later than five years 411 - - -
2 930 1 722 - -
Operating lease payments on property and equipment - as lessee
Within one year 4 904 3 759 - 518 From two to five years 4 450 6 227 - - Later than five years - - - -
9 354 9 986 - 518
A guarantee in the amount of R300 000 in terms of a lease agreement for Efficient Select (Pty) Ltd's offices in Cape Town. The lease agreement wasterminated during August 2017;
Efficient Wealth (Pty) Ltd has a guarantee in the amount of R38 000 in place, in terms of an agreement for premises being leased for office space in PortElizabeth.
Group Company
A guarantee in the amount of R3 million in terms of a mortgage loan agreement between Efficient Capital (Pty) Ltd and Standard Bank of South AfricaLtd related to the purchase of the Catnia building in Belville. Refer to notes 2 and 12.5; and
The following represents the future minimum lease receipts under non-cancellableoperating leases:
The following represents the future minimum lease payments due under non-cancellableoperating leases:
In respect of lease agreements as lessor, the Group has three tenants to which it leases its property through Efficient Capital (Pty) Ltd. Leaseagreements range for period between one and five years. Increases applied are on average in line with inflation. One of the lease agreements for theCatnia building in Belville has a fixed percentage escalation of 8%. All lease receipts disclosed above are exclusive of VAT.
In respect of lease agreements as lessee, the Group, mainly through Efficient Financial Services (Pty) Ltd and Efficient Wealth (Pty) Ltd is a party to leaseagreements for periods ranging between one and five years. Some leases have fixed escalations whereas others will escalate in line with inflation. Alllease payments committed to and disclosed above are exclusive of VAT.
There are no significant restrictions or conditions imposed on any parties to the lease agreements.
A guarantee in the amount of R955 000 issued to the City of Tshwane Metropolitan Municipality for performance obligations in terms of a rezoningservice agreements related to the construction of the new Dely building in Alphenpark on behalf of Efficient Capital (Pty) Ltd.
61
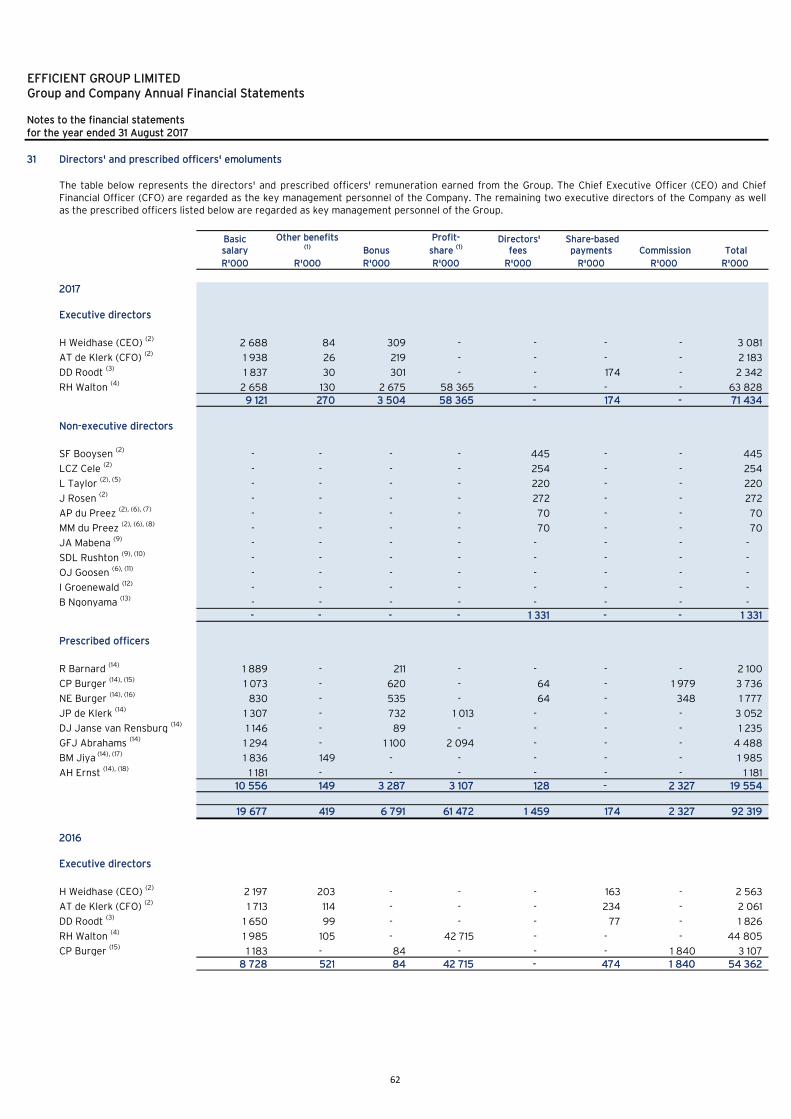
EFFICIENT GROUP LIMITEDGroup and Company Annual Financial Statements
Notes to the financial statements
for the year ended 31 August 2017
31 Directors' and prescribed officers' emoluments
Basicsalary
Other benefits (1) Bonus
Profit-
share (1) Directors'
fees Share-based
payments Commission Total
R'000 R'000 R'000 R'000 R'000 R'000 R'000 R'000
2017
Executive directors
H Weidhase (CEO) (2)2 688 84 309 - - - - 3 081
AT de Klerk (CFO) (2)
1 938 26 219 - - - - 2 183
DD Roodt (3)1 837 30 301 - - 174 - 2 342
RH Walton (4)
2 658 130 2 675 58 365 - - - 63 828
9 121 270 3 504 58 365 - 174 - 71 434
Non-executive directors
SF Booysen (2)- - - - 445 - - 445
LCZ Cele (2)- - - - 254 - - 254
L Taylor (2), (5)
- - - - 220 - - 220
J Rosen (2)- - - - 272 - - 272
AP du Preez (2), (6), (7)- - - - 70 - - 70
MM du Preez (2), (6), (8)
- - - - 70 - - 70
JA Mabena (9)- - - - - - - -
SDL Rushton (9), (10)- - - - - - - -
OJ Goosen (6), (11)- - - - - - - -
I Groenewald (12)- - - - - - - -
B Ngonyama (13)- - - - - - - -
- - - - 1 331 - - 1 331
Prescribed officers
R Barnard (14)1 889 - 211 - - - - 2 100
CP Burger (14), (15)1 073 - 620 - 64 - 1 979 3 736
NE Burger (14), (16)830 - 535 - 64 - 348 1 777
JP de Klerk (14)1 307 - 732 1 013 - - - 3 052
DJ Janse van Rensburg (14)1 146 - 89 - - - - 1 235
GFJ Abrahams (14)1 294 - 1 100 2 094 - - - 4 488
BM Jiya (14), (17)1 836 149 - - - - - 1 985
AH Ernst (14), (18)1 181 - - - - - - 1 181
10 556 149 3 287 3 107 128 - 2 327 19 554
19 677 419 6 791 61 472 1 459 174 2 327 92 319
2016
Executive directors
H Weidhase (CEO) (2)2 197 203 - - - 163 - 2 563
AT de Klerk (CFO) (2)1 713 114 - - - 234 - 2 061
DD Roodt (3)1 650 99 - - - 77 - 1 826
RH Walton (4)1 985 105 - 42 715 - - - 44 805
CP Burger (15)1 183 - 84 - - - 1 840 3 107
8 728 521 84 42 715 - 474 1 840 54 362
The table below represents the directors' and prescribed officers' remuneration earned from the Group. The Chief Executive Officer (CEO) and ChiefFinancial Officer (CFO) are regarded as the key management personnel of the Company. The remaining two executive directors of the Company as wellas the prescribed officers listed below are regarded as key management personnel of the Group.
62

EFFICIENT GROUP LIMITEDGroup and Company Annual Financial Statements
Notes to the financial statements
for the year ended 31 August 2017
31 Directors' and prescribed officers' emoluments (continued)
Basicsalary
Other benefits (1) Bonus
Profit-
share (1) Directors'
fees Share-based
payments Commission Total
R'000 R'000 R'000 R'000 R'000 R'000 R'000 R'000
2016 (continued)
SF Booysen (2)- - - - 563 - - 563
LCZ Cele (2)
- - - - 222 - - 222
L Taylor (2), (5)
- - - - 202 - - 202
J Rosen (2)- - - - 251 - - 251
AP du Preez (2), (6), (7)
- - - - 97 - - 97
MM du Preez (2), (6), (8)- - - - 97 - - 97
JA Mabena (9)
- - - - 190 - - 190
- - - - 1 622 - - 1 622
Prescribed officers
R Barnard (14)1 279 100 - - - 176 - 1 555
CP Burger (14), (15)237 - - - - - 372 609
NE Burger (14), (16)1 505 60 83 - - - 638 2 286
JP de Klerk (14)1 148 71 - 1 154 - 4 - 2 377
DJ Janse van Rensburg (14)947 36 - - - 97 - 1 080
GFJ Abrahams (14)1 142 47 - 1 750 - 8 - 2 947
BM Jiya (14), (17)1 044 6 - - - - - 1 050
P Hewett (14), (19)897 79 - - - 76 412 1 464
8 199 399 83 2 904 - 361 1 422 13 368
16 927 920 167 45 619 1 622 835 3 262 69 352
(7) AP du Preez resigned as a director of the Company with effect from 23 August 2017.
(17) BM Jiya resigned as a prescribed officer of the Group with effect from 31 August 2017.
Non-executive directors
(1) Other benefits include travel allowances, medical aid contributions, retirement fund contributions, leave-pay outs and severance packages. The profit-share paymentsare made in accordance with agreements with the management team of Boutique Collective Investments (RF) (Pty) Ltd and Boutique Investment Partners (Pty) Ltd.
(2) These directors are remunerated by the Company.
(15) CP Burger resigned as a director of the Company on 30 June 2016 and at that point became a prescribed officer of the Group. He thereafter resigned as a prescribedofficer of the Group with effect from 30 June 2017.
(16) NE Burger resigned as a prescribed officer of the Group with effect from 31 March 2017.
(18) AH Ernst was appointed as a prescribed officer of the Group with effect from 1 September 2016.
(19) P Hewett resigned as a prescribed officer of the Group with effect from 31 March 2016.
(3) During the current year, DD Roodt was remunerated by related group companies, however during the prior year, he was remunerated by the Company. In addition,the current year share-based payment expense incurred was settled by the Company.
(4) RH Walton is remunerated by group companies.
(5) L Taylor resigned as a director of the Company with effect from 23 August 2017.
(6) Directors' fees amounting to R64 801 (2016: Rnil) were charged by ORA Fund Managers (Pty) Ltd for these directors over and above the director fees disclosed in thetables above.
(8) MM du Preez resigned as an alternate director to AP du Preez with effect from 8 May 2017.
(9) Directors' fees amounting to R202 160 (2016: R190 000) were charged by Thebe Investment Corporation (Pty) Ltd for these directors over and above the directorfees disclosed in the tables above.(10) SDL Rushton was appointed as an alternate director to JA Mabena with effect from 8 May 2017.
(11) OJ Goosen was appointed as an alternate director to AP du Preez with effect from 8 May 2017 and after AP du Preez's resignation, he was appointed as a director ofthe Company with effect from 23 August 2017.(12) I Groenewald was appointed as an alternate director to OJ Goosen with effect from 23 August 2017.
(13) B Ngonyama was appointed as a director of the Company with effect from 23 August 2017.
(14) These prescribed officers are remunerated by group companies.
63

EFFICIENT GROUP LIMITEDGroup and Company Annual Financial Statements
Notes to the financial statements
for the year ended 31 August 2017
31 Directors' and prescribed officers' emoluments (continued)
Opening balance -
Number of SARs
Number of SARs awarded
during the year
Number of SARs
exercised during the
year
Number ofSARs forfeited
during theyear
Closing balance -
Number of SARs
'000 '000 '000 '000 '000
Executive directors
H Weidhase (CEO) 52 - - - 52 2015-08-31 94 H Weidhase (CEO) 71 - - - 71 2016-08-31 200
H Weidhase (CEO) - 500 - - 500 2019-08-31 536 AT de Klerk (CFO) 39 - - - 39 2015-08-31 94
AT de Klerk (CFO) 54 - - - 54 2016-08-31 200 AT de Klerk (CFO) 200 - - - 200 2018-08-31 546
AT de Klerk (CFO) - 295 - - 295 2019-08-31 536
DD Roodt 53 - (53) - - 2016-08-31 200
DD Roodt - 280 - - 280 2019-08-31 536 RH Walton - 500 - - 500 2019-08-31 536
Prescribed officers
R Barnard 13 - - - 13 2015-08-31 94
R Barnard 21 - - - 21 2016-08-31 200
R Barnard 25 - - - 25 2017-08-31 374
R Barnard 200 - - - 200 2018-08-31 546
R Barnard - 275 - - 275 2019-08-31 536 CP Burger - 194 - (194) - 2019-08-31 536 NE Burger - 219 - (219) - 2019-08-31 536 JP de Klerk 5 - - - 5 2017-08-31 374 JP de Klerk - 201 - - 201 2019-08-31 536 DJ Janse van Rensburg 17 - - - 17 2017-08-31 374
DJ Janse van Rensburg 150 - - - 150 2018-08-31 546
DJ Janse van Rensburg - 172 - - 172 2019-08-31 536
GFJ Abrahams 10 - - - 10 2017-08-31 374
GFJ Abrahams - 194 - - 194 2019-08-31 536
BM Jiya - 279 - (279) - 2019-08-31 536
32 Related parties
Related party Relationship
Efficient Financial Services (Pty) Ltd SubsidiaryEfficient Wealth (Pty) Ltd SubsidiaryTwist Street Securities (Pty) Ltd SubsidiaryEfficient Infund Consult (Pty) Ltd SubsidiaryEfficient Select (Pty) Ltd SubsidiaryBoutique Collective Investments (RF) (Pty) Ltd SubsidiaryBoutique Investment Partners (Pty) Ltd SubsidiaryInstit (Pty) Ltd SubsidiaryNaviga Solutions (Pty) Ltd SubsidiaryTwist Street Collective Investments (Pty) Ltd SubsidiarySelect Manager (Pty) Ltd SubsidiaryStead Wealth Management (Pty) Ltd SubsidiaryExceed Asset Management (Pty) Ltd SubsidiaryExceed Private Clients (Pty) Ltd SubsidiaryW-Allen White Brokers (Pty) Ltd SubsidiarySecure Capital Investments (Pty) Ltd SubsidiaryEfficient Independent Distribution Services (Pty) Ltd SubsidiaryEfficient Private Clients (Pty) Ltd SubsidiaryEfficient Board of Executors (Pty) Ltd Subsidiary
Detail of share appreciation rights (SARs)
The movement in the number of SARs for granted to the directors and prescribed officers of the Group are as follows:
Vesting dates
Grantprice
(Cents)
64
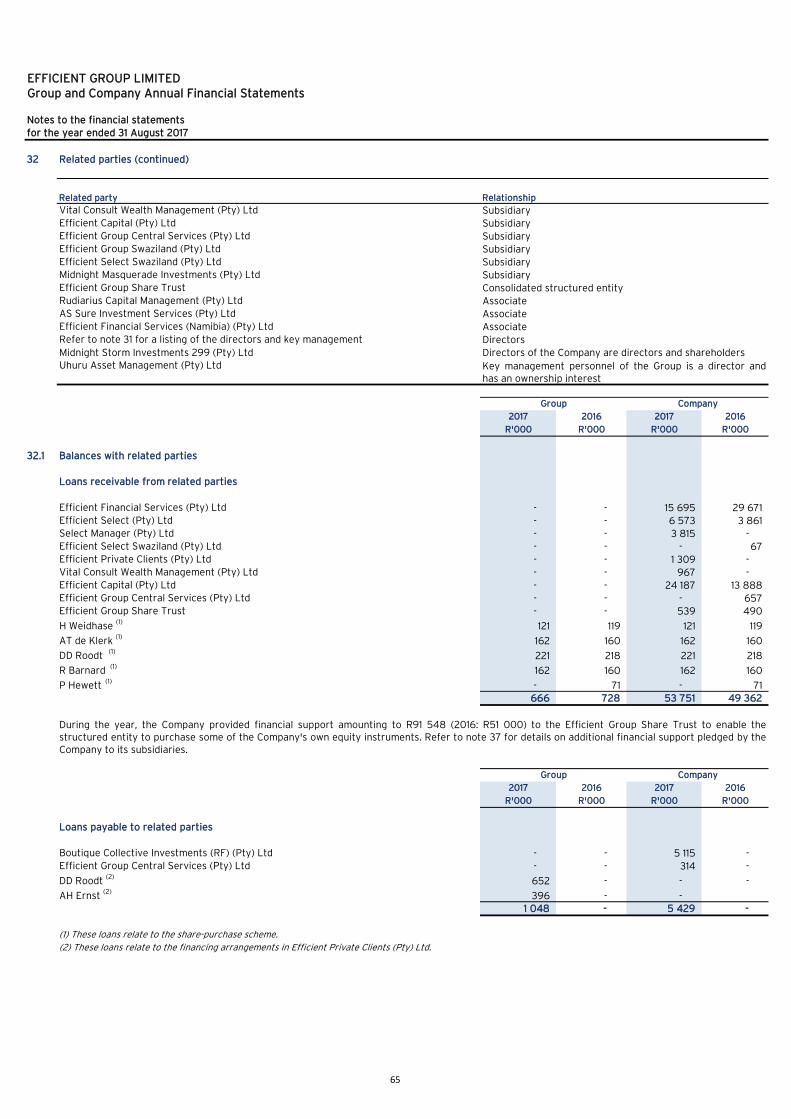
EFFICIENT GROUP LIMITEDGroup and Company Annual Financial Statements
Notes to the financial statements
for the year ended 31 August 2017
32 Related parties (continued)
Related party Relationship
Vital Consult Wealth Management (Pty) Ltd SubsidiaryEfficient Capital (Pty) Ltd SubsidiaryEfficient Group Central Services (Pty) Ltd SubsidiaryEfficient Group Swaziland (Pty) Ltd SubsidiaryEfficient Select Swaziland (Pty) Ltd SubsidiaryMidnight Masquerade Investments (Pty) Ltd SubsidiaryEfficient Group Share Trust Consolidated structured entityRudiarius Capital Management (Pty) Ltd AssociateAS Sure Investment Services (Pty) Ltd AssociateEfficient Financial Services (Namibia) (Pty) Ltd AssociateRefer to note 31 for a listing of the directors and key management Directors
Midnight Storm Investments 299 (Pty) LtdUhuru Asset Management (Pty) Ltd
2017 2016 2017 2016
R'000 R'000 R'000 R'000
32.1 Balances with related parties
Loans receivable from related parties
Efficient Financial Services (Pty) Ltd - - 15 695 29 671 Efficient Select (Pty) Ltd - - 6 573 3 861 Select Manager (Pty) Ltd - - 3 815 - Efficient Select Swaziland (Pty) Ltd - - - 67 Efficient Private Clients (Pty) Ltd - - 1 309 - Vital Consult Wealth Management (Pty) Ltd - - 967 - Efficient Capital (Pty) Ltd - - 24 187 13 888 Efficient Group Central Services (Pty) Ltd - - - 657 Efficient Group Share Trust - - 539 490
H Weidhase (1) 121 119 121 119
AT de Klerk (1)
162 160 162 160
DD Roodt (1) 221 218 221 218
R Barnard (1) 162 160 162 160
P Hewett (1)- 71 - 71
666 728 53 751 49 362
2017 2016 2017 2016
R'000 R'000 R'000 R'000
Loans payable to related parties
Boutique Collective Investments (RF) (Pty) Ltd - - 5 115 - Efficient Group Central Services (Pty) Ltd - - 314 -
DD Roodt (2)652 - - -
AH Ernst (2)396 - -
1 048 - 5 429 -
(2) These loans relate to the financing arrangements in Efficient Private Clients (Pty) Ltd.
Key management personnel of the Group is a director andhas an ownership interest
Group Company
During the year, the Company provided financial support amounting to R91 548 (2016: R51 000) to the Efficient Group Share Trust to enable thestructured entity to purchase some of the Company's own equity instruments. Refer to note 37 for details on additional financial support pledged by theCompany to its subsidiaries.
Group
(1) These loans relate to the share-purchase scheme.
Company
Directors of the Company are directors and shareholders
65

EFFICIENT GROUP LIMITEDGroup and Company Annual Financial Statements
Notes to the financial statements
for the year ended 31 August 2017
2017 2016 2017 2016
R'000 R'000 R'000 R'000
32 Related parties (continued)
32.1 Balances with related parties (continued)
Trade receivables owing by related parties
Efficient Wealth (Pty) Ltd - - 7 1 179 Boutique Collective Investments (RF) (Pty) Ltd - - 474 2 265 Boutique Investment Partners (Pty) Ltd - - 32 232 Naviga Solutions (Pty) Ltd - - 6 47 Select Manager (Pty) Ltd - - - 30 Stead Wealth Management (Pty) Ltd - - 2 2 Exceed Asset Management (Pty) Ltd - - 7 2 Efficient Private Clients (Pty) Ltd - - 103 - Efficient Board of Executors (Pty) Ltd - - 38 38 Efficient Capital (Pty) Ltd - - 1 030 - Efficient Group Central Services (Pty) Ltd - - 14 604 - Midnight Storm Investments 299 (Pty) Ltd 50 296 3 2 Rudiarius Capital Management (Pty) Ltd 64 94 40 88 AS Sure Investment Services (Pty) Ltd - 104 - -
114 494 16 346 3 885
Trade payables owing to related parties
Boutique Collective Investments (RF) (Pty) Ltd - - - 13 000 Rudiarius Capital Management (Pty) Ltd 964 966 - - AS Sure Investment Services (Pty) Ltd 937 1 017 - - Midnight Storm Investments 299 (Pty) Ltd 4 - 4 -
1 905 1 983 4 13 000
32.2 Related party transactions
Administration and support fees earned from related parties
Efficient Financial Services (Pty) Ltd - - - 6 330 Efficient Wealth (Pty) Ltd - - - 5 021 Efficient Select (Pty) Ltd - - - 3 851 Boutique Collective Investments (RF) (Pty) Ltd - - 533 4 978 Boutique Investment Partners (Pty) Ltd - - - 2 556 Naviga Solutions (Pty) Ltd - - - 2 612 Select Manager (Pty) Ltd - - 288 270 Rudiarius Capital Management (Pty) Ltd 28 - - - Efficient Capital (Pty) Ltd - - 314 - Efficient Group Central Services (Pty) Ltd - - 16 739 -
28 - 17 874 25 618
Administration and support fees charged by related parties
Boutique Collective Investments (RF) (Pty) Ltd - - 1 725 -
The fees charged to Select Manager (Pty) Ltd are in lieu of non-executive directors' fees,being charged in respect of H Weidhase and AT de Klerk's appointment to the board ofSelect Manager (Pty) Ltd.
Group Company
66

EFFICIENT GROUP LIMITEDGroup and Company Annual Financial Statements
Notes to the financial statements
for the year ended 31 August 2017
2017 2016 2017 2016
R'000 R'000 R'000 R'000
32 Related parties (continued)
32.2 Related party transactions (continued)
Interest income earned on loans payable by related parties
Efficient Financial Services (Pty) Ltd - - 1 579 1 153 Efficient Wealth (Pty) Ltd - - - 381 Efficient Select (Pty) Ltd - - 551 20 Select Manager (Pty) Ltd - 197 - Efficient Private Clients (Pty) Ltd - - 113 - Vital Consult Wealth Management (Pty) Ltd - - 1 - Efficient Capital (Pty) Ltd - - 867 -
H Weidhase (1)
7 8 7 8
AT de Klerk (1)
10 10 10 10
DD Roodt (1) 14 14 14 14
R Barnard (1)
10 10 10 10
P Hewett (1)
- 7 - 7
41 49 3 349 1 603
Interest expense charged on loans payable to related parties
DD Roodt (2)29 - - -
AH Ernst (2)21 - - -
50 - - -
Asset consulting fees earned from related parties
AS Sure Investment Services (Pty) Ltd 1 071 1 247 - -
Asset management fees charged by related parties
Rudiarius Capital Management (Pty) Ltd 10 169 12 142 - - AS Sure Investment Services (Pty) Ltd 10 084 10 598 - -
20 253 22 740 - -
Dividend income earned from related parties
Efficient Wealth (Pty) Ltd 8 650 - Efficient Select (Pty) Ltd - - - 750 Boutique Collective Investments (RF) (Pty) Ltd - - 28 000 7 000 Boutique Investment Partners (Pty) Ltd - - 8 000 1 000 Naviga Solutions (Pty) Ltd - - 12 800 - Select Manager (Pty) Ltd - - 5 675 12 319 Rudiarius Capital Management (Pty) Ltd 660 150 - - AS Sure Investment Services (Pty) Ltd 200 860 200 860
860 1 010 63 325 21 929
Economics and research expenses charged by related parties
Efficient Select (Pty) Ltd - - - 1 795
Rent expense charged by related parties
Midnight Storm Investments 299 (Pty) Ltd 610 973 - 973
Dividends declared to related parties
Efficient Group Share Trust - - 23 11
Group Company
(1) This interest relates to the loans for the share-purchase scheme.
(2) This interest relates to the loans on the financing arrangements in Efficient Private Clients (Pty) Ltd.
67

EFFICIENT GROUP LIMITEDGroup and Company Annual Financial Statements
Notes to the financial statements
for the year ended 31 August 2017
2017 2016 2017 2016
R'000 R'000 R'000 R'000
32 Related parties (continued)
32.2 Related party transactions (continued)
Transactions with directors and key management (including families)
Salaries and wages 92 145 68 517 6 595 7 598 Share-based payments 174 835 174 474
92 319 69 352 6 769 8 072
33 Segment analysis
The Group is organised into three main business segments (clusters):
Financial Services
Investments
Financial Services
Services and Solutions Investments Other Total
R'000 R'000 R'000 R'000 R'000
2017
Revenue 190 289 34 234 854 275 (76 702) 1 002 096 + External 189 634 34 234 807 628 (29 400) 1 002 096 + Inter-segment 655 - 46 647 (47 302) -
Operating expenses (182 144) (26 317) (820 960) 71 799 (957 622) Finance income 1 931 476 5 031 496 7 934 Finance costs (1 986) (179) (868) (3 051) (6 084) Impairment of goodwill - - - (9 324) (9 324) Impairment of intangible assets (118) - - - (118)
Impairment of investments in equity-accounted associates - - - (5 265) (5 265) Net profit for the year 10 030 7 121 37 414 (7 674) 46 891 Taxation (3 558) (2 211) (12 134) 2 979 (14 924) Net asset value 18 716 19 192 52 470 177 620 267 998 Assets 65 980 29 927 235 309 249 742 580 958 Liabilities (47 264) (10 735) (182 839) (72 122) (312 960) Depreciation and amortisation (2 140) (3 473) (1 927) (11 854) (19 394)
- -
710 327 1 037
The prior year remuneration disclosed above has been restated to agree to the information included in note 31, for the Company.
Included in this segment are Efficient Financial Services (Pty) Ltd, Efficient Wealth (Pty) Ltd, Twist Street Securities (Pty) Ltd, Efficient Infund Consult(Pty) Ltd, Stead Wealth Management (Pty) Ltd, Exceed Asset Management (Pty) Ltd, Exceed Private Clients (Pty) Ltd, W-Allen White Brokers (Pty) Ltd,Secure Capital Investments (Pty) Ltd and Efficient Group Central Services (Pty) Ltd (for 2016, formerly Efficient Asset Finance (Pty) Ltd).
Included in this segment are Naviga Solutions (Pty) Ltd, Efficient Board of Executors (Pty) Ltd and Efficient Private Clients (Pty) Ltd.
Included in this segment are Efficient Select (Pty) Ltd, Boutique Collective Investments (RF) (Pty) Ltd, Boutique Investment Partners (Pty) Ltd, Instit (Pty)Ltd, Select Manager (Pty) Ltd, Vital Consult Wealth Management (Pty) Ltd, Efficient International (Pty) Ltd (for 2016), Efficient Select Swaziland (Pty) Ltdand Rudiarius Capital Management (Pty) Ltd.
DD Roodt, H Weidhase and SF Booysen (directors of the Company) are shareholders and directors of Midnight Storm Investments (Pty) Ltd. The Grouprented its Dely Road offices in Alphenpark from Midnight Storm Investments (Pty) Ltd at market related tariffs and thereafter purchased the propertyfrom this related party at a market related consideration of R9.60 million.
AH Ernst is a shareholder and director of Uhuru Asset Management (Pty) Ltd and also key management of the Group. During the current year, the Groupacquired the business of Uhuru Asset Management (Pty) Ltd at a market related consideration of R6.61 million (including contributions from the previousshareholders of Uhuru Asset Management (Pty) Ltd).
Entities within the Group also have common directors who enter into agreements with the Company on behalf of group companies.
Services and Solutions
Share of profits from investments in equity-accounted associates, net oftaxation
Group Company
68
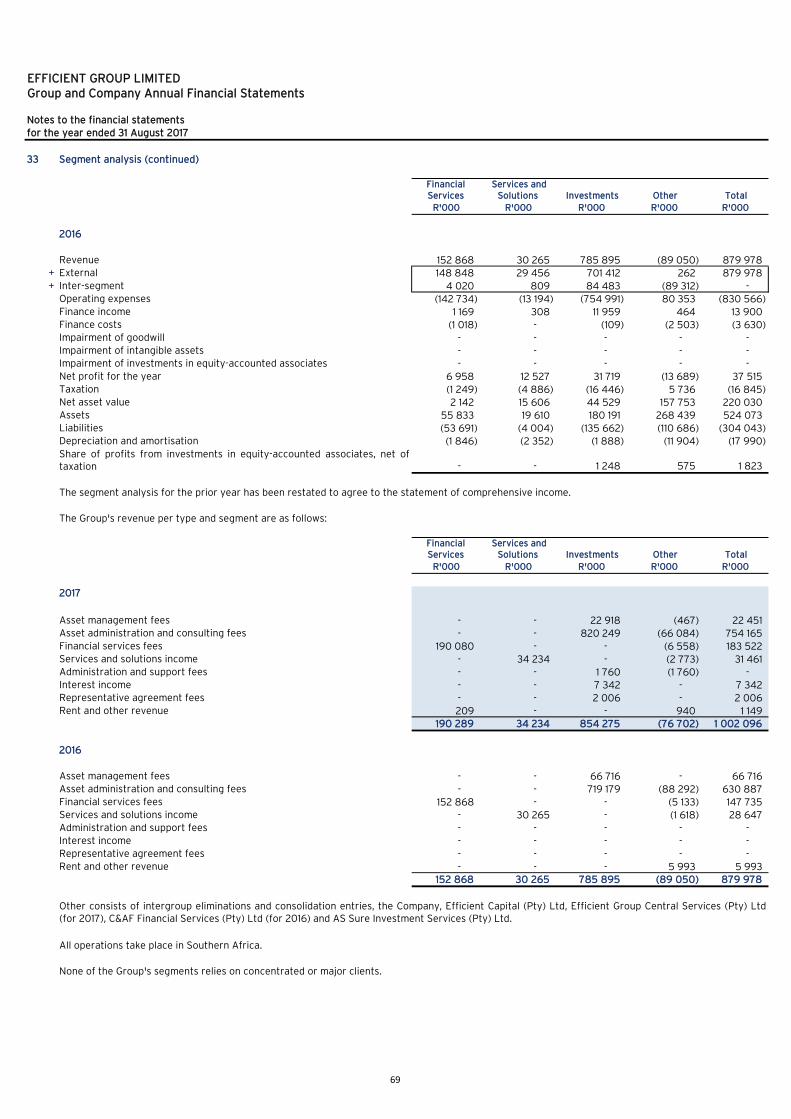
EFFICIENT GROUP LIMITEDGroup and Company Annual Financial Statements
Notes to the financial statements
for the year ended 31 August 2017
33 Segment analysis (continued)
Financial Services
Services and Solutions Investments Other Total
R'000 R'000 R'000 R'000 R'000
2016
Revenue 152 868 30 265 785 895 (89 050) 879 978 + External 148 848 29 456 701 412 262 879 978 + Inter-segment 4 020 809 84 483 (89 312) -
Operating expenses (142 734) (13 194) (754 991) 80 353 (830 566) Finance income 1 169 308 11 959 464 13 900 Finance costs (1 018) - (109) (2 503) (3 630) Impairment of goodwill - - - - - Impairment of intangible assets - - - - - Impairment of investments in equity-accounted associates - - - - - Net profit for the year 6 958 12 527 31 719 (13 689) 37 515 Taxation (1 249) (4 886) (16 446) 5 736 (16 845) Net asset value 2 142 15 606 44 529 157 753 220 030 Assets 55 833 19 610 180 191 268 439 524 073 Liabilities (53 691) (4 004) (135 662) (110 686) (304 043) Depreciation and amortisation (1 846) (2 352) (1 888) (11 904) (17 990)
- - 1 248 575 1 823
The segment analysis for the prior year has been restated to agree to the statement of comprehensive income.
The Group's revenue per type and segment are as follows:
Financial Services
Services and Solutions Investments Other Total
R'000 R'000 R'000 R'000 R'000
2017
Asset management fees - - 22 918 (467) 22 451 Asset administration and consulting fees - - 820 249 (66 084) 754 165 Financial services fees 190 080 - - (6 558) 183 522 Services and solutions income - 34 234 - (2 773) 31 461 Administration and support fees - - 1 760 (1 760) - Interest income - - 7 342 - 7 342 Representative agreement fees - - 2 006 - 2 006 Rent and other revenue 209 - - 940 1 149
190 289 34 234 854 275 (76 702) 1 002 096
2016
Asset management fees - - 66 716 - 66 716 Asset administration and consulting fees - - 719 179 (88 292) 630 887 Financial services fees 152 868 - - (5 133) 147 735 Services and solutions income - 30 265 - (1 618) 28 647 Administration and support fees - - - - - Interest income - - - - - Representative agreement fees - - - - - Rent and other revenue - - - 5 993 5 993
152 868 30 265 785 895 (89 050) 879 978
None of the Group's segments relies on concentrated or major clients.
Other consists of intergroup eliminations and consolidation entries, the Company, Efficient Capital (Pty) Ltd, Efficient Group Central Services (Pty) Ltd(for 2017), C&AF Financial Services (Pty) Ltd (for 2016) and AS Sure Investment Services (Pty) Ltd.
Share of profits from investments in equity-accounted associates, net oftaxation
All operations take place in Southern Africa.
69

EFFICIENT GROUP LIMITEDGroup and Company Annual Financial Statements
Notes to the financial statements
for the year ended 31 August 2017
34 Share-incentive schemes
34.1 Share appreciation rights (SARs)
The following SARs were outstanding at the reporting date:
Grant year
Grantdate
Vestingdate
Grant price per SAR(Cents)
Granted '000
Forfeited'000
Exercised'000
Balance'000
Group
2013 2012-10-31 2015-08-31 94 407 (145) (124) 138 2014 2013-10-21 2016-08-31 200 536 (228) (105) 203 2015 2015-01-15 2017-08-31 374 269 (64) (28) 177 2016 2016-06-23 2018-08-31 546 900 - - 900 2017 2016-11-10 2019-08-31 536 3 188 (692) - 2 496
3 914
Company
2013 2012-10-31 2015-08-31 94 174 (25) (45) 104 2014 2013-10-21 2016-08-31 200 228 (21) (61) 146 2015 2015-01-15 2017-08-31 374 51 (17) - 34 2016 2016-06-23 2018-08-31 546 406 - - 406 2017 2016-11-10 2019-08-31 536 875 - - 875
1 565
Reconciliation of rights and rewards
Number of SARs '000
Weighted average exercise
price(Cents)
Number of SARs '000
Weighted average
exercise price(Cents)
Group
Balance at the beginning of the year 1 556 413 836 210 Grant during the year 3 188 536 900 546 Vested and exercised during the year (82) 193 (119) 94 Forfeited during the year (748) 518 (61) 211 Balance at the end of the year 3 914 498 1 556 413
Company
Balance at the beginning of the year 757 378 390 175 Grant during the year 875 536 406 546 Vested and exercised during the year (67) 191 (39) 94 Forfeited during the year - - - - Balance at the end of the year 1 565 474 757 378
2017 2016
SARs have a vesting period of three years and are considered to be cash-settled share-based payments. The grant price and exercise price of theserights are equal to the 20-day volume weighted average traded market price (VWAP) of the shares preceding the date of the grant or exercise. Rightsand awards are conditional on performance conditions being met. The conditions focus on the Group's earnings growth and share price performance.
Share-incentives, in the form of share appreciation rights (SARs) and a share-purchase scheme, are offered to the executive directors and otheremployees and aim to retain key skills in the Group.
70

EFFICIENT GROUP LIMITEDGroup and Company Annual Financial Statements
Notes to the financial statements
for the year ended 31 August 2017
34 Share-incentive schemes (continued)
34.1 Share appreciation rights (SARs) (continued)
Fair valueper SAR
Fair valueper SAR
2017 2016
Cents Cents
The fair value at the reporting date of each SAR granted is as follows:
2013 305 429 2014 199 323 2015 25 201 2016 92 167 2017 149 -
Average fair value of SARs 155 280
2017 2016
% %
Risk-free interest rate 8,57% 9,02%Dividend yield 2,03% 1,26%Expected volatility 81,30% 52,00%
2017 2016 2017 2016
R'000 R'000 R'000 R'000
Share-based payment expense recognised in profit of loss 462 1 322 29 688
Shared-based payment liability included in trade and other payables 2 587 2 385 1 229 1 410
34.2 Share-purchase scheme
2017 2016 2017 2016
R'000 R'000 R'000 R'000
Outstanding loan balance receivable in terms of the share-incentive scheme 908 1 069 908 1 069 Interest income recognised on loans receivable in profit or loss 57 70 57 70
35 Risk management
As risk is an inherent part of any business, risk management within the Group is a multi-faceted process which involves independent monitoring, frequentcommunication, the application of judgement and detailed knowledge of specialised products and markets. Senior management takes an active role in therisk management process and is responsible for the maintenance of, and ultimately compliance with, risk management framework. The businessrecognises that in a complex financial services environment, risk management processes are evolutionary and should be subject to ongoing review andmodification.
The fair value of the SARs was determined using a Black Scholes valuation model. The following assumptions were used inthe model:
Company
Expected volatility has been based on an evaluation of the historical volatility of the Company's share price, particularly over the historical periodcommensurate with the expected term.
During 2014, 1 997 661 ordinary shares in the Company were issued to employees at a fair value of R1.53 per share in terms of the share-incentivescheme. In terms of the scheme, loans were granted to fund 75% of the acquisition of these shares. The loans are repayable on 31 August 2018. Theloans bear interest at the official rate of interest as defined in the Income Tax Act of South Africa. Employees can not trade the shares until the debt ispaid in full. Refer to note 8.2 for more detail regarding these loans.
Group Company
The Group has identified various risks as being of particular significance to its business.
The board is responsible for identifying the risks faced by the Group, ensuring that the controls established to manage those risks are effective, and forthe monitoring of their application. The risk management function is also responsible for ensuring that consistent policies and procedures are establishedfor measuring, managing and reporting risk.
For the purpose of this note and note 36; financial instruments exclude prepayments, VAT and taxation balances, income received in advance, payrolland other employee accruals (including share-based payments) and provisions.
Group
71

EFFICIENT GROUP LIMITEDGroup and Company Annual Financial Statements
Notes to the financial statements
for the year ended 31 August 2017
35 Risk management (continued)
35.1 Market risk
Price risk
Impact on profit
before tax Impact on
equity
Impact on profit
before tax Impact on
equity
% R'000 R'000 R'000 R'000
2017
Financial Services 10% 8 084 5 821 - -
Investments 10% 18 558 13 362 200 144
2016
Financial Services 10% 7 427 5 347 - -
Investments 10% 20 280 14 602 103 74
Impact on profit
before tax Impact on
equity
Impact on profit
before tax Impact on
equity
% R'000 R'000 R'000 R'000
2017
Interest-earning assets and interest-bearing liabilities 1% 409 295 46 33
2016
Interest-earning assets and interest-bearing liabilities 1% 368 265 (206) (148)
35.2 Credit risk
Reasonable possible change
Price risk is the risk that the Group's position will be adversely affected by movements in the prices of instruments in financial markets. The Group'srevenue is dependent on the value of assets under advice and assets under management, which is subject to this market risk factor.
The impact on profit before tax is calculated by applying the reasonable possible movement, and the margin applicable to each respective entity, torevenue derived from its assets subject to this risk where this revenue is a direct function of the value of these assets. The analysis is based on theassumption that the returns have increased or decreased as disclosed with all other variables held constant.
Group Company
Deposits and bank balances attract interest at rates that vary with market interest rates and the Group pays interest on loans and borrowings at avariable interest rate. The Group policy is not to manage interest rate risk, as fluctuations in variable rates do not have a material impact on profit orloss. Interest rate risk may translate into cash flow risk on a scale that is manageable considering the Group's debt levels and cash generating ability.
Company Group
All cash on call held by the Group is held with reputable banks with high credit quality including Investec Ltd, First National Bank (a division of FirstRandBank Ltd) and Standard Bank of South Africa Ltd.
Credit risk is that of default on a debt that may arise from a borrower or debtor failing to make required payments. This includes potential lost capitaland interest, disruption to cash flows, and collection costs. The Group is exposed to this risk principally through trade receivables that mainly consist ofdebtors related to the revenue from management and administration of collective investment schemes. The risk of default on this debt is low as thedebtors are all highly regulated financial institutions that is required to comply with stringent laws and regulations that in most cases includeconservative capital adequacy requirements and financial soundness measures.
The table below summarises the impact of reasonable possible movements in the value of financial assets to which the Group is exposed throughcollective investment schemes and private share portfolios that it manages on the pre-tax profit and equity of the investments and financial servicesstrategies of the Group.
The table below indicates the impact on profit before tax and equity at the reporting date, if interest rates relevant to the interest-earning and interest-bearing balances, had been lower or higher, with all other variables held being constant.
Reasonable possible change
72
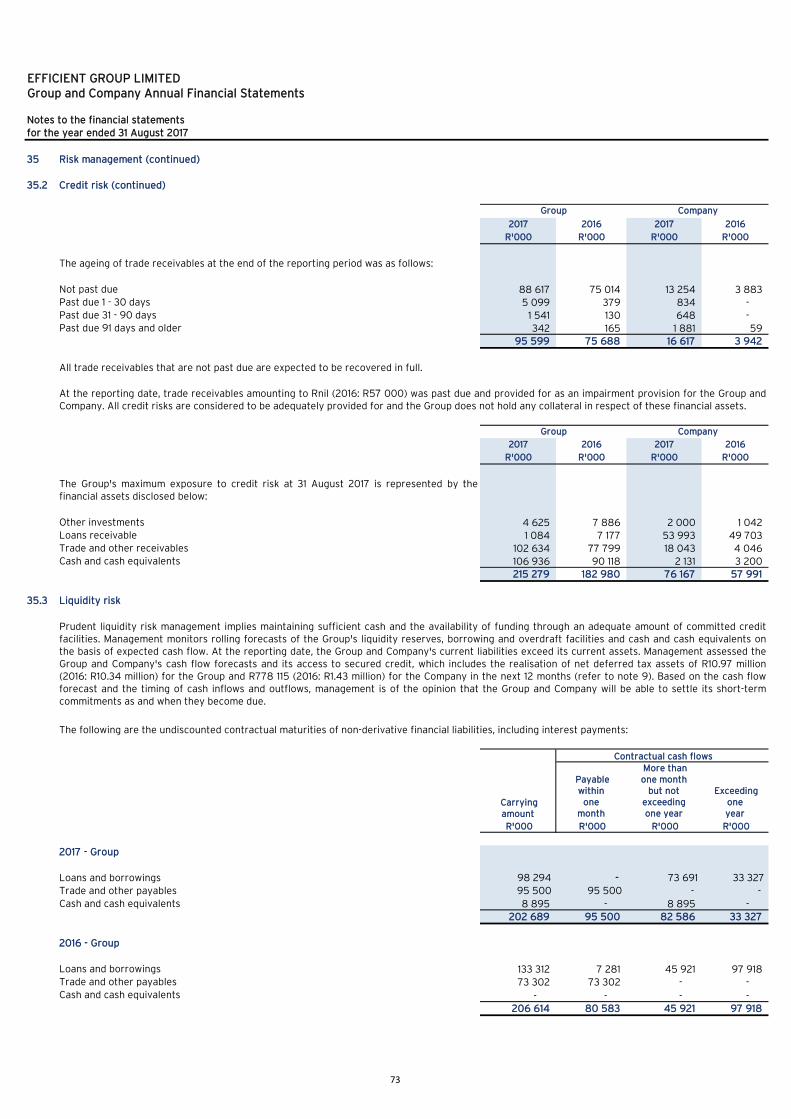
EFFICIENT GROUP LIMITEDGroup and Company Annual Financial Statements
Notes to the financial statements
for the year ended 31 August 2017
35 Risk management (continued)
35.2 Credit risk (continued)
2017 2016 2017 2016
R'000 R'000 R'000 R'000
The ageing of trade receivables at the end of the reporting period was as follows:
Not past due 88 617 75 014 13 254 3 883 Past due 1 - 30 days 5 099 379 834 - Past due 31 - 90 days 1 541 130 648 -
342 165 1 881 59 95 599 75 688 16 617 3 942
2017 2016 2017 2016
R'000 R'000 R'000 R'000
Other investments 4 625 7 886 2 000 1 042 Loans receivable 1 084 7 177 53 993 49 703 Trade and other receivables 102 634 77 799 18 043 4 046 Cash and cash equivalents 106 936 90 118 2 131 3 200
215 279 182 980 76 167 57 991
35.3 Liquidity risk
The following are the undiscounted contractual maturities of non-derivative financial liabilities, including interest payments:
Payablewithin
onemonth
More thanone month
but notexceedingone year
Exceedingoneyear
R'000 R'000 R'000 R'000
2017 - Group
Loans and borrowings 98 294 - 73 691 33 327
Trade and other payables 95 500 95 500 - -
Cash and cash equivalents 8 895 - 8 895 -
202 689 95 500 82 586 33 327
2016 - Group
Loans and borrowings 133 312 7 281 45 921 97 918 Trade and other payables 73 302 73 302 - - Cash and cash equivalents - - - -
206 614 80 583 45 921 97 918
Group
Prudent liquidity risk management implies maintaining sufficient cash and the availability of funding through an adequate amount of committed creditfacilities. Management monitors rolling forecasts of the Group's liquidity reserves, borrowing and overdraft facilities and cash and cash equivalents onthe basis of expected cash flow. At the reporting date, the Group and Company's current liabilities exceed its current assets. Management assessed theGroup and Company's cash flow forecasts and its access to secured credit, which includes the realisation of net deferred tax assets of R10.97 million(2016: R10.34 million) for the Group and R778 115 (2016: R1.43 million) for the Company in the next 12 months (refer to note 9). Based on the cash flowforecast and the timing of cash inflows and outflows, management is of the opinion that the Group and Company will be able to settle its short-termcommitments as and when they become due.
At the reporting date, trade receivables amounting to Rnil (2016: R57 000) was past due and provided for as an impairment provision for the Group andCompany. All credit risks are considered to be adequately provided for and the Group does not hold any collateral in respect of these financial assets.
Company
The Group's maximum exposure to credit risk at 31 August 2017 is represented by thefinancial assets disclosed below:
Carrying amount
Contractual cash flows
All trade receivables that are not past due are expected to be recovered in full.
Past due 91 days and older
Group Company
73

EFFICIENT GROUP LIMITEDGroup and Company Annual Financial Statements
Notes to the financial statements
for the year ended 31 August 2017
35 Risk management (continued)
35.3 Liquidity risk (continued)
Payablewithin
onemonth
More thanone month
but notexceedingone year
Exceedingoneyear
R'000 R'000 R'000 R'000
2017 - Company
Loans and borrowings 68 502 - 65 060 5 786
Trade and other payables 924 924 - -
Cash and cash equivalents 8 832 - 8 832 - 78 258 924 73 892 5 786
2016 - Company
Loans and borrowings 103 283 - 36 595 79 127
Trade and other payables 14 545 14 545 - -
Cash and cash equivalents - - - - 117 828 14 545 36 595 79 127
35.4 Capital risk management
2017 2016 2017 2016
R'000 R'000 R'000 R'000
Total liabilities 312 960 304 043 82 345 124 897
Liabilities carried at fair value through profit or loss (43 697) (81 906) (32 112) (69 095)
Vendor-finance liabilities (1 312) (5 337) (5 429) -
Other non-interest bearing liabilities (205 771) (170 731) (5 011) (21 614)
Interest bearing debt 62 180 46 069 39 793 34 188
Total equity 267 998 220 030 315 016 238 778
Non-controlling interests (5 592) 2 443 - -
Equity attributable to equity holders of the parent 262 406 222 473 315 016 238 778
2017 2016 2017 2016
% % % %
Debt-equity ratio 23,70% 20,71% 12,63% 14,32%
Company
Group Company
Other non-interest bearing liabilities comprises provisions, trade and other payables, deferred tax liabilities and current tax payable.
The Group monitors capital using a ratio of interest-bearing debt (excluding vendor finance liabilities) to equity attributable to equity holders of theparent and aims to maintain this ratio below 100%. The debt-equity ratio at the reporting date was as follows:
Capital consists of capital and reserves as disclosed on the face of the statement of financial position. The Group's objectives when managing capital areto safeguard the Group's ability to continue as a going concern in order to provide returns for shareholders and benefits for other stakeholders, and tomaintain an optimal capital structure to reduce the cost of capital projects. Management considers capital to be equivalent to the amount reflected asequity on the statement of financial position. In order to maintain or adjust the capital structure, the Company may adjust the amount of dividendsdeclared to shareholders or sell assets of the Group to reduce debt.
Carrying amount
Contractual cash flows
Group
74
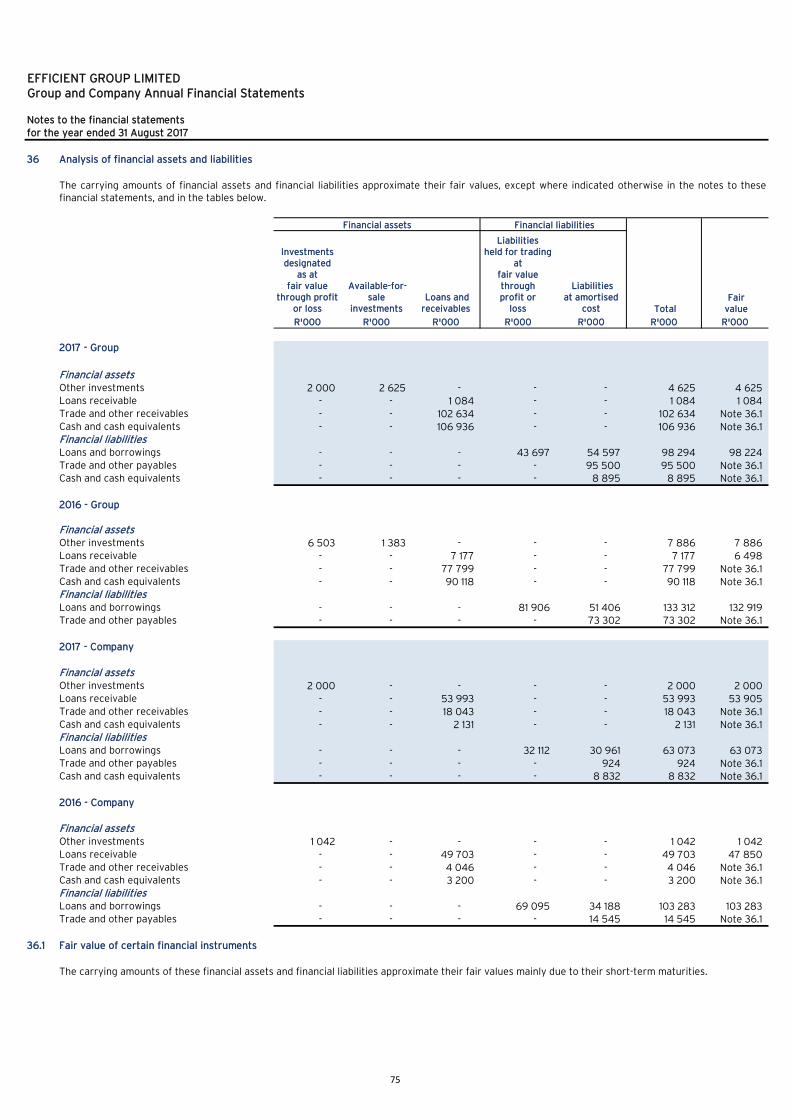
EFFICIENT GROUP LIMITEDGroup and Company Annual Financial Statements
Notes to the financial statements
for the year ended 31 August 2017
36 Analysis of financial assets and liabilities
Investmentsdesignated
as atfair value
through profitor loss
Available-for-sale
investments Loans and receivables
Liabilitiesheld for trading
atfair value through profit or
loss
Liabilitiesat amortised
cost
R'000 R'000 R'000 R'000 R'000 R'000 R'000
2017 - Group
Financial assetsOther investments 2 000 2 625 - - - 4 625 4 625 Loans receivable - - 1 084 - - 1 084 1 084 Trade and other receivables - - 102 634 - - 102 634 Note 36.1Cash and cash equivalents - - 106 936 - - 106 936 Note 36.1Financial liabilitiesLoans and borrowings - - - 43 697 54 597 98 294 98 224 Trade and other payables - - - - 95 500 95 500 Note 36.1Cash and cash equivalents - - - - 8 895 8 895 Note 36.1
2016 - Group
Financial assetsOther investments 6 503 1 383 - - - 7 886 7 886 Loans receivable - - 7 177 - - 7 177 6 498 Trade and other receivables - - 77 799 - - 77 799 Note 36.1Cash and cash equivalents - - 90 118 - - 90 118 Note 36.1Financial liabilitiesLoans and borrowings - - - 81 906 51 406 133 312 132 919 Trade and other payables - - - - 73 302 73 302 Note 36.1
2017 - Company
Financial assetsOther investments 2 000 - - - - 2 000 2 000 Loans receivable - - 53 993 - - 53 993 53 905 Trade and other receivables - - 18 043 - - 18 043 Note 36.1Cash and cash equivalents - - 2 131 - - 2 131 Note 36.1Financial liabilitiesLoans and borrowings - - - 32 112 30 961 63 073 63 073 Trade and other payables - - - - 924 924 Note 36.1Cash and cash equivalents - - - - 8 832 8 832 Note 36.1
2016 - Company
Financial assetsOther investments 1 042 - - - - 1 042 1 042 Loans receivable - - 49 703 - - 49 703 47 850 Trade and other receivables - - 4 046 - - 4 046 Note 36.1Cash and cash equivalents - - 3 200 - - 3 200 Note 36.1Financial liabilitiesLoans and borrowings - - - 69 095 34 188 103 283 103 283 Trade and other payables - - - - 14 545 14 545 Note 36.1
36.1 Fair value of certain financial instruments
The carrying amounts of financial assets and financial liabilities approximate their fair values, except where indicated otherwise in the notes to thesefinancial statements, and in the tables below.
The carrying amounts of these financial assets and financial liabilities approximate their fair values mainly due to their short-term maturities.
Financial assets
Fair value
Financial liabilities
Total
75

EFFICIENT GROUP LIMITEDGroup and Company Annual Financial Statements
Notes to the financial statements
for the year ended 31 August 2017
37 Events after the reporting date
+
+
+
+
+
+
Efficient Capital (Pty) Ltd;
Efficient Group Central Services (Pty) Ltd;
Efficient Independent Distribution Services (Pty) Ltd; and
Efficient Group Share Trust
The above financial support will be in the form of loans to the respective subsidiaries and will remain in force until each subsidiaries' current and totalassets, fairly valued exceed its current and total liabilities, respectively.
On 9 November 2017, the Company's board approved the financial support to be issued to the following subsidiaries within the Group:
Other than the above and as elsewhere disclosed in the financial statements, no significant events, occurred subsequent to the reporting date whichrequires adjustment or additional disclosure in the financial statements.
Efficient Board of Executors (Pty) Ltd;
Select Manager (Pty) Ltd;
76
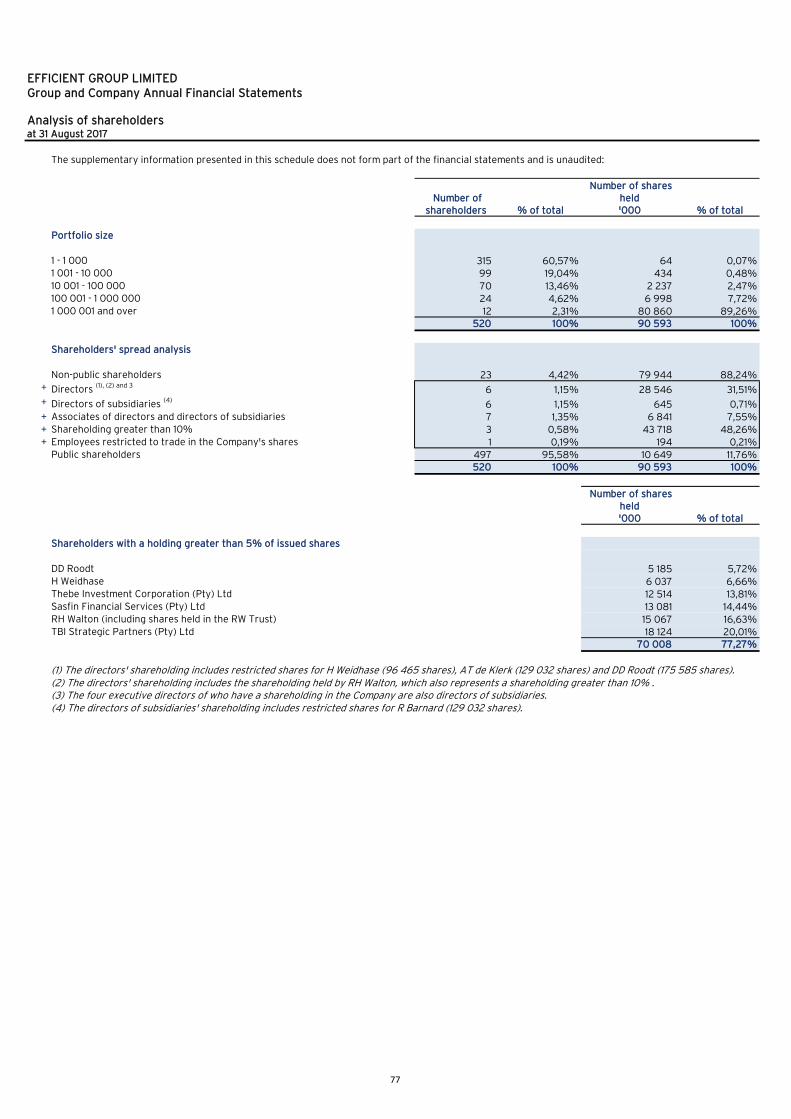
EFFICIENT GROUP LIMITEDGroup and Company Annual Financial Statements
Analysis of shareholdersat 31 August 2017
The supplementary information presented in this schedule does not form part of the financial statements and is unaudited:
Number of shareholders % of total
Number of shares held'000 % of total
Portfolio size
1 - 1 000 315 60,57% 64 0,07%1 001 - 10 000 99 19,04% 434 0,48%10 001 - 100 000 70 13,46% 2 237 2,47%100 001 - 1 000 000 24 4,62% 6 998 7,72%1 000 001 and over 12 2,31% 80 860 89,26%
520 100% 90 593 100%
Shareholders' spread analysis
Non-public shareholders 23 4,42% 79 944 88,24%+ Directors (1), (2) and 3
6 1,15% 28 546 31,51%+ Directors of subsidiaries (4)
6 1,15% 645 0,71%+ Associates of directors and directors of subsidiaries 7 1,35% 6 841 7,55%+ Shareholding greater than 10% 3 0,58% 43 718 48,26%+ 1 0,19% 194 0,21%
Public shareholders 497 95,58% 10 649 11,76%520 100% 90 593 100%
Number of shares held'000 % of total
Shareholders with a holding greater than 5% of issued shares
DD Roodt 5 185 5,72%H Weidhase 6 037 6,66%Thebe Investment Corporation (Pty) Ltd 12 514 13,81%Sasfin Financial Services (Pty) Ltd 13 081 14,44%RH Walton (including shares held in the RW Trust) 15 067 16,63%TBI Strategic Partners (Pty) Ltd 18 124 20,01%
70 008 77,27%
(1) The directors' shareholding includes restricted shares for H Weidhase (96 465 shares), AT de Klerk (129 032 shares) and DD Roodt (175 585 shares).
Employees restricted to trade in the Company's shares
(2) The directors' shareholding includes the shareholding held by RH Walton, which also represents a shareholding greater than 10% .(3) The four executive directors of who have a shareholding in the Company are also directors of subsidiaries.(4) The directors of subsidiaries' shareholding includes restricted shares for R Barnard (129 032 shares).
77