efficiency of three pcr based marker systems for detecting...
TRANSCRIPT

http://astonjournals.com/gebj
1 Genetic Engineering and Biotechnology Journal, Volume 2010: GEBJ-5
Efficiency of Three PCR based Marker Systems for Detecting DNA Polymorphism in Cicer arietinum L and Cajanus cajan L Millspaugh
Jhuma Datta1, Nand Lal1*, Mayank Kaashyap2, Prasoon P Gupta2 1Department of Life Sciences, C.S.J.M. University, Kanpur 208 024, India
2Indian Institute of Pulses Research, Kanpur 208 024, India
*Correspondence to: Nand Lal, [email protected]
Published online: April 19, 2010
Abstract Insufficient quality of molecular markers regarding their predictive and diagnostic values has delayed the benefits of marker-assisted selection. To evaluate the robustness of marker systems in detection of DNA polymorphism, 19 RAPD, 22 SSR and 20 ISSR markers were used to genetically differentiate two major pulse crops possessing different important traits. Polymorphism was 95, 93 and 87% by using ISSR, SSR and RAPD markers, respectively. The average number of amplicons/alleles obtained was 6.42 (RAPD), 1.3 (SSR) and 8.1 (ISSR). DNA profiles revealed high degree of intergeneric polymorphism, while the diversity level was considerably low among the varieties. Significant polymorphism information content (PIC) values of RAPD (0.49), SSR (0.61), ISSR (0.70) profiles were obtained. UPGMA cluster analysis of eight genotypes showed clear demarcation between the two genera falling in two separate clusters with their respective resistant and susceptible genotypes. There was a significant correlation between RAPD and SSR (r = 0.819), RAPD and ISSR (r = 0.997), SSR and ISSR (r = 0.843) GS matrices. The product moment correlation (r) and Mantel statistic (t) were calculated to measure the degree of relationship between the similarity matrices obtained by RAPD and SSR (t = 4.006), RAPD and ISSR (t= 4.473), SSR and ISSR (t = 4.120). These results illustrate the potential of all the three marker systems to distinguish pulses crop at genus leveL The information will facilitate selection of genotypes to serve as parents for effective breeding programs in crop improvement and in bridging the two important pulses crop for comparative genomics. Keywords: Cajanus; Cicer; DNA polymorphism; ISSR; marker; RAPD; SSR. Introduction Recent advances in genomics research have provided new tools, such as molecular markers, that will assist breeders in the improvement of important crops like chickpea and pigeonpea. DNA fingerprinting for cultivar or varietal identification has become an important tool for genetic identification in plant breeding and germplasm management [1]. There is a lack of information on comparative evaluation of molecular markers in pulses. There are many issues pertaining to markers suitability, number of marker combinations to be employed and relevance of appropriate marker utility parameters, which need to be addressed in every crop species prior to large-scale use of molecular markers in germplasm characterization and variety identification [2]. For DNA fingerprinting, the most important decision is the marker system and technique to be used. Use of molecular markers in genome analysis, mapping of agriculturally important traits and marker-assisted selection have been greatly advanced by the development of PCR based markers. Different molecular marker systems have been evaluated for their efficiency in detecting polymorphism and assessing genetic diversity using various statistical parameters. The Random Amplified polymorphic DNA (RAPD) marker technique [3, 4] is quick, easy and requires no prior sequence information. A single random decamer primer is used to specify the sequence that is to be amplified. The homozygous presence of fragment is not distinguishable from its heterozygote, and such RAPDs are dominant markers. The technique has been used for identification purposes in many crops like mungbean [5] and cowpea [6]. A potentially powerful technique for DNA fingerprinting is SSRs, which have long been known to be polymorphic and wide in plant genomes [7]. The

http://astonjournals.com/gebj
2 Research Article
fragment polymorphism here relates to total sequence length as determined by number of repeat units, and the heterozygote for different fragments in diploid genomes can generally be distinguished. Zietkiewicz et aL [8] and Kantley et aL [9] described a marker system referred as Inter Simple Sequence Repeats (ISSR) which makes use of anchored primers to amplify simple sequence repeats without the requirement for prior sequence information. The technique is more reliable than the RAPD technique and generates larger numbers of polymorphism per primer [10]. ISSR fingerprinting has been successfully applied to determine genetic diversity and relationships in a number of crop species [11, 12, 13]. It is clearly necessary to establish a common basis for assessing the effectiveness of the various markers systems currently available for DNA fingerprinting and several published reports on a number of plant varieties have addressed this matter [14, 15]. Previous comparisons carried out in different species have reported diverse conclusions [16, 17, 18, 19]. The objectives of this study was to assess the value of the RAPD, SSR and potentially useful ISSR marker systems for their ability to distinguish four different varieties of chickpea and pigeonpea and to identify the marker system which has (a) the number of fragments amplified per assay unit, (b) the frequency (%) of polymorphic fragment per assay unit and (c) the number of unique profiles generated.
Methods
Plant material
Two each of wilt resistant and wilt susceptible cultivars of chickpea (Cicer arietinum L) and pigeonpea (Cajanus cajan L Millspaugh) obtained from Division of Crop Protection, Indian Institute of Pulses Research, Kanpur was used for molecular study. The chickpea cultivars were WR 315, ICC 4958 (resistant) and JG 62, BG 256 (susceptible) whereas the pigeonpea cultivars comprised of Asha (ICPL 87119), Maruthi (ICP 8863) in resistant group, and Bahar and Type 7 as susceptible. Isolation and purification of total genomic DNA of plant samples
Genomic DNA from one-week-old etiolated seedlings of the chickpea and pigeonpea genotypes were isolated following modified method of Dellaporta et aL [20]. Seeds were germinated in paper towel soaked in sterilized water under etiolated conditions to minimize the contamination of chloroplast DNA. One-week old seedlings (10 seedlings/genotype) were ground in preheated CTAB buffer and incubated at 60°C for one hour. The DNA was precipitated with chilled iso-propanol and the pellet was dissolved in 100 µl of T10E1 buffer. Adding 0.5 U RNAse eliminated the RNA. The DNA concentrations were quantified by measuring absorbance using Hoefer® Dyna Quant® 200 DNA fluorometer (Amersham Biosciences, Piscataway, NJ, USA) and stocks were maintained at 25 ng/µL PCR amplification and data analysis
PCR was performed in a 20 µl reaction volumes containing 25 ng of DNA, 45 pmol each forward and reverse primer, 25 µM of each dNTPs (MBI Fermentas, La Jolla, USA) and 0.6 U of Taq polymerase (Bangalore Genei). For RAPD and ISSR, the initial denaturation was done at 92°C for 4 min followed by 45 cycles, each consisting of denaturation at 92°C for 1 min, annealing at 37°C for 1 min and elongation at 72°C for 1 min. A final extension step included 72°C incubation for 7 min followed by hold at 4°C. In case of SSR, the PCR program consisted of initial denaturation at 94°C for 3 min followed by 35 cycles, each consisting of denaturation at 94°C for 1 min, annealing at appropriate temperature for 1 min and elongation at 72°C for 2 min. A final extension step included 720C incubation for 7 min followed by hold at 4°C. PTC-200 (MJ Research, USA) thermocycler was used to carry out the reaction. PCR amplification with each primer was repeated twice before scoring for presence or absence of bands. The amplified DNA fragments were resolved on ethidium

http://astonjournals.com/gebj
3 Genetic Engineering and Biotechnology Journal, Volume 2010: GEBJ-5
bromide stained agarose gel (2%) in 1X TBE buffer at 50V. The gels were visualized on trans-UV and photographed in BioRad Gel Doc XR 2.0. The amplicons were scored as ‘1’ for presence and ‘0’ for absence. The presence and absence of amplicons for each marker system was recorded for all genotypes and then converted into genetic similarity matrix using Jaccard coefficient [21] in NTSYS-PC 2.1 [22]. The similarity coefficients were used to construct a dendrogram depicting genetic relationship using unweighted pair group mean average (UPGMA) method [23]. The Polymorphism Information Content (PIC) values were calculated following the formula described by Botstein et aL [24]: n
Polymorphism information content = 1- ∑ Pij2
j=1
Where Pij is the frequency of the jth allele for the ith marker, and summed over n alleles.
Expected heterozygosity (He) of the polymorphic locus for a genetic marker: He = 1-∑pi2, where pi is the allele frequency for the ith allele [25], and the arithmetic mean heterozygosity (Hav) was calculated as, Hav= ∑He/n, where n is the number of markers (loci analysed). Effective multiplex ratio (EMR = np β) which is the product of number of polymorphic loci (np) in the germplasm analysed and the fraction of markers that were polymorphic (β) and Marker Index (MI) which is the product of expected heterozygosity (Hav) and effective multiplex ratio was calculated. The correspondence between the RAPD, SSR and ISSR based similarity was tested based on correlation analysis and matrix correspondence test [26].
Results
RAPD fingerprinting of resistant and susceptible host cultivars
Out of 30 RAPD primers screened for amplification of DNA of chickpea and pigeonpea genotypes, 11 resulted in either sub-optimal or non-distinct amplification products. Therefore, these were discarded and remaining 19 primers that generated reproducible RAPD patterns were used for subsequent analyses (Table 1). One hundred twenty one amplicons ranging from 0.2 Kb to 11 kb was obtained with an average polymorphism of 87%. The number of amplicons per primer varied from 3 (OPP 3) to 11 (OPU 18), each primer generated an average of 6.3 RAPD markers. RAPD amplification pattern of OPU 18 and OPQ 11 is shown in Figure 1. The average polymorphic information content of 19 primers was 0.49, ranging from 0.06 to 1.59. The lowest and highest PIC values were recorded for primer OPN 6 and OPP 15, respectively. Primer OPU 18, which produced 11 amplicons, was most efficient followed by OPP 15, OPS 2 and CS 27. Ten unique bands were generated with RAPD primers namely OPC 14, OPP 15, OPP 6 and OPU 17.
Table 1. Description of repeat motifs, Tm, PIC and unique bands obtained from the RAPD markers used in fingerprinting of chickpea and pigeonpea genotypes.
Marker Primer sequences in 5'→3' direction
PIC Genotype specific unique bands (bp)
CS27 AGTGGTCGCGGCG 0.18 OPU 17 ACCTGGGGAG 0.72 ICP87119 (3021)
ICCV 4958 (761) OPU 18 GAGGTCCACA 1.25 OPQ 11 TCTCCGCAAC 0 OPD 3 GTCGCCGTCA 0.25 OPS 2 CCTCTGACTG 1

http://astonjournals.com/gebj
4 Research Article
OPP 6 GTGGGCTGAC 1.09 ICC8863 (628) OPP 8 ACATCGCCCA 0.28 OPN 6 GAGACGCACA 0.06 OPP 15 AAGCCAACAC 1.59 BG 256 (9980)
BG 256 (209) OPC 14 TGCGTGCTTG 0.21 ICC8863 (4915,
1239,952,457) OPP 17 TGACCCGCCT 0.39 OPH 1 GGTCGGAGAA 0.41 OPH 2 TCGGACGTGA 0.25 OPH 3 AGACGTCCA 0.70 OPH 4 GGAAGTCGCC 0.09 OPP 1 GTAGCACTCC 0.63 OPP 3 CTGATACGCC 0.44 OPP 4 GTGTCTCAGG 0.47
The dendrogram separated the genotypes into two main clusters (Figure 4). The first cluster included two sub clusters with WR 315 and BG 256, ICC 4958 and JG 62 clustering close to each other. The second cluster formed two sub clusters with Bahar, T7, ICPL 87119 clustering together and ICP 8863 was falling separate. The similarity coefficients based on 121 RAPD amplicons ranged from 0.30 to 0.96 (Table 4). Genotypes Type 7 and ICC 4958 showed the lowest similarity index (0.30) while genotypes WR 315 and BG 256 showed highest similarity index (0.96) with RAPD primers.
Figure 1. RAPD profiles of eight genotypes obtained with primer OPU 18 and OPQ 11
Lane M: 100 bp ladder, 1: WR 315, 2: ICC 4958, 3: JG 62, 4: BG 256, 5: ICPL 87119, 6: ICP 8863, 7: BAHAR, 8: Type 7.
Figure 2. SSR profiles of eight genotypes obtained with SSR primer TR1.
Lane M: 100 bp ladder, 1: WR 315, 2: ICC 4958, 3: JG 62, 4: BG 256, 5: ICPL 87119, 6: ICP 8863, 7: BAHAR, 8: Type 7.
M 1 2 3 4 5 6 7 8 1 2 3 4 5 6 7 8
TR 1
OPQ 11
M 1 2 3 4 5 6 7 8
OPU 18

http://astonjournals.com/gebj
5 Genetic Engineering and Biotechnology Journal, Volume 2010: GEBJ-5
Figure 3. ISSR profiles of eight genotypes obtained with ISSR primer UBC 848. Lane M: 100 bp ladder, 1: WR 315, 2: ICC 4958, 3: JG 62, 4: BG 256, 5: ICPL 87119,
6: ICP 8863, 7: BAHAR, 8: Type 7.
Figure 4. Clustering of chickpea and pigeonpea genotypes derived from a UPGMA cluster analysis based on RAPD markers. SSR fingerprinting of resistant and susceptible host cultivars
Twenty-two microsatellite markers were used to generate SSR profiles. Twenty-nine alleles ranging from 0.15 kb to 0.7 kb were obtained with an average polymorphism of 93% (Table 2). The primers generated an average of 1.31 alleles per SSR markers. SSR amplification pattern of TR 1 is shown in Figure 2. The average polymorphic information content of 22 primers was 0.61, ranging from 0.23 to 0.94. The lowest and highest PIC values were recorded for primer TR1 and AGLC 53, respectively. Two unique alleles were generated with SSR primers 66 and 23 in genotypes ICP 87119 and JG 62, respectively.
The dendrogram separated the genotypes into two main clusters (Figure 5). The first cluster included two subcluster with BG 256, ICC 4958, JG 62 clustering close together, and WR 315 falling separate. The second cluster formed two sub clusters with Bahar, Type 7 and ICP 8863 were falling close together and ICPL 87119 clustering separately. The similarity
M 1 2 3 4 5 6 7 8
UBC 848

http://astonjournals.com/gebj
6 Research Article
coefficients based on 29 alleles ranged from 0.15 to 0.94. Genotypes WR 315 and ICPL 87119, ICP 8863, Bahar showed the lowest similarity index (0.15) while genotypes Type 7 and ICP 8863 showed highest similarity index (0.94) with SSR primers.
Table 2. Description of repeat motifs, PIC and unique bands obtained from the SSR markers used in fingerprinting of chickpea and pigeonpea genotypes.
Marker Primer sequences in 5'→3' direction Repeat Motif
Tm o C
Alleles
PIC
Unique bands
TR1
CGTATGATTTTGCCGTCTAT ACCTCAAGTTCTCCGAAGT
(TAA)31
56.3 58.4
5
0.23
TR20 ACCTGCTTGTTTAGCACAAT CCGCATAGCAATTTATCTTC
(TAA)18 56.3 56.3
6 0.50
STMS23 CCCTTCTAGTGATATTTTG AAATGTGTTTTATGGAATAAGTCAT
Long imperfect ATT repeat
53.7 54.7
4 0.61
TA30 TCATTAAAATTCTATTGTCCTGTCCTT TTTTTCTAAACTAAATTGTGCAT
(TAA)18TA (TAA)19
58.5 57.0
1 0.23
AGLC16 TCATTAAAATTCTATTGTCCTGTCCTT TTTTTCTAAACTAAATTGTGCAT
- 58.5 57.0
1 0.86
AGLC34 CTTTACCAAAACCACCTTCACCAA TCTCTCTCTCTCTCTTCTGTTCCA
- 61.1 62.8
- 0.59
ICP 87119 (456)
AGLC52 CGATCAAGAACCCAGTTTTGCAA AAGATCGACAGGCGATCTGGTA
- 60.9 62.6
- 0.00
STMS13 TATGTTAAAAGAGAAAGAAGAAGTGAT TTTTATTAGTTGTCGAAATGTATATCA
(GAA)9 57.0 55.5
1 0.00
GA2 TGCATTGGAAATACAGCATGA AATTTTGGTTCGCCACAAAC
(CT)11 56.7 56.3
2 0.94
TA194 TTTTTGGCTTATTAGACTGACTT TTGCCATAAAATACAAAATCC
(TAA)21 55.6 52.
4 0.84
JG 62 (172)

http://astonjournals.com/gebj
7 Genetic Engineering and Biotechnology Journal, Volume 2010: GEBJ-5
8 AGLC 53 CACTCTCCGTTCCGCTTCCA
CTGTCCATGCCCTTGTCCA - 64.
5 62.3
- 0.94
CCB 6 ACAATGCTAGGGAACACCGC TACCTTAACCCACAATGGCC
(CA)6 62.4 60.4
0.72
CCB 7 CAACATTTGGACTAAAAACTGV AGGTATCCAATATCCAACTTG
(CT)16 54.8 56.7
0.75
CCB 8 TGCGTTTGTAAGCATTCTTCA ACTTGAGGCTGAATGGATTTG
(CT)30 58.7 56.7
0.75
CCB 9 CACTTGGTTGGCTCAAGAAC GCCAATGAACTCACATCCTTC
(CT)22 60.6 60.4
0.75
CCB 10 CCTTCTTAAGGTGAAATGCAAGC CATAACAATAAAAGACCTTGAAT
(CA)15 58.0 61.0
0.50
CCB1 AAGGGTTGTATCTCCGCGTG GCAAAGCAGCAATCATTTCG
(CA)10 62.4 58.4
0.88
CCB2 CATAATCCAATCCAAATCC AGAAGGCTTTCATGTAACGC
(CA)21 56.3 58.4
0.86
CCB 4 GGAGCTATGTTGGAGGATGA CCTTTTTGCATGGGTTGTAT
(CA)31
60.4 56.3
0.00
TA 140 TTTTGGCATGTTGTAGTAATCATATTT TGAAATGAAAAAGAAAGGAAAAAGTA
(TAA)5TT(A)3(TAA)18
57.0 55.5
4 0.86
STMS 21 CTACAGTCTTTTGTTCTTCTAGCTT ATATTTTTTAGAGGCTTTTGGTAG
(CT)9 (CTTT)2 (CT)4
59.7 56.3
2 0.00
TA 113 TCTGCAAAAACTATTACGTTAATACCA TTGTGTGTAATGGATTGAGTATCTCTT
(TAA26) 58.5 60.0
4 0.86

http://astonjournals.com/gebj
8 Research Article
Figure 5. Clustering of chickpea and pigeonpea genotypes derived from a UPGMA cluster analysis based on SSR markers.
Table 3. Description of primer sequences, Tm, PIC and unique bands obtained from the ISSR markers used in
fingerprinting of chickpea and pigeonpea genotypes.
Marker Primer sequences in 5'→3' direction
Tm o C
PIC Unique bands
UBC848 CACACACACACACACARG 52.1 2.49 JG 62 (2601) ICC 4958 (1166)
UBC 825 ACACACACACACACACT 54.7 0.51 UBC 808 AGAGAGAGAGAGAGAGC 51.3 0.67 T7 (1027, 789) UBC 815 CTCTCTCTCTCTCTCTG 51.3 0.36 T7 (910) UBC 824 TCTCTCTCTCTCTCTCG 51.3 0.33 WR 315 (910)
ICPL 87119 (891) UBC 826 ACACACACACACACACACC 51.3 0.47 UBC 827 ACACACACACACACACG 51.3 0.16 JG 62 (1635)
Bahar (1342) UBC 847 CACACACACACACACARC 52.1 0.51 UBC 823 TCTCTCTCTCTCTCTCC 57.1 0.99 UBC 811 GAGAGAGAGAGAGAGAC 57.1 0.13 UBC 810 GAGAGAGAGAGAGAGAT 54.7 0.38 UBC 809 AGAGAGAGAGAGAGG 57.1 0.94 UBC 807 AGAGAGAGAGAGAGAGT 54.7 1.00 UBC 888 VDVCACACACACACACA 57.1 1.48 UBC 885 BHBGAGAGAGAGAGA 57.1 0.78 UBC 855 ACACACACACACACACYA 57.6 0.00 UBC 854 TCTCTCTCTCTCTCTCCRG 57.6 1.40 UBC 840 GAGAGAGAGAGAGAGAYT 57.1 1.03 UBC 836 AGAGAGAGAGAGAGAGYA 49.8 0.28 UBC 852 TCTCTCTCTCTCTCTCRA 49.8 0.14
http://astonjournals.com/gebj
9 Genetic Engineering and Biotechnology Journal, Volume 2010: GEBJ-5
ISSR fingerprinting of resistant and susceptible host cultivars
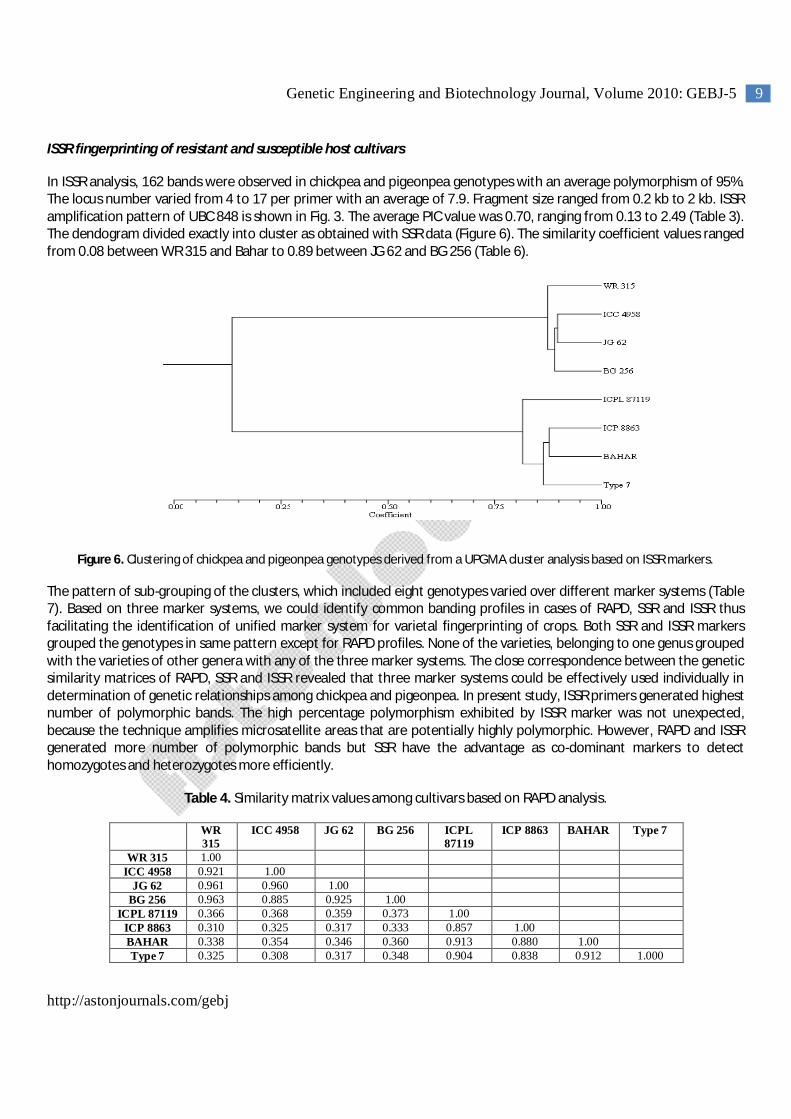
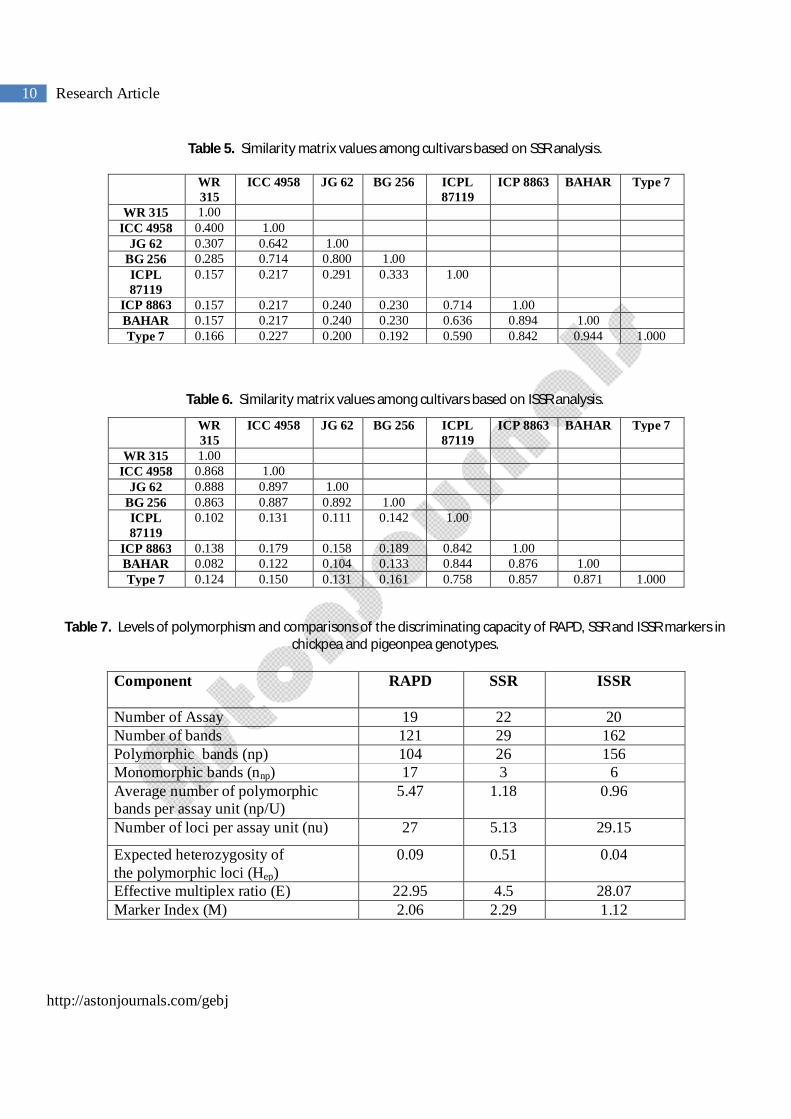
In ISSR analysis, 162 bands were observed in chickpea and pigeonpea genotypes with an average polymorphism of 95%. The locus number varied from 4 to 17 per primer with an average of 7.9. Fragment size ranged from 0.2 kb to 2 kb. ISSR amplification pattern of UBC 848 is shown in Fig. 3. The average PIC value was 0.70, ranging from 0.13 to 2.49 (Table 3). The dendogram divided exactly into cluster as obtained with SSR data (Figure 6). The similarity coefficient values ranged from 0.08 between WR 315 and Bahar to 0.89 between JG 62 and BG 256 (Table 6).
Figure 6. Clustering of chickpea and pigeonpea genotypes derived from a UPGMA cluster analysis based on ISSR markers.
The pattern of sub-grouping of the clusters, which included eight genotypes varied over different marker systems (Table 7). Based on three marker systems, we could identify common banding profiles in cases of RAPD, SSR and ISSR thus facilitating the identification of unified marker system for varietal fingerprinting of crops. Both SSR and ISSR markers grouped the genotypes in same pattern except for RAPD profiles. None of the varieties, belonging to one genus grouped with the varieties of other genera with any of the three marker systems. The close correspondence between the genetic similarity matrices of RAPD, SSR and ISSR revealed that three marker systems could be effectively used individually in determination of genetic relationships among chickpea and pigeonpea. In present study, ISSR primers generated highest number of polymorphic bands. The high percentage polymorphism exhibited by ISSR marker was not unexpected, because the technique amplifies microsatellite areas that are potentially highly polymorphic. However, RAPD and ISSR generated more number of polymorphic bands but SSR have the advantage as co-dominant markers to detect homozygotes and heterozygotes more efficiently.
Table 4. Similarity matrix values among cultivars based on RAPD analysis.
WR 315
ICC 4958 JG 62 BG 256 ICPL 87119
ICP 8863 BAHAR Type 7
WR 315 1.00 ICC 4958 0.921 1.00
JG 62 0.961 0.960 1.00 BG 256 0.963 0.885 0.925 1.00
ICPL 87119 0.366 0.368 0.359 0.373 1.00 ICP 8863 0.310 0.325 0.317 0.333 0.857 1.00 BAHAR 0.338 0.354 0.346 0.360 0.913 0.880 1.00 Type 7 0.325 0.308 0.317 0.348 0.904 0.838 0.912 1.000
http://astonjournals.com/gebj
10 Research Article
Table 5. Similarity matrix values among cultivars based on SSR analysis.
WR 315
ICC 4958 JG 62 BG 256 ICPL 87119
ICP 8863 BAHAR Type 7
WR 315 1.00 ICC 4958 0.400 1.00
JG 62 0.307 0.642 1.00 BG 256 0.285 0.714 0.800 1.00 ICPL 87119
0.157 0.217 0.291 0.333 1.00
ICP 8863 0.157 0.217 0.240 0.230 0.714 1.00 BAHAR 0.157 0.217 0.240 0.230 0.636 0.894 1.00 Type 7 0.166 0.227 0.200 0.192 0.590 0.842 0.944 1.000
Table 6. Similarity matrix values among cultivars based on ISSR analysis.
WR 315
ICC 4958 JG 62 BG 256 ICPL 87119
ICP 8863 BAHAR Type 7
WR 315 1.00 ICC 4958 0.868 1.00
JG 62 0.888 0.897 1.00 BG 256 0.863 0.887 0.892 1.00 ICPL 87119
0.102 0.131 0.111 0.142 1.00
ICP 8863 0.138 0.179 0.158 0.189 0.842 1.00 BAHAR 0.082 0.122 0.104 0.133 0.844 0.876 1.00 Type 7 0.124 0.150 0.131 0.161 0.758 0.857 0.871 1.000
Table 7. Levels of polymorphism and comparisons of the discriminating capacity of RAPD, SSR and ISSR markers in chickpea and pigeonpea genotypes.
Component RAPD SSR ISSR
Number of Assay 19 22 20 Number of bands 121 29 162 Polymorphic bands (np) 104 26 156 Monomorphic bands (nnp) 17 3 6 Average number of polymorphic bands per assay unit (np/U)
5.47 1.18 0.96
Number of loci per assay unit (nu) 27 5.13 29.15
Expected heterozygosity of the polymorphic loci (Hep)
0.09 0.51 0.04
Effective multiplex ratio (E) 22.95 4.5 28.07 Marker Index (M) 2.06 2.29 1.12

http://astonjournals.com/gebj
11 Genetic Engineering and Biotechnology Journal, Volume 2010: GEBJ-5
Discussion
Efficiency of molecular marker technique depends upon the amount of polymorphism it can detect among the set of genotypes under investigation. Although the three profiling techniques are all based on DNA amplification by PCR, it was expected from the nature of the primers and reaction that techniques would differ in the specific sequences targeted and in the number of fragments amplified. Interest then revolves around the comparison of techniques with respect to the number of unique groups of cultivars identified in each case, and in the formulation of some kind of common index reflecting the degree or level of DNA polymorphism generated in each case (Table 7).
Several primer pairs displayed complex banding patterns with minor bands showing weak amplification which were not considered for further analysis. The size of amplicons produced by the SSR markers was highly variable, indicating that the primers resulted in amplifications of different size other than the expected amplicons. The appearance of multiple bands has been reported earlier as the result of amplification of more than one locus by each SSR [27]. The occurrence of multiple bands from the same locus could be explained by the presence of cryptic site upstream, downstream and between the primer binding sites [28]. The generation of amplification products from a defined locus requires that the 3´ terminal nucleotides of the target sequence are perfectly complementary to the primers [29]. If amplification across genera boundary is possible, the respective loci are expected to be conserved between the two genera. However, amplification of a SSR locus in one genus/species with primers from other species does not necessarily confirm the conservation and identity of the loci. In this study, many SSRs giving amplification in chickpea, failed to produce any amplification either in all or in a particular genotype of pigeonpea. This may be due to mutation in the primer-binding site or the locus being absent at alL
Comparative studies in legumes involving RAPD, SSR and ISSR have been successfully used by very few researchers [13, 30, 31]. However, it has been carried out in many crops like rice [32], capsicum [33] and common bean [34]. The pattern of subgrouping of the clusters, which included eight genotypes varied over different marker systems. Based on three marker systems, we could identify common banding profiles in cases of RAPD, SSR and ISSR thus facilitating the identification of unified marker system for varietal fingerprinting of crops. Both SSR and ISSR markers grouped the genotypes in same pattern except for RAPD profiles. None of the varieties, belonging to one genus grouped with the varieties of other genera with any of the three marker systems. The close correspondence between the genetic similarity matrices of RAPD, SSR and ISSR revealed that all the three marker systems could be effectively used individually or in combinations for determination of genetic relationships among chickpea and pigeonpea genotypes. In present study, ISSR primers generated highest number of polymorphic bands. The high percentage polymorphism exhibited by ISSR marker was not unexpected, because the technique amplifies microsatellite areas that are potentially highly polymorphic and high percentage polymorphism (78%) was obtained in earlier studies [16]. However, RAPD and ISSR generated more number of polymorphic bands but SSR have the advantage as co-dominant markers to detect homozygotes and heterozygotes more efficiently.
Based on similarity coefficient and cluster analysis, genotypes WR 315, ICPL 87119 and ICP 8863 were found to be quite distinct and they can be used for their desirable characteristic in breeding programmes. The genetic similarities obtained from the analysis can also be used for selection of parents to generate mapping populations and for selecting parents for breeding purposes. All three marker systems could successfully distinguish the Cicer and Cajanus varieties but problems were experienced with the reproducibility of RAPD and ISSR markers compared to the multi-locus SSR marker system. However, they will remain useful where the costs exclude the use of SSRs.
Recent advances in genomics research have provided new techniques, such as molecular markers, that have become an important tool for improvement of important crops like chickpea and pigeonpea [1]. For DNA fingerprinting, the most important consideration is the marker system to be used. There is a lack of information on comparative evaluation of molecular markers in pulse crops [35]. The present study addresses potential use of different PCR-based molecular

http://astonjournals.com/gebj
12 Research Article
markers (RAPD, ISSR and SSR) for inter-generic molecular identification, fingerprinting and assessing the genetic diversity among four varieties each of chickpea and pigeonpea. A comparative evaluation of three PCR based marker systems RAPD, SSR and ISSR was carried out for their potential application in diversity analysis and fingerprinting of pulses crops. In the present study, 19 RAPD, 22 SSR and 20 ISSR markers were used to investigate the genetic identity and distinctiveness among these crops at both genus and varietal leveL There are many issues pertaining to markers suitability, number of marker combinations to be employed and relevance of appropriate marker utility parameters, which need to be addressed in every crop species prior to large-scale use of molecular markers in germplasm characterization and variety identification [2]. Use of molecular markers in genome analysis, mapping of agriculturally important traits and marker-assisted selection have been greatly advanced by the development of PCR based markers. Different molecular marker systems have been evaluated for their efficiency in detecting polymorphism and assessing genetic diversity using various statistical parameters. The Random Amplified polymorphic DNA (RAPD) marker technique [3, 4] is quick, easy and requires no prior sequence information. A single random 10-mer primer is used to specify the sequence that is to be amplified. The homozygous presence of fragment is not distinguishable from its heterozygote, and such RAPDs are dominant markers. The technique has been used for identification purposes in many crops like mungbean [5] and cowpea [6]. A potentially powerful technique for DNA fingerprinting is SSRs, which have long been known to be polymorphic and wide in plant genomes [7]. The fragment polymorphism here relates to total sequence length as determined by number of repeat units, and the heterozygote for different fragments in diploid genomes can generally be distinguished. Zietkiewicz et aL [8] and Kantley et aL [9] described a marker system referred as Inter Simple Sequence Repeats (ISSR) that makes use of anchored primers to amplify simple sequence repeats without the requirement for prior sequence information. The technique is more reliable than the RAPD technique and generates larger numbers of polymorphism per primer [10]. ISSR fingerprinting has been successfully applied to determine genetic diversity and relationships in a number of crop species [11, 12, 13].
An average polymorphism percent revealed by these markers was 87 (RAPD), 93 (SSR) and 95 (ISSR). DNA profiles revealed high degree of intergeneric polymorphism, while the level was considerably low among the varieties. UPGMA cluster analysis of eight genotypes showed clear demarcation between the two genera falling in two separate clusters with their respective varieties grouping together. Further, approach in this regard is required for obtaining a common basis to assess the effectiveness of various markers [14, 15, 31] because, so for only diverse conclusions are reported [16, 17, 18, 19, 35].
Conclusion
The DNA fingerprinting profiles reported in our studies have shown common appearances based on RAPD, SSR and ISSR molecular markers, facilitating an effective authenticity for varietal DNA fingerprinting in crop plants.
Competing Interests
The authors declare that they have no competing interests.
Authors’ Contributions
JD carried out the entire work of this paper as part of her PhD project. NL supervised the PhD project and finalized drafted manuscript. MK and PPG contributed in the conduct of experiments and statistical analysis.
References
1. Vilanova S, Badenes ML, Martinez-Calvo J, Llacer G, 2001. Analysis of loquat germplasm (Eriobotrya japonica Lindl) by RAPD molecular markers. Euphytica, 121: 25-29.
http://astonjournals.com/gebj
13 Genetic Engineering and Biotechnology Journal, Volume 2010: GEBJ-5
2. Prevost A, Wilkinson MJ, 1999. A new system of comparing PCR primers applied to ISSR fingerprinting of potato cultivars. Theoretical and Applied Genetics, 98: 107-112.
3. Welsh J, Mcclelland M, 1990. Fingerprinting genomes using PCR with arbitrary primers. Nucleic Acids Research, 18: 7213-7218.
4. Williams JGK, Kubelik AR, Livak KJ, Rafalski JA, Tingey SV, 1990. DNA polymorphisms amplified by arbitrary primers are useful as genetic markers. Nucleic Acids Research, 18: 6631-6635.
5. Lakhanpaul S, Chadha S, Bhat KV, 2000. Random amplified polymorphic DNA (RAPD) analysis in Indian mungbean [Vigna radiata (L) Wilczek] cultivars. Genetica, 109: 227-234.
6. Mignouna HD, Ng NQ, Ikea J, Thottapilly G, 1998. Genetic diversity in cowpea as revealed by random amplified polymorphic DNA. Journal of Genetics and Breeding, 53: 151-159.
7. Morgante M, Olivieri AM, 1993. PCR-amplified microsatellites as markers in plant genetics. Plant Journal, 3: 175-182.
8. Zietkiewicz E, Rafalski A, Labuda D, 1994. Genome fingerprinting by simple sequence repeat (SSR)-anchored polymerase chain reaction amplification. Genome, 20: 176-183.
9. Kantley RV, Zeng X, Bennetzen JL, Zehr BE, 1995. Assessment of genetic diversity in dent l; and popcorn (Zea mays) inbred lines using inter-simple sequence repeat (ISSR) amplification. Molecular Breeding, 1: 365-373.
10. Qian W, Ge S, Hong DY, 2001. Genetic variation within and among populations of a wild rice Oryza granulata from China detected by RAPD and ISSR markers. Theoretical and Applied Genetics, 102: 440-449.
11. Joshi SP, Gupta VS, Aggarawal PK, Ranjekar PK, Brar DS, 2000. Genetic diversity and phylogenetic relationship as revealed by inter simple sequence repeat (ISSR) polymorphism in the genus Oryza. Theoretical and Applied Genetics, 100: 1311-1320.
12. Fernandez ME, Fygueiras AM, Benito C, 2002. The use of ISSR and RAPD markers for detecting DNA polymorphism, genotype identification and genetic diversity among barley cultivars with known origin. Theoretical and Applied Genetics, 104: 845-851.
13. Souframanien J, Gopalakrishna T, 2004. A comparative analysis of genetic diversity in blackgram genotypes using RAPD and ISSR markers. Theoretical and Applied Genetics, 109: 1687-1693.
14. Powell W, Morgante M, Andre C, Hanafey M, Vogel J, Tingey S, Rafalski A, 1996. The comparison of RFLP, RAPD AFLP and SSR (microsatellite) markers for germplasm analysis. Molecular Breeding, 2: 225-238.
15. Russell JR, Fuller JD, Macaulay M, Hatz BG, Jahoor A, Powell W, Waugh R, 1997. Direct comparisons of levels of gentic variation among barley accessions detected by RFLPs, AFLPs, SSRs and RAPDs. Theoretical and Applied Genetics, 95: 714-722.
16. Mcgregor CE, Lambert CA, Greyliing MM, Louw JH, Warnich L, 2000. A comparative assessment of DNA fingerprinting techniques (RAPD, ISSR, AFLP, SSR) in tetraploid potato (Solanum tuberosum L) germplasm. Euphytica, 113: 135-144.

http://astonjournals.com/gebj
14 Research Article
17. Virk PS, Zhu J, Bryan GJ, Jackson MT, Ford-Lloyd BV, 2000. Effectiveness of different classes of markers for classifying and revealing variation in rice (Oryza sativa) germplasm. Euphytica, 112: 275-284.
18. Degani C, Rowland LJ, Saunders JA, Hokanson SC, Ogden E, Golan-Goldhirsh A, 2001. A comparison of genetic relationship measures in strawaberry (Frageria ananassa Duch.) based on AFLPs, RAPDs and pedigree data. Euphytica, 117: 1-12.
19. Lefebvre V, Giffinet B, Chauvet JC, Caromel B, Signoret P, Brand R, Palloix A, 2001. Evaluation of genetic distances between pepper inbred lines for cultivar protection purposes: Comparison of AFLP, RAPD and phenotypic data. Theoretical and Applied Genetics, 102: 741-750.
20. Dellaporta SL, Wood J, Hicks JB, 1983. A plant DNA preparation version II. Plant Molecular Biology Reporter, 4: 19-21.
21. Jaccard P, 1908. Nouvelle recherches sur La distribution florale. BulL Soc. Vaud. Sci. Nat. 44: 223-270.
22. Rohlf FJ, 1998. NTSYS-PC: Numerical Taxonomy and Multivariate Analysis System. Version 2.01, Exeter Software: Setauket, New York.
23. Sneath PHA, Sokal RR, 1973. Numerical taxonomy: The Principles and Practice of Numerical Classification. Freeman and Company, San Francisco.
24. Botstein D, White RL, Skolnick M, Davis RW, 1980. Construction of a genetic linkage map in man using restriction fragment length polymorphisms. American Journal of Human Genetics, 32: 314-331.
25. Nei M, 1987. Estimation of average heterozygosity and genetic distance from a small number of individuals. Genetics, 83: 583-590.
26. Mantel N, 1967. The deduction of disease clustering and a generalized regression approach. Cancer Research, 27: 209-220.
27. Holton T, Christopher AJT, Mcclure L, Harker N, Henry RJ, 2002. Identification and mapping of polymorphic SSR markers from expressed gene sequences of barley and wheat. Molecular Breeding, 9: 63-71.
28. Winter P, Pfaff T, Udupa SM, Huttel B, Sharma PC, Sahi S, Arreguin-Espinoza R, Weigand F, Muehlbauer FJ, Kahl G, 1999. Characterization and mapping of sequence tagged microsatellite sites in the chickpea (Cicer arietinum L) genome. Molecular and General Genetics, 262: 90-101.
29. Choumane W, Winter P, Weigand F, Kahl G, 2004. Conservation of microsatellite flanking sequences in different taxa of leguminosae. Euphytica, 138: 239-245.
30. Gillaspie AG, Hopkins MS, Dean RE, 2005. Determining genetic diversity between lines of Vigna unguiculata subspecies by AFLP and SSR markers. Genetic Resources and Crop Evolution, 52: 245-247.
31. Dikshit HK, Jhang T, Singh NK, Koundal KR, Bansal KC, Chandra N, Tickoo JL, Sharma TR, 2007. Genetic differentiation of Vigna species by RAPD, URP and SSR markers. Biologia Plantarum, 51: 451-457.
32. Ravi M, Geethanjali S, Sammeyafarheen F, Maheswaran M, 2003. Molecular marker based genetic diversity analysis in rice (Oryza sativa L) using RAPD and SSR markers. Euphytica, 133: 243-253.

http://astonjournals.com/gebj
15 Genetic Engineering and Biotechnology Journal, Volume 2010: GEBJ-5
33. Ruanet VV, Kochieva E, Ryzhova NN, 2005. The use of a self-organizing feature map for the treatment of the results of RAPD and ISSR analysis in studies on the genomic polymorphism in the genus Capsicum L Russian Journal of Genetics, 41: 202-210.
34. Marotti I, Bonetti A, Minelli M, Catizone P, Dinelli G, 2006. Characterization of some Italian common bean (Phaseolus vulgaris L) landraces by RAPD, semi-random and ISSR molecular markers. Genetic Resources and Crop Evolution, 54: 175-188.
35. Datta S, Kaashyap M, Kumar S, 2009. Amplification of chickpea specific SSR primers in Cajanus species and their validity in diversity analysis. Plant Breeding (In Press), doi: 10.1111/j.1439-0523.2009.01678.x.