efficiency of the sharia rural bank in indonesia lead to modified
TRANSCRIPT

International Journal of Academic Research in Economics and Management Sciences September 2013, Vol. 2, No. 5
ISSN:2226-3624
34 www.hrmars.com/journals
Efficiency of the Sharia Rural Bank in Indonesia Lead to Modified Camel
Muhamad Nadratuzzaman HOSEN
Syafaat MUHARI
State Islamic University of Jakarta, Indonesia Email: [email protected] State Islamic University of Jakarta, Indonesia Email: [email protected]
ABSTRACT The magnitude of potential micro-banking market makes many banks and other financial institutions to make profits in the segment of small and micro banking as a market for rural banks (BPR), especially Sharia rural banks (BPRS). Thus, the efficient BPRS is required to survive amid the competition. This study used parametric stochastic frontier approach (SFA) with the asset approach to analyze the efficiency levels of 59 BPRS in the period of 2nd Quarter June 2011 – 4th Quarter December 2012. The level of Bank efficiency could be integrated with the performance of banks which is adopted from Central Bank (BI) criteria, namely CAMEL (Capital, Asset Quality, Management, Earnings and liquidity). The results of this study indicated that there are significant differences between the efficiency level measured by SFA and the performance of CAMEL measured by ratio, which means that existing of CAMEL method do not show the level of efficiency of BPRS concerned. In addition, this study also showed that the BPRS is less efficient than Sharia Banks (BUS).
KEY WORDS Efficiency, Sharia Rural Banks (BPRS), Stochastic Frontier Approach (SFA), CAMEL
JEL CODES D22.
DOI: 10.6007/IJAREMS/v2-i5/298 URL: http://dx.doi.org/10.6007/IJAREMS/v2-i5/298
1. Introduction Rural Bank (BPR) is part of the banking system that has contributed significantly to the economy. Along with the rapid development of rural banks, Sharia Rural Banks (BPRS) which is a rural banks that operate based on sharia principles is also an encouraging indication, BPRS development is shown from the distribution of financing, source of funding and the their assets.

International Journal of Academic Research in Economics and Management Sciences September 2013, Vol. 2, No. 5
ISSN:2226-3624
35 www.hrmars.com/journals
Graph 1.1.
Development of the Sharia Rural Bank (BPRS) in Indonesia (in billion rupiah) January 2007-January 2013
Source: Banking Statistics Indonesia (2013): Data processed Sharia Rural Bank has the specific purpose of providing banking products and services for low income people and small and micro enterprises (SME) both in cities and rural areas. In general, sharia rural banks (BPRS) have a purpose and characteristics that are relatively similar to the other microfinance institutions (MFI). MFI has two main objectives to be achieved at the same time, the commercial and society development. It means commercial MFI in business must make a profit so that activities can be maintained (sustainable) and the ability to serve customers is increasing (outreach). It is closely related to the second objective which the community development. MFI’s target communities are less or not served by commercial banks. Therefore MFI have a mission to reduce poverty, empower women and marginalized groups, create jobs, and develop their business customers that is small and medium enterprises (SMEs) (Buchori, 2003:68). To be able to compete in the banking industry especially in the market of Micro, Small and Medium Enterprises (MSME), BPRS are required to operate as efficiently and effectively as possible. BPRS not only compete with the other MFIs alone, but also have to compete with the commercial banks which began targeting the MSME market who has been the target of the BPRS market. In addition, BPRS get new competitor after the enactment of the Cooperative Act which allows cooperatives to issue a letter of Cooperative Capital that will be makes competition increasingly fierce in the micro market banking (Infobank, December 2012). Competition in the micro market banking will be intense considering in 2013 Bank Indonesia will issue rules on the improvement of access to credit or financing services for Micro, Small and Medium Enterprises (MSMEs) by banks amounted up to 20% of the bank's portfolio. It required an BPRS sound, strong and reliable which BPRS needs to improve its

International Journal of Academic Research in Economics and Management Sciences September 2013, Vol. 2, No. 5
ISSN:2226-3624
36 www.hrmars.com/journals
performance in order to compete in its market segmentation (Media Indonesia Online, 26 November 2012). Efficiency in the banking sector is one of the performance parameters are quite popular, widely used as a response to the difficulties in calculating measures of bank performance. The ratio of operating expenses to operating income (BOPO) was included in one analysis the ratio of CAMEL (Capital, Asset Quality, Management, Earnings and Liquidity) has been frequently used as a reference for measuring efficiency. This ratio has the advantage of being simple in its calculations. However BOPO ratio also has a weakness in measuring the efficiency of them; difficult to generalize whether a ratio is good or bad, it is difficult to say whether the company is strong or weak and does not take into account the cost of capital (Endri, 2008:160). In addition CAMEL ratios less attention to efficiency factors, consider the weight of the efficiency factor in the CAMEL ratio set by Bank Indonesia in the range of 10% - 15%. To address the shortcomings that exist in the ratio analysis measures the performance of the firm, the frontier approach is developed to analyze the efficiency of the firm. the concept of efficiency can be divided into three, namely: cost efficiency, profit efficiency and alternative profit efficiency (Berger & Mester, 1997:3). Considering the high competition in micro banking market, the BPRS had to attain to maximize the profit level but should still be concerned to minimize costs, because the competition back on the price level. If BPRS add profit by increasing the financing margin, the BPRS is less able to compete with the other micro financing institution and commercial banks which does not take profit by raising financing margin which would be more desirable by the customers. The ability to generate maximum output with existing input is a measurement of the expected performance. At the time of measurement of efficiency is done, banks faced with conditions how to get optimal output level with the existing input level, or to get the minimum input level with the existing output level. The identification of input and output allocation can be analyzed further to see the cause of inefficiency (Hadad et al, 2003:2). Research about the banking efficiency using stochastic frontier approach (SFA) has been widely applied in various countries; Tecles and Tabak (2010) examined the level of efficiency of banks in Brazil in the year 2000 to 2007 which lead to the conclusion that the cost efficiency of the big and medium banks was better than micro and small banks, while profit efficiency of small and micro banks in Brazil was better than medium and large banks. The results are different shown by Dacanay (2007) which shows that the cost efficiency and profit efficiency of smaller banks are better than banks with the bigger banks in Philippines. Period of the research is in the range between the years 1992-2004. The results are similar to Dacanay was also shown by Papadopoulos (2008) which examines banks in four Scandinavian countries in 1997-2003. In the study, a smaller bank is more efficient than the larger banks. Study in Malaysia by Tahir and Haron (2008) showed that domestic banks more efficient than foreign banks in the study period of 2000 – 2006 with 9 samples of domestic banks and 13 foreign banks. For the study in Indonesia, Haddad et. al (2003) examined the level of efficiency of banks in Indonesia in period of 1995 – 2003 using stochastic frontier approach (SFA) and distribution free approach (DFA). The result showed that foreign exchange commercial banks and joint venture foreign owned banks are the most efficient banks. The study also showed that during the study period, bank mergers in Indonesia does not necessarily indicate a more
International Journal of Academic Research in Economics and Management Sciences September 2013, Vol. 2, No. 5
ISSN:2226-3624
37 www.hrmars.com/journals
efficient outcome. Hartono (2009) examined the 23 banks which listed in Indonesia Stick Exchange in period of 2004 – 2007. The study showed that non-foreign exchange commercial banks is the most efficient, followed by foreign exchange commercial banks and state owned banks. Rahmawati and Hosen (2012) examined sharia banks in Indonesia in period of Januari 2008 to September 2010. The study showed that Bank Muamalat is the most efficient bank than Bank Syariah Mandiri and Bank Mega Syariah. Nuryartono et. al (2012) conducted a study to measure the efficiency of rural banks in Indonesia in 2006-2007 using stochastic frontier approach (SFA) with the approach of time varying decay (TVD) to examined 1.617 rural banks. The study showed that all independent variable (input, output, netput adn environemntal factors) was significantly to the total cost. Furthermore, the study showed that the rural banks efficiency level in Indonesia in period of 2006 and 2007, respectively 89.29% and 88.34%. 1.1 Problem Identification 1. How does the level of cost efficiency sharia rural banks (BPRS) in Indonesia in the period of
2nd Quarter June 2011 – 4th Quarter December 2012 based on parametric stochastic frontier approach (SFA).
2. What the components of input, output and environmental factors that influence the cost efficiency of sharia rural banks (BPRS) in Indonesia.
3. How much the of level differences in the level of efficiency analysis is based on stochastic frontier approach (SFA) to the CAMEL ratio analysis.
1.2 Research Purpose 1. Analyzing the efficiency cost of Sharia Rural Bank in Indonesia in the period of 2nd Quarter
June 2011 – 4th Quarter December 2012 based on parametric stochastic frontier approach (SFA).
2. Analyzing the components of input, output and environmental factors which affect the level of cost efficiency of sharia rural banks in Indonesia.
3. Analyzing the level of differences in the level of efficiency analysis is based on stochastic frontier approach (SFA) to the CAMEL ratio analysis.
2. Research Method Object of research in this paper is the quarterly financial report of the sharia rural banks in Indonesia. Sampling techniques in the study conducted by purposive sampling with the BPRS criteria quarterly financial reports available in full for 7 quarters from the second quarter - in June 2011 until the fourth quarter - in December 2012. Based on these criteria, then sampled in this study were 59 sharia rural banks. Based on the following criteria: 1. During the study period, Sharia rural banks (BPRS) the financial statements are issued
periodically during the seventh quarter of the 2nd Quarter – in June 2011 until the 4th Quarter - in December 2012 and has a complete data during the observation period.
2. Sample selection based on the completeness of the data owned by Sharia Rural Bank (BPRS), particularly information of the total cost, labor cost, cost of funds, total funding, placements with other banks, non-performing loan (NPL), equity and assets.
International Journal of Academic Research in Economics and Management Sciences September 2013, Vol. 2, No. 5
ISSN:2226-3624
38 www.hrmars.com/journals
The data used in this study is secondary data from financial statements of Sharia Rural Banks (BPRS) in the 2nd quarter - in June 2011 until the 4th quarter - in December 2012 acquired the Bank Indonesia website. Based on these criteria then sampled in this study are 59 BPRS. Measuring the level of efficiency using the stochastic frontier approach (SFA) with panel data had been done by Battese and Coelli (1992 & 1993) which examined the level of efficiency of rice farmers in India in 1975-1976 to 1984-1985 and the research conducted by Haddad, et al (2003) which examined the level of efficiency of banks in Indonesia in 1995-2003. In this study, the determination of the independent variables (input, output, environmental factors) using the asset approach is used by Nuryantono et al. (2012) in his study, so the variable input, output, and environmental factors are defined as follow: 1. Variable Input (X): Price of Labour (pl) and the Price of Fund (pf) 2. Variable Output (Y): Total Financing (tp) and Placements with Other Banks (pob) 3. Variable Environmental Factors (W): Equity over Total Assets (EOTA) and Non-Performing
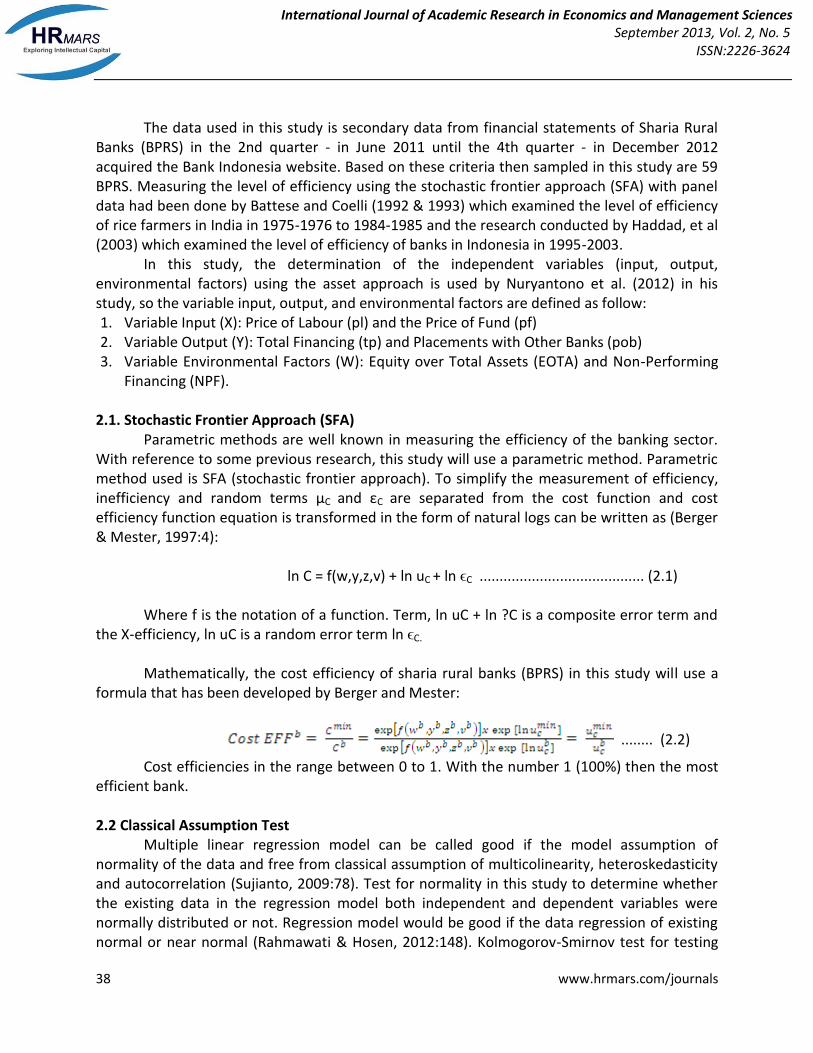
Financing (NPF). 2.1. Stochastic Frontier Approach (SFA) Parametric methods are well known in measuring the efficiency of the banking sector. With reference to some previous research, this study will use a parametric method. Parametric method used is SFA (stochastic frontier approach). To simplify the measurement of efficiency, inefficiency and random terms μC and εC are separated from the cost function and cost efficiency function equation is transformed in the form of natural logs can be written as (Berger & Mester, 1997:4): ln C = f(w,y,z,v) + ln uC + ln ϵC ......................................... (2.1) Where f is the notation of a function. Term, ln uC + ln ?C is a composite error term and the X-efficiency, ln uC is a random error term ln ϵC. Mathematically, the cost efficiency of sharia rural banks (BPRS) in this study will use a formula that has been developed by Berger and Mester:
........ (2.2)
Cost efficiencies in the range between 0 to 1. With the number 1 (100%) then the most efficient bank. 2.2 Classical Assumption Test Multiple linear regression model can be called good if the model assumption of normality of the data and free from classical assumption of multicolinearity, heteroskedasticity and autocorrelation (Sujianto, 2009:78). Test for normality in this study to determine whether the existing data in the regression model both independent and dependent variables were normally distributed or not. Regression model would be good if the data regression of existing normal or near normal (Rahmawati & Hosen, 2012:148). Kolmogorov-Smirnov test for testing

International Journal of Academic Research in Economics and Management Sciences September 2013, Vol. 2, No. 5
ISSN:2226-3624
39 www.hrmars.com/journals
whether samples come from populations that are normally distributed (Sujianto, 2009:78). In addition, multicollinearity , heteroscedasticity and autocorrelation test will be performed. With these three assumptions we have learned that regression estimator coefficients obtained are the best linear unbiased estimators (BLUE ), with the assumption of normality, the estimators are follow the normal distribution (Supranto, 2004:10). 2.3. Panel Data Panel data is a combination of cross-section data and time series data. On panel data, unit of the same cross-section surveyed at some period of time. Thus, the data panel has dimensions of space and time. Gujarati (2004) explains that "If each cross-section unit has a number of observations of the same time series panel data is called balanced panel data, otherwise if the number of different time series observations on each unit is called unbalanced panel data. "(Setiawati & Setiawan, 2013:2). Hsiao (2003) formulated the general panel regression model can be expressed in the following form (Setiawati & Setiawan, 2013:2): ............................................. (2.3) With yit = unit cross section for the i-th-t to the time period β = vector of constants X = vector of observations on the independent variables αit = intercept object to-i wktu to-t μit = regression error for the i-th group, time-t μit ~ IIDN (0, σ2) Setiawan and Dwi (2010) explains that "the Common Effect Model (CEM) CEM approach it is assumed that the value of the intercept and slope of each variable is the same for all units of cross section and time series." (Setiawati & Setiawan, 2013:2). Model CEM approach which is as follows: ................................................. (2.4) Gujarati (2005) explains that "Fixed Effect Model (FEM) approach assumed that the slope value of each variable is fixed but different intercept values for each unit of cross section and fixed for each unit of time series." (Setiawati & Setiawan, 2013:2). Model FEM approach which is as follows: .............................................. (2.5) While Random Effect Model (REM) according to Gujarati (2005) is "approach assumed that the intercept αi = α0 + εi
with mean α0 and εi is referred to as a latent variable random error with mean 0 and variance ." (Setiawati & Setiawan , 2013:2). REM approach model as follows: .................... (2.6) Hausman test is used to choose which model is suitable for this research. Model estimates with common effect approach models tested did not participate in this study because estimates with this approach has limitations in explaining the cross section of individuality unit. This test is based on the following hypothesis: Ho = Random Effect Model Ha = Fixed Effect Model

International Journal of Academic Research in Economics and Management Sciences September 2013, Vol. 2, No. 5
ISSN:2226-3624
40 www.hrmars.com/journals
Basic rejection of Ho is judgments with the value of chi-square statistic. If the chi-square statistic> chi square table (p-value <α) then Ho is rejected, the model used is the fixed effect model. 2.4 Test Statistics Analysis of the cost function in this study was calculated by multiple regression analysis using panel data types. Regression analysis used in this study to measure the effect of independent variables on the dependent variable with the regression equation as follows: Lntc = α + β1 lnpl + β2 lnpf + β3 lntf + β4 lnpob + β5 lneota + β6 lnnpf + lnνi + lnυi .......... (2.7) Where: lntc = natural logarithm total cost lnpl = natural logarithm price of labour (cost of labour/total assets) lnpf = natural logarithm price of fund (cost of fund/total of funding) lntf = natural logarithm total financing lnpob = natural logarithm placement with other bank lneota = natural logarithm EOTA (total equity/total assets) lnnpf = natural logarithm NPF (non performing financing) lnνi = noise lnυi = inefficiency Proving the hypothesis made by coefficient of determination (R2),Simultaneous Test (Test F-statistics) and the Partial Test (Test t-Statistics). Then making use of fixed or random effects model is determined by using the Hausman Test. 2.5 Wilcoxon Signed Rank Test To compare the degree of difference between the level of efficiency analysis based on a parametric approach using stochastic frontier approach to CAMEL ratio analysis, it will be done by Wilcoxon Signed Rank Test. Wilcoxon-Signed Rank test was used to compare the average of two samples that are interconnected (samples come from the same population). This test harness positive signs and negative obtained from the difference between the observations in the case of one variable µ0 or positive and negative signs obtained from the difference between pairs of observations in the case of paired samples but does not account for the large difference in the value. In the Wilcoxon test, the size of difference between the two values will be considered (Fauzi, 2008:308-309). Before performing the test and the difference between the ratio of CAMEL to SFA, then the two samples are also tested in the Kolmogorov-Smirnov normality test. Processing the data in this study using SPSS 16 software, Eviews7 and Frontier 4.1. CAMEL ratings in this study minus management's assessment because it is not able to see it from the outside. Then used in this study is an analysis of the bank in terms of financial ratios that include components of capital, assets, earnings and liquidity (CAEL).

International Journal of Academic Research in Economics and Management Sciences September 2013, Vol. 2, No. 5
ISSN:2226-3624
41 www.hrmars.com/journals
3. Results In the Hausman test is known that the p-value of 0.000, for p-value <α then HO is rejected which means that the model used is the fixed effect model. The model prediction of cost efficiency sharia rural banks (BPRS) in Indonesia can be written as follows: lntc = -0,374 + 0,600Lnpl + 0,376Lnpf + 0,731Lntf + 0,111Lnpob-0,077Lneota+ 0,017Lnnpf In the above regression equation, the constant lntc amounted to -0.374. This means that if the input variables and output variables held constant, then the average BPRS in Indonesia will issue a minimum cost for a given level of output that is equal to Rp. 2,366 thousand of total assets (ex -0,374 = 2,366). The variable price of labor (lnpl) coefficient of 0.600 indicates that if the price of fund exponent increased 1%, then the average BPRS in Indonesia will increase efficiency of 0.600%. The variable price of funds (lnpf) regression coefficient 0.376 indicates that if the price of fund exponent increased by 1%, then the average BPRS in Indonesia will increase efficiency of 0.376%. The variable total financing (lntf) regression coefficient 0.731 indicates that if the exponent total financing increased by 1%, then the average BPRS in Indonesia will increase efficiency of 0.731%. The variable placement with other banks (lnpob) 0.111 indicates that if the exponent total financing increased by 1%, then the average BPRS in Indonesia will increase efficiency of 0.111%. The variable equity over total assets / EOTA (lneota) regression coefficient -0.077 indicates that if the exponent EOTA increased by 1%, then the average BPRS in Indonesia experienced the inefficiency of 0.077%. On non-performing financing variables / NPF (lnnpf) 0.017 indicates that if the exponent NPF increased by 1%, then the average BPRS in Indonesia will increase efficiency of 0.017%. 3.1. Regression Analysis 3.1.1. Classical Test Assumptions 3.1.1.1. Normality Test From the results of the Kolmogorov-Smirnov normality test is known that the total variable cost, price of labor, finance, placements with other banks and non-normally distributed performig financing because Asymp. Sig. (2-tailed)> 0,05, while the variable price of fund and equity over total assets not normally distributed because Asymp. Sig. (2-tailed)> 0.05. 3.1.1.2. Multicollinearity test Based on the test multicollinearity, all variables have a value tolerance more than 0.1 and VIF value less than 10. It can be concluded that the regression model in sharia rural banks (BPRS) in Indonesian second quarter June 2011 - December 2012 fourth quarter free of multicollinearity. 3.1.1.3. Heteroscedasticity test The dots spread of the data in this study spread totally random (random) and does not form a specific pattern on the graph scetterplot. Thus it can be said that the regression model in

International Journal of Academic Research in Economics and Management Sciences September 2013, Vol. 2, No. 5
ISSN:2226-3624
42 www.hrmars.com/journals
the sharia rural banks (BPRS) in Indonesian second quarter June 2011 - December 2012 fourth quarter free of heteroscedasticity. 3.1.1.4. Autocorrelation test Known that the Durbin-Watson test is 1.331. Thus it can be said that the regression model in the Sharia rural banks (BPRS) in Indonesia in Second quarter of June 2011 - fourth quarter can not be concluded in December 2012 have autocorrelation or not since the Durbin-Watson test values because values are in the range 1.21 <DW <1, 65 or 2.35 <DW <2.79. 3.1.2. Statistics test 3.1.2.1. Test coefficient of determination (R2) Statistically to determine the effect of the independent variables simultaneously on the dependent variable can be seen from the magnitude of the multiple correlation coefficient or R2. It is known that the sharia rural banks (BPRS) in Indonesia in Second quarter of June 2011 - fourth quarter of December 2012 the value of the coefficient of determination of the regression models are 0.9981 or 99.81%, which indicates that the independent variable (price of labor, price of funds, total funding, placements with other banks, EOTA and NPF) simultaneously affect the dependent variable (total cost) of 99.81% and the remaining 0.19% are influenced by other variables not included in the study. 3.1.2.2. F-test To determine the significance of the influence of all independent variables on the dependent variable simultaneously used F test Analysis of the results of the F-test is intended to prove of research that states that the input, output and environmental factors variables have an influence on the efficiency of sharia rural banks (BPRS) in Indonesia in Second quarter of June 2011 - fourth quarter of December 2012, by comparing the F-value generated by linear regression regression with the Ftable at 95% significance level (α = 5%). ANOVA test result numbers of F 3448.039, while F tabel 2,126. Because Fvalue> Ftable and the number probability 0.000 <0.05, then HO is rejected and Ha accepted, so it can be interpreted that simultaneous input variables, output and environmental factors (price of labor, price of funds, total funding, placements with other banks, EOTA and NPF) affect the efficiency of sharia rural banks (BPRS) in Indonesia in second quarter of June 2011 - fourth quarter of December 2012. 3.1.2.3. t -test T test was used to test the strength of the relationship of each independent variable on the dependent variable individually. By comparing the value of t with ttable obtained from each variable using the 95% significance level (α = 5%).
International Journal of Academic Research in Economics and Management Sciences September 2013, Vol. 2, No. 5
ISSN:2226-3624
43 www.hrmars.com/journals
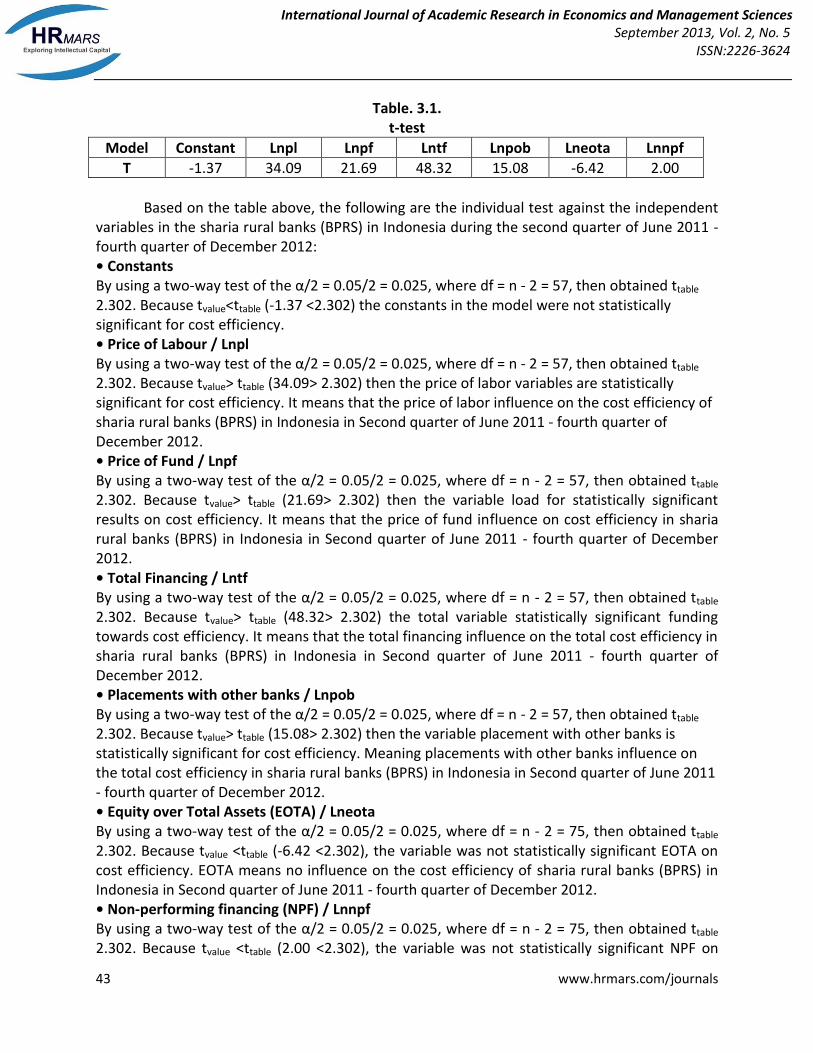
Table. 3.1. t-test
Model Constant Lnpl Lnpf Lntf Lnpob Lneota Lnnpf
T -1.37 34.09 21.69 48.32 15.08 -6.42 2.00
Based on the table above, the following are the individual test against the independent variables in the sharia rural banks (BPRS) in Indonesia during the second quarter of June 2011 - fourth quarter of December 2012: • Constants By using a two-way test of the α/2 = 0.05/2 = 0.025, where df = n - 2 = 57, then obtained ttable 2.302. Because tvalue<ttable (-1.37 <2.302) the constants in the model were not statistically significant for cost efficiency. • Price of Labour / Lnpl By using a two-way test of the α/2 = 0.05/2 = 0.025, where df = n - 2 = 57, then obtained ttable 2.302. Because tvalue> ttable (34.09> 2.302) then the price of labor variables are statistically significant for cost efficiency. It means that the price of labor influence on the cost efficiency of sharia rural banks (BPRS) in Indonesia in Second quarter of June 2011 - fourth quarter of December 2012. • Price of Fund / Lnpf By using a two-way test of the α/2 = 0.05/2 = 0.025, where df = n - 2 = 57, then obtained ttable 2.302. Because tvalue> ttable (21.69> 2.302) then the variable load for statistically significant results on cost efficiency. It means that the price of fund influence on cost efficiency in sharia rural banks (BPRS) in Indonesia in Second quarter of June 2011 - fourth quarter of December 2012. • Total Financing / Lntf By using a two-way test of the α/2 = 0.05/2 = 0.025, where df = n - 2 = 57, then obtained ttable 2.302. Because tvalue> ttable (48.32> 2.302) the total variable statistically significant funding towards cost efficiency. It means that the total financing influence on the total cost efficiency in sharia rural banks (BPRS) in Indonesia in Second quarter of June 2011 - fourth quarter of December 2012. • Placements with other banks / Lnpob By using a two-way test of the α/2 = 0.05/2 = 0.025, where df = n - 2 = 57, then obtained ttable 2.302. Because tvalue> ttable (15.08> 2.302) then the variable placement with other banks is statistically significant for cost efficiency. Meaning placements with other banks influence on the total cost efficiency in sharia rural banks (BPRS) in Indonesia in Second quarter of June 2011 - fourth quarter of December 2012. • Equity over Total Assets (EOTA) / Lneota By using a two-way test of the α/2 = 0.05/2 = 0.025, where df = n - 2 = 75, then obtained ttable 2.302. Because tvalue <ttable (-6.42 <2.302), the variable was not statistically significant EOTA on cost efficiency. EOTA means no influence on the cost efficiency of sharia rural banks (BPRS) in Indonesia in Second quarter of June 2011 - fourth quarter of December 2012. • Non-performing financing (NPF) / Lnnpf By using a two-way test of the α/2 = 0.05/2 = 0.025, where df = n - 2 = 75, then obtained ttable 2.302. Because tvalue <ttable (2.00 <2.302), the variable was not statistically significant NPF on

International Journal of Academic Research in Economics and Management Sciences September 2013, Vol. 2, No. 5
ISSN:2226-3624
44 www.hrmars.com/journals
cost efficiency. NPF means no influence on the cost efficiency of sharia rural banks (BPRS) in Indonesia in Second quarter of June 2011 - fourth quarter of December 2012. 3.2. Efficiency Analysis of Stochastic Frontier Approach (SFA) By entering the data into the formula (2.2) above, the results of cost-efficiency sharia rural banks (BPRS)) in Indonesia in Second quarter of June 2011 - fourth quarter of December 2012, as follows:
Table 3.2. Efficiency level of Sharia Rural Banks (BPRS) in Indonesia
BPRS Efisiensi BPRS Efisiensi BPRS Efisiensi BPRS Efisiensi
1 0.8003 16 0.7313 31 0.7281 46 0.6443
2 0.8300 17 0.8380 32 0.856 47 0.6945
3 0.8748 18 0.6007 33 0.9397 48 0.6584
4 0.9171 19 0.7369 34 0.8466 49 0.6053
5 0.8897 20 0.9628 35 0.7921 50 0.7395
6 0.9547 21 0.9086 36 0.6735 51 0.7158
7 0.8062 22 0.9409 37 0.8016 52 0.7477
8 0.6842 23 0.8807 38 0.9777 53 0.7919
9 0.9509 24 0.7259 39 0.7737 54 0.955
10 0.8617 25 0.7540 40 0.7908 55 0.6242
11 0.9315 26 0.8112 41 0.9625 56 0.7442
12 0.7980 27 0.8607 42 0.6896 57 0.9724
13 0.6974 28 0.9679 43 0.8708 58 0.9613
14 0.9589 29 0.7384 44 0.8216 59 0.8371
15 0.8505 30 0.7744 45 0.7807
Mean Efficiency 0.8141
Source: Financial Statements of Banks 2013 - Bank Indonesia: Data processed From the data above is known that the average efficiency level of sharia rural banks (BPRS) in Indonesia during the second quarter in June 2011 - the fourth quarter of December 2012 in the amount of 0.8141 or 81.41%. The next grouping efficiency values are divided into four categories by using percentile quartile ± standard deviation (Paramita, 2008:40):
1. Efficiency value of <0.65 was BPRS with inefficient category. 2. Efficiency values between .65 to 0.76 is less efficient BPRS by category. 3. Efficiency values between 0.76 to 0.87 is quite efficient BPRS by category. 4. Efficiency values > 0.87 are BPRS by category efficiently.
Graph 3.3 below, the sharia rural banks (BPRS) with the highest level of efficiency in the range of efficiency values from 0.76 to 0.87 with a percentage of 41 percent or as much as 24 BPRS. While BPRS have efficiency values between 0.65 to 0.76 BPRS is as much as 12 or 20 percent. The BPRS is not efficient with efficiency values below 0.65 are 4 BPRS or 7 percent. While BPRS has a value of 0.87 is more efficiency as much as 19 or 32 percent BPRS indicating that the BPRS has a level of cost efficiency better than other groups.

International Journal of Academic Research in Economics and Management Sciences September 2013, Vol. 2, No. 5
ISSN:2226-3624
45 www.hrmars.com/journals
Graph 3.3 Distribution of Level of Efficiency of Sharia Rural Banks (BPRS)
Source: Financial Statements of Banks 2013 - Bank Indonesia: Data processed Sharia rural banks (BPRS) Bhakti Sumekar (ID 38) has the highest cost efficiency score that is equal to 0.9777 or 97.77%. This means that the BPRS Bhakti Sumekar very efficient in the use of the cost. Lowest efficiency score at BPRS Masyarakat Ummat Indonesia (ID 18) with the score of the cost efficiency of 0.6007 or 60.07%. This suggests that the BPRS in inefficient use of the cost. According to the table 3.2 above 59 sharia rural bank (BPRS) in Indonesia has a cost efficiencies score ranging from 0.6007 to 0.9777. These circumstances provide sufficient evidence that any sharia rural banks (BPRS) have a management strategy that is quite different from one BPRS with another BPRS in terms of interest costs, hiring employees, using technology and others.
International Journal of Academic Research in Economics and Management Sciences September 2013, Vol. 2, No. 5
ISSN:2226-3624
46 www.hrmars.com/journals
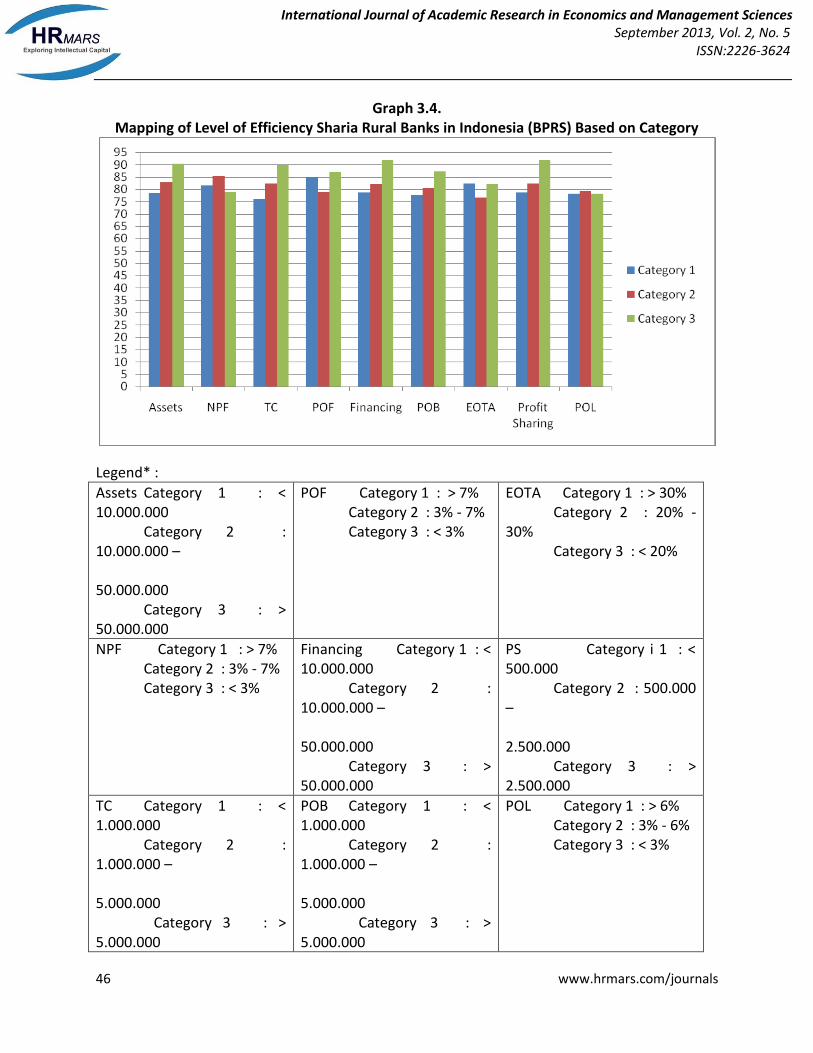
Graph 3.4. Mapping of Level of Efficiency Sharia Rural Banks in Indonesia (BPRS) Based on Category
Legend* :
Assets Category 1 : < 10.000.000 Category 2 : 10.000.000 – 50.000.000 Category 3 : > 50.000.000
POF Category 1 : > 7% Category 2 : 3% - 7% Category 3 : < 3%
EOTA Category 1 : > 30% Category 2 : 20% - 30% Category 3 : < 20%
NPF Category 1 : > 7% Category 2 : 3% - 7% Category 3 : < 3%
Financing Category 1 : < 10.000.000 Category 2 : 10.000.000 – 50.000.000 Category 3 : > 50.000.000
PS Category i 1 : < 500.000 Category 2 : 500.000 – 2.500.000 Category 3 : > 2.500.000
TC Category 1 : < 1.000.000 Category 2 : 1.000.000 – 5.000.000 Category 3 : > 5.000.000
POB Category 1 : < 1.000.000 Category 2 : 1.000.000 – 5.000.000 Category 3 : > 5.000.000
POL Category 1 : > 6% Category 2 : 3% - 6% Category 3 : < 3%

International Journal of Academic Research in Economics and Management Sciences September 2013, Vol. 2, No. 5
ISSN:2226-3624
47 www.hrmars.com/journals
* In Thousand Rupiah. * Data Source: Bank Indonesia: Data is processed. Based on the graph above, the level of efficiency of sharia rural banks (BPRS) is based on a category of assets, financing and placement in other banks (POB) directly proportional to the efficiency of BPRS, it means that the greater the score of the three variables, the more efficient the BPRS anyway. This indicates that most of the BPRS has not reached economies of scale. Just as total assets, the amount of revenue-sharing and total cost (TC) also shows that the effect is directly proportional to the score of efficiency. Failure to achieve the economies of scale of BPRS it can be caused by inadequate technology, lack of effective management and human resources are less competent (Rahardja & Manurutng, 2006:143-144). BPRS in order to exploit economies of scale, then the required conditions sufficient capital. Capital that can be used to invest in the improvement of human resources and information technology, can also be used as a reference for the BPRS increase the financing limit that is able to serve a wider customer. Based on graph 3.4 above, it can be seen that the sharia rural banks (BPRS) is based on the price of labor (POL) both of the categories one, two and three, none of the BPRS group whose efficiency above 80%. It is proved that BPRS human resources in Indonesia is not maximized and the technology used by the BPRS is still conventional. For that BPRS can maximize efficiency levels if human resources and technology improvement in BPRS can be improved. Therefore, Bank Indonesia (BI) and Financial Services Authority (OJK) must be able to develop and oversee the BPRS in order to improve the quality and integrity of the BPRS board, including encouraging BPRS to implement good corporate governance (GCG) in the BPRS. In addition, the technology also needed revitalization that BPRS can operate more efficiently so as to reduce operational costs and can provide competitive services to customers. When BPRS in Indonesia compared with the five sharia banks (in this study were taken 5 largest sharia banking in Indonesia bank Bank Syariah Mandiri, Bank Muamalat, BRI Syariah, BNI Syariah and Bank Mega Syariah), the average score of the efficiency of sharia rural banks (BPRS) is significantly lower at approximately 80.44%, while for sharia banks reached 93.96%. With a considerable degree of efficiency, the Rural Bank Syariah (BPRS) can not compete with commercial banks fell sharia banking in the micro market. Bank Indonesia (BI) and Financial Services Authority (OJK) should ensure that the competition in micro banking market remains fair. In general, commercial banks are superior to both the BPRS capital, technology and human resources. BI and OJK need to further encourage commercial banks to channel financing to mediation BPRS. Mediation can be done either through a linkage program executing (BPRS obtain funds from commercial banks and then channeled to the customer), channeling (BPRS acts as an agent of a commercial bank) and the joint financing between BPRS with commercial banks. Make commercial banks as partners of BPRS is one of the BPRS solution in order to survive in the micro banking market. The linkage program between commercial banks and BPRS would be difficult because of the high risks of BPRS. This is reflected in the high ratio of nonperforming financing (NPF) BPRS in the period 2007 to 2012 which is about 7,56%, which indicates that less productive assets is still quite high. Thus BI and OJK should be able to develop and oversee the BPRS to apply the prudential banking in the case of BPRS to function as a financial intermediary.

International Journal of Academic Research in Economics and Management Sciences September 2013, Vol. 2, No. 5
ISSN:2226-3624
48 www.hrmars.com/journals
Graph 3.5. Non Performing Financing of Sharia Rural Banks (BPRS) di Indonesia Periode January 2007 –
January 2013
Source: Banking Statistics Indonesia (2013): Data processed 3.3. Comparison of Efficiency Levels using the SFA and Ratio Analysis CAMEL CAMEL ratings in this study minus management's assessment because it is not able to see it from the outside. Then used in this study is an analysis of the bank in terms of financial ratios that include components of capital, assets, earnings and liquidity (CAEL). CAEL calculation of the 59 Rural Bank Syariah (BPRS) in this study is based on calculations prepared in accordance PBI Bank Indonesia. 9/17/PBI/2007 about the rating system for sharia rural banks (BPRS). In a different test Wilcoxon Signed Rank, there were statistically significant differences between CAEL ranked by efficiency analysis using the SFA for the value Asymp. Sig of 0000, less than the probability 0.05. This difference occurs because the measurement of the bank with CAEL ratio analysis does not consider efficiency as a major factor, so that it can be seen that the sharia rural banks (BPRS), which was less efficient CAEL has a higher score than the BPRS which more efficient. CAEL the BPRS calculation based on PBI No. 59. 9/17/PBI/2007 (CAEL Model 1 - see table 3.7) shows that as many as 18 BPRS classified into categories very well, 35 BPRS into categories well, 3 pretty well, 2 weak and 1 sharia rural banks (BPRS) very weak . Yet at the same time based on the calculation of the SFA, 12 BPRS relatively less efficient and 4 BPRS is inefficient. This raises the question, whether the ratio analysis CAEL has shows the actual level of efficiency?. Thus CAEL analysis which has been the benchmark for measuring the soundness of banks need to be revisited, especially on the determination of the weight of its components. In determining the weight CAEL the sharia rural banks (BPRS) according to PBI. 9/17/PBI/2007 about the Rating System for sharia rural banks efficiency components as reflected by BOPO only got a small portion of which is in the range of 10% - 15%. To the weighting in the CAEL need to be revisited in order to consider the level of efficiency.

International Journal of Academic Research in Economics and Management Sciences September 2013, Vol. 2, No. 5
ISSN:2226-3624
49 www.hrmars.com/journals
To maximize the efficiency of the soundness CAEL analysis, BOPO component reflecting the efficiency factor will be replaced by the frontier approach to the new weighting of CAEL analysis. BOPO replaced with frontier approach because of the limitations that are owned by BOPO ratio. In this research frontier approach that will be used is stochastic frontier approach (SFA). Then, three models will be tried as an alternative of CAEL analysis as follows:
Table 3.6. Weights Differences in the Some Model of CAEL
Factors Component
s
Model 1(Based on
PBI No.9/17/ PBI/2007)
Model 2 (changing
the weights)
Model 3 (Replaced BOPO by Frontier
Approach)
Model 4 (Replaced BOPO
by Frontier Approach and changing the
weights)
Capital CAR 25% 20% 25% 20%
Assets KAP 35% 30% 35% 30%
NPF 10% 5% 10% 5%
Earning
Efisiensi 10% (BOPO)
25% (BOPO)
10% (SFA)
25% (SFA)
ROA 2.5% 2.5% 2.5% 2.5%
ROE 2.5% 2.5% 2.5% 2.5%
Liquidity CR 15% 15% 15% 15%
Table 3.7. The Result of CAEL Comparison
CAEL Score Model 2 Model 3 Model 4
Increase 11 16 7
Fixed 26 10 9
Diminish 22 33 43
Table 3.7 comparison of the change in score of CAEL model 1 to the CAEL model 2, 3 and 4. In model 2 (by changing the weight score of each component) shows changes by 11 BPRS CAEL scores increases, 26 BPRS fixed and 22 BPRS CAEL score diminish. CAEL scores in model 3 (replacing BOPO with SFA ratio without changing the weight score of each component) showed more dynamic changes than model 1 with 16 BPRS increased, 10 fixed and 33 BPRS diminshing. While CAEL model 3 (by replacing the score of SFA and change the weight score of each component) shows that most BPRS CAEL scores diminish that as many as 43. The concept of the bank CAEL is a tool that was created based on risk analysis focus and reaching conditions to come (forward looking) (Bank Indonesia, 2004:11). Thus the bank demanded that there should minimize risks to avoid losses and ensure sustainibility. Thus, most of the ratio is strongly considering asset quality (45% of the overall weight) and capital
International Journal of Academic Research in Economics and Management Sciences September 2013, Vol. 2, No. 5
ISSN:2226-3624
50 www.hrmars.com/journals
adequacy (25% of the overall weight) which both components are used to anticipate emerging risk. Efficiency component is also included in the calculation of CAEL just got a little weight in the range of 10% - 15%. Components of capital adequacy and asset quality are important to maintain the quality of bank financing and to keep sound, but less efficiency components considered in CAEL can damage the sound of the bank. In the calculation of the period CAEL BPRS December 2012, BPRS has a low level of efficiency is based on the calculation of the SFA classified into sound banks in the calculation of CAEL. The low Level of bank efficiency would disrupt the profitability which will affect the soundness of the banks. If banks continue to experience inefficiencies then the profit earned will go down. If the profit earned decreased while the banks have to bear the temporary syirkah funds from the customer, then the benefits will be more narrow and the bank could eventually lose. Losses will be covered by capital. This reduced the amount of capital will affect the CAR that is hindering the development of the BPRS. Influence the efficiency of banks soundness are intimately connected even indirectly. For that component efficiency need to be considered in the CAEL analysis. CAEL efficiency considerations in the analysis can be done by changing the weight of the component efficiency (BOPO) that is, replacing the of BOPO ratio to the frontier approach in CAEL analysis or by a combination between the two. Thus, BPRS can operate more efficiently, to put forward the principle of prudential banking and maintain the capital. Concern of the government of the BPRS is essential to competition in the micro banking market in balance. 4. Conclusion 4.1 Conclusion 1. During the period from second quarter - June 2011 to the fourth quarter of December 2012
the average level of efficiency of sharia rural banks (BPRS) in Indonesia was 81.41% which is the highest level of cost efficiency in BPRS Bakhti Sumekar (ID 38) which is the BPRS to rate highest cost efficiency with an efficiency of 97.77% and the Lowest efficiency score at BPRS Masyarakat Ummat Indonesia (ID 18) with the score of the cost efficiency of 0.6007 or 60.07%.
2. The research hypothesis which states that there is influence between component inputs (price of labor and price of funds), component output (total funding, placements with other banks) and environmental factors (Equity over Total Assets and Non-Performing Financing) on the efficiency of the BPRS costs simultaneously, can be accepted.
3. Based on partial test (t-test) showed that the BPRS in Indonesia, variable component inputs (price of labor and price of funds) and a component output (total funding, placements with other banks) influence on the level of BPRS cost efficiency, while the environmental factor (Equity over Total Assets and Non-Performing Financing) had no effect influence on the level of BPRS cost efficiency.
4. When compared to sharia banks, mean BPRS score much lower efficiency of about 80.44%, while for sharia banks reached 93.96%.
5. Based on the Wilcoxon signed ranks test different, Asymp.Sig (2-tailed) significance level of 0.000, if α <0.05 so that there is a statistically significant difference between the level of

International Journal of Academic Research in Economics and Management Sciences September 2013, Vol. 2, No. 5
ISSN:2226-3624
51 www.hrmars.com/journals
efficiency of SFA with CAEL BPRS ratings. This indicates that the analysis of the bank with CAEL method did not reflect the level of efficiency of BPRS.
4.2 Suggestions 1. For the board of sharia rural banks (BPRS), is expected to continue to increase the level of
cost efficiency, because of the cost of funds is still not used efficiently. Given the cost of labor and financing, board of BPRS should improve its technology to reduce costs to make BPRS more efficient.
2. Bank Indonesia (BI) and Financial Services Authority (OJK) needs to further encourage commercial banks in order to channel financing through BPRS mediation with linkage program rather than having to distribute it theirself to the customer.
3. Given the increasingly tight competition in the micro-banking, then should be set the policy on the restriction of the BPRS area of operations in order not to compete with other BPRS. During the PBI. 11/23/PBI/2009 indeed limit BPRS operations only in one province but not set on limiting the number of BPRS in the region. Restrictions should be done by requiring the county/city has only one BPRS, if in one county/city there are some BPRS, so that BPRS should be merged. Another implication, BPRS would have stronger capital so businesses can expand.
4. With BPRS condition that still dis-economies of scale, the merger between the adjacent BPRS will be the solution to strengthen the capital so that the BPRS reached the level of economies of scale. This merger also can prevent the unfair competition between the members of BPRS in the one area.
5. CAEL ratio analysis as a tool to measure the soundness of the banks need to be reviewed, especially on the determination of the weight of the component. CAEL efficiency considerations in the analysis can be done by changing the weight of the component efficiency (BOPO) that is, replacing the of BOPO ratio to the frontier approach in CAEL analysis or by a combination between the two.
6. For future studies, the level of efficiency of BPRS compared to the level of efficiency of commercial banks to measure how far away the competition in the micro segment with larger banks.

International Journal of Academic Research in Economics and Management Sciences September 2013, Vol. 2, No. 5
ISSN:2226-3624
52 www.hrmars.com/journals
REFERENCES
Anonymous. BI Wajibkan Bank Umum Salurkan Kredit UMKM 20 Persen.” dari http://www.mediaindonesia.com/read/ 2012/11/26/365603/20/2/BI-Wajibkan-Bank-Umum- Salurkan-Kredit-UMKM-20-Persen. Accesed at 25 Desember 2012.
Anonymous. “Duh, Ribuan Pesaing Dihadapi BPR”. Infobank, Desember 2012, P.76.
Bank Indonesia. 2004. Kajian Tentang Konsep Kesehatan Bagi Bank Syariah. Direktorat Perbankan Syariah.
Battese, G.E. & T.J. Coelli. “A Stochastic Frontier Production Function Incorporating A Model for Technical Inefficiency Effects.” Paper presented at the Australasian Meeting of Econometric Society at the University of Sidney, 7-9 July 1993.
Battese, G.E. & T.J. Coelli. 1992. “Frontier Production Functions, Technical Efficiency and Panel Data: With Application to Paddy Farmers in India.” The Journal of Productivity Analysis. Vol. 3. 153.169.
Berger, Allen. N. dan Loretta. J. Mester. 1997. “Inside the Black Box: What Explain Differences in the Effficincies of Financial Institution?” Working Paper Series, The Wharton School, University of Pennsylvania, 1 -59.
Buchori, Ahmad dkk. 2003. “Kajian Kinerja Industri BPRS di Indonesia.” Buletin Ekonomi Moneter dan Perbankan. Vol. 5 No.4. 64 - 123.
Dacanay III, Santos Jose O.. 2007. “Profit and Cost Efficiency of Philippine Commercial Banks Under Periods of Liberalization, crisis and Consolidation.” The Business Review, Cambridge. Vol. 7. No.2. 315-322.
Endri. 2008. “Analisis Kinerja Keuangan dengan Menggunakan Rasio-rasio Keuangan dan Economic Value Added (Studi Kasus: PT. Bank Syariah Mandiri).” Jurnal Ekonomi Vol. 13. No.1. 158 - 170.
Fauzi, Akhmad. 2008. Statistik Industri. Jakarta: Erlangga.
Hadad, M. D. dkk. 2003. “Pendekatan Parametrik untuk Efisiensi Perbankan Indonesia.” Kajian Stabilitas Sistem Keuangan, Direktorat Penelitian dan Pengaturan Perbankan, Bank Indonesia. 1 - 25.
Hartono, Edy. 2009. “Analisis Efisiensi Biaya Industri Perbankan Indonesia dengan Menggunakan Metode Parametrik Stochastic Frontier Analysis.” Tesis Magister Manajemen Universitas Diponegoro.
Nuryantono,Nunung dkk. 2012. “Efficiency Level of BPR: Study of Stochastic Frontier Analysis with an Approach of Time Varying Decay.” International Research Journal of Finance and Economics.Issue 85. 6-13.

International Journal of Academic Research in Economics and Management Sciences September 2013, Vol. 2, No. 5
ISSN:2226-3624
53 www.hrmars.com/journals
Papadopoulus, Simeon. 2008. “New Evidence on Efficiency in Scandinavian Banking.” International Journal of Finance and Economics. Issue 19. 34-47.
Paramita, Desak Putu Ristami. 2008. “Efisiensi Bank Perkreditan Rakyat (BPR) di Indonesia: Pendekatan Stochastic Frontier Analysis (SFA) dan Data Envelopment Analysis (DEA).” Skripsi Departemen Ilmu Ekonomi dan Manajemen, Institut Pertanian Bogor.
Rahardja, Pratama & Mandala Manurung. 2006. Teori Ekonomi Mikro. Jakarta: Lembaga Penerbit Fakultas Ekonomi Universitas Indonesia.
Rahmawati, Rafika & Muhammad Nadratuzzaman Hosen. 2012. “Efficiency of Fund Management of Sharia Banking in Indonesia (Based on Parametric Approach).” .International Journal of Academic Research in Economics and Management Sciencies. Vol. 1. No. 2. 144 – 157.
Setiawati, Alifta Kurnia & Setiawan. 2013. Pemodelan Persentase Penduduk Miskin di Jawa Timur dengan Pendekatan Ekonometrika Panel Spasial, dari http://digilib.its.ac.id/public/ITS-paper- 24626-1308100061-Paper.pdf, downloaded at 21 Mei 2013.
Sujianto, Agus Eko. 2009. Aplikasi Statistik dengan SPSS 16.0. Jakarta: Prestasi Pustaka Publisher.
Supranto, Johannes. 2004. Ekonometri – Buku Kedua. Jakarta: Ghalia Indonesia.
Tahir, Izah Mohd & Sudin Haron. 2008. “Technical Efficiency of the Malaysian Commercial Banks: a Stochastic Frontier Approach.” Banks and Bank System, Vol. 3, Issue 4. h.65 - 72.
Tecles, Patricia dan Benjamin M. Tabak. 2010. “Determinant of Bank Efficiency: The Case of Brazil.”Working Paper Series 2010. Banco Central Do Brasil. 1 - 38.
http://www.bi.go.id