efficacy research for i-ready personalized instruction
TRANSCRIPT

Efficacy Research for i-Ready Personalized InstructionReading and Mathematics
Includes Results for English Learners, Students with Disabilities, and
Other Student Groups
Curriculum Associates Research Brief | Updated November 2020

Study OverviewThe goal of this research study was to understand the impact of i-Ready Personalized Instruction (i-Ready) on students’ reading and mathematics achievement. To do so, the Research team at Curriculum Associates conducted comprehensive research into the impact of i-Ready on student learning gains as measured by the i-Ready Diagnostic (Diagnostic) during the 2017–2018 academic year. The findings from this study demonstrate that i-Ready is an evidence-based intervention as defined by the Every Student Succeeds Act (ESSA). This research study meets the ESSA Level 3 criteria for Promising Evidence.
IntroductionThe Curriculum Associates Research team conducted three separate analyses to determine the effects of i-Ready on students’ reading and mathematics achievement during the 2017–2018 academic year. The first analysis examined the learning gains for students using i-Ready as intended relative to students who did not use i-Ready across Grades K–8. The second analysis examined the learning gains for students in special populations, including students with disabilities, English Learners, students who are economically disadvantaged, and students of color across Grades K–8. The third analysis was an analysis of covariance (ANCOVA) that controlled for prior spring test scores among students in Grades 1–8 to provide evidence that research on i-Ready meets ESSA Level 3 evidence standards.
The results from these analyses showed that, across all grades and subjects, as well as for all special populations, students using i-Ready as intended experienced greater learning gains than students who did not use i-Ready. Notably, the ANCOVA sample of more than 440,000 students using i-Ready for Reading and more than 420,000 students using i-Ready for Mathematics revealed that students using i-Ready as intended demonstrated positive and statistically significantly greater gains from fall to spring on the Diagnostic compared with students who did not use i-Ready.
In this paper, we will use the term “students of color” to refer to the categories of race and ethnic categories of Black or African American and Latino. We recognize that language changes with time and that each demographic group described is not monolithic nor is each individual within any designated demographic group in agreement on preferred language. As a company, we will continue to review, reflect on, and evolve the terminology with the goal of using bias-free, inclusive, and sensitive language labels.
Research QuestionsThe research was undertaken with the goal of answering three key research questions:
• How do fall to spring score gains on the Diagnostic for students using i-Ready instruction as intended compare to students who did not use i-Ready?
• How do fall to spring score gains for students in special populations using i-Ready instruction as intended compare to students in the same populations of students who did not use i-Ready?
• Are the differences in score gains between the i-Ready instruction group and the control group of students who did not use i-Ready instruction statistically significant after controlling for prior achievement?
i-Ready Personalized Instruction Improves Students’ Reading and Mathematics Achievement
© 2020 Curriculum Associates, LLC. All rights reserved.2 |

Program Overviewi-Ready Personalized Instruction (i-Ready) is a research-based program for students in kindergarten through eighth grade with an individualized plan for instruction based on each student’s performance on the online, adaptive i-Ready Diagnostic (Diagnostic). Once students complete the Diagnostic, i-Ready builds a unique lesson plan with a differentiated starting point for every learner based on their overall and domain-level placement. i-Ready allows teachers to add lessons and/or adjust the lesson sequence provided to individuals or groups of students. i-Ready is aligned to college- and career-ready standards and embeds multimedia instruction and progress monitoring into every online lesson. Lessons provide explicit instruction and extensive practice, offer supportive feedback, and build conceptual understanding for learners of all levels. To learn more about the research base behind i-Ready, visit CurriculumAssociates.com/Research.
Curriculum Associates recommends that all students using i-Ready maintain an average of 30–49 minutes of lesson time-on-task per subject per week with at least 70% of lessons passed for the year. In addition, Curriculum Associates recommends administering the Diagnostic three times per year (i.e., beginning, middle, and end of year) with 12–18 weeks between each administration. For the purposes of this study, students had to use i-Ready for a minimum of 30 minutes on average per week, for at least 18 distinct weeks during the 2017–2018 school year.
Outcome Measure The Diagnostic is a valid and reliable computer-adaptive assessment for students in Grades K–12. The Diagnostic starts each student at a difficulty level based on an educated guess that is derived from their chronological grade level. As students answer questions correctly or incorrectly, the test adjusts up or down, with questions of varying difficulty, until the assessment reaches the level of difficulty that is “just right” for each student. The Diagnostic can be administered at three time points during the school year: typically during fall, winter, and spring. Multiple studies have been conducted to support the reliability and validity of the Diagnostic for Reading and for Mathematics as well as their consistency with state content standards used across the United States. The Diagnostic received high ratings from the National Center on Intensive Intervention for use as an Academic Screening and Progress Monitoring tool for both Reading and Mathematics. To learn more about the Diagnostic, visit CurriculumAssociates.com/Diagnostic.
MethodologyTwo types of analyses were conducted to answer the above questions. In the first analysis, descriptive statistics, including mean score gains, were calculated and compared for the treatment (students using i-Ready) and control (students who did not use i-Ready) groups. A similar comparison was done with the subset of students in both groups who had certain demographic data. Percent gains were then calculated by taking the average percent gain within each grade level and population. The overall subject-level percent gains were calculated across all students in Grades K–8 within each subject based on the raw data and do not reflect the average of each grade level’s percent gain.
The second analysis evaluated the score gains while controlling for prior achievement to meet ESSA Level 3 criteria. An ANCOVA analysis was performed for Grades 1–8 in Reading and Mathematics to examine the impact of i-Ready instruction on student score gains. Prior test scores (i.e., i-Ready Diagnostic spring scores from spring 2017) were included as the covariate to control for selection bias. Because kindergarten students do not have a prior spring test score, those students were removed from the analysis.
| 3© 2020 Curriculum Associates, LLC. All rights reserved.

Overall Results: Students Using i-Ready Experienced Greater GainsIn both Reading and Mathematics, students who used i-Ready experienced, on average, greater learning gains than students who did not use i-Ready, meaning those students who used i-Ready tended to grow more than those who did not. See Graphs 1 and 2.
Overall, students using i-Ready for Reading experienced score gains 46% greater than those not using i-Ready.
Students across all grades showed greater growth, with grade-level results ranging from 5% to 84% greater.
Overall, students using i-Ready for Mathematics experienced score gains 38% greater than those not using i-Ready.
Students across all grades showed greater growth, with grade-level results ranging from 20% to 59% greater.
K
+25%
+46%
1
+5%
2
+5%
3
+16%
4
+23%
5
+37%
6
+39%
7
+58%
8
+84%
AverageGrowth
for Students Who Did Not
Use i-Ready
All Grades
AverageGrowth
for Students Who Did Not
Use i-Ready
K
+41%+38%
1
+20%
2
+24%
3
+22%
4
+28%
5
+33%
6
+36%
7
+59%
8
+57%
All Grades
© 2020 Curriculum Associates, LLC. All rights reserved.4 |
Graph 1: Reading Score Gains for Students Using i-Ready Relative to Students Not Using i-Ready, Grades K–8
Graph 2: Mathematics Score Gains for Students Using i-Ready Relative to Students Not Using i-Ready, Grades K–8
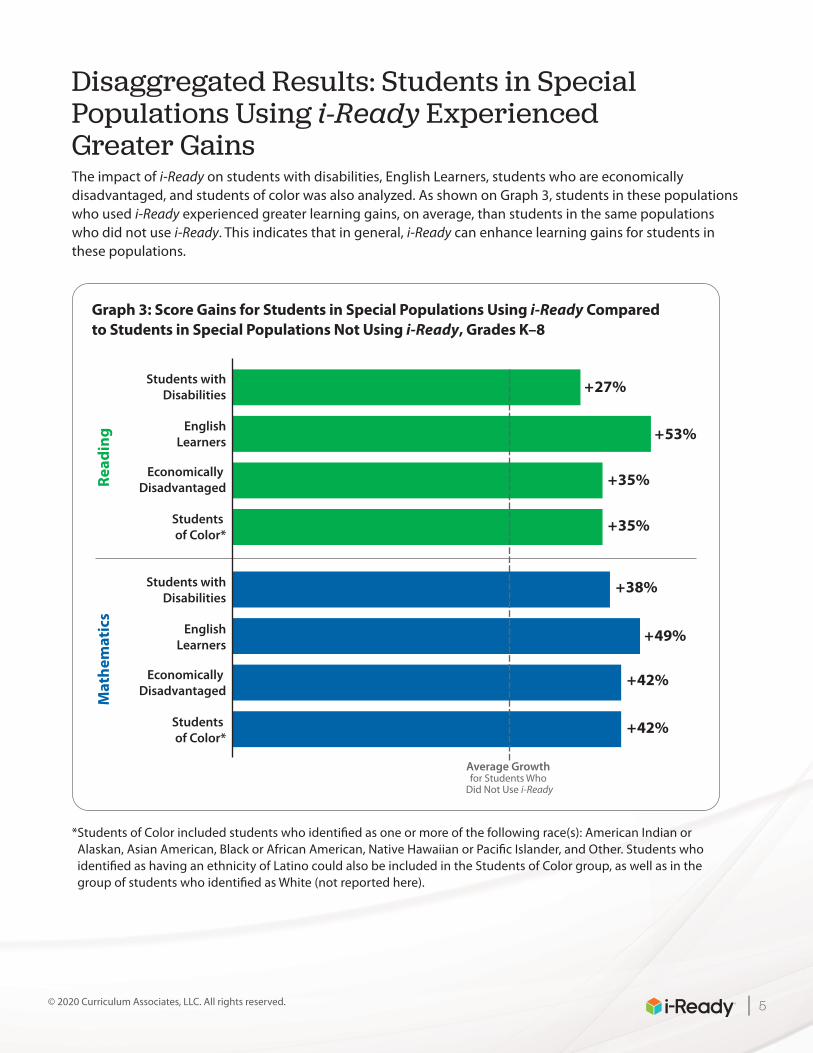
Disaggregated Results: Students in Special Populations Using i-Ready Experienced Greater Gains The impact of i-Ready on students with disabilities, English Learners, students who are economically disadvantaged, and students of color was also analyzed. As shown on Graph 3, students in these populations who used i-Ready experienced greater learning gains, on average, than students in the same populations who did not use i-Ready. This indicates that in general, i-Ready can enhance learning gains for students in these populations.
Students withDisabilities
EnglishLearners
Economically Disadvantaged
Students of Color*
Students withDisabilities
EnglishLearners
Economically Disadvantaged
Students of Color*
Average Growth for Students Who
Did Not Use i-Ready
Mat
hem
atic
sR
ead
ing +53%
+27%
+35%
+35%
+49%
+42%
+42%
+38%
* Students of Color included students who identified as one or more of the following race(s): American Indian or Alaskan, Asian American, Black or African American, Native Hawaiian or Pacific Islander, and Other. Students who identified as having an ethnicity of Latino could also be included in the Students of Color group, as well as in the group of students who identified as White (not reported here).
| 5© 2020 Curriculum Associates, LLC. All rights reserved.
Graph 3: Score Gains for Students in Special Populations Using i-Ready Compared to Students in Special Populations Not Using i-Ready, Grades K–8
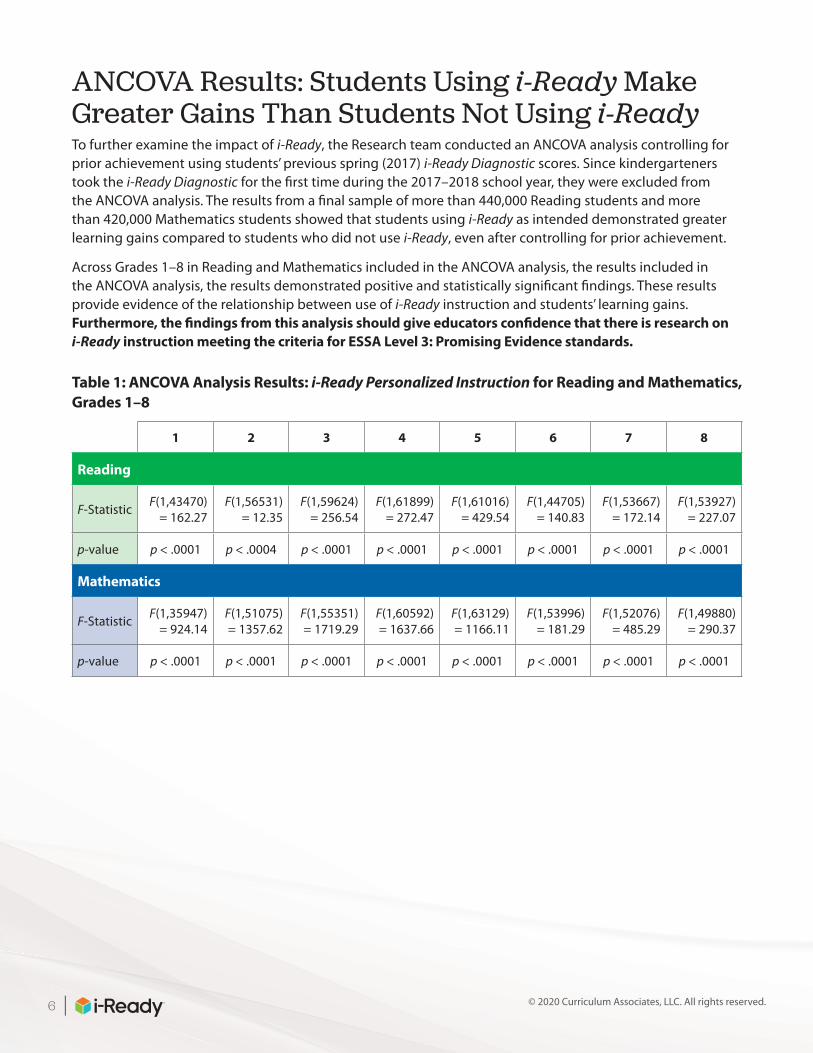
ANCOVA Results: Students Using i-Ready Make Greater Gains Than Students Not Using i-ReadyTo further examine the impact of i-Ready, the Research team conducted an ANCOVA analysis controlling for prior achievement using students’ previous spring (2017) i-Ready Diagnostic scores. Since kindergarteners took the i-Ready Diagnostic for the first time during the 2017–2018 school year, they were excluded from the ANCOVA analysis. The results from a final sample of more than 440,000 Reading students and more than 420,000 Mathematics students showed that students using i-Ready as intended demonstrated greater learning gains compared to students who did not use i-Ready, even after controlling for prior achievement.
Across Grades 1–8 in Reading and Mathematics included in the ANCOVA analysis, the results included in the ANCOVA analysis, the results demonstrated positive and statistically significant findings. These results provide evidence of the relationship between use of i-Ready instruction and students’ learning gains. Furthermore, the findings from this analysis should give educators confidence that there is research on i-Ready instruction meeting the criteria for ESSA Level 3: Promising Evidence standards.
Table 1: ANCOVA Analysis Results: i-Ready Personalized Instruction for Reading and Mathematics, Grades 1–8
1 2 3 4 5 6 7 8
Reading
F-StatisticF(1,43470)
= 162.27F(1,56531)
= 12.35F(1,59624)
= 256.54F(1,61899)
= 272.47F(1,61016)
= 429.54F(1,44705)
= 140.83F(1,53667)
= 172.14F(1,53927)
= 227.07
p-value p < .0001 p < .0004 p < .0001 p < .0001 p < .0001 p < .0001 p < .0001 p < .0001
Mathematics
F-StatisticF(1,35947)
= 924.14F(1,51075) = 1357.62
F(1,55351) = 1719.29
F(1,60592) = 1637.66
F(1,63129) = 1166.11
F(1,53996) = 181.29
F(1,52076) = 485.29
F(1,49880) = 290.37
p-value p < .0001 p < .0001 p < .0001 p < .0001 p < .0001 p < .0001 p < .0001 p < .0001
© 2020 Curriculum Associates, LLC. All rights reserved.6 |

Findings from these analyses demonstrate how i-Ready Personalized Instruction is an effective online supplemental program in Reading and Mathematics.
Students using i-Ready instruction as intended showed greater learning gains than students who did not use i-Ready instruction.
On average, the students with disabilities, English Learners, students who are economically disadvantaged, and students of color who used i-Ready instruction experienced greater learning gains than students in the same populations who did not use i-Ready.
In both Reading and Mathematics, students in Grades 1–8 made positive, statistically significant gains after controlling for prior achievement, indicating that i-Ready meets ESSA Level 3: Promising evidence standards.
1
2
3
Conclusion
To learn more about research showing how i-Ready positively impacts student achievement in Reading and Mathematics, including research that meets the ESSA Level 2 criteria for Moderate Evidence, please visit CurriculumAssociates.com/i-Ready-Research.
| 7© 2020 Curriculum Associates, LLC. All rights reserved.
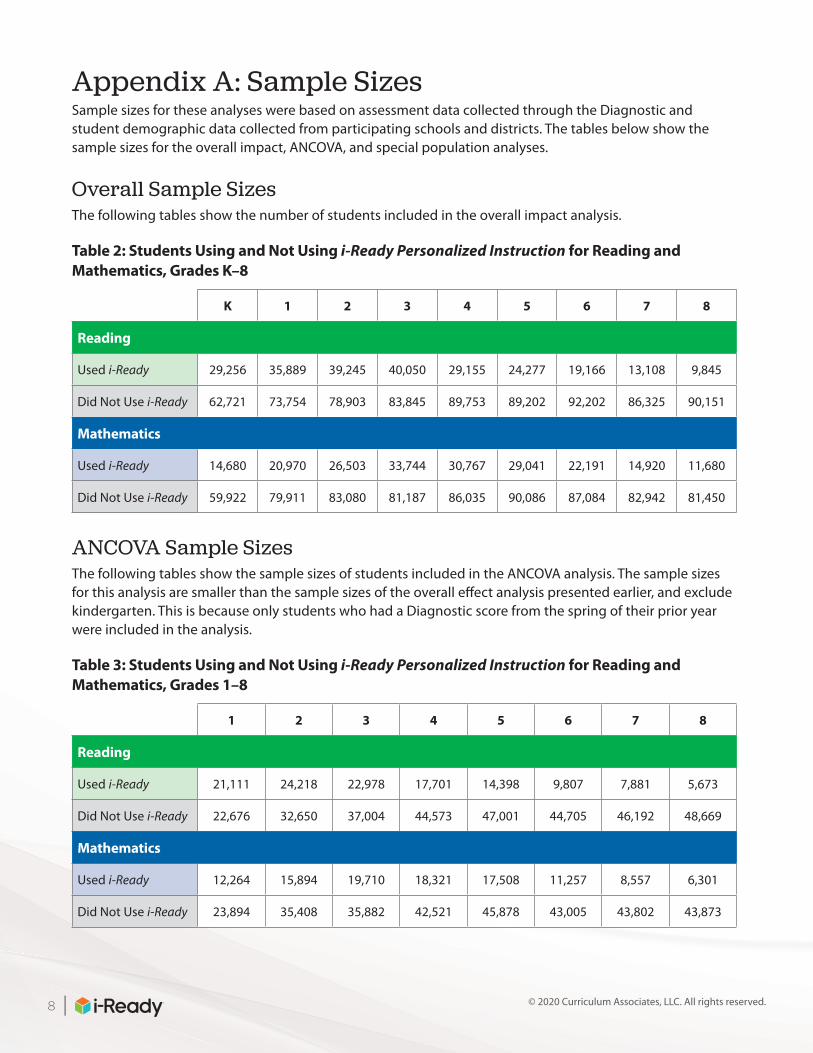
Appendix A: Sample SizesSample sizes for these analyses were based on assessment data collected through the Diagnostic and student demographic data collected from participating schools and districts. The tables below show the sample sizes for the overall impact, ANCOVA, and special population analyses.
Overall Sample SizesThe following tables show the number of students included in the overall impact analysis.
Table 2: Students Using and Not Using i-Ready Personalized Instruction for Reading and Mathematics, Grades K–8
K 1 2 3 4 5 6 7 8
Reading
Used i-Ready 29,256 35,889 39,245 40,050 29,155 24,277 19,166 13,108 9,845
Did Not Use i-Ready 62,721 73,754 78,903 83,845 89,753 89,202 92,202 86,325 90,151
Mathematics
Used i-Ready 14,680 20,970 26,503 33,744 30,767 29,041 22,191 14,920 11,680
Did Not Use i-Ready 59,922 79,911 83,080 81,187 86,035 90,086 87,084 82,942 81,450
ANCOVA Sample SizesThe following tables show the sample sizes of students included in the ANCOVA analysis. The sample sizes for this analysis are smaller than the sample sizes of the overall effect analysis presented earlier, and exclude kindergarten. This is because only students who had a Diagnostic score from the spring of their prior year were included in the analysis.
Table 3: Students Using and Not Using i-Ready Personalized Instruction for Reading and Mathematics, Grades 1–8
1 2 3 4 5 6 7 8
Reading
Used i-Ready 21,111 24,218 22,978 17,701 14,398 9,807 7,881 5,673
Did Not Use i-Ready 22,676 32,650 37,004 44,573 47,001 44,705 46,192 48,669
Mathematics
Used i-Ready 12,264 15,894 19,710 18,321 17,508 11,257 8,557 6,301
Did Not Use i-Ready 23,894 35,408 35,882 42,521 45,878 43,005 43,802 43,873
© 2020 Curriculum Associates, LLC. All rights reserved.8 |

Students in Special Populations Sample SizesSamples for the disaggregated analyses were based on assessment data collected through the i-Ready Diagnostic and student demographic data collected from participating schools and districts. Study sample sizes for the special populations analysis are smaller than the sample size for the overall analysis due to differences in available demographic data.
Table 4: Students Using and Not Using i-Ready Personalized Instruction for Reading, Grades K–8*
Special Population K 1 2 3 4 5 6 7 8
Students with Disabilities
Used i-Ready 1,309 2,148 2,765 2,982 2,621 2,293 1,733 1,224 926
Did Not Use i-Ready 3,038 3,890 4,649 5,030 5,763 6,245 5,755 5,162 5,437
English Learners
Used i-Ready 3,478 4,105 4,492 3,753 2,892 1,953 1,230 745 576
Did Not Use i-Ready 9,717 10,187 10,171 7,685 7,633 6,106 5,741 3,182 3,109
Economically Disadvantaged
Used i-Ready 5,864 7,972 8,333 7,494 6,931 5,532 4,364 3,198 2,641
Did Not Use i-Ready 3,965 4,438 5,223 7,297 8,962 8,976 10,201 11,357 11,363
Students of Color
Used i-Ready 14,735 16,631 18,162 17,651 13,500 10,646 7,656 5,486 4,078
Did Not Use i-Ready 12,987 14,947 15,428 20,103 21,190 21,125 20,853 21,246 22,632
* Providing demographic data to Curriculum Associates is optional for educators, so the number of students listed in the rows for “Students with Disabilities,” “English Learners,” “Students of Color,” and “Economically Disadvantaged” does not add up to the number of students listed in the “Overall Sample” section on the prior page.
| 9© 2020 Curriculum Associates, LLC. All rights reserved.

Table 5: Students Using and Not Using i-Ready Personalized Instruction for Mathematics, Grades K–8*
Special Population K 1 2 3 4 5 6 7 8
Students with Disabilities
Used i-Ready 659 1,307 2,131 2,839 2,767 2,612 1,650 1,194 961
Did Not Use i-Ready 3,017 4,112 4,971 5,493 5,814 6,406 5,635 5,106 5,074
English Learners
Used i-Ready 1,726 2,634 3,177 3,670 3,076 2,308 1,073 773 586
Did Not Use i-Ready 9,124 10,235 10,847 8,239 7,845 6,133 5,276 3,196 3,243
Economically Disadvantaged
Used i-Ready 2,975 5,607 6,567 8,647 7,650 7,121 4,172 2,775 2,183
Did Not Use i-Ready 6,058 6,760 7,708 9,080 9,915 10,469 10,039 10,902 10,443
Students of Color
Used i-Ready 7,403 9,645 12,216 15,107 13,312 11,982 7,906 5,459 4,097
Did Not Use i-Ready 13,460 18,373 18,396 20,171 21,245 22,279 21,418 22,154 22,362
* Providing demographic data to Curriculum Associates is optional for educators, so the number of students listed in the rows for “Students with Disabilities,” “English Learners,” “Economically Disadvantaged,” and “Students of Color” does not add up to the number of students listed in the “Overall Sample” section on the prior page.
© 2020 Curriculum Associates, LLC. All rights reserved.10 |


Built to address the rigor of the new standards, i-Ready helps students make real gains. i-Ready collects a broad spectrum of rich data on student abilities that identifies areas where a student is struggling, measures growth across a student’s career, supports teacher-led differentiated instruction, and provides a personalized instructional path within a single online solution.
To learn more about evidence on the impact of i-Ready, please visit CurriculumAssociates.com/Research.
@myiready @CurriculumAssoc iReadyCurriculum Associates
© 2020 Curriculum Associates, LLC. All rights reserved. i-Ready Personalized Instruction Improves Students’ Reading and Mathematics Achievement (Curriculum Associates Research Report No. RR 2020-45). North Billerica, MA: Author. | 11/20 0K