efficacy of settlement ponds for reducing pesticide...
TRANSCRIPT

Almond Board of California - 1 - 2010 – 2011 Annual Research Report
Efficacy of Settlement Ponds for Reducing Pesticide Runoff in Almond Orchards
Project No.: 10-WATER4-MARKLE Project Leader: James C. Markle Coalition for Urban/Rural Environmental Stewardship (CURES) 531-D North Alta Avenue Dinuba, CA 93618 (916) 253-3670 [email protected] Project Cooperators: T.L. Prichard, UC Ag Extension M.Y. Diaz, H. Vuong, and P. Klassen, CURES Interpretive Summary: The use of sediment basins have long been recognized as an effective Best Management Practice (BMP) for reducing sediment loads carried by irrigation drain water. The intention of this study was to examine the effectiveness of sediment basins when used in combination with other potential BMPs for reducing pyrethroid residue loads in tailwater in a large-scale commercial orchard in the Central Valley planted with Nonpariel almonds. The first trial was conducted under typical flow conditions using the sediment basin alone. The second trial was conducted using the sediment basin in combination with the use of a novel new enzyme technology designed to selectively degrade pyrethroid insecticides at a low (1X) rate. The third trial was a repeat of the second trial with a higher dose (10X) of the enzyme. The final trial was conducted with the sediment basin in combination with a 5 % v/v liquid formulation of PAM-calcium dosed just prior to the inlet of the basin. All four trials demonstrated a significant reduction of sediment as measured by the total suspended sediment (TSS) remaining in the irrigation water at the basin exit. The sediment loading was reduced by 90, 92, 89 and 95% respectively. Unfortunately, the pyrethroid levels did not decline as expected and instead were relatively constant across all samples taken and demonstrated no discernable pattern trend in the data. A number of possible theories for what may have happened are discussed. Objectives: This study was designed to investigate the effectiveness of sediment basins when used in combination with other Best Management Practices (BMP) to reduce sediment and pyrethroid loading in irrigation drainage water leaving almond orchards in the Central Valley of California.

Almond Board of California - 2 - 2010 – 2011 Annual Research Report
The study was designed to test four Best Management Practices (BMP) scenarios:
Sediment ponds alone
Sediment ponds with LandguardTM SP enzyme (low dose rate)
Sediment ponds with LandguardTM SP enzyme (high dose rate)
Sediment ponds with a liquid formulation of PAM (polyacrylamide) Data from this study would be used to make recommendations on using these methods for controlling both sediment and pyrethroid residues in irrigated agriculture. Materials and Methods: Introduction Off-site movement of pesticides and sediment from flood-irrigated agriculture has been a significant concern in the Central Valley of California. It is estimated that about 1.2 million tons per year of sediment are carried into the San Joaquin River by irrigation runoff from just West Stanislaus County farmland alone (1). These sediments may potentially carry pesticides, nutrients, metals and salts trapped in the soil matrix and degrade surface water quality. In California’s Central Valley there are 11 water body segments listed as “impaired” under the draft 2008 Clean Water Act Section 303(d) list, due to sediment toxicity of agricultural origin (2). Pyrethroid insecticides, which are widely used in California (3), are commonly found in sediments in creeks and agricultural drains at concentrations toxic to sensitive aquatic species (4,5,6). These compounds are highly hydrophobic and readily bind to the sediment. Two best management practices (BMPs) recommended by the Natural Resource Conservation Service (NRCS) to retain soil on croplands and mitigate the transport of sediments are the use of sediment basins (Conservation Standard Practice No. 350) and polyacrylamide or PAM (Conservation Standard Practice No. 450). If sediment basins are designed correctly, they may trap up to 70-80% of the sediment that flows into them (7). The sediment basins reduce flow rates and briefly retain water allowing deposition of the heavier suspended particles. Compounds that are highly hydrophobic such as the organochlorine pesticides, polychlorinated biphenyls (PCBs) and polyaromatic hydrocarbons, and pyrethroids bind readily to the sediment and are removed from the runoff water as the sediment settles. Although a number of papers have investigated the transport of highly hydrophobic compounds into agricultural streams with the sediment (8,9), to date few data exist on the effectiveness of sediment basins for the removal of pyrethroid residues from agricultural runoff. Polyacrylamide (PAM) is a water soluble, high molecular weight, synthetic organic polymer. Since 1995, its first year of commercial use for irrigation-induced erosion control, it has been used on about one million hectares worldwide (10). It has also been used as a flocculent in municipal water treatment, paper manufacturing and food processing (11). PAM interacts with soil particles to stabilize both soil surface structure
Almond Board of California - 3 - 2010 – 2011 Annual Research Report
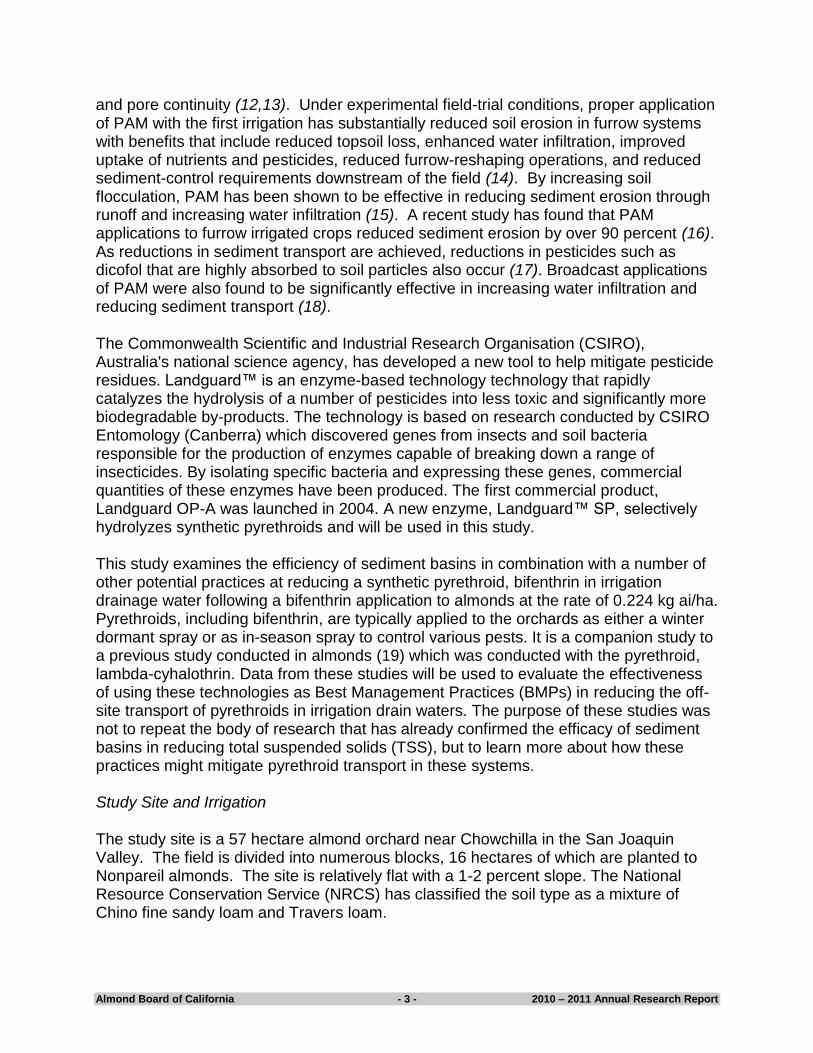
and pore continuity (12,13). Under experimental field-trial conditions, proper application of PAM with the first irrigation has substantially reduced soil erosion in furrow systems with benefits that include reduced topsoil loss, enhanced water infiltration, improved uptake of nutrients and pesticides, reduced furrow-reshaping operations, and reduced sediment-control requirements downstream of the field (14). By increasing soil flocculation, PAM has been shown to be effective in reducing sediment erosion through runoff and increasing water infiltration (15). A recent study has found that PAM applications to furrow irrigated crops reduced sediment erosion by over 90 percent (16). As reductions in sediment transport are achieved, reductions in pesticides such as dicofol that are highly absorbed to soil particles also occur (17). Broadcast applications of PAM were also found to be significantly effective in increasing water infiltration and reducing sediment transport (18). The Commonwealth Scientific and Industrial Research Organisation (CSIRO), Australia's national science agency, has developed a new tool to help mitigate pesticide residues. Landguard™ is an enzyme-based technology technology that rapidly catalyzes the hydrolysis of a number of pesticides into less toxic and significantly more biodegradable by-products. The technology is based on research conducted by CSIRO Entomology (Canberra) which discovered genes from insects and soil bacteria responsible for the production of enzymes capable of breaking down a range of insecticides. By isolating specific bacteria and expressing these genes, commercial quantities of these enzymes have been produced. The first commercial product, Landguard OP-A was launched in 2004. A new enzyme, Landguard™ SP, selectively hydrolyzes synthetic pyrethroids and will be used in this study. This study examines the efficiency of sediment basins in combination with a number of other potential practices at reducing a synthetic pyrethroid, bifenthrin in irrigation drainage water following a bifenthrin application to almonds at the rate of 0.224 kg ai/ha. Pyrethroids, including bifenthrin, are typically applied to the orchards as either a winter dormant spray or as in-season spray to control various pests. It is a companion study to a previous study conducted in almonds (19) which was conducted with the pyrethroid, lambda-cyhalothrin. Data from these studies will be used to evaluate the effectiveness of using these technologies as Best Management Practices (BMPs) in reducing the off-site transport of pyrethroids in irrigation drain waters. The purpose of these studies was not to repeat the body of research that has already confirmed the efficacy of sediment basins in reducing total suspended solids (TSS), but to learn more about how these practices might mitigate pyrethroid transport in these systems. Study Site and Irrigation The study site is a 57 hectare almond orchard near Chowchilla in the San Joaquin Valley. The field is divided into numerous blocks, 16 hectares of which are planted to Nonpareil almonds. The site is relatively flat with a 1-2 percent slope. The National Resource Conservation Service (NRCS) has classified the soil type as a mixture of Chino fine sandy loam and Travers loam.

Almond Board of California - 4 - 2010 – 2011 Annual Research Report
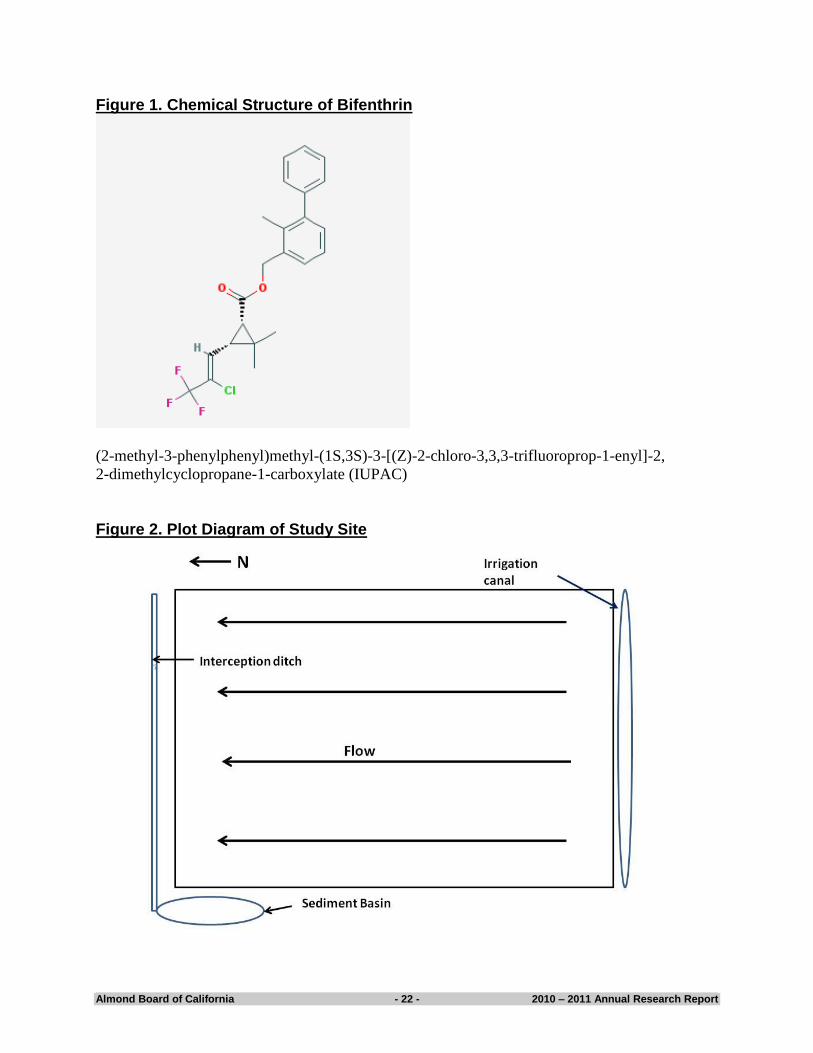
The field is surface irrigated using district canal water (see Figure 2). Each row in the field is provided with irrigation water from a single orchard irrigation head located at the top of the row and the rows are bermed on each side. The row is 6.7 m between berms and 366 m in length. At the bottom side of the field block is an interception ditch installed to capture irrigation drainage water which is subsequently directed to a sediment basin. The basin is basically rectangular in shape and measures 5.8 m by 49 m and averages 2.1 m deep. It has an estimated holding capacity of approximately 600,000 liters. Opposite the inlet side of the pond is a recirculation pump that returns the water for reuse to other parts of the orchard. Climate Climate in the vicinity of the project is typical for the central San Joaquin Valley. Two seasons dominate: winters with cool temperatures and periods of rainfall (November through April) and summers with high temperatures and minimal to no rainfall. Data retrieved from the closest California Irrigation Management Information System (CIMIS) Weather Station (#145) in Madera, CA indicated only a trace of precipitation (0.03 in, 0.76 mm) during the last day of the study (May 23-May 28, see Table 1) with a maximum temperature of 78.5 oF (25.8 oC) and a minimum temperature of 44.7 oF (7.06 oC. see Table 2). Application of Bifenthrin
Bifenthrin (Figure 1) is typically applied to almonds in this region at either the May spray or the hull split nut growth stage to control navel orangeworm (Amyelois transitella) and other chewing insects. In this study, bifenthrin was applied by ground as Fanfare® 2EC using an air blast sprayer at the rate of 0.224 kg ai/ha on the morning of May 25, 2011. One entire block of 16 ha was treated for a total target mass of 3.58 kg ai. Study Design This study consisted of four trials:
Sediment basin alone
Sediment basin in combination with a LandguardTM SP enzyme (low dose) application made at basin inlet
Sediment basin in combination with a LandguardTM SP enzyme (high dose) application made at basin inlet
Sediment basin in combination with a liquid formulation of PAM applied at basin inlet
In the first trial, rows 41-47, the study examined the effect of the sediment basin only in removing sediment and pyrethroid. Irrigation was added at the top of the field through a series of orchard irrigation valves into each row. The tailwater then passes through a six inch PVC pipe and is discharged into the inlet of the sediment basin. Water from the sediment basin is pumped out of the basin at the exit of the pond through a 4-inch diameter steel pipe and is recirculated back to the top of the field. Duplicate 250 mL

Almond Board of California - 5 - 2010 – 2011 Annual Research Report
samples (one for pyrethroid analysis and one for TSS) of drainage water were taken every 30 minutes at the entrance of the sediment basin. Once water began to flow out of the sediment basin, samples were collected every 30 minutes at the exit of the sediment basin (Table 3). In the second trial, rows 35-41, the study examined the effect of the sediment basin plus LandguardTM SP enzyme (low dose) added at the inlet to the sediment basin. Although no impact on the sediment was expected, the enzyme selectively breaks down bifenthrin and may potentially reduce pyrethroid residues at the discharge point of the basin. In the third trial, rows 28-34, the study examined the effect of the sediment basin plus a higher concentration of the LandguardTM enzyme. The potential impact on sediment and bifenthrin residues at the basin exit was observed. In the last trial, rows 21-27, a 5 % v/v liquid formulation of PAM-Calcium was metered into the irrigation runoff just prior to entering the sediment basin. It is expected that PAM-Calcium will further increase the flocculation of sediment particles resulting in further sedimentation in the basin. The hypothesis is that this should reduce both sediment and pyrethroid residues in the outflow. Preparation and Dosing of LandguardTM SP Landguard SP is a freeze-dried, flaky yellow powder which comes in a vacuum-sealed pouch. Prior to use, the Landguard was stored at refrigerated temperatures (<40 oF). When ready to use, the appropriate amount of Landguard was weighed out and transferred to a 30 gallon plastic carboy and filled with water. The Landguard is mixed to dissolve the material and the container placed at the field-edge next to the irrigation ditch. Additional water was added to the drum to bring the final volume to 20 gallons. The system was pre-calibrated to deliver the appropriate dose of Landguard over a 3 hour period. The Landguard dosing rates were based on an assumed runoff of 224-448 gallons/minute (data from a previous study). Trial 2 was dosed with a total of 70 g of enzyme and Trial 3 was dosed with a total of 700g of enzyme. In each trial, approximately 10% of the total dose was added to the sediment basin the night before to “activate” the enzyme and to potentially remove any pyrethroid remaining in the basin from the previous trial. Sample Quenching To quench the enzymatic activity of Landguard prior to sample analysis, several alternatives were discussed. Acidification (<pH 2.0) with acetic acid was ruled out as data suggests that there was significant degradation of bifenthrin at low levels. The method suggested by CSIRO involved the use of an organoposhate, dibrom®. For each sample of runoff collected, 125 µm of dibrom (1ml of a 46.7 mg/L solution) was added and shaken for 1 minute. This has proved to be effective in the laboratory and did not appear to affect sample analysis.

Almond Board of California - 6 - 2010 – 2011 Annual Research Report
Flow Measurements Flow measurements were taken both at the inlet and outlet of the sediment basin. In each case, a portable Doppler flow meter (Greyline PDFM 3.0) was attached to a pipe (6 inch Schedule 40 c/100 PVC pipe at inlet and 4 inch steel at outlet) with a strap on sensor. Knowing the pipe inside diameter allows the calculation of water flow. Flow readings were taken a minimum of every 15 minutes throughout the duration of each trial. Sample Collection Tailwater samples were sampled either by hand or with a pole sampler (Wildco 12-foot swing sampler, 165-C10) every 30 minutes from the exit side of a 4-inch pipe located between the interception ditch at the base of the field and the entrance to the sediment basin and from the field drain at the end of the sediment basin. Note that samples at the exits of the sediment basin were not available during the initial sample intervals, as the basin had not filled up to a sufficient height and therefore was not discharging. At each sampling interval and location, a sample of approximately 250 mL was collected for pyrethroid analysis in a 500 mL amber Boston round glass (Fisher Scientific, P/N 02-911-738) and another sample of approximately 250 mL was collected for measuring total suspended solids in a 500 mL Nalgene polypropylene bottle (Fisher Scientific, A71841086). Within five minutes of collection, the samples were placed in a cooler filled with ice and kept on ice until delivery to the analytical laboratory. Samples were kept in ice chests for a maximum period of 6 days prior to delivery to the analytical laboratory where they were immediately placed in refrigerators for storage until extraction. Sample Analysis-Pyrethroids
All samples were delivered to Morse Laboratories, Inc., in Sacramento, California for analysis. Samples were extracted within 21 days and analyzed within 24 days of receipt. To extract samples prior to bifenthrin analysis, 100 mL of MeOH and 25 mL of hexane were added to each sample bottle. The samples were shaken on a mechanical shaker for approximately 10 minutes and the solvent layers were allowed to separate. A 5.0 mL aliquot of the upper hexane layer was transferred to a test tube (13 x 100 mm) and concentrated to ~0.2 mL using an N-evap evaporator set to ≤40oC. The samples were manually evaporated to dryness with nitrogen. To each sample, 2.0 mL hexane were added, mixed well and sonicated. The sample was transferred to a 500 mg Varian Silica Bond Elut solid phase extraction cartridge with a 1.0 mL rinse of hexane. The cartridge was eluted under gravity or low volumetric pressure and the eluate discarded. A 10 mL collection tube was placed under each cartridge and the cartridge was eluted with 6 ml of a hexane/diethyl ether [9:1, v/v] solution. The eluate was concentrated to dryness under a stream of dry, clean air in a heating block set to 40oC. The sample was redissolved in acetone +0.1% peanut oil solution with ultrasonication. The sample was transferred to an autosampler vial for final determination by GC-MSD/NICI.

Almond Board of California - 7 - 2010 – 2011 Annual Research Report
Note: The 0.1% peanut oil in acetone solution is used to minimize the effect of matrix related to GC-MSD response enhancement and to minimize possible peak tailing due to adsorption. Final Determination by GC-MSD
The following instrument and conditions have been found to be suitable for analysis. Other instruments can also be used, however optimization may be required to achieve the desired separation and sensitivity. Instrument Conditions
GC system : Agilent 6890 with split/splitless injector MSD system : Agilent 5973 with negative ion chemical ionization Injection temperature : 275C Injection liner : 4 mm i.d. double gooseneck splitless liner (unpacked) Column : Varian CPSil 8 30 m × 0.25 mm, 0.25 m film
thickness (5% diphenyl, 95% dimethylpolysiloxane) Column flow rate : 0.9 mL min-1 constant flow Injection mode : Pulsed splitless, 30 psi for 1 min, purge flow to split
vent 50 psi @2 min Injection volume : 2 L
Column temperature program
: 80C for 1 min then program at 25C/min to 300C, hold for 13 min.
Under these conditions, bifenthrin has a retention time of 10.4 minutes. Sample Analysis-Total Suspended Solids
The analysis of tailwater samples for Total Suspended Solids (TSS) was based on Method 2540 D “Total Suspended Solids Dried at 103-105oC” as described in Standard Methods for Examination of Water and Wastewater (20). The glass fiber filter and planchet were weighed prior to filtration. The filter disk was inserted into the filtration apparatus. The sample of tailwater water was added to the filter and rinsed with three successive 10 mL portions of reagent grade water. Allow continuous suction for about 3 minutes after filtration is complete. The filter and planchet were removed from the filtration unit and dried in an oven at 103 to 105oC for one hour. The sample was cooled in a desiccator to balance temperature and weighed. This cycle of drying, desiccation and weighing was repeated until a constant weight is obtained. The total mg of suspended solids in each sample was calculated using the following formula. mg total suspended solids/sample = (weight of filter + dried residue) – (weight of filter) Calculation of Water, Sediment and Pyrethroid Discharges Amounts of water, suspended solids, and pyrethroids entering and leaving the sediment basin were calculated for each sampling interval (see Tables 8-11). Using the Doppler
Almond Board of California - 8 - 2010 – 2011 Annual Research Report
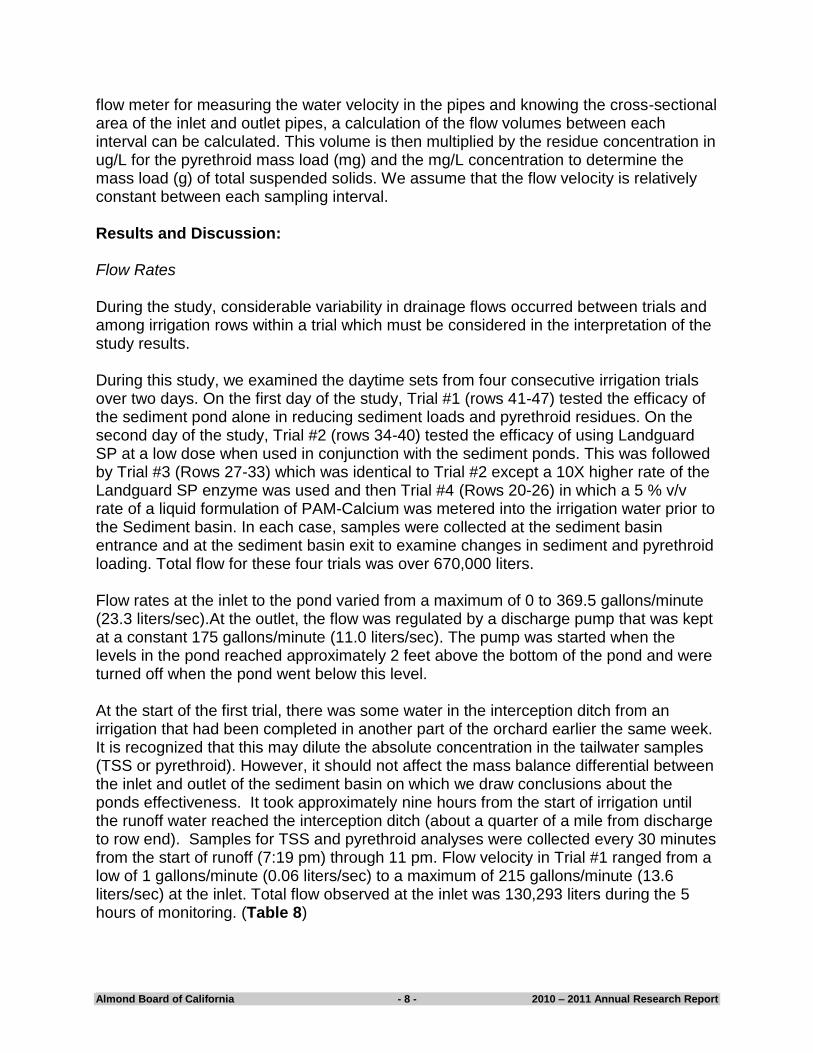
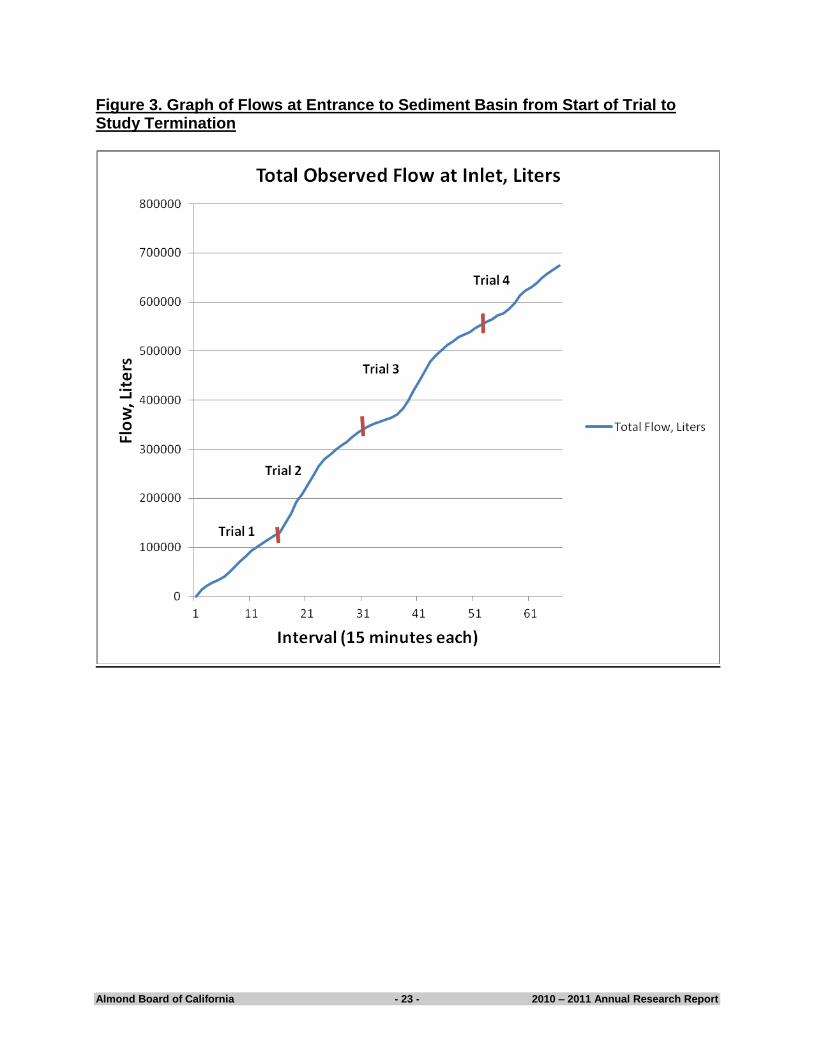
flow meter for measuring the water velocity in the pipes and knowing the cross-sectional area of the inlet and outlet pipes, a calculation of the flow volumes between each interval can be calculated. This volume is then multiplied by the residue concentration in ug/L for the pyrethroid mass load (mg) and the mg/L concentration to determine the mass load (g) of total suspended solids. We assume that the flow velocity is relatively constant between each sampling interval. Results and Discussion: Flow Rates During the study, considerable variability in drainage flows occurred between trials and among irrigation rows within a trial which must be considered in the interpretation of the study results. During this study, we examined the daytime sets from four consecutive irrigation trials over two days. On the first day of the study, Trial #1 (rows 41-47) tested the efficacy of the sediment pond alone in reducing sediment loads and pyrethroid residues. On the second day of the study, Trial #2 (rows 34-40) tested the efficacy of using Landguard SP at a low dose when used in conjunction with the sediment ponds. This was followed by Trial #3 (Rows 27-33) which was identical to Trial #2 except a 10X higher rate of the Landguard SP enzyme was used and then Trial #4 (Rows 20-26) in which a 5 % v/v rate of a liquid formulation of PAM-Calcium was metered into the irrigation water prior to the Sediment basin. In each case, samples were collected at the sediment basin entrance and at the sediment basin exit to examine changes in sediment and pyrethroid loading. Total flow for these four trials was over 670,000 liters. Flow rates at the inlet to the pond varied from a maximum of 0 to 369.5 gallons/minute (23.3 liters/sec).At the outlet, the flow was regulated by a discharge pump that was kept at a constant 175 gallons/minute (11.0 liters/sec). The pump was started when the levels in the pond reached approximately 2 feet above the bottom of the pond and were turned off when the pond went below this level. At the start of the first trial, there was some water in the interception ditch from an irrigation that had been completed in another part of the orchard earlier the same week. It is recognized that this may dilute the absolute concentration in the tailwater samples (TSS or pyrethroid). However, it should not affect the mass balance differential between the inlet and outlet of the sediment basin on which we draw conclusions about the ponds effectiveness. It took approximately nine hours from the start of irrigation until the runoff water reached the interception ditch (about a quarter of a mile from discharge to row end). Samples for TSS and pyrethroid analyses were collected every 30 minutes from the start of runoff (7:19 pm) through 11 pm. Flow velocity in Trial #1 ranged from a low of 1 gallons/minute (0.06 liters/sec) to a maximum of 215 gallons/minute (13.6 liters/sec) at the inlet. Total flow observed at the inlet was 130,293 liters during the 5 hours of monitoring. (Table 8)

Almond Board of California - 9 - 2010 – 2011 Annual Research Report
In the second trail, water from the previous night’s irrigation was still draining into the sediment basin although this dramatically tapered off by the time the irrigation for Trail #2 was started (6:30 am). Landguard SP was applied to the sample inlet (see Figure x) at the start of runoff. As above, samples were collected every 30 minutes until 12:45 pm. Flow in the second trial was higher than the first. The flow velocity ranged from 54 gallons/minute (3.41 liters/sec) to a maximum of 350 gallons/minute (22.1 liters/sec). Total flow observed was 230,887 liters. (Table 9) In the third trial, runoff began at 2:10 pm. The high dose (700 g) of the Landguard enzyme was dosed into the basin inlet and samples were collected from the inlet and outlet every 30 minutes until 6:10 pm. The flow velocity ranges from 63.4 gallons/minutes (3.99 liters/sec) to 369.5 gallons/minute (23.3 liters/sec). The total observed flow was 195,070 liters. (Table 10) In the final trial; runoff began at 7:45 pm. A liquid formulation of PAM-calcium (5% v/v) was metered into the runoff water just prior to the sediment basin entrance. Samples were collected every 30 minutes from both the sediment basin entrance and exit until 10:22 pm. Flow velocities entering the basin ranged from 122.4 gallons/minute (7.72 liters/sec) to 287.9 gallons/minute (18.2 liters/sec). Total observed flow was 108,143 liters/minute. (Table 11) Bifenthrin Residues and Total Suspended Solids (TSS) The concentration of bifenthrin (expressed in ug/L) and TSS levels (expressed in mg/L) for each runoff sample can be found in Tables 3 to 6. With each set of analyses for bifenthrin, two untreated water samples were fortified at two different rates to validate the analytical set. The average recovery of lambda-cyhalothrin was 108 ± 8.07% over the course of the study (see Table 7). The Limit of Determination (LOD) for the analytical method was 0.01 ug/L. TSS levels in the runoff samples from Trial #1 (See Table 3) ranged from 1915 to 3030 mg/L in the samples taken from the sediment basin entrance and dropped significantly from 225 mg/L to 420 mg/L at the sediment basin exit. At the same time, there was very little difference in the bifenthrin residues taken at both the inlet and outlet. The samples ranged from 0.382 ug/L to 0.648 ug/L in the inlet and from 0.430 to 0.626 at the outlet. Figure 4 plots the total suspended solids load in Trial #1 over each sampling interval. As expected, there is a significant reduction of sediment load after passing through the sediment basin (90%). The examination of TSS in Trials 2, 3 and 4, show a similar reduction in sediment loads---92, 89 and 95% reduction, respectively, after passing through the sediment basin. Given the fact that pyrethroids as a class are highly hydrophobic and readily bind to the organic fraction in soils (bifenthrin KOC=1.31-3.02 x 10⁵), it is reasonable to expect that pyrethroids would be similarly reduced as sediment levels decline. Figure 5 plots the bifenthrin residues in Trial #1 on the same time scale as the TSS plot. The data

Almond Board of California - 10 - 2010 – 2011 Annual Research Report
apparently indicate that bifenthrin residues increase when passing through the basin. This was unexpected as data from a previous study (19) run at the same site and using a related pyrethroid, lambda-cyhalothrin, showed reductions of 38-61% with the sediment basin. The consistently high bifenthrin residues found in the four trials was highly suspect. Bifenthrin residues in Trial #1 ranged from 0.382 to 0.648 in the inlet and from 0.430 to 0.626 in the outlet (Table 3). Residues in Trial #2 ranged from 0.424 to 1.02 ug/L in the inlet and from 0.466 to 0.637 ug/L in the outlet (Table 4). Residues in Trial #3 ranged from 0.405 to 0.820 ug/L in the inlet and from 0.495 to 0.706 ug/L in the outlet (Table 5). Residues in Trial #4 ranged from 0.416 to 1.86 ug/L in the inlet and 0.524 to 1.10 in the outlet (Table 6). In all cases, there were no discernable patterns of increase or decline. Conclusions As has been demonstrated previously, the use of sediment basins is an effective BMP for reducing sediment loads in irrigated agriculture. However, the lack of clear, consistent trends in the bifenthrin residue data prevented making any definitive conclusions on the effect of the BMPs tested in this study on bifenthrin loading. There could be a number of potential explanations for what transpired in this trial including:
Previous use of bifenthrin at the study site
A problem with the methodology in the analytical laboratory
Overspray of the sediment basin during bifenthrin application
A high percent of fine clay particles in the system Prior to the start of the study, the grower indicated that he had not used bifenthrin in previous insecticide sprays on his orchard. This was validated by taking pretreatment samples from the site. In each case, no detectable residues of bifenthrin (<0.01 ug/) were found in any sample. To check the methodology, the laboratory was asked to re-extract selected inlet and outlet samples. In each case, the residues found were similar to those seen previously and showed no difference between the inlet and outlet samples. The laboratory used has had extensive experience with pyrethroids residue methodology and is one of the primary laboratories used by the Pyrethroid Working Group (an industry work group of pyrethroid manufacturers). This doesn’t necessarily rule out that an error may have been made, but appears to be unlikely. Overspray of the sediment basin may be a possibility. The weekend prior to the application had high winds in the San Joaquin Valley delaying the application. Although the winds were down below the legal limit, the possibility of some drift is a possibility and the application was not observed. However, one would have expected that the effect of the initial overspray would have subsided as the trial progressed. In addition, the increasing sedimentation in the pond should have still resulted in a decrease of bifenthrin at the outlet. This was not observed. In future trials, post-application samples from the sediment pond should be taken prior to study initiation to rule this out.

Almond Board of California - 11 - 2010 – 2011 Annual Research Report
The final possibility would be a high percentage of very fine, light-weight clay particles in the system. In this scenario, the heavy clay particles would still settle out, but bifenthrin would get carried through the system on these light-weight particles. If the percentage was large enough, you could still see significant settling (as measured by TSS), but residues between inlet and outlet could be similar. To test this theory, future studies should measure the particle size of the inlet and outlet samples. Publications: McCutchan, M., P. Osterli, and J. Letey. 1993. Polymers check furrow erosion, help river life.
California Agriculture Vol. 47 (5): 10-11. Long, R.F., B.R. Hanson, A. Fulton, and D.P. Weston. 2010. Mitigation techniques reduce
sediment in runoff from furrow-irrigated cropland. California Agriculture Vol 64 (4) 135-140. PUR. 2009. Summary of Pesticide Use Reporting Data-2009 Indexed by Chemical. Annual
report from the California Department of Pesticide Registration, 635 pp. Weston D.P., J. You and M.J. Lydy. 2004. Distribution and toxicity of sediment-associated
pesticides in agricultural-dominated water bodies of California’s Central Valley. Environmental Science and Technology Vol. 38:2752-2759.
Weston D.P., M Zang, and M.J. Lydy. 2008. Identifying the cause and source of sediment toxicity in an agriculture-influence creek. Environmental Toxicology and Chemistry, Vol. 27(4): 953-962.
Phillips B.M., B.S. Anderson and J.W. Hunt. 2006. Solid-phase sediment toxicity identification in an agricultural stream. Environmental Toxicology and Chemistry, Vol. 25(6): 1671-1676.
California Stormwater Quality Association, Stormwater Best Management Practice Handbook for New Development and Redevelopment; 2003.
Pereira, WE, Domagalski, JE., Hostettler, FD, 1995, Occurrence and Accumulation of Pesticides and Organic Contaminants in River Sediment, Water and Clam Tissues from the San Joaquin River and Tributaries, California, Environ Tox and Chemistry, Vol 15, No 2, pp. 172-180.
Van Metre, PC, Callender, E, Fuller, CC, 1997, Historical Trends in Organochlorine Compounds in River Basins Identified Using Sediment Cores from Reservoirs, Environmental Science and Technology, 1997.
Sojka, RE., R.D. Lentz, C.W. Ross, T.J. Trout, D.L. Bjorneberg, and J.K. Aase. 1998. Polyacrylamide effects on infiltration in irrigated agriculture. Journal of Soil & Water Conservation. 53(4):325-331.
Sojka, R.E. and R.D. Lentz. 1997. Reducing Furrow Irrigation Erosion with Polyacrylamide (PAM). Journal of Production Agriculture. 10(1):47-52.
De Boodt, M. F. 1990. Soil colloids and their associations—NATO ASI series B: Physics, M. F. De Boodt, M. H. B. Hates, and A. Herbillon, eds., Vol. 215, Plenum, New York.
Malik, M., and Letey, J. 1991. Adsorption of polyacrylamide and polysaccharide polymers on soil materials. Soil Sci. Soc. Am. J., 55(2), 380–383.
Sojka, R.E., and Lentz R.D. 1996. Polyacrylamide for Furrow-Irrigation Erosion Control. Irrigation Journal, Vol. 46, No. 1.
Lentz, R.D., T.D. Steiber, and R.E. Sojka. 1995. Applying polyacrylamide (PAM) to reduce erosion and increase infiltration under furrow irrigation. IN: Robertson, L.D., Nolte, P., Vodraska, B., King, B., Tindall, T., Romanko, R. and Gallian, J. (eds.). Proc. Winter Commodity Schools--1995. Pages 79-92. University of Idaho Cooperative Extension, Moscow, ID.
Orts, W.J., A. Roa-Espinosa, R.E. Sojka, G.M. Glenn, S.H. Imam, K. Erlacher, and J.S. Pedersen. 2007. Use of synthetic polymers and biopolymers for soil stabilization in

Almond Board of California - 12 - 2010 – 2011 Annual Research Report
agricultural, construction, and military applications. Journal of Materials in Civil Engineering. 19(1):58-66.
Singh, G., J. Letey, P. Hanson, P. Osterli, and W.F. Spencer. 1996. Soil erosion and pesticide transport from an irrigated field. Journal of Environmental Science and Health B3 (1):25-41.
Abu-Zreig, M. 2006. Control of Rainfall-Induced Soil Erosion with Various Types of Polyacrylamide. Journal of Soils & Sediments. 6(3):137-144. Markle, J.C., Watson, T.L., Prichard, T.L. and P. Klassen. 2011. Efficacy of Sediment Basins for Reducing Sediment and Pyrethroid Transport in Almond Orchards. In ACS Symposium Book, Pesticide Mitigation Strategies for Surface Water Quality, 2011. Greenberg, A et al, 1992. Standard Methods for the Examination of Water and Wastewater, 18th Edition, Method 2540 D Total Suspended Solids Dried at 103-105oC”

Almond Board of California - 13 - 2010 – 2011 Annual Research Report
Tables and Figures Table 1. Timing of Major Study Events
5/24/2011 Application of pyrethroid
5/26/2011
6:50 am
Start of irrigation for Trial 1
5/26/2011
17:45 pm
Water begins flowing into interception canal
5/26/2011
18:19 pm
Collection of 0-hour sample (inflow)
5/26/2011
19:05 pm
Collection of 0-hour sample (outflow)
5/26/2011
19:20 pm
Irrigation for Trial 2 started
5/26/2011
22:23 pm
Completion of Trial 1 Last sample take from pond
outlet. Enzyme added to pond.
5/27/2011
06:30 am
Trial 2-Water begins flowing into interception canal
5/27/2011
06:55 am
Irrigation for Trial 3 started
5/27/2011
07:42 am
Trial 2-Collection of 0-hour sample (inflow)
5/27/2011
07:45 am
Trial 2-Collection of 0-hour sample (outflow)
5/27/2011
12:15 pm
Completion of Trial 2 Last sample take from pond
outlet. Enzyme added to pond.
5/27/2011
14:00 pm
Irrigation for Trial 4 started
5/27/2011
14:10 pm
Trial 3-Collection of 0-hour sample (inflow)
5/27/2011
14:48 pm
Trial 3-Collection of 0-hour sample (outflow)
5/27/2011
17:50 pm
Completion of Trial 3. Last sample take from pond
outlet.
5/27/2011
19:52 pm
Trial 4-Collection of 0-hour sample (inflow)
5/27/2011
20:48 pm
Trial 4-Collection of 0-hour sample (outflow)
5/27/2011
22:25 pm
Completion of Trial 4. Last sample take from pond
outlet.

Almond Board of California - 14 - 2010 – 2011 Annual Research Report
Table 2. Weather Data from CIMIS 145 (Madera) for the Period 5/23/2011 to 5/28/2011

Almond Board of California - 15 - 2010 – 2011 Annual Research Report
Table 3. Analytical Data from Trial 1 (Sediment Basin alone)
Sample Number Location Interval Volume TSS (mg/L) Residue (ug/L)
100 Inlet 0 250 ml 3030 0.506
101 Inlet 1 250 ml 2720 0.648
102 Inlet 2 250 ml 1450 0.535
103 Inlet 3 250 ml 1860 0.516
104 Inlet 4 250 ml 2155 0.447
105 Inlet 5 250 ml 1915 0.382
106 Inlet 6 250 ml 2390 0.383
107 Inlet 7 250 ml 1930 0.406
120 Outlet 0 250 ml 290 0.626
121 Outlet 1 250 ml 420 0.449
122 Outlet 2 250 ml 340 0.430
123 Outlet 3 250 ml 270 0.476
124 Outlet 4 250 ml 225 0.518

Almond Board of California - 16 - 2010 – 2011 Annual Research Report
Table 4. Analytical Data from Trial 2 (Enzyme plus Sediment Basin-Low Dose)
Sample Number Location Interval Volume TSS (mg/L) Residue (ug/L)
300 Inlet 0 250 ml 285 0.499
301 Inlet 1 250 ml 140 0.467
302 Inlet 2 250 ml 110 0.508
303 Inlet 3 250 ml 230 0.473
304 Inlet 4 250 ml 2930 1.02
305 Inlet 5 250 ml 1200 0.502
306 Inlet 6 250 ml NA 0.433
307 Inlet 7 250 ml 1080 0.433
308 Inlet 8 250 ml 1165 0.424
309 Inlet 9 250 ml 740 0.434
310 Inlet 10 250 ml 420 0.491
320 Outlet 0 250 ml 100 0.637
321 Outlet 1 250 ml 90 0.599
322 Outlet 2 250 ml 115 0.519
323 Outlet 3 250 ml 60 0.563
324 Outlet 4 250 ml 50 0.500
325 Outlet 5 250 ml 50 0.466
326 Outlet 6 250 ml 45 0.505
327 Outlet 7 250 ml 75 0.560
328 Outlet 8 250 ml 70 0.518

Almond Board of California - 17 - 2010 – 2011 Annual Research Report
Table 5. Analytical Data from Trial 3 (Enzyme plus Sediment Basin-High Dose)
Sample Number Location Interval Volume TSS (mg/L) Residue (ug/L)
500 Inlet 0 250 ml 1935 0.715
501 Inlet 1 250 ml 390 0.766
502 Inlet 2 250 ml 220 0.675
503 Inlet 3 250 ml 2485 0.820
504 Inlet 4 250 ml 1540 0.405
505 Inlet 5 250 ml 2270 0.431
506 Inlet 6 250 ml 1650 0.528
507 Inlet 7 250 ml 595 0.516
508 Inlet 8 250 ml 515 0.541
520 Outlet 0 250 ml 350 0.576
521 Outlet 1 250 ml 265 0.706
522 Outlet 2 250 ml 190 0.630
523 Outlet 3 250 ml 235 0.593
524 Outlet 4 250 ml 190 0.495
525 Outlet 5 250 ml 150 0.535
526 Outlet 6 250 ml 110 0.526
Almond Board of California - 18 - 2010 – 2011 Annual Research Report
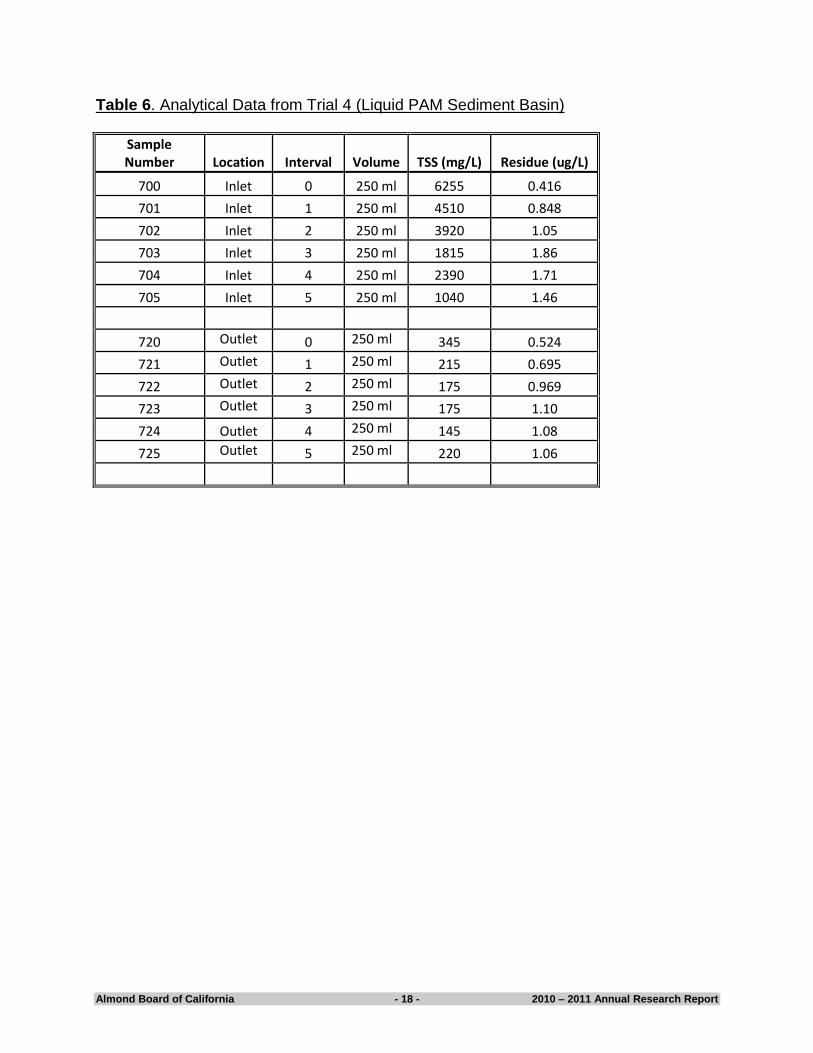
Table 6. Analytical Data from Trial 4 (Liquid PAM Sediment Basin)
Sample Number Location Interval Volume TSS (mg/L) Residue (ug/L)
700 Inlet 0 250 ml 6255 0.416
701 Inlet 1 250 ml 4510 0.848
702 Inlet 2 250 ml 3920 1.05
703 Inlet 3 250 ml 1815 1.86
704 Inlet 4 250 ml 2390 1.71
705 Inlet 5 250 ml 1040 1.46
720 Outlet 0 250 ml 345 0.524
721 Outlet 1 250 ml 215 0.695
722 Outlet 2 250 ml 175 0.969
723 Outlet 3 250 ml 175 1.10
724 Outlet 4 250 ml 145 1.08
725 Outlet 5 250 ml 220 1.06

Almond Board of California - 19 - 2010 – 2011 Annual Research Report
Table 7. Bifenthrin Analytical Recovery from Fortified Basin Water Samples
Sample ID Fort.Level
(ug/L) Recovered (ug/L) % Recovery
87638 Fort. Control 1 0.10 0.110 110
87638 Fort. Control 2 1.0 0.966 97
87638 Fort. Control 3 0.01 0.0117 117
87638 Fort. Control 4 1.0 1.017 102
87638 Fort. Control 5 0.01 0.0113 113
87638 Fort. Control 6 1.0 0.961 96
87638 Fort. Control 7 0.01 0.0120 120
87638 Fort. Control 8 0.10 0.102 102
87638 Fort. Control 9 0.01 0.0113 113
87638 Fort. Control 10 1.00 1.04 104
87638 Fort. Control 11 0.01 0.0117 117
87638 Fort. Control 12 2.0 2.12 106
Average±Std. Dev. 108±8.07

Almond Board of California - 20 - 2010 – 2011 Annual Research Report
Table 8. Summary of Flow Data for Trial 1 (Sediment Basin Only)
Time Period (hours)
Flow (L) Sediment (g) Pyrethroids (mg)
Into Basin Out of Basin Into Basin Out of Basin Into Basin Out of Basin
0.0-0.5 397 --- 1204 --- --- ---
0.5-1.0 13,664 --- 37,165 --- 8.9 ---
1.0-1.5 14,731 9,936 21,360 2,881 7.9 6.2
1.5-2.0 11,866 9,936 22,070 NA 6.1 NA
2.0-2.5 21,415 19,871 46,150 8,346 9.6 17.8
2.5-3.0 22,168 19,871 42,451 6,756 8.5 25.6
3.0-3.5 17,747 19,871 42,417 5,365 6.8 37.8
3.5-4.0 14,977 9,936 28,907 NA 6.1 NA
4.0-4.5 13,328 9,939 12,128 2,236 5.8 51.5
Totals 130,293 99,360 253,852 25,584 59.7 138.9
Table 9. Summary of Flow Data for Trial 2 (Enzyme plus Sediment Basin-Low Dose)
Time Period (hours)
Flow (L) Sediment (g) Pyrethroids (mg)
Into Basin Out of Basin Into Basin Out of Basin Into Basin Out of Basin
0.0-0.5 19894 9936 5670 --- 9.92 ---
0.5-1.0 42159 19871 5902 1987 19.7 19.0
1.0-1.5 36211 19871 3983 1788 18.4 29.8
1.5-2.0 37009 19871 8512 2285 17.5 36.1
2.0-2.5 24294 19871 71181 1192 24.8 50.3
2.5-3.0 17977 19871 21573 993 9.01 54.6
3.0-3.5 17959 19871 19395 993 7.78 60.2
3.5-4.0 15726 19871 18321 894 6.68 75.3
4.0-4.5 11082 19871 8201 1490 4.81 94.6
4.5-5.0 8576 19871 3602 1390 4.21 97.8
Totals 230,887 188,775 166340 13012 122.81 517.7
Almond Board of California - 21 - 2010 – 2011 Annual Research Report
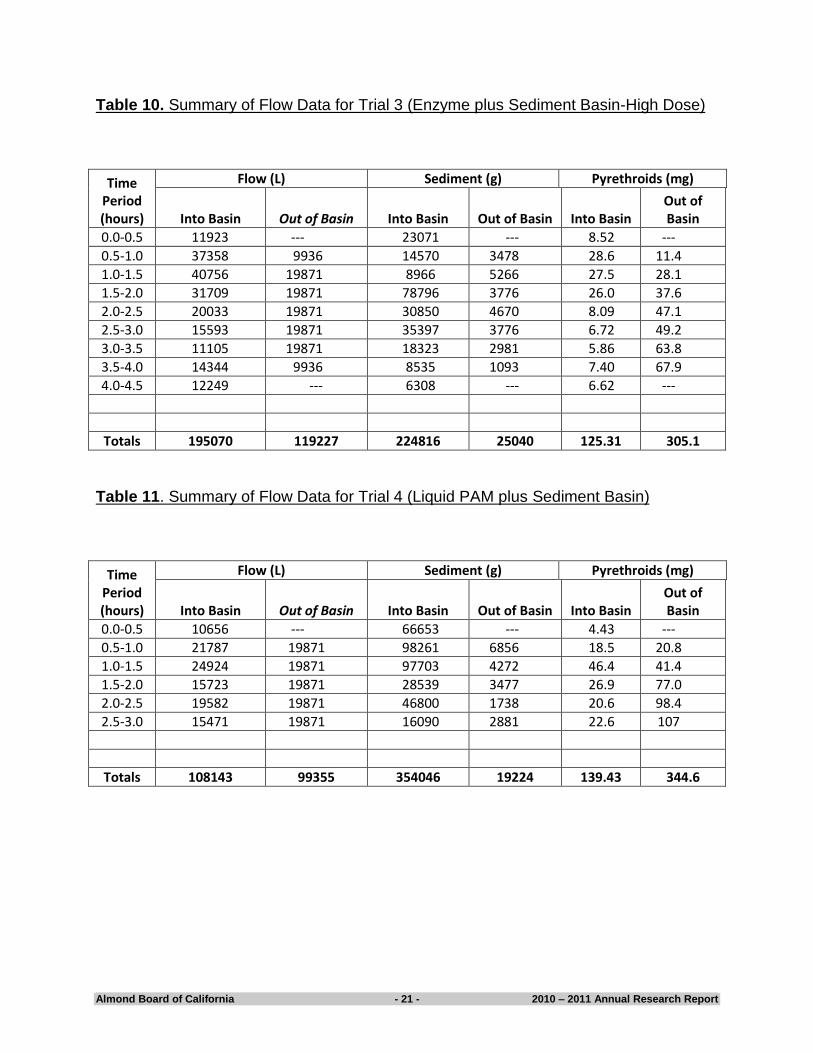
Table 10. Summary of Flow Data for Trial 3 (Enzyme plus Sediment Basin-High Dose)
Time Period (hours)
Flow (L) Sediment (g) Pyrethroids (mg)
Into Basin Out of Basin Into Basin Out of Basin Into Basin Out of Basin
0.0-0.5 11923 --- 23071 --- 8.52 ---
0.5-1.0 37358 9936 14570 3478 28.6 11.4
1.0-1.5 40756 19871 8966 5266 27.5 28.1
1.5-2.0 31709 19871 78796 3776 26.0 37.6
2.0-2.5 20033 19871 30850 4670 8.09 47.1
2.5-3.0 15593 19871 35397 3776 6.72 49.2
3.0-3.5 11105 19871 18323 2981 5.86 63.8
3.5-4.0 14344 9936 8535 1093 7.40 67.9
4.0-4.5 12249 --- 6308 --- 6.62 ---
Totals 195070 119227 224816 25040 125.31 305.1
Table 11. Summary of Flow Data for Trial 4 (Liquid PAM plus Sediment Basin)
Time Period (hours)
Flow (L) Sediment (g) Pyrethroids (mg)
Into Basin Out of Basin Into Basin Out of Basin Into Basin Out of Basin
0.0-0.5 10656 --- 66653 --- 4.43 ---
0.5-1.0 21787 19871 98261 6856 18.5 20.8
1.0-1.5 24924 19871 97703 4272 46.4 41.4
1.5-2.0 15723 19871 28539 3477 26.9 77.0
2.0-2.5 19582 19871 46800 1738 20.6 98.4
2.5-3.0 15471 19871 16090 2881 22.6 107
Totals 108143 99355 354046 19224 139.43 344.6
Almond Board of California - 22 - 2010 – 2011 Annual Research Report
Figure 1. Chemical Structure of Bifenthrin
(2-methyl-3-phenylphenyl)methyl-(1S,3S)-3-[(Z)-2-chloro-3,3,3-trifluoroprop-1-enyl]-2,
2-dimethylcyclopropane-1-carboxylate (IUPAC)
Figure 2. Plot Diagram of Study Site
Almond Board of California - 23 - 2010 – 2011 Annual Research Report
Figure 3. Graph of Flows at Entrance to Sediment Basin from Start of Trial to Study Termination

Almond Board of California - 24 - 2010 – 2011 Annual Research Report
Figure 4. Total Suspended Solids (TSS) in the Inlet and Outlet of the Sediment Basin in Trial 1
Figure 5. Total Bifenthrin Residues in the Inlet and Outlet of the Sediment Basin in Trial 1