effects of working capital management on financial
TRANSCRIPT

EFFECTS OF WORKING CAPITAL MANAGEMENT ON
FINANCIAL PERFOMANCE OF ENERGY AND PETROLEUM
COMPANIES LISTED ON NAIROBI SECURITIES EXCHANGE
FOR THE PERIOD 2013-2017
BY
MARK W. NAMASAKE
UNITED STATES INTERNATIONAL UNIVERSITY- AFRICA
FALL 2018

EFFECTS OF WORKING CAPITAL MANAGEMENT ON
FINANCIAL PERFOMANCE OF ENERGY AND PETROLEUM
COMPANIES LISTED ON NAIROBI SECURITIES EXCHANGE
FOR THE PERIOD 2013-2017
BY
MARK W. NAMASAKE
A Research Project Report Submitted to the Chandaria School of
Business in Partial Fulfillment of the Requirements of Master in
Business Administration
UNITED STATES INTERNATIONAL UNIVERSITY- AFRICA
FALL 2018

ii
STUDENT’S DECLARATION
I declare this work has not been submitted to any other university other than United States
International University-Africa, it’s my original work which have been submitted for the
Academic purposes.
Signed: ________________________ Date: ______________________
Mark Namasake (ID NO: 639230)
The project has been submitted for the examination as the designated university
supervisor.
Signed: ________________________ Date: ______________________
Mr. Kepha M. Oyaro
Signed: ________________________ Date: ______________________
Dean, Chandaria School of Business

iii
COPYRIGHT
All rights reserved. No part of this project report may be produced or transmitted in any
form or by any means, electronic, mechanical, including photocopying, recording or any
information storage without prior written permission from the author. ©Mark W.
Namasake 2018

iv
ABSTRACT
The purpose of the study was to determine the effect working capital management on
financial performance of energy and petroleum companies listed in the Nairobi Securities
Exchange. The study used the following research questions; What is the effect of
accounts receivables on financial performance of energy and petroleum companies listed
in the NSE? What is the effect of cash conversion cycle on financial performance of
energy and petroleum companies listed in the NSE? and how do accounts payables affect
financial performance of energy and petroleum companies listed in the NSE?
The study adopted the use of descriptive research design. Descriptive was used because
the study is a non- experimental research design used to measure a variable when little
conceptual background has been developed on specific aspects of the variables under.
The population used comprised of all the Energy and Petroleum companies listed in the
Nairobi Securities Exchange as at 31st December 2017. The study adopted the use of
census technique where all listed firms were sampled.
The study collected secondary data in which quantitative data was obtained for the five
companies in the energy and petroleum firms listed in the Nairobi Securities Exchange.
The data was collected from the audited financial statements obtained from the company
websites, the Nairobi Securities Exchange from the year 2013 to 2017. With the help of
Statistical Packages for Social Sciences version 24, the study used descriptive statistics
which included the percentages, mean and standard deviation. Inferential statistics was
used in the study to establish the degree of relationship between the independent variables
and dependent variables in which correlation and regression analysis were used to test the
effects of working capital management on the financial performance of the energy and
petroleum firms listed in the Nairobi Securities Exchange.
The findings of the first research questions indicated that there was a strong positive
correlation between accounts receivables and net profit where the (P-value was
0.000<0.05, and Sig. (2-tailed), was 0.931). The variations of accounts receivables on the
net profit in which the value of R-squared indicated that there was variation of 86.7% on
net profit was due to changes in accounts receivables. The results of the correlation
analysis on the second research questions indicated that there was moderate negatively
relationship between cash conversion cycle and return on assets the (P-value was
0.003<0.05, and Sig. (2-tailed), was -0.566). The variations of cash conversion cycle on

v
return on assets in which the value of R-squared indicated that there was variation of
32.0% on return on assets was due to changes in cash conversion cycle. There was a
strong positive correlation between accounts payables and return on equity for the firms
where the (P-value was 0.000<0.05, and Sig. (2-tailed), was 0.882). The variations of
accounts payables on the return on equity in which the value of R-squared indicated the
variation of 77.9% on return on equity was due to changes in cash accounts payables.
The study concludes that there was a strong positive relationship between accounts
receivables and net profit of energy and petroleum companies listed in the Nairobi
Securities exchange. Accounts receivables influences the financial performance of the
listed companies and which makes them profitable. Secondly, there was negatively
relationship between cash conversion cycle and return on assets. The results imply that
financial performance of listed energy and petroleum firms depends upon effective
working capital management. Lastly, accounts payables was found to be significant
positive association with return on equity, indicating that if time period of supplier ‘s
payment is increased then overall firm‘s financial performance also improves for the
listed firms.
From the findings the study recommends that there is need for managers to delay payment
to suppliers and take advantage of the funds as short-term credit which does not attract
interest costs to reinvest in order to generate more income for shareholders. Secondly,
managers can improve the profitability of their firms by reducing their cash conversion
cycle which is the components of days account receivable, inventory turnover in days.
Thirdly the study recommends that managers and financial officers of companies should
establish a long-term relationship with their vendors in order to access trade credit in a
more easy and fast way, as increased use of trade credit enhances performance of
companies through increased financial performance. The study recommends on further
studies to be carried for a longer time period such as ten twenty years to establish the
effect of working capital and financial performance.

vi
TABLE OF CONTENTS
STUDENT’S DECLARATION ........................................................................................ ii
COPYRIGHT ................................................................................................................... iii
ABSTRACT ....................................................................................................................... iv
ACKNOWLEDGEMENTS ............................................................................................. ix
DEDICATION.................................................................................................................... x
LIST OF TABLES ............................................................................................................ xi
LIST OF FIGURES ......................................................................................................... xii
ABBRIEVIATIONS AND ACRONYMS .................................................................... xiii
CHAPTER ONE ................................................................................................................ 1
1.0 INTRODUCTION........................................................................................................ 1
1.1 Background of the Study ............................................................................................ 1
1.2 Statement of the Problem ........................................................................................... 4
1.3 Purpose of the Study .................................................................................................. 5
1.4 Research Questions .................................................................................................... 6
1.5 Significance of the Study ........................................................................................... 6
1.6 Scope of the Study...................................................................................................... 7
1.7 Definition of Terms .................................................................................................... 7
1.8 Chapter Summary ....................................................................................................... 8
CHAPTER TWO ............................................................................................................... 9
2.0 LITERATURE REVIEW ........................................................................................... 9
2.1 Introduction ................................................................................................................ 9
2.2 Effects of Account Receivables on Financial Performance ....................................... 9
2.3 Effects of Cash Conversion Cycle on Financial Performance ................................. 13
2.4 Effects of Accounts Payable on Financial Performance .......................................... 18

vii
2.5 Chapter Summary ..................................................................................................... 22
CHAPTER THREE ......................................................................................................... 23
3.0 RESEARCH METHODOLOGY ............................................................................. 23
3.1 Introduction .............................................................................................................. 23
3.2 Research Design ....................................................................................................... 23
3.3 Population and Sampling Design ............................................................................. 24
3.4 Data Collection Methods .......................................................................................... 26
3.5 Research Procedures ................................................................................................ 26
3.6 Data Analysis Methods ............................................................................................ 27
3.7 Chapter Summary ..................................................................................................... 28
CHAPTER FOUR ............................................................................................................ 29
4.0 RESULTS AND FINDINGS ..................................................................................... 29
4.1 Introduction .............................................................................................................. 29
4.2 General Information ................................................................................................. 29
4.3 Effects of Accounts Receivables on Financial Performance ................................... 40
4.4 Effects of Cash Conversion Cycle on Financial Performance ................................. 43
4.5 Effects of Accounts Payables on Financial Performance......................................... 45
4.6 Chapter Summary ..................................................................................................... 48
CHAPTER FIVE ............................................................................................................. 49
5.0 DISCUSSION, CONCLUSIONS, AND RECOMMENDATIONS ....................... 49
5.1 Introduction .............................................................................................................. 49
5.2 Summary of the Study .............................................................................................. 49
5.3 Discussion ................................................................................................................ 51
5.4 Conclusions .............................................................................................................. 56

viii
5.5 Recommendations .................................................................................................... 57
REFERENCES ................................................................................................................. 59
LIST OF APPENDICES ................................................................................................. 68
Appendix i: Kenya Electricity Generating Company Data Collection Sheet in Kshs.
“000” .............................................................................................................................. 68
Appendix ii: KenolKobil Data Collection Sheet in Kshs. “000” ................................... 69
Appendix iii: Kenya Power and Lighting Company Data Collection Sheet in Kshs.
“000” .............................................................................................................................. 70
Appendix iv: Total Kenya Data Collection Sheet in Kshs. “000” ................................. 71
Appendix v: Umeme Plc Data Collection Sheet in Kshs. “000” ................................... 72
Appendix vi: Data Collection Sheet Summary for Period (2013-2017) in Kshs. “000” 73
Appendix vii: Sample Frame ......................................................................................... 74

ix
ACKNOWLEDGEMENTS
First and foremost, I thank the Lord Almighty for His sufficient grace in this work. I am
also greatly indebted to my supervisor Mr. Kepha Oyaro whose invaluable advice,
support and contribution has been instrumental to me in this study.
Secondly, I am also grateful to all faculty members of Chandaria School of Business
especially Prof. Francis Wambalaba for their immense support and encouragement.
Thirdly, I thank my Dad Peter Tumen for his great help both financially and
psychologically throughout my education.
Finally, Special thanks also goes to all my friends for the peer review, moral support, and
constructive criticisms which have added value in realization of this project.

x
DEDICATION
The project is dedicated my parents, brothers and sisters for their support and
encouragement throughout this academic journey.
xi
LIST OF TABLES
Table 3.1: Population Distribution ..................................................................................... 24
Table 3.2: Sample Size Distributions................................................................................. 26
Table 4.1: Nature of Business for Energy and Petroleum Companies listed ..................... 30
Table 4.2: Descriptive Statistics for Net Profit of Energy and Petroleum Companies ...... 38
Table 4.3: Descriptive Statistics for Total Assets of Energy and Petroleum Companies .. 39
Table 4.4: Descriptive Statistics for Return on Equity of Energy and Petroleum
Companies.......................................................................................................................... 39
Table 4.5: Descriptive Statistics on Accounts Receivables of Energy and Petroleum
Companies.......................................................................................................................... 40
Table 4.6: Correlations between Accounts Receivables and Net Profit ............................ 41
Table 4.7: Model Summary for Accounts Receivables ..................................................... 41
Table 4.8: Analysis of Variance (ANOVA) for Accounts Receivables ............................ 42
Table 4.9: Coefficients Analysis for Accounts Receivables .............................................. 43
Table 4.10: Cash Conversion Cycle and Financial Performance ...................................... 43
Table 4.11: Correlations between Cash Conversion Cycle and Return on Assets ............ 44
Table 4.12: Model Summary for Cash Conversion Cycle ................................................. 44
Table 4.13: Analysis of Variance (ANOVA) for Cash Conversion Cycle ........................ 45
Table 4.14: Coefficients Analysis for Cash Conversion Cycle ......................................... 45
Table 4.15: Descriptive Statistics on Accounts Receivables of Energy and Petroleum
Companies.......................................................................................................................... 46
Table 4.16: Correlations between Accounts Payables and Return on Equity .................... 46
Table 4.17: Model Summary for Accounts Payables ........................................................ 47
Table 4.18: Analysis of Variance (ANOVA) for Accounts Payables ............................... 47
Table 4.19: Coefficients Analysis for Accounts Payables ................................................. 48
xii
LIST OF FIGURES
Figure 4.1: Average Collection Period for Kengen ........................................................... 31
Figure 4.2: Kengen Ratio Analysis for Net Profit Ratio, Return on Equity and Return on
Assets ................................................................................................................................. 32
Figure 4.3: Average Collection Period for KenolKobil ..................................................... 32
Figure 4.4: KenolKobil Ratio Analysis for Net Profit Ratio, Return on Equity and Return
on Assets ............................................................................................................................ 33
Figure 4.5: Average Collection Period for Kenya Power .................................................. 34
Figure 4.6: Kenya Power Ratio Analysis for Net Profit Ratio, Return on Equity and
Return on Assets ................................................................................................................ 35
Figure 4.7: Average Collection Period for Total Kenya .................................................... 35
Figure 4.8: Total Kenya Ratio Analysis for Net Profit Ratio, Return on Equity and Return
on Assets ............................................................................................................................ 36
Figure 4.9: Average Collection Period for Umeme Ltd .................................................... 37
Figure 4.10: Umeme Ratio Analysis for Net Profit Ratio, Return on Equity and Return on
Assets ................................................................................................................................. 38

xiii
ABBRIEVIATIONS AND ACRONYMS
ANOVA Analysis of Variance
ACP Accounts Payables
CCC Cash Conversion Cycle
KenGen Kenya Electricity Generating Company PLC
KPLC Kenya Power and Lighting Ltd
NSE Nairobi Securities Exchange
OLS Ordinary least square
ROA Return on Assets
ROE Return on Equity
SMEs Small and Medium Enterprises
VIF Variance Inflation Factor

1
CHAPTER ONE
1.0 INTRODUCTION
1.1 Background of the Study
Working capital management is a very important component of corporate finance because
it directly affects the liquidity and profitability of a company (Khalaf 2012). Ray (2012)
indicates that one of the vital issues that must be seriously considered before making
financial decision is the working capital. This is because it is an integral part of the
investment and has a direct effect on the liquidity and the financial performance of the
organization. Though, working capital encompasses short term financing and
investments, it is always overlooked when making financial decisions. Furthermore, its
lack of contribution to return on equity makes it work as a hold back for financial
performance.
Working capital management ensures a company has sufficient cash flow in order to meet
its short-term debt obligations and operating expenses. Many firms operating in different
economic sectors may have an optimal level of working capital that maximizes their
wealth (Rathiranee 2017). Ramesh, Hamad and Tammam (2017) argue that working
capital management is one of the prominent financial functions and it represents the
amount of money invested by an organization to meet the day-to-day operations. The
working capital encompasses the difference between the various current assets such as
cash, bank balances, inventories, trade and other receivables, marketable securities and
current liabilities such as trade and other payables, accrued expenses, short-term payables.
The present competitive business environment demands efficient use of resources, which
highlights the importance of working capital management. Previous researches have
concluded that the profitability of a business concern largely depends upon the manner in
which its working capital is managed (Adamu & Hussaini 2015). The inefficient
management of working capital not only reduces profitability but also may in the long run
lead to distress and financial crises in an organization. Akinyomi and Tasie (2016) argue
that the amounts invested in working capital are often high in proportion to the total
assets employed and so it is vital that these amounts are used in an efficient way.

2
Management of working capital, which aims at maintaining an optimal balance between
each of the working capital components which are, cash, receivables, inventory and
payables, is a fundamental part of the overall corporate strategy to create value and is an
important source of competitive advantage for the organization (Waema & Nasieku
2016). The crucial part in managing working capital is maintaining sufficient liquidity for
the day-to-day business operation to ensure the firm’s smooth running and meeting its
obligations.
Management of working capital necessitates short term decisions in working capital and
financing of all aspects of both firm’s short-term assets and liabilities (Nyabuti &
Mokeira 2014). They further indicate that the main objective is to ascertain that the firm
has the ability to continue operating with sufficient cash flow for payment of both
maturing short term debt and impending operational expenses. Its thus involves multiple
crucial decisions which involves managing account payables and account receivables.
Working capital management explicitly affects both financial performance and level of
desired liquidity. If a firm will invest heavily in working capital, that is, more than its
needs, then the profits which can be generated by investing these resources in fixed or
long-term assets will be diminished (Azhagaiah & Muralidharan 2017). Magudba and
Ogbonnaya (2016) conducted a study to determine the working capital management
practices and financial performance of manufacturing companies in Nigeria. The study
employed multiple regressions in analyzing the data sourced from the published financial
statement of the firms under the study. A significant outcome of the study was that
Average Payment Period and Average Collection Period impacts on both Earnings per
share and Return on capital employed. The implication is that efficient management of
working capital will improve the financial performance of the manufacturing firms.
Financial performance is a subjective measure of how well a firm can use assets from its
primary mode of business and generate revenues. The term is also used as a general
measure of a firm’s overall financial health over a given period of time and can be used to
compare similar firms across the same industry or to compare industries or sectors in
aggression (Nyabuti & Ondiek 2016). Financial performance is a subjective measure of a
firm’s overall financial health over a given period of time and can be used to compare
similar firms across the same industry According to Ganag, Kalaiselvan, and Suriya
(2015) measures of financial performance include liquidity, solvency, profitability debt

3
repayment capacity and financial efficiency of the firm. Financial performance can be
measured by the rate of return on investment. The management of a firm working capital
affects its performance. The basic purpose of managing working capital is controlling of
current financial resources of a firm in such a way that a balance is created between
profitability of the firm and risk associated with that profitability. The performance of a
firm can be measured in several ways. Brigham and Gapenski (1999) indicate that the
measures of profitability can include book value based or market value based. They
contend that accounting ratios such as return on equity, return on sales and return on
assets can be used to measure firm’s financial performance.
Management of working capital aims at maintaining an optimal balance between each of
the working capital components, that is, cash, receivables, inventory and payables is a
fundamental part of the overall corporate strategy to create value and is an important
source of competitive advantage in businesses (Abdullahi, Rahima, & Abbass, 2016). In
practice, it has become one of the most important issues in organizations with many
financial executives struggling to identify the basic working capital drivers and the
appropriate level of working capital to hold so as to minimize risk, effectively prepare for
uncertainty and improve the overall performance of their businesses (Azhagaiah &
Muralidharan 2017).
Nairobi Securities Exchange is one of the strongest capital markets in Africa. The Nairobi
Securities Exchange started in the 1920's when the country was still a British colony. The
NSE has undergone numerous transformations over the years to enhance its effectiveness
and adapt to changes in the economic environment, investors interest and leverage on
technology. The NSE has stringent rules and regulations on how accompany is to be
enlisted on the stock market. Quoted companies are divided into different sectors, namely
Agricultural, Commercial and services, Telecommunication and Technology, Automobile
and Accessories, Banking, Insurance, Investment, Manufacturing and Allied,
Construction and Energy. Different companies quoted at the NSE have adopted different
working capital management policies. The NSE as a secondary market provides listed
companies with the opportunity to benefit from improved access to capital, increased
global profile and access to liquidity. There are five listed Energy and Petroleum
Companies in the NSE. They include Kenol Kobil Limited, Total Kenya Limited,
KenGen Limited, Kenya Power and Lighting Company and Umeme Limited.

4
1.2 Statement of the Problem
Working capital management has an important role for the firm’s success or failure
because of the effect on firm’s financial performance and liquidity (Gamze, Ahmet &
Emin 2012). Tanveer, Muhammad, Khan and Sadaf (2016) indicate working capital
management is a tradeoff between risk and profitability. Risk and profitability mismatch
may increase firm’s profitability in the short run but at a risk of insolvency. Managers are
therefore coming to realization that incorrect evaluation of the liquidity implications of
the firm’s working capital needs may, in turn subject creditors and investors to an
unanticipated risk of default. Energy sector as a key foundation and one of the
infrastructural enablers upon which the economic, social and political pillars of its long-
term development strategy will be built. However, energy sector in Kenya faces
challenges such as low access to energy, high cost of energy, irregular supply and high
cost of energy investments (KIPRA, 2017).
Previous studies such as that of Gamze, Ahmet and Emin (2012), determined the effects
of working capital on firm performance in Turkey. The study was based on secondary
data collected from 75 manufacturing firms listed on Istanbul Stock Exchange. The
results demonstrate that firms can increase profitability measured by gross operating
profit by shortening collection period of accounts receivable and cash conversion cycle.
Leverage as a control variable had a significant negative relationship with firm’s financial
performance. Naeem, Malik, Muhammad and Mehboob (2014) on the effects of working
capital management on firm performance of non-financial listed firms in Pakistan. Three
performance measures namely gross profit margin return on asset and return on equity
were used to estimate the impact of working capital variables such as average age of
inventory, average collection period, and average payment period. The findings indicate
that working capital management has material effect on financial performance. A study
conducted by Irokwe and Wakoma (2017), determined how working capital management
affects firm performance of oil companies in Nigeria. The study employed Quasi-
Experimental design. The study concluded that there is an insignificant but undesirable
relationship between working capital and return on equity. The study further concluded
that working capital management impacts performance of Nigerian Oil Companies
primarily from the domain of return on assets.
5
The relationship between working capital management and financial performance of
companies quoted at Nairobi Securities Exchange, Kenya as conducted by Nyabuti and
Ondiek (2012). The study utilized secondary data obtained from the published financial
statements which were readily available at the NSE and the CMA libraries. The study
concluded that there is an existing relationship between working capital management
policy and financial performance of companies quoted at NSE. The dependent variable
which was financial performance was influenced by the independent variables which
were aggressive investment policy and aggressive financial policy. Similarly, Nduta
(2015) conducted a study to determine the effect of working capital management on
financial performance of manufacturing firms listed in the NSE. The study used
secondary data obtained from the firms published financial statements in their respective
websites for a period of 5 years, 2010-2014. Multiple regression and correlation analysis
were carried out on the data to determine the relationships between components of
working capital management and the profit after tax of the firms. The study established
that there is a positive relationship between ROA on the current liabilities to total
liabilities ratio, Current Asset to Total Asset ratio and the current ratio of manufacturing
firms evaluated.
There is scanty of studies on the effects of working capital management on financial
performance of energy and petroleum firms listed in the NSE. There is limited research
that has been done especially for the Energy and Petroleum sector as such is not
comparable to other researches done in the developed world or middle-income countries
where the empirical studies have been conducted and as a result, the researcher believes
there might be differences on the study findings. The study will seek to fill the gap by
studying the effect of working capital management of financial performance of Energy
and Petroleum companies listed in the NSE.
1.3 Purpose of the Study
The purpose of the study was to determine the effect working capital management on
financial performance of energy and petroleum companies listed in the Nairobi Securities
Exchange.

6
1.4 Research Questions
1.4.1 How do accounts receivables affect financial performance of energy and petroleum
companies listed in the NSE?
1.4.2 What is the effect of cash conversion cycle on financial performance of energy and
petroleum companies listed in the NSE?
1.4.3 What is the effect of accounts payables on financial performance of energy and
petroleum companies listed in the NSE?
1.5 Significance of the Study
1.5.1 Energy and Petroleum Companies
The study findings are of importance to energy and petroleum companies both listed and
non-listed. From the study findings, conclusions and recommendations, the companies is
able to identify effective working capital management practices with the aim of
controlling risk associated with working capital and also striking a balance between
current assets and current liabilities.
1.5.2 Policy Makers
The results of this study are significant to the policy makers and regulators such as the
capital markets to implement new set of policies and regulations regarding working
capital management for companies listed under the energy and petroleum sector of the
Nairobi Securities Exchange.
1.5.3 Financial Analysts
This study is of importance to financial and other parties whose knowledge of the
relationship between working capital management and the financial performance is
important input into investment analysis and investment decision making.
1.5.4 Future Researchers
The study findings will also be of significance to future researchers and academicians.
Through the study findings, future researchers will be able to use them as sources of
reference material for studies conducted concerning working capital management and
financial performance.

7
1.6 Scope of the Study
The study was conducted in Nairobi, Kenya with specific focus on the Energy and
Petroleum Companies listed in NSE. There are currently five energy and petroleum
companies listed in the NSE and they include Kenol Kobil Limited, Total Kenya Limited,
KenGen Limited, Kenya Power and Lighting Company and Umeme Limited. The study
analyzed financial information for all the five companies for a five-year period (2013-
2017). The information was obtained from secondary sources such as the NSE database,
the CMA database, published journals and audited company financial reports in the
company websites. However, the possible limitation that the researcher encountered
during the study was missing financial data from the reports.
1.7 Definition of Terms
1.7.1 Account Payables
An account payable is defined as an unsecured, non-interest-bearing current liability,
owed by the company to a supplier for the purchase of goods or services (Besley &
Brigham, 2007).
1.4.2 Account Receivables
Accounts Receivable is defined as the proceeds or payment which the company receives
from its customers who have purchased its goods and services on credit (Weygandt,
Kimmel and Kieso, 2015).
1.7.3 Cash Conversion Cycle
Cash conversion cycle is defined as the length of time a company’s cash is tied up in
working capital before that money is finally returned when customers pay for the
products sold or services rendered (Churchill & Mullins, 2001).
1.7.4 Working Capital
Working capital refers to the circulating capital required to meet the day to day operations
of a business firm (Besley & Brigham, 2007).

8
1.7.5 Working Capital Management
Working capital management refers to a company’s managerial accounting strategy
designed to monitor and utilize the two components of working capital, current assets and
current liabilities, to ensure the most financially efficient operation of the company
(Bhalla, 2014).
1.8 Chapter Summary
This chapter has discussed the background of the study, the problem statement, the key
research questions, the significance of the study, the scope of the study and also defined
the key study terms. Chapter two discusses the literature review based on the research
questions highlighted in chapter one. Chapter three gave a detailed explanation of the
research methodology that was adopted in the study. Chapter four reported the study
results and findings based on the data that was collected. Chapter five gave the summary,
discussion to the study and also give study recommendations.
9
CHAPTER TWO
2.0 LITERATURE REVIEW
2.1 Introduction
This chapter discusses literature review based on the purpose of the study which is to
determine the effect working capital management on financial performance of energy and
petroleum companies listed in the NSE. The literature review was based on the research
questions which were; what is the effect of account receivables on financial performance
of energy and petroleum companies listed in the NSE; what is the effect of cash
conversion cycle on financial performance of energy and petroleum companies listed in
the NSE and how does account payables affect financial performance of energy and
petroleum companies listed in the NSE?
2.2 Effects of Account Receivables on Financial Performance
2.2.1 Relationship between Account Receivables and Financial Performance
Accounts receivable as a component of cash flow has a direct effect on the profitability of
a business. A firm’s competency to synchronize cash inflows with cash outflows in
formulating a cash flow management strategy is important to a firm’s financial
performance (Gill, Bigger & Atnur 2011). Receivables are large investments in firm
assets which are like capital budgeting projects measured in terms of their net present
value. According to Ahmet and Emin (2012), accounts receivables stimulate sales
because it allows customers to assess product quality before paying but on the other hand,
debtors involve funds which an opportunity cost. Based on the characteristic of accounts
receivable; the element of risk, economic value and futurity explains the basis and need
for efficient management of receivables.
Account collection period is represented as the average collection period resulting from a
company selling its products or services on credit. This period is the average length time
form a sale on credit until the payment becomes usable funds for the firm (Sumathi,
2016). ACP involves managing the credit available to the firm’s customers, and also in
receiving, processing and collecting payments. Setting credit standards enables effective
management of credit and accounts receivable process. This process involves applying
10
techniques for determining which customer should receive credit and how much credit
should be granted. Relaxed credit standards generally yield increased sales and additional
profits, whereas tightened credit standards reduce investment in accounts receivable and
thus lowered sales and profit.
A study conducted by Divya, Simran and Vartika (2017) determined the effects of
accounts receivables management on the profitability of the commercial vehicle industry
in India. The study was based on a sample of six commercial vehicle companies. The
multicollinearity among the independent variables was determined on the basis of
Variance Inflation Factor (VIF). Autocorrelation was tested using the Durbin-Watson test.
The White test was used to test heteroscedasticity of the data. Profitability was measured
using return on capital employed. The research was conducted for the period 2009 to
2016. The findings indicated a significant positive relationship between debtor’s turnover
ratio and profitability of the firm. This implies that receivables management should be a
key focus point for improving profitability in the commercial vehicle industry.
The effects of accounts receivable management on profitability of firms during the
financial crisis in Serbia (Ksenjia 2015). A sample of 108 firms is used, which are the
most successful Serbian firms listed at the Prime and Standard Listing as well as the
Multilateral Trading Platform of the Belgrade Stock Exchange. The accounts receivables
policies were examined in the crisis period of 2008-2011. In order to explore the relation
between accounts receivables and firm’s profitability, the short-term effects were tested.
The study showed that between accounts receivables and two dependent variables on
profitability, return on total asset and operating profit margin, there was a positive but no
significant relation. The study concluded that the impact of receivables on firm’s
profitability changes in times of crisis.
A study conducted by Abdullahi, Rahima and Abass (2016) determined the effects of
trade receivables and inventory management on the performance of SMEs in Malaysia.
66 sample of SMEs involved in manufacturing covering from 2006-2012 was used for the
study. Ordinary least square (OLS) regression is used to estimate the relationship between
independent and dependent variable. The result indicated that days account receivable and
inventory turnover in days are negatively related to SME profitability substitutes which
include return on assets, return on equity and net operating profit. The result implies that

11
profitability of SME manufacturing depends upon effective of working capital
components management.
The management of accounts receivable is largely influenced by the credit policy and
collection procedure of a firm. A credit policy specifies requirements to value the worth
of customers and a collection procedure which provides guidelines to collect unpaid
invoice that will reduce delays for customers who have not yet made payment for goods
and services and outstanding receivables (Okpe & Nwakego 2015). Excessive level of
accounts receivable ratio on profitability may lead to negative effect. This is because if a
firm has so many debtors to pay, they may become short of cash which may lead to
difficulty in settling their short-term financial obligations (Sharma & Kumar, 2011).
Profit may be called real profit after receivables are turned into cash.
The relationship between working capital management and the financial performance of
brewery firms quoted on the Nigerian Stock Exchange (Aondana, Saka & Ipevnor 2017).
An Ex-post facto research involving trend analysis of eleven years (2002 to 2012) annual
reports of three brewery firms quoted on the NSE was carried out using the purposive
sampling technique. Data obtained were analyzed with the use of regression analysis. The
result indicated that each working capital components affected profitability. The findings
of the study revealed a significant negative impact of average period of debt settlement
and a statistically significant relationship between average collection period and financial
performance. The study suggested that there is need for managers to delay payment to
suppliers and take advantage of the funds as short-term credit which does not attract
interest costs to reinvest in order to generate more income for shareholders.
A study conducted by Okpe and Nwakego (2015), analyzed the effects accounts
receivable management on profitability of building materials, chemicals and paint
manufacturing firms in Nigeria. The data were collected from the Annual Reports of the
companies under study. Secondary data was used and was extracted from the Annual
report and statement of accounts and building material/chemical and paint companies in
Nigeria. The hypotheses were tested using multiple regression technique. At the end of
the study, the results showed that accounts receivable had positive and significant effects
with the profitability ratio at 1% levels of significance. This means that unit increase in
the variables brings about corresponding increase in the profitability ratio of the building,
12
chemical and paint companies in Nigeria. Both debt ratio and sales growth rate had
negative and non-significant effect on profitability.
The impact of accounts receivable management on the financial performance of Small
and Medium Firms in Mogadishu-Somalia. The target populations had 102 SMEs from
three sectors (Osman & Ayuma 2018) conducted a study to determine. The study used
both probability and non-probability sampling procedures and obtained a sample of 81
based on Slovene formula. Inferential statistics such as Pearson correlation coefficient
and coefficient correlation were used to analyze quantitative data and descriptive statistics
are employed for variables of the study. The study concluded cash flow management and
other independent variables (debt management, credit policy management and inventory
management) have positive significant effect on financial performance at 5% level of
significance.
Efficient accounts receivable management affords a firm improve on its profitability by
reducing the transaction costs of raising funds in case of liquidity crisis (Ahmet 2012). A
study conducted by Munene and Tibbs (2018) was aimed at establishing the relationship
between accounts receivable management and financial performance of Embu Water and
Sanitation Company Limited. This study adopted descriptive research to test the
relationship variables of the study. The study used secondary data which was obtained
from the accounts and finance departments. Descriptive statistics and inferential statistical
techniques were used to analyze the data and presented in tables. Average collection
period and current ratio was found to be significant positive association with return on
equities, indicating that if time period of debtor’s payment is increased then overall
financial performance increases.
A study conducted by Mathenge (2016) to determine the effect of trade receivables
management on profitability of manufacturing companies listed in the Nairobi Securities
Exchange. A descriptive research design was used in this study. The findings of the study
were arrived at using the quantitative research method. The extent and nature of
relationship between the various variables under study was identified using correlation
and regression. Relationships among the dependent and independent variables and
instances of multicolinearity were evaluated using the Pearson correlation analysis. The
study concluded that Average Collection Period, bad debt to receivables ratio and
accounts receivables turnover contribute to 24.7% of the overall profitability. The study
13
concluded that the average collection period has a significant and negative effect on
profitability.
The effects of accounts receivable on the financial performance of firms funded by
government venture capital in Kenya as conducted by Kilonzo, Memba and Njeru (2016).
The target population comprised all firms funded by government venture capital in
Kenya. The study adopted a census approach because of the small number of firms. Both
descriptive and inferential analyses were done. Analysis for variance (ANOVA) and
regression analysis were used to test the hypothesis. The results showed there is a positive
relationship between accounts receivables and financial performance of firms funded by
government venture capital in Kenya. Accounts receivable explained 25.7% of the
financial performance of firms funded by government venture capital in Kenya while the
variation of 74.3% is explained by other factors.
2.3 Effects of Cash Conversion Cycle on Financial Performance
2.3.1 Relationship between Cash Conversion Cycle and Financial Performance
A firm's performance mainly depends on the way the firm is able to manage its resources
at all times. In order to manage working capital efficiently, a firm has to be aware of how
long it takes them, on average, to convert their goods and services into cash. This length
of time is formally known as the Cash Conversion Cycle. In order to measure how well a
firm manages its working capital, a financial performance metric called cash to cash cycle
which was developed by Richards and Laughlin (1980). According to Afzar and Nazir
(2008), cash conversion cycle is a comprehensive performance measure used for
reviewing the ability of companies in managing their capital. Cash conversion cycle
indicate the efficiency of management of current assets. Shorter the time of cash
conversion allows the firms to generate more sales from the amount invested, which
shows that business utilized their resources for generating maximum profit.
The effects of cash conversion cycle on the performance of the cement industry in
Pakistan as conducted by Muhammad, Abdul and Zahid (2014). The study used the
sample of 16 firms selected from cement industry of Pakistan for the period of six years
from 2007 to 2012. The correlation and regression analysis are used to examine the
relationship between cash conversion cycle and firm’s performance i.e. return on assets.
14
The study examined the impact of different component variables of cash conversion cycle
which included receivables collection period, inventory conversion period and payables
deferral period. The findings of the study show negative relationship between firm’s cash
conversion cycle and profitability.
The effect of cash conversion cycle on the profitability of manufacturing companies listed
in the Karachi Stock Exchange Pakistan as conducted by Raheem and Qaisar (2013). The
study took into consideration five years financial statements data starting from 2007 to
2011. Results showed that manufacturing companies are have low average return on asset
and high average return on equity with reasonable average cash conversion cycle.
Regression results after adjusting for heteroskedasticity of data to minimize the effects of
outliers showed that cash conversion cycle has significantly inverse association with both
return on assets and equity indicating that lesser the cash conversion cycle, the greater
would be the profitability measured through return on assets and equity.
The relationship between cash conversion and profitability of firms as conducted by
Majeed, Aziz, Saleem and Makki (2013). The study used the sample of 32 companies
selected randomly from three manufacturing sectors which included chemical,
automobiles and construction and material for the period of five years ranging from 2006
to 2010. Correlation and regression analyses were used to examine the relationship of
Cash Conversion Cycle with performance of the firms using profitability measures such
as return on assets, return on equity and operating profit. The study examined the impact
of different variables of cash conversion cycle on firm’s performance. Similar to the
findings by Muhammad et al., (2014), the study found that the average collection period
of accounts receivables, inventory conversion period and cash conversion cycle have
negative relationship with firm’s performance.
The impact of cash conversion cycle on the profitability of listed hotels and travels
companies in Sri Lanka (Nimal & Anandasayanan 2015). The study used the sample of
10 companies selected randomly from hotels and travels sectors for the period of five
years ranging from 2008 to 2012. This study was based on secondary quantitative data
and the data related to cash conversion cycle and profitability was collected for the period
of 5 years starting from 2008 to 2012 using the annual reports of the selected companies
which were listed in Colombo Stock Exchange. Secondary data was also obtained from
the annual handbook published by Colombo Stock Exchange. Correlation and regression

15
analyses were used to examine the relationship of CCC with performance of the firms
with profitability measures of return on assets, return on equity and net profit margin. The
study found that the cash conversion cycle (CCC) has significantly negative association
with firm’s performance.
The relationship between cash conversion cycle and the profitability of cement
manufacturing companies in India (Panigrahi 2013). Firm size and debt ratio are taken as
control variables. The study took into consideration top five Indian cement companies for
a period of 10 years starting from 2001 to 2010. Results showed that the selected
companies had low average return on asset and return on equity with significantly
negative cash conversion cycle. Regression results after adjusting for heteroskedasticity
of data to minimize the effects of outliers showed that cash conversion cycle has a
significant positive association with both return on assets and equity indicating that it is
not necessary that always the lesser the cash conversion cycle the greater would be the
profitability measured through return on assets and equity.
A study conducted by Murtala and Sani (2016), aimed to determine the impact of
conversion cycle on the profitability of listed telecommunication companies in Nigeria.
Data was collected from all the listed ICT firms from 2010 to 2014. The data was
analyzed using multiple linear regression analysis and the robustness check shows that the
data was normal. The annual reports and accounts of the companies under study, as well
as the Nigerian Stock Exchange Fact Books were used in constructing the data required
for the study. The R2 value means that 26% proportion of variation in the ROA was
explained by the independent variables. The findings confirmed that cash conversion
cycle is a good in influencing firm performance of the firms in ICT sector in the Nigeria.
The study also concluded that decrease in one day for conversion of inventory to sales
can lead to increase in return on assets.
The effect of cash conversion cycle on the profitability of Industrial and Domestic
product firms in Nigeria as conducted by Madubuko and Anastasia (2016). Receivable
ratio, payable ratio and inventory ratio were the variables studied in the study. The
research design used in the study was Ex-post facto research design. The study used only
secondary data extracted from annual report and statement of accounts of the companies
under study. Data was sourced from the annual reports of the selected Industrial and
Domestic companies in Nigeria. Generalized least square multiple regression analytical
16
tools were used to test the Hypotheses. The findings show that, accounts receivables and
accounts payable had significant positive effect on the industries’ profitability ratio at 1%
level of significance.
The effect of cash conversion cycle on the financial performance of public listed
insurance companies (Chuke, Agbo & Christian 2018). Data were collected from the
annual financial reports of sampled insurance companies. Multiple regression technique
was used in analyzing the model for testing the hypotheses. Return on assets was used as
the dependent variable. While cash conversion cycle was presented as the explanatory
variable, current ratio, debt asset ratio, fixed financial total asset ratio, Growth and Size
were all incorporated in the model as control variables. The results indicated that CCC
had negative and significant effect on profitability. Based on the findings, the study
recommended that insurance companies should endeavor to reduce their number of days
in CCC always in order to enhance their profitability.
A study conducted by Ikechukwu and Duru (2016) was aimed at determining the impact
of cash conversion cycle on the financial performance of Building materials, chemical
and paint manufacturing companies in Nigeria. Cash conversion cycle, receivable ratio,
payable ratio, and inventory ratio are the variables studied in this study. Data were
sourced from the annual reports of Health care companies in Nigeria. Generalized least
square multiple regression analytical tools were used to test the hypotheses. The findings
show that, inventory ratio and accounts receivable ratio had significant and positive effect
on firms’ profitability, accounts payable ratio and Cash conversion cycle had positive and
non- significant effect on firms’ profitability.
The effect of cash to cash cycle on profitability of basic material firms listed on the
Nigerian Stock Exchange for the period of ten years spanning 2007 to 2016 (Orjinta &
Okpalaukeje, 2018). The study employed ex-post facto research design and used
secondary data collected from the annual report of selected firms for the analysis. Simple
regression analysis (Pearson Correlation and Ordinary Least Square regression) were
employed to analyze the collected data. The results revealed that cash cover ratio was
found to have negative and insignificant effect on profitability proxy using return on asset
while quick ratio was found to have a positive and significant influence on profitability of
basic material firms at 5% level of significance. The study recommended that
management of basic material firms should reduce the magnitude at which they use up

17
cash and its equivalent in settling their short-term obligations in order to improve their
profitability.
Smilarly in Kenya, Mathuva (2014) conducted a study on the determinants of cash
conversion cycle in Kenyan listed non-financial firms. The study also examines the speed
of adjustment to the target CCC and the factors that influence corporate decisions on the
optimum length of the CCC. Based on a sample of 33 publicly traded firms on the NSE
for the period between 1993 and 2008, cross-sectional and time series analyses were
carried out on the data comprising 468 firm-years. A target adjustment model was
developed to examine the significant determinants of the CCC. Various regression
approaches including ordinary least squares, fixed effects and two-stage least squares
estimation models were used in data analysis. The study established that older firms and
firms with more internal resources maintain longer CCC. Moreover, higher returns on
assets, investment in capital expenditure and growth opportunities have a significant
negative association with the CCC.
A study by Muturi (2015) aimed at determining the effects of cash conversion cycle on
profitability of tea factories in Meru County. The study used primary method of data
collection. Census method was used to collect primary data from all the seven tea
factories in the county for a period of five years starting from 2009 to 2013. The
correlation and regression analyses were used to analyze and describe the nature of the
relationship between CCC and the firm’s profitability. A lot of literature has pointed out
that efficient management of cash has significantly influenced the firm’s profitability.
This study found out that the CCC significantly negatively affects firm’s profitability.
The study thus recommended that there is need therefore for the finance managers to
shorten the net cash conversion cycle to improve profitability.
The effect of cash conversion cycle on the profitability of companies listed in the Nairobi
Securities Exchange as conducted by Mohamed (2013). The relation between the firm’s
cash conversion cycle and its profitability was examined using dynamic panel data
analysis for a sample of firms listed on the Nairobi Securities Exchange for the period
from 2008 to 2012. The results indicated that there is a significant and negative
relationship between the cash conversion cycle and return on asset. The firms with shorter
cash conversion cycles were more likely to be profitable than firms with longer cash
conversion cycles. This is when the cash conversion cycle is relatively shorter; the firm
18
may not need external financing, which results in incurring less borrowing cost and
interest expense, hence increasing profitability.
Cash conversion cycle (CCC) has been considered a useful measure of firm’s effective
working capital management and especially the cash management (Muneeb & Kashif
2012). To explain this, they conducted a study to establish the optimal relationship of
cash conversion cycle with firm size and profitability. The data was collected from the
annual reports of 31 sampled firms out of the total firms in the related sectors i.e. 143
covering the period of 2006-2010. The data analysis was conducted by using One-Way
ANOVA and Pearson correlation techniques. From previous researches and findings, the
study also found that there was found a significant negative correlation between the CCC
and the firm size in terms of total assets and was found a negative correlation between
CCC and profitability in terms of return on total assets with the values of - 0.415 and -
0.131 respectively.
2.4 Effects of Accounts Payable on Financial Performance
2.4.1 Relationship between Accounts Payable and Financial Performance
Accounts payable is defined as the supplier whose payment for goods or services has
been processed but who has not yet been paid. Accounts payable includes trade credit and
accrued expenses which together provide finance to the operations of a business on an on-
going basis (Naeem et al., 2014). Firms would rather sell for cash than on credit, but
competitive pressure forces most companies to offer credits. Unlike credit from financial
institutions, accounts payables do not rely on formal collateral but on trust and reputation.
According to Singh (2004) the liquidity position of a firm mainly depends upon accounts
receivable and payable deferred policy as well as inventories conversion period of firm.
Firms often regard the amount owing to creditors as a source of free credit. It is one of the
major sources of secured short-term financing. Utilizing the value of relationship with
payee is a sound objective that should be highlighting as important as having the optimal
level of preventions (Gitman & Smith 2010). As a consequence, strong alliance between
company and its suppliers will strategically improve production lines and strengthen
credit record for future expansion. Singh (2004) argues that creditor is a vital part of
19
effective cash position. Purchasing initiates cash outflows and overzealous purchasing
function can create liquidity problem.
The impact of accounts payable use on profitability of SMEs in Sweden. A large cross-
sectional panel data set covering 15,897 Swedish SMEs in five industry sectors from
2009 to 2012 was analyzed using several statistical techniques (Darush & Öhman 2016).
The study findings indicated that the use of trade credit significantly and negatively
affects firm profitability, indicating that SMEs with lower accounts payable are more
profitable. Furthermore, liquidity level and firm size are positively related to profitability,
while firm age is negatively related to profitability. If firms rely, or are forced to rely, too
heavily on accounts payable as a funding source, their long-term profitability could be
jeopardized. According to Yazdanfar (2012), an efficient financing policy should make
the costs related to the use of trade credit more transparent. Thus, firm managers could
explicitly use trade credit agreements with their suppliers to control the costs related to
this particular financial source.
A study conducted by Doan, Bui and Hoang (2016) aimed at establishing the impact of
working capital on financial performance of the small and medium-sized enterprises in
Vietnam. Using panel data for 1,209 enterprises in the period from 2008 to 2015, with
ordinary least square method, random effects model and fixed effects model. The findings
showed that receivables and working-capital turnover impact negatively on financial
performance of enterprises. In line with accounts payable, the accounts payable period
and inventory conversion period have a direct relationship with corporate financial
performance. In addition, the results of the study also found that the growth rate, size, and
age of enterprises also affect financial performance directly.
The impact of account payables and account receivables on the financial performance the
Indian telecom industry (Jyoti & Uday 2017). Variables that were used in the study
included return on assets, average collection period, average payment period and cash
conversion cycle. The data analysis was carried out for eight telecom industry listed in
National Stock Exchange of India. The study was based on secondary data and data taken
for a period of five years in order to calculate all the variables. The research methodology
used in the study was descriptive statistics, correlation analysis and ordinary square least
regression analysis in order to know the impact of these variables on profitability. The
result of correlation analysis shows the ROA has negative relationship with average
20
collection period, cash conversion cycle while ROA has positive relationship with
average payment period.
Previous studies have established that changes in working capital have a strong positive
correlation to profitability and that whilst changes to receivables and inventory have a
positive correlation to profitability; changes in payables have an inverse relationship (Ani,
Okwo, & Ugwunta, 2013). The inverse correlation between payables and profitability is
contrary to the theory that advocates extending payment terms as a means of managing
working capital and improving liquidity. Moodley, Ward and Muller (2017) conducted a
study to determine the relationship between accounts payables and financial performance/
return on investors. The study applied a buy-and-hold portfolio methodology to an
extensive database of Johannesburg Stock Exchange over the period 1986 to 2014. The
study findings indicate that companies in industries that have a significant investment in
payables, there is a significant positive association between changes in payable days
return to investors and financial performance.
The effect of accounts payable settlement and accounts receivable on the financial
performance as conducted by Angahar, Rose and Mnena (2017). Average period of debt
settlement and average collection period of receivable were the explanatory variables of
the study while return on assets was the dependent variable. The study adopted an Ex-
post facto research involving trend analysis of eleven years using annual reports of three
brewery firms in Nigeria Securities Exchange. The result indicated that each working
capital components affected the company’s level of profitability at varying rates. The
findings of the study reveal a significant negative impact of APDS and a statistically
significant relationship between ACRP on the financial performance of these brewery
firms quoted on NSE. The study recommended that managers can delay payment to
suppliers and take advantage of the funds as short-term credit which does not attract
interest costs to reinvest in order to generate more income for shareholders.
A study conducted by Duru and Okpe (2015) was aimed at establishing the effect of
accounts payable management on corporate profitability of Brewery Manufacturing
Companies in Nigeria. The variables include, accounts payable, debt ratio and sales
growth rate. Secondary sources of data were used for the period 2000-2011. The results
show that accounts payable had negative but non-significant relationship with
profitability ratio of the companies under Brewery manufacturing companies in Nigeria.
21
Debt ratio had positive and significant relationship, while sales growth rate was negative
and significant with the profitability ratio of Brewery companies in Nigeria.
The relationship between accounts payable management policy and corporate profitability
in Nigerian quoted companies based on the data of 107 quoted companies spread across
23 sectors for the period 2006-2013 (Adolphus 2014). The study found that all the sectors
adopted an aggressive accounts payable management strategy by relying heavily on
current liabilities for financing their working capital needs. The findings also indicated
the adoption of this strategy produced negative profitability in most of the sectors. The
results also showed a strong positive correlation between net current assets ratio and
selected measures of profitability. The study recommended that companies would
maximize profitability and add value by adopting the conservative accounts payable
management strategy provided the operating environment and money markets are strong.
The study of Achode and Malingu (2016) on the effects of accounts payable as a source
of financing on the performance of listed manufacturing firms at the Nairobi Securities
Exchange. Census sampling technique was used, and the study used secondary data,
which was obtained from the companies’ statistics and journals at the Nairobi Securities
Exchange. SPSS was used to carry out the descriptive analysis of the variables, requisite
analysis and advanced analysis of the data. A multiple regression model was used to test
the relationship between the Accounts payable and firm performance. The results from
this research suggested that in most of the manufacturing firms listed at the NSE, there
was a direct positive relationship between Accounts Payable and the firm performance.
The relationship between accounts payable and SME financial performance for a sample
of 50 audited Kenyan SMEs as conducted by Kapkiyai and Mugo (2015). The study
aimed at finding how trade credit affects three measures of financial performance;
liquidity, profit margin and return on assets. Documentary guide was used in the study to
collect secondary data. Analysis was conducted using both inferential and descriptive
statistics specifically mean and standard deviation. Inferential statistics where Pearson
correlation coefficient to determine the degree of relationship while Multiple regression
model was used to test the hypotheses. Findings indicated that accounts payable
positively affected liquidity, profit margin and return on assets. The researchers
concluded that their findings are consistent with pecking order theory by SMEs in pattern
of using accounts payable as a finance source instead of other external sources of finance.

22
Management of accounts payables is very critical in ensuring that there is efficient
management of working capital (Bougheas, Mateut, & Mizen 2009). Firms should avoid
delays in paying for their supplies because of the disadvantages associated with these
delays. A study conducted by Kung’u (2015) was aimed at establishing the effects of
working capital management on the profitability of manufacturing firms in Kenya. A
questionnaire was used to collect primary data for the independent variables and a record
survey sheet was used to collect secondary data for the dependent variable. The results of
the study showed that there was positive linear relationship between accounts payable and
the profitability of manufacturing firms in Kenya. The study recommended that
manufacturing firms to regularly review their credit policies make early payments to their
suppliers in order to enjoy good relationship with their suppliers.
2.5 Chapter Summary
This chapter has presented discussed literature based on the three research questions. It
has discussed in detailed how the components of working capital; accounts receivable,
cash conversion cycle and accounts payable, influence financial performance. The next
chapter will discuss the research methodology that was used and adopted in the study.
This will include the research design, the population and sampling design, the methods of
data collection and data analysis.

23
CHAPTER THREE
3.0 RESEARCH METHODOLOGY
3.1 Introduction
This chapter gives the methodology that was used in the study. It describes the planning
of this research that undertakes to establish the effects of working capital management on
financial performance of Energy and Petroleum companies listed on Nairobi Securities
Exchange. The chapter discusses the research design, the population and sampling design,
the sampling technique that was used in the study, data collection methods, research
procedures, data analysis methods, and lastly the chapter summary.
3.2 Research Design
Research design as a plan for a study, providing the overall framework for collecting data
(Ricchie & Klein 2014). MacMillan and Schumacher (2001) define it as a plan for
selecting subjects, research sites, and data collection procedures to answer the research
questions. They further indicate that the goal of a sound research design is to provide
results that are judged to be credible. According to Saunder, Lewis and Thornhill (2007)
research design is a strategic framework for action that serves as a bridge between
research questions and the execution, or implementation of the research strategy. A
research design is a systematic plan to study a scientific problem. The design of a study
defines the study type research question, hypotheses, independent and dependent
variables, experimental design, data collection methods and a statistical analysis plan.
Research design is the framework that has been created to seek answers to research
questions or objectives (Mugenda & Mugenda, 2003).
This study adopted the use of descriptive research design. Descriptive research refers to
research studies that have as their main objective the accurate portrayal of the
characteristics of persons, situations or groups. Roberts and Burke (1989) define
descriptive research as a non-experimental research design used to observe (and measure)
a variable when little conceptual background has been developed on specific aspects of
the variables under study. This approach is used to describe variables rather than to test a
predicted relationship between variables.
24
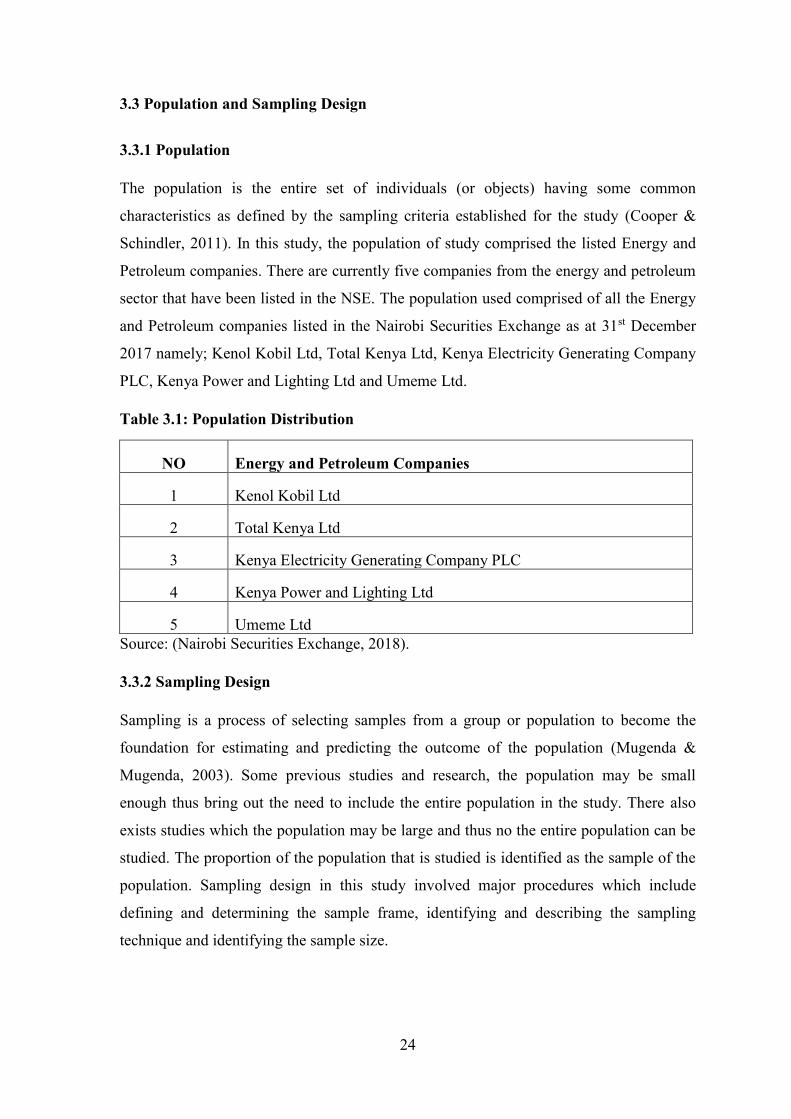
3.3 Population and Sampling Design
3.3.1 Population
The population is the entire set of individuals (or objects) having some common
characteristics as defined by the sampling criteria established for the study (Cooper &
Schindler, 2011). In this study, the population of study comprised the listed Energy and
Petroleum companies. There are currently five companies from the energy and petroleum
sector that have been listed in the NSE. The population used comprised of all the Energy
and Petroleum companies listed in the Nairobi Securities Exchange as at 31st December
2017 namely; Kenol Kobil Ltd, Total Kenya Ltd, Kenya Electricity Generating Company
PLC, Kenya Power and Lighting Ltd and Umeme Ltd.
Table 3.1: Population Distribution
NO Energy and Petroleum Companies
1 Kenol Kobil Ltd
2 Total Kenya Ltd
3 Kenya Electricity Generating Company PLC
4 Kenya Power and Lighting Ltd
5 Umeme Ltd
Source: (Nairobi Securities Exchange, 2018).
3.3.2 Sampling Design
Sampling is a process of selecting samples from a group or population to become the
foundation for estimating and predicting the outcome of the population (Mugenda &
Mugenda, 2003). Some previous studies and research, the population may be small
enough thus bring out the need to include the entire population in the study. There also
exists studies which the population may be large and thus no the entire population can be
studied. The proportion of the population that is studied is identified as the sample of the
population. Sampling design in this study involved major procedures which include
defining and determining the sample frame, identifying and describing the sampling
technique and identifying the sample size.

25
3.3.2.1 Sampling Frame
Sampling frame is defined as the set of source materials from which the sample is
selected (McBurney & Theresa 2010). The definition also encompasses the purpose of
sampling frames, which is to provide a means for choosing the particular members of the
target population. The sampling frame must be representative of the population.
Sampling frame for the study included all the energy and petroleum companies quoted in
the Nairobi Securities Exchange as at 31st December 2017. The Nairobi Securities
Exchange provided the list of energy and petroleum companies.
3.3.2.2 Sampling Technique
Sampling can be used to make inference about a population or to make generalization in
relation to existing theory (Hamed 2016). Etikan, Musa and Alkassim (2016) indicate that
sampling technique is the method or procedure used in selecting elements from the
population. Sampling techniques often depend on research objectives of a research work.
There are two types of sampling techniques that are used in research and studies which
are probability sampling and non-probability sampling. Probability sampling technique
includes sample selection which is based on random methods. The techniques that are
based in this category are random sampling, stratified sampling, systematic sampling and
cluster sampling. Non-probability sampling techniques are not based on random selection.
Some examples are quota sampling, purposive sampling and convenience sampling. The
study adopted the use of census technique. According to Kothari (2011), census is defined
as a study where all members of the entire population take part in the study. Census was
adopted since the sample is small and the results is a representative of the actual
population.
3.3.2.3 Sample Size
A sample size is the sub-unit of the population involved in the research work. The sample
size should be optimum to fulfill the requirements of the efficiency of the study,
reliability and population representation (Cooper & Schindler 2011). The five companies
listed under the Energy and Petroleum Sector of the NSE comprised the sample size of
the study as shown in Table 3.2.
26
Table 3.2: Sample Size Distributions
NO Energy and Petroleum Companies
1 Kenol Kobil Ltd
2 Total Kenya Ltd
3 Kenya Electricity Generating Company PLC
4 Kenya Power and Lighting Ltd
5 Umeme Ltd
Source: (Nairobi Securities Exchange, 2018).
3.4 Data Collection Methods
Data collection methods are defined as the systematic and guided processes used by
researcher to collect or gather data for a study. Data collected can either be primary or
secondary data (Etikan et al., 2016). To gather the necessary data, audited financial
statements in the form of income statements, and statement of financial position for a
period of five years from (2013-2017) was obtained from the sampled firms in the
Nairobi Securities Exchange. This was necessary to obtain an accurate measure of the
effects of working capital management on financial performance of Energy and
Petroleum firms.
The period of five years was chosen to conduct a trend analysis on the audited financial
statements. Data validity and reliability was done by collecting information only from
audited consolidated financial statements to ensure accuracy as a basis for
generalizations. Data was collected for each variable for each year under review, using a
data collection sheet. The specific data that was collected is the net profit, ROA, ROE as
the dependent variables. Data for the analysis of the independent variable were as
follows; accounts receivables, cash conversion cycle and accounts payable.
3.5 Research Procedures
The researcher sought permission from the project supervisor to collect secondary data
after the approval of the data collections checklist. The researcher collected secondary
data from the Nairobi Securities Exchange handbook and company websites of the
companies involved in the study. The researcher collected secondary data for the five

27
companies in the energy and petroleum sector of the Nairobi Securities Exchange over
the five-year period (2013-2017).
3.6 Data Analysis Methods
Data analysis is the process of reviewing, cleaning, converting and displaying data with
the purpose of highlighting and identifying useful information, giving conclusions and
supporting decision making processes. Data analysis assist the researcher in interpreting
the data obtained. After the data was collected, the researcher analyzed the data to
determine its relevance to the study questions and purpose. With the help of Statistical
Packages for Social Sciences version 24, data was coded and analyzed and presented in
the form of tables and graphs. Descriptive statistics used in the study include percentages,
mean and standard deviation. Inferential statistics was used in the study the degree of
relationship between the independent variable and dependent variables. The technique
will include Analysis of Variance (ANOVA) which will test the significance of the
overall model at 95% level of significance. Linear regression model was used to test the
effects of working capital management on the financial performance of the energy and
petroleum firms listed in the Nairobi Securities Exchange. The regression model used was
as follows;
Y=α+β1X1 +β2 X2 +β3 X3 + е
Where:
Y=Dependent variable (Financial Performance, where Y1=Return on Assets, Y2=Net
Profit, and Y3= Return on Equity)
α is a constant,
β1X1 = Accounts Receivable,
β2X2 = Cash Conversion Cycle
β3X3 = Accounts Payable
е = standard error
β1, β2 and β3 = Coefficients of X1, X2 and X3 respectively

28
3.7 Chapter Summary
In this chapter, the researcher has described in detailed the research methodology that the
study adopted. The chapter has clearly explained the research design, the population and
sampling design that the study adopted, the methods of data collection, the research
procedure and how the data was analyzed. The next chapter presents the study findings in
the form of graphs and tables for interpretation.
29
CHAPTER FOUR
4.0 RESULTS AND FINDINGS
4.1 Introduction
This chapter presents the analysis and interpretations of the data collected from the
audited financial reports from the year 2013 to 2017. The audited financial reports were
the statement of financial position and Income statement for the energy and petroleum
companies listed in the Nairobi Securities Exchange. The study begins by giving the
general information concerning the companies in the energy and pe1troleum, followed by
the effect of accounts receivables on financial performance, effect of cash conversion
cycle on financial performance, and how accounts payables affect financial performance
of energy and petroleum companies listed in the NSE. The study also provides the
analysis on correlation and regression analysis on the variables.
4.2 General Information
The purpose of the study was to determine the effect working capital management on
financial performance of energy and petroleum companies listed in the Nairobi Securities
Exchange. The energy and petroleum companies listed include; Kenol Kobil Limited,
Total Kenya Limited, KenGen Limited, Kenya Power and Lighting Company and
Umeme Limited. The researcher used the accounts receivables, cash conversion cycle and
accounts payables as the independent variables while the Net profit, Return on Assets,
and Return on Equity as the dependent variables for the study.
4.2.1 Nature of Business
The Table 4.1 below indicates the companies that are in the energy and petroleum listed
in the Nairobi Securties, they include; Kenol Kobil Limited, Total Kenya Limited,
KenGen Limited, Kenya Power and Lighting Company and Umeme Limited. The
researcher has provided the information regarding the operation of the firms and products
they provide.
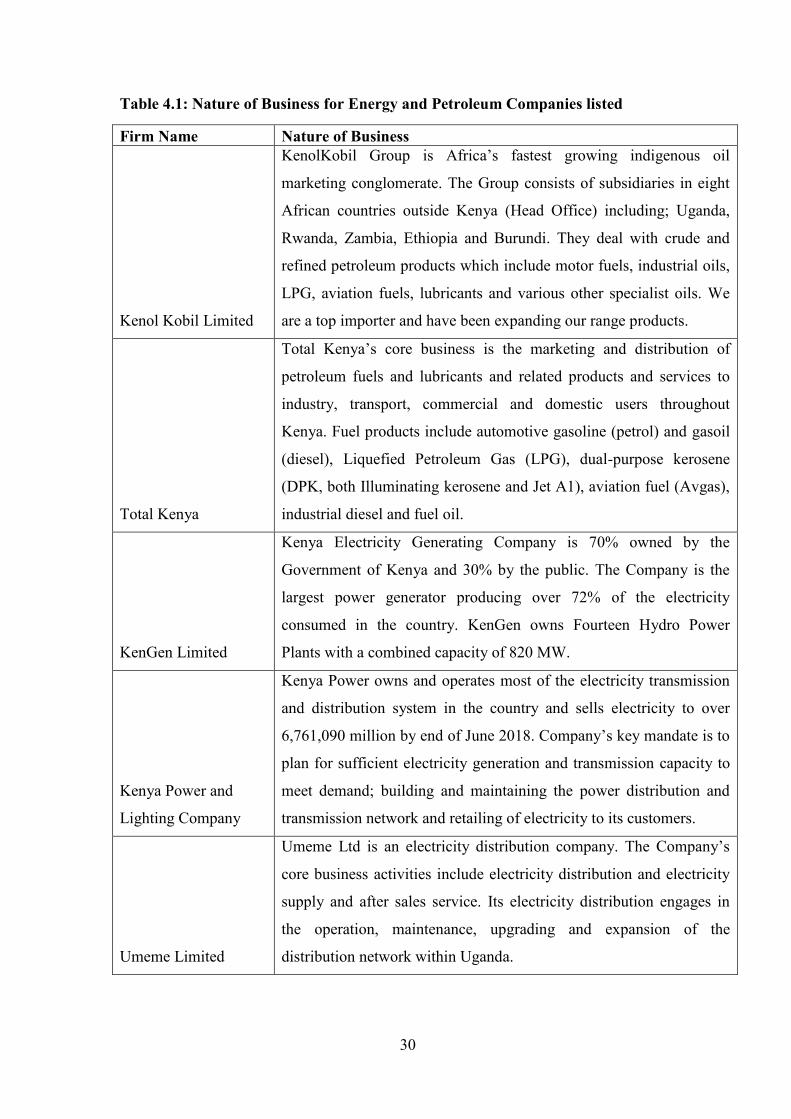
30
Table 4.1: Nature of Business for Energy and Petroleum Companies listed
Firm Name Nature of Business
Kenol Kobil Limited
KenolKobil Group is Africa’s fastest growing indigenous oil
marketing conglomerate. The Group consists of subsidiaries in eight
African countries outside Kenya (Head Office) including; Uganda,
Rwanda, Zambia, Ethiopia and Burundi. They deal with crude and
refined petroleum products which include motor fuels, industrial oils,
LPG, aviation fuels, lubricants and various other specialist oils. We
are a top importer and have been expanding our range products.
Total Kenya
Total Kenya’s core business is the marketing and distribution of
petroleum fuels and lubricants and related products and services to
industry, transport, commercial and domestic users throughout
Kenya. Fuel products include automotive gasoline (petrol) and gasoil
(diesel), Liquefied Petroleum Gas (LPG), dual-purpose kerosene
(DPK, both Illuminating kerosene and Jet A1), aviation fuel (Avgas),
industrial diesel and fuel oil.
KenGen Limited
Kenya Electricity Generating Company is 70% owned by the
Government of Kenya and 30% by the public. The Company is the
largest power generator producing over 72% of the electricity
consumed in the country. KenGen owns Fourteen Hydro Power
Plants with a combined capacity of 820 MW.
Kenya Power and
Lighting Company
Kenya Power owns and operates most of the electricity transmission
and distribution system in the country and sells electricity to over
6,761,090 million by end of June 2018. Company’s key mandate is to
plan for sufficient electricity generation and transmission capacity to
meet demand; building and maintaining the power distribution and
transmission network and retailing of electricity to its customers.
Umeme Limited
Umeme Ltd is an electricity distribution company. The Company’s
core business activities include electricity distribution and electricity
supply and after sales service. Its electricity distribution engages in
the operation, maintenance, upgrading and expansion of the
distribution network within Uganda.
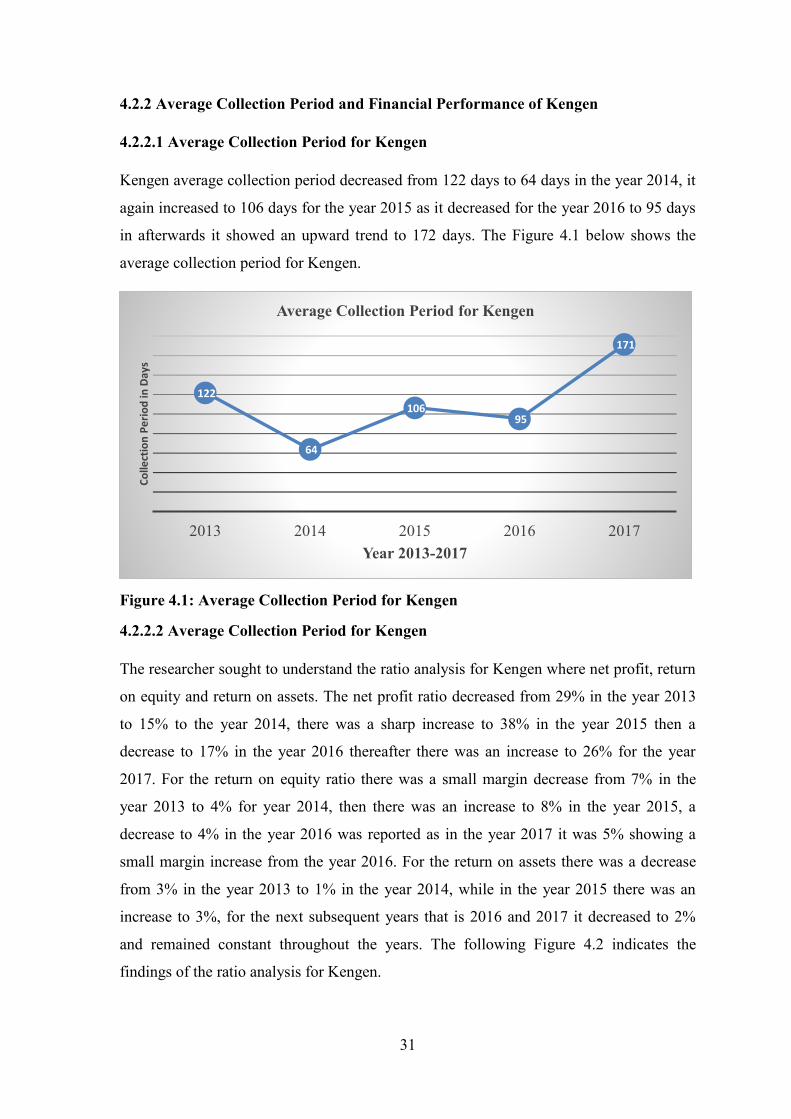
31
4.2.2 Average Collection Period and Financial Performance of Kengen
4.2.2.1 Average Collection Period for Kengen
Kengen average collection period decreased from 122 days to 64 days in the year 2014, it
again increased to 106 days for the year 2015 as it decreased for the year 2016 to 95 days
in afterwards it showed an upward trend to 172 days. The Figure 4.1 below shows the
average collection period for Kengen.
Figure 4.1: Average Collection Period for Kengen
4.2.2.2 Average Collection Period for Kengen
The researcher sought to understand the ratio analysis for Kengen where net profit, return
on equity and return on assets. The net profit ratio decreased from 29% in the year 2013
to 15% to the year 2014, there was a sharp increase to 38% in the year 2015 then a
decrease to 17% in the year 2016 thereafter there was an increase to 26% for the year
2017. For the return on equity ratio there was a small margin decrease from 7% in the
year 2013 to 4% for year 2014, then there was an increase to 8% in the year 2015, a
decrease to 4% in the year 2016 was reported as in the year 2017 it was 5% showing a
small margin increase from the year 2016. For the return on assets there was a decrease
from 3% in the year 2013 to 1% in the year 2014, while in the year 2015 there was an
increase to 3%, for the next subsequent years that is 2016 and 2017 it decreased to 2%
and remained constant throughout the years. The following Figure 4.2 indicates the
findings of the ratio analysis for Kengen.
122
64
106 95
171
2013 2014 2015 2016 2017
Co
llect
ion
Pe
rio
d in
Day
s
Year 2013-2017
Average Collection Period for Kengen

32
Figure 4.2: Kengen Ratio Analysis for Net Profit Ratio, Return on Equity and
Return on Assets
4.2.3 Average Collection Period and Financial Performance of KenolKobil
4.2.3.1 Average Collection Period for KenolKobil
KenolKobil average collection period increased from 36 days to 39 days in the year 2014,
for the year 2015 it decreased to 28 days as it decreased again for the year 2016 to 27
days in afterwards it showed a downward trend to 20 days. The Figure 4.3 below shows
the average collection period for KenolKobil.
Figure 4.3: Average Collection Period for KenolKobil
29%
15%
38%
17%
26%
7%4%
8%4% 5%
3% 1%3% 2% 2%
2013 2014 2015 2016 2017
Pe
rce
nta
ge (
%)
Year 2013-2017
Kengen Ratio Analysis
Net Profit Ratio Return on Equity Return on Assets
36 39
28 27
20
2013 2014 2015 2016 2017
Co
llect
ion
Pe
rio
d in
Day
s
Year 2013-2017
Average Collection Period for KenolKobil
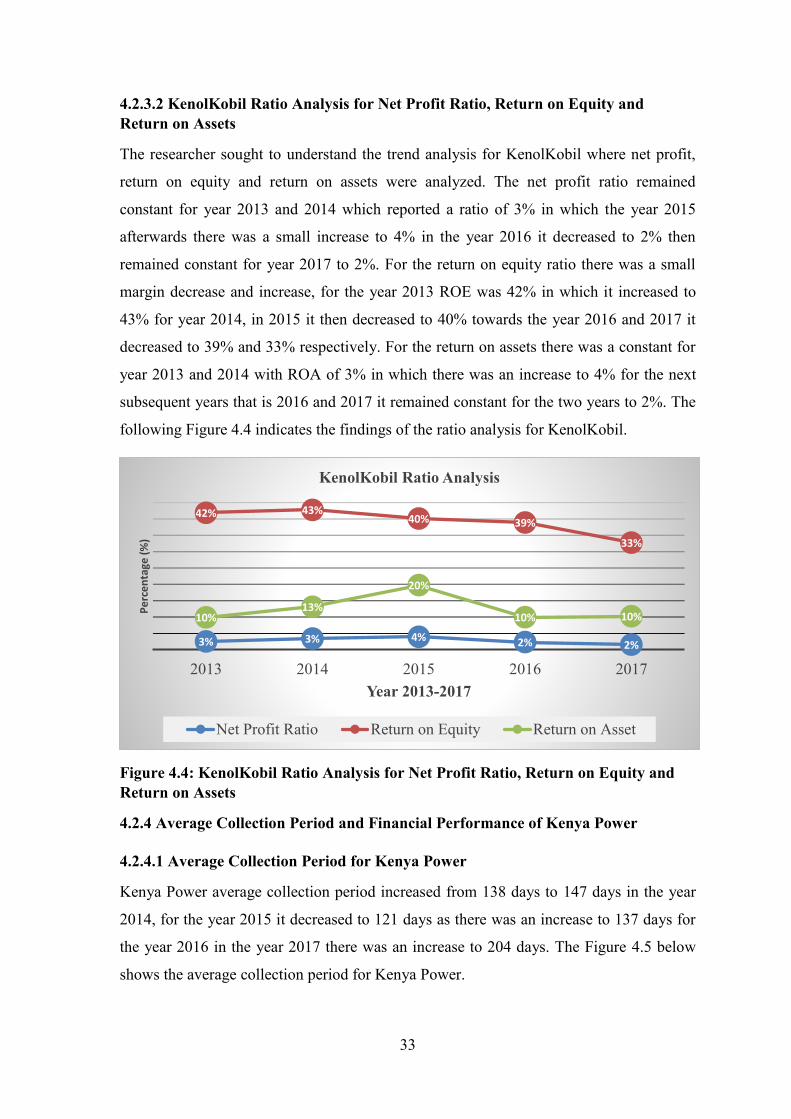
33
4.2.3.2 KenolKobil Ratio Analysis for Net Profit Ratio, Return on Equity and
Return on Assets
The researcher sought to understand the trend analysis for KenolKobil where net profit,
return on equity and return on assets were analyzed. The net profit ratio remained
constant for year 2013 and 2014 which reported a ratio of 3% in which the year 2015
afterwards there was a small increase to 4% in the year 2016 it decreased to 2% then
remained constant for year 2017 to 2%. For the return on equity ratio there was a small
margin decrease and increase, for the year 2013 ROE was 42% in which it increased to
43% for year 2014, in 2015 it then decreased to 40% towards the year 2016 and 2017 it
decreased to 39% and 33% respectively. For the return on assets there was a constant for
year 2013 and 2014 with ROA of 3% in which there was an increase to 4% for the next
subsequent years that is 2016 and 2017 it remained constant for the two years to 2%. The
following Figure 4.4 indicates the findings of the ratio analysis for KenolKobil.
Figure 4.4: KenolKobil Ratio Analysis for Net Profit Ratio, Return on Equity and
Return on Assets
4.2.4 Average Collection Period and Financial Performance of Kenya Power
4.2.4.1 Average Collection Period for Kenya Power
Kenya Power average collection period increased from 138 days to 147 days in the year
2014, for the year 2015 it decreased to 121 days as there was an increase to 137 days for
the year 2016 in the year 2017 there was an increase to 204 days. The Figure 4.5 below
shows the average collection period for Kenya Power.
3% 3% 4% 2% 2%
42% 43%40% 39%
33%
10%13%
20%
10% 10%
2013 2014 2015 2016 2017
Pe
rce
nta
ge (
%)
Year 2013-2017
KenolKobil Ratio Analysis
Net Profit Ratio Return on Equity Return on Asset

34
Figure 4.5: Average Collection Period for Kenya Power
4.2.4.2 Kenya Power Ratio Analysis for Net Profit Ratio, Return on Equity and
Return on Assets
The study sought to understand the ratio analysis for Kenya Power where net profit,
return on equity and return on assets were analyzed. The net profit ratio increased from
7% in the year 2013 to 11% to the year 2014, there was a decrease to 10% in the year
2015 then a decrease to 8% in the year 2016 thereafter there was also a decrease to 7% for
the year 2017. For the return on equity ratio there was an increase from 7% in the year
2013 to 13% for year 2014, then there was a constant of 13% for the year 2015, a
decrease to 11% in the year 2016 was reported as in the year 2017 there was a decrease to
9%. For the return on assets there was an increase from 2% in the year 2013 to 3% in the
year 2014, while in the year 2015 there was a constant to 3%, for the next subsequent
years that is 2016 and 2017 it decreased to 2% and remained constant throughout the two
years. The following Figure 4.6 indicates the findings of the ratio analysis for Kenya
Power.
138 147
121 137
204
2013 2014 2015 2016 2017
Co
llect
ion
Pe
rio
d in
Day
s
Year 2013-2017
Average Collection Period for Kenya Power

35
Figure 4.6: Kenya Power Ratio Analysis for Net Profit Ratio, Return on Equity and
Return on Assets
4.2.5 Average Collection Period and Financial Performance of Total Kenya
4.2.5.1 Average Collection Period for Total Kenya
Total Kenya average collection period increased from 19 days in the year 2013 to 20 days
in the year 2014, for the year 2015 it increased to 29 days as the next year there was
upward trend to 36 days for the year 2016 while in the year 2017 there was decrease to 32
days. The Figure 4.7 below shows the average collection period for Total Kenya.
Figure 4.7: Average Collection Period for Total Kenya
7%
11%
10%
8%7%7%
13% 13%
11%
9%
2%3% 3% 2% 2%
2013 2014 2015 2016 2017
Per
cen
tag
e (%
)
Year 2013-2017
Kenya Power Ratio Analysis
Net Profit Ratio Return on Equity Return on Asset
19 20
29
36
32
2013 2014 2015 2016 2017
Co
llec
tio
n P
erio
d i
n D
ay
s
Year 2013-2017
Average Collection Period for Total Kenya

36
4.2.5.2 Total Kenya Ratio Analysis for Net Profit Ratio, Return on Equity and
Return on Assets
The study sought to understand the ratio analysis for Total Kenya where net profit, return
on equity and return on assets were analyzed. The net profit ratio remained constant for
the year 2013, 2014, and 2015 with a ratio of 1% it then increased to 3% in the year 2016,
there was a decrease to 2% in the year 2017. For the return on equity ratio there was a
constant of 9% for year 2013 and 2014 then a decrease from 9% in the year 2014 to 8%
for year 2015, then there was an increase to 12% for year 2016 and 13% for year 2017.
For the return on assets there was an increase from 3% in the year 2013 to 4% in the year
2014, while in the year 2015 there was a constant of 4%, for the next subsequent years
that is 2016 and 2017 it increased to 6% and 7% respectively for the two years. The
following Figure 4.8 indicates the findings of the ratio analysis for Total Kenya.
Figure 4.8: Total Kenya Ratio Analysis for Net Profit Ratio, Return on Equity and
Return on Assets
4.2.6 Average Collection Period and Financial Performance of Umeme Ltd
4.2.6.1 Average Collection Period for Umeme Ltd
Umeme Ltd average collection period increased from 87 days in the year 2013 to 106
days in the year 2014, for the year 2015 it increased to 108 days as the following next
year there was a decrease to 105 days for the year 2016, while in the year 2017 there was
1% 1% 1%
3% 2%
9% 9%8%
12%13%
3%4% 4%
6%7%
2013 2014 2015 2016 2017
Pe
rce
nta
ge (
%)
Year 2013-2017
Total Kenya Ratio Analysis
Net Profit Ratio Return on Equity Return on Assets

37
also a decrease to 82 days. The Figure 4.9 below shows the average collection period for
Umeme Ltd.
Figure 4.9: Average Collection Period for Umeme Ltd
4.2.6.2 Umeme Ratio Analysis for Net Profit Ratio, Return on Equity and Return on
Assets
The study sought to understand the ratio analysis for Umeme Ltd where net profit, return
on equity and return on assets were analyzed. The net profit ratio decreased from 9% for
year 2013 to 7% in the year 2014, it then decreased to 6% in the year 2015, there was an
increase to 10% in the year 2016 then decreased to 2% for the year 2017. For the return
on equity ratio there was a decrease from 29% in the year 2013 to 22% in the year 2014,
there was also a decrease to 12% for the year 2015, then there was an increase to 25% for
year 2016 and then a decrease to 6% for year 2017. For the return on assets there was a
decrease from 9% in the year 2013 to 6% in the year 2014, while in the year 2015 there
was a decrease to 4%, for the following year that is 2016 which increased to 6% and 2017
it decreased to 2%. The following Figure 4.10 indicates the findings of the ratio analysis
for Umeme Ltd.
87
106 108 105
82
2013 2014 2015 2016 2017
Co
llect
ion
Pe
rio
d in
Day
s
Year 2013-2017
Average Collection Period for Umeme Ltd
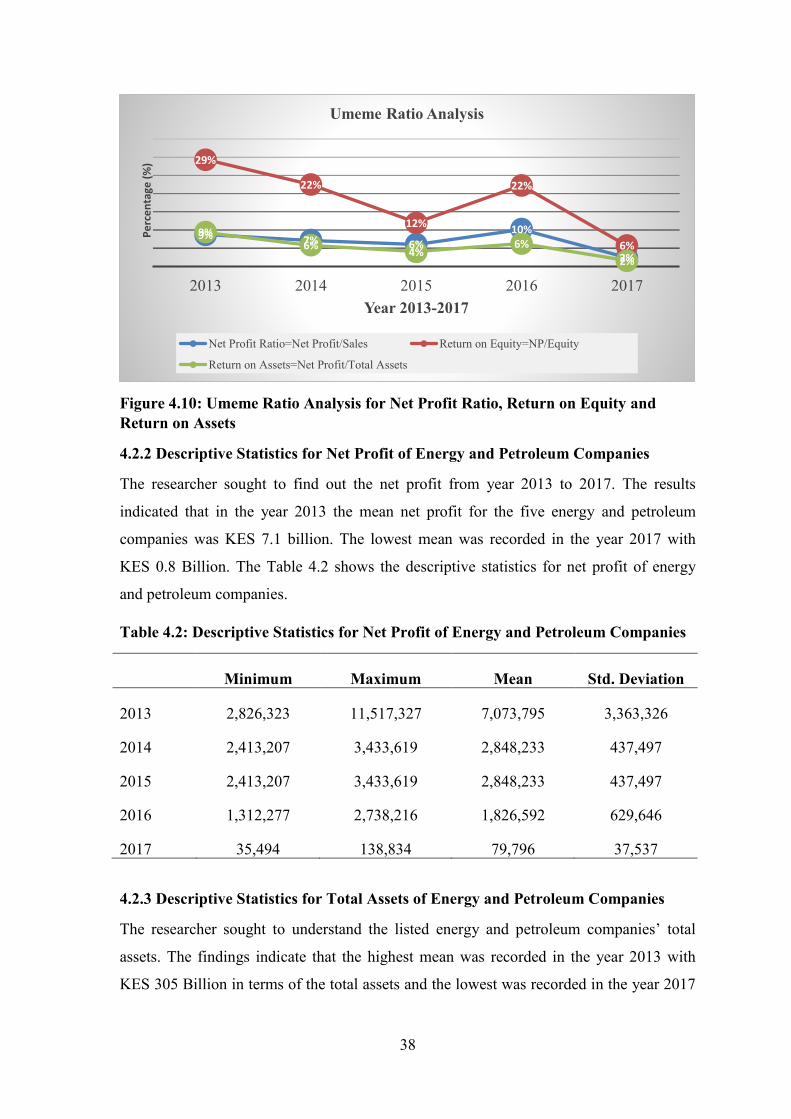
38
Figure 4.10: Umeme Ratio Analysis for Net Profit Ratio, Return on Equity and
Return on Assets
4.2.2 Descriptive Statistics for Net Profit of Energy and Petroleum Companies
The researcher sought to find out the net profit from year 2013 to 2017. The results
indicated that in the year 2013 the mean net profit for the five energy and petroleum
companies was KES 7.1 billion. The lowest mean was recorded in the year 2017 with
KES 0.8 Billion. The Table 4.2 shows the descriptive statistics for net profit of energy
and petroleum companies.
Table 4.2: Descriptive Statistics for Net Profit of Energy and Petroleum Companies
Minimum Maximum Mean Std. Deviation
2013 2,826,323 11,517,327 7,073,795 3,363,326
2014 2,413,207 3,433,619 2,848,233 437,497
2015 2,413,207 3,433,619 2,848,233 437,497
2016 1,312,277 2,738,216 1,826,592 629,646
2017 35,494 138,834 79,796 37,537
4.2.3 Descriptive Statistics for Total Assets of Energy and Petroleum Companies
The researcher sought to understand the listed energy and petroleum companies’ total
assets. The findings indicate that the highest mean was recorded in the year 2013 with
KES 305 Billion in terms of the total assets and the lowest was recorded in the year 2017
9% 7% 6%
10%
2%
29%
22%
12%
22%
6%9%
6%4%
6%
2%
2013 2014 2015 2016 2017
Pe
rce
nta
ge (
%)
Year 2013-2017
Umeme Ratio Analysis
Net Profit Ratio=Net Profit/Sales Return on Equity=NP/Equity
Return on Assets=Net Profit/Total Assets
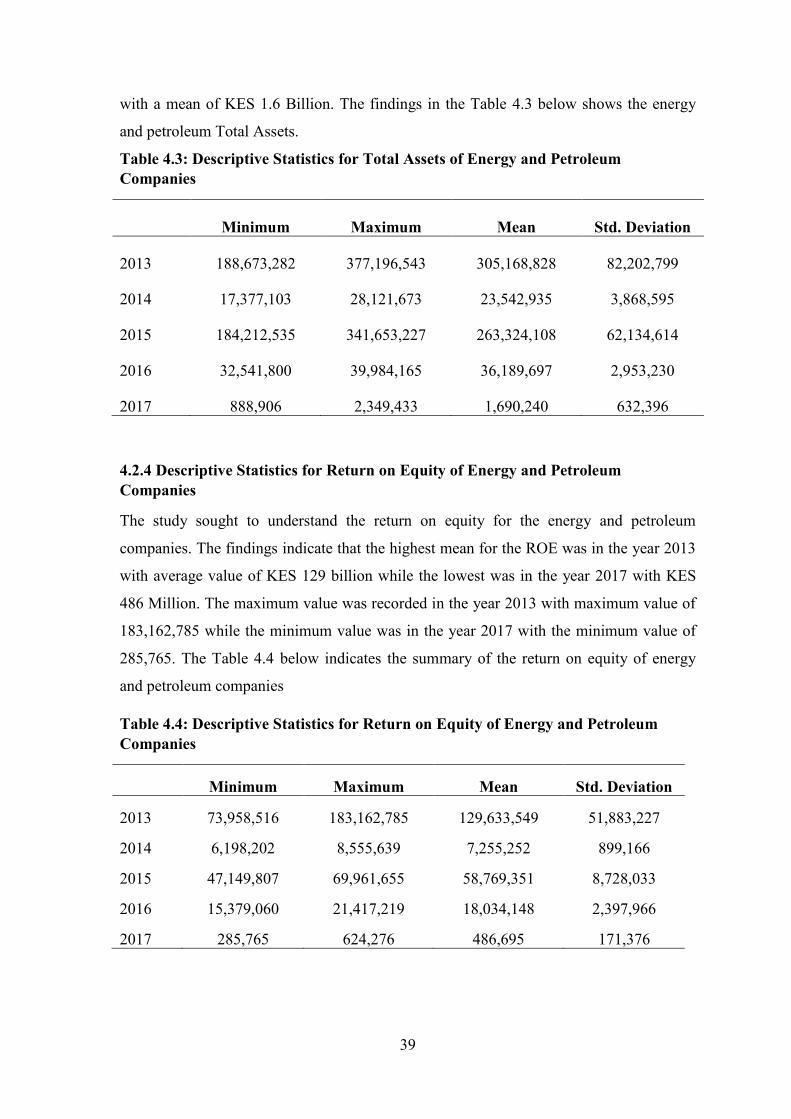
39
with a mean of KES 1.6 Billion. The findings in the Table 4.3 below shows the energy
and petroleum Total Assets.
Table 4.3: Descriptive Statistics for Total Assets of Energy and Petroleum
Companies
Minimum Maximum Mean Std. Deviation
2013 188,673,282 377,196,543 305,168,828 82,202,799
2014 17,377,103 28,121,673 23,542,935 3,868,595
2015 184,212,535 341,653,227 263,324,108 62,134,614
2016 32,541,800 39,984,165 36,189,697 2,953,230
2017 888,906 2,349,433 1,690,240 632,396
4.2.4 Descriptive Statistics for Return on Equity of Energy and Petroleum
Companies
The study sought to understand the return on equity for the energy and petroleum
companies. The findings indicate that the highest mean for the ROE was in the year 2013
with average value of KES 129 billion while the lowest was in the year 2017 with KES
486 Million. The maximum value was recorded in the year 2013 with maximum value of
183,162,785 while the minimum value was in the year 2017 with the minimum value of
285,765. The Table 4.4 below indicates the summary of the return on equity of energy
and petroleum companies
Table 4.4: Descriptive Statistics for Return on Equity of Energy and Petroleum
Companies
Minimum Maximum Mean Std. Deviation
2013 73,958,516 183,162,785 129,633,549 51,883,227
2014 6,198,202 8,555,639 7,255,252 899,166
2015 47,149,807 69,961,655 58,769,351 8,728,033
2016 15,379,060 21,417,219 18,034,148 2,397,966
2017 285,765 624,276 486,695 171,376
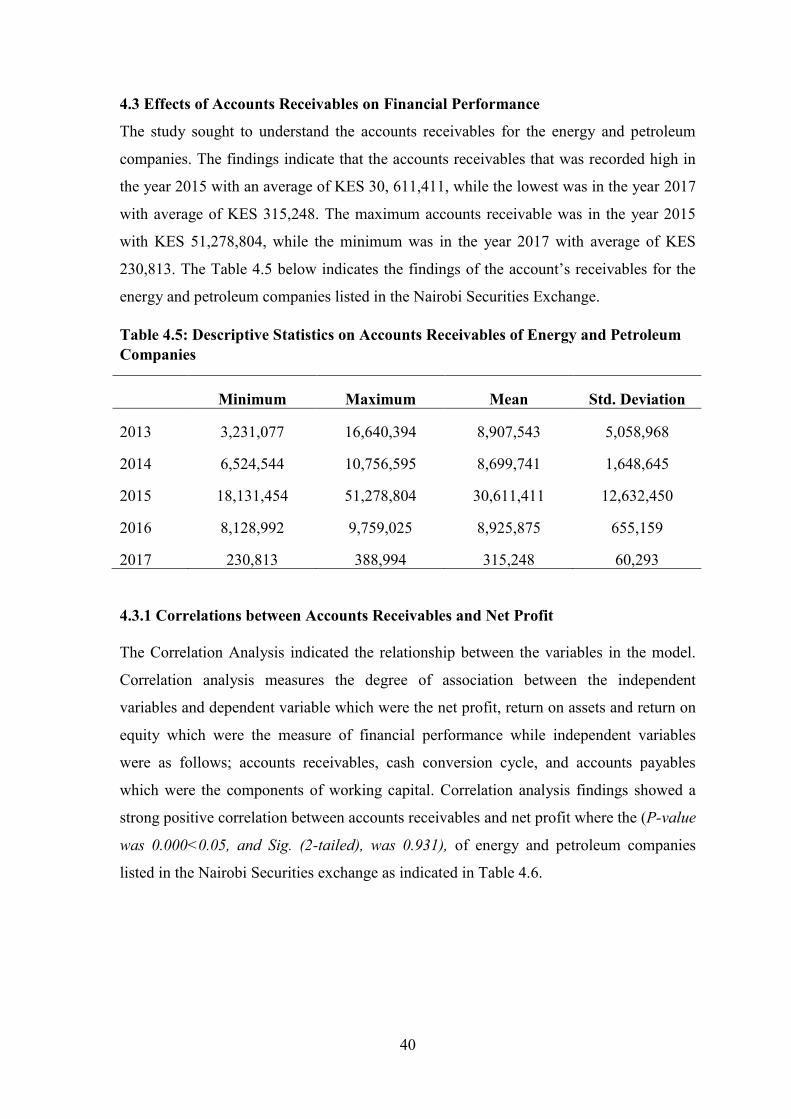
40
4.3 Effects of Accounts Receivables on Financial Performance
The study sought to understand the accounts receivables for the energy and petroleum
companies. The findings indicate that the accounts receivables that was recorded high in
the year 2015 with an average of KES 30, 611,411, while the lowest was in the year 2017
with average of KES 315,248. The maximum accounts receivable was in the year 2015
with KES 51,278,804, while the minimum was in the year 2017 with average of KES
230,813. The Table 4.5 below indicates the findings of the account’s receivables for the
energy and petroleum companies listed in the Nairobi Securities Exchange.
Table 4.5: Descriptive Statistics on Accounts Receivables of Energy and Petroleum
Companies
Minimum Maximum Mean Std. Deviation
2013 3,231,077 16,640,394 8,907,543 5,058,968
2014 6,524,544 10,756,595 8,699,741 1,648,645
2015 18,131,454 51,278,804 30,611,411 12,632,450
2016 8,128,992 9,759,025 8,925,875 655,159
2017 230,813 388,994 315,248 60,293
4.3.1 Correlations between Accounts Receivables and Net Profit
The Correlation Analysis indicated the relationship between the variables in the model.
Correlation analysis measures the degree of association between the independent
variables and dependent variable which were the net profit, return on assets and return on
equity which were the measure of financial performance while independent variables
were as follows; accounts receivables, cash conversion cycle, and accounts payables
which were the components of working capital. Correlation analysis findings showed a
strong positive correlation between accounts receivables and net profit where the (P-value
was 0.000<0.05, and Sig. (2-tailed), was 0.931), of energy and petroleum companies
listed in the Nairobi Securities exchange as indicated in Table 4.6.
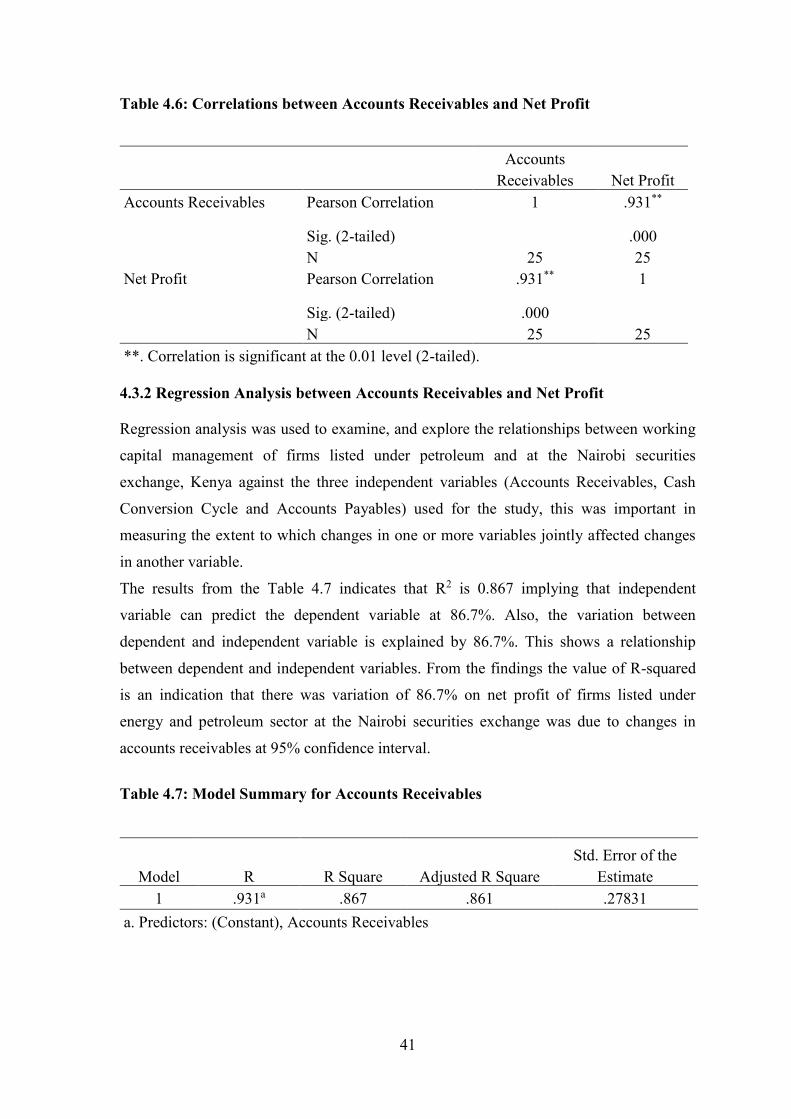
41
Table 4.6: Correlations between Accounts Receivables and Net Profit
Accounts
Receivables Net Profit
Accounts Receivables Pearson Correlation 1 .931**
Sig. (2-tailed) .000
N 25 25
Net Profit Pearson Correlation .931** 1
Sig. (2-tailed) .000
N 25 25
**. Correlation is significant at the 0.01 level (2-tailed).
4.3.2 Regression Analysis between Accounts Receivables and Net Profit
Regression analysis was used to examine, and explore the relationships between working
capital management of firms listed under petroleum and at the Nairobi securities
exchange, Kenya against the three independent variables (Accounts Receivables, Cash
Conversion Cycle and Accounts Payables) used for the study, this was important in
measuring the extent to which changes in one or more variables jointly affected changes
in another variable.
The results from the Table 4.7 indicates that R2 is 0.867 implying that independent
variable can predict the dependent variable at 86.7%. Also, the variation between
dependent and independent variable is explained by 86.7%. This shows a relationship
between dependent and independent variables. From the findings the value of R-squared
is an indication that there was variation of 86.7% on net profit of firms listed under
energy and petroleum sector at the Nairobi securities exchange was due to changes in
accounts receivables at 95% confidence interval.
Table 4.7: Model Summary for Accounts Receivables
Model R R Square Adjusted R Square
Std. Error of the
Estimate
1 .931a .867 .861 .27831
a. Predictors: (Constant), Accounts Receivables
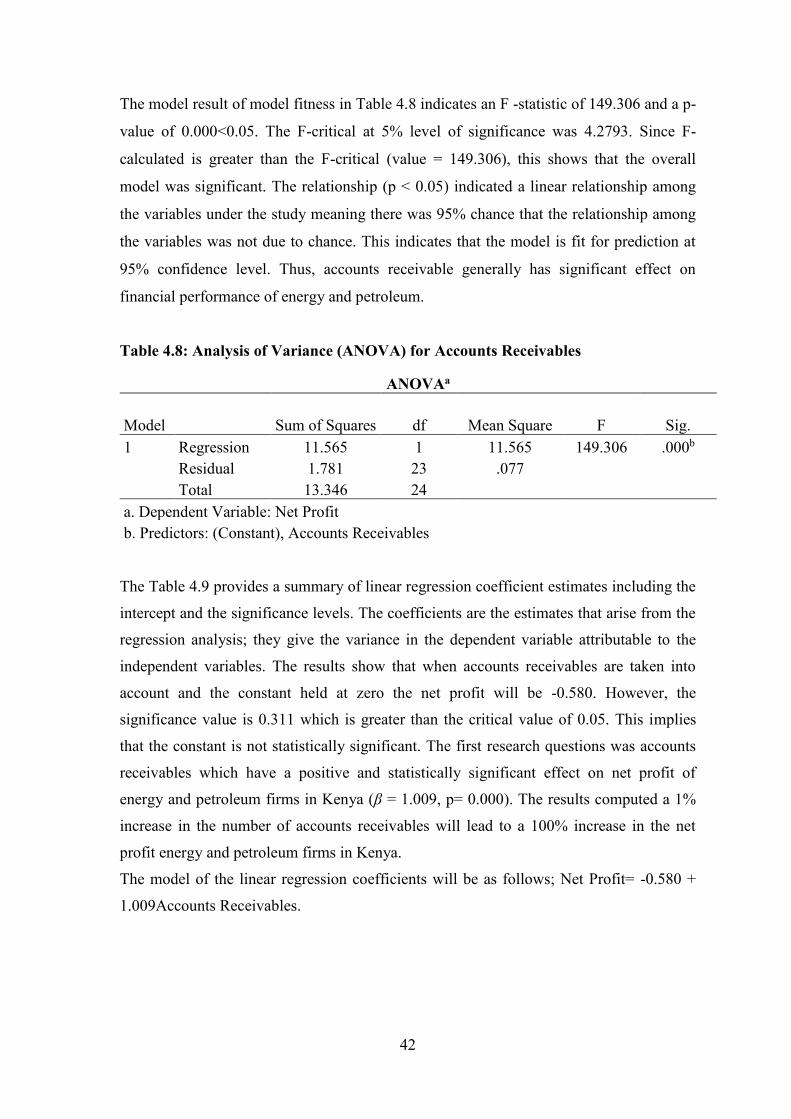
42
The model result of model fitness in Table 4.8 indicates an F -statistic of 149.306 and a p-
value of 0.000<0.05. The F-critical at 5% level of significance was 4.2793. Since F-
calculated is greater than the F-critical (value = 149.306), this shows that the overall
model was significant. The relationship (p < 0.05) indicated a linear relationship among
the variables under the study meaning there was 95% chance that the relationship among
the variables was not due to chance. This indicates that the model is fit for prediction at
95% confidence level. Thus, accounts receivable generally has significant effect on
financial performance of energy and petroleum.
Table 4.8: Analysis of Variance (ANOVA) for Accounts Receivables
ANOVAa
Model Sum of Squares df Mean Square F Sig.
1 Regression 11.565 1 11.565 149.306 .000b
Residual 1.781 23 .077
Total 13.346 24
a. Dependent Variable: Net Profit
b. Predictors: (Constant), Accounts Receivables
The Table 4.9 provides a summary of linear regression coefficient estimates including the
intercept and the significance levels. The coefficients are the estimates that arise from the
regression analysis; they give the variance in the dependent variable attributable to the
independent variables. The results show that when accounts receivables are taken into
account and the constant held at zero the net profit will be -0.580. However, the
significance value is 0.311 which is greater than the critical value of 0.05. This implies
that the constant is not statistically significant. The first research questions was accounts
receivables which have a positive and statistically significant effect on net profit of
energy and petroleum firms in Kenya (β = 1.009, p= 0.000). The results computed a 1%
increase in the number of accounts receivables will lead to a 100% increase in the net
profit energy and petroleum firms in Kenya.
The model of the linear regression coefficients will be as follows; Net Profit= -0.580 +
1.009Accounts Receivables.

43
Table 4.9: Coefficients Analysis for Accounts Receivables
Coefficientsa
Model
Unstandardized
Coefficients
Standardized
Coefficients
t Sig. B Std. Error Beta
1 (Constant) -.580 .560 -1.036 .311
Accounts
Receivables
1.009 .083 .931 12.219 .000
a. Dependent Variable: Net Profit
4.4 Effects of Cash Conversion Cycle on Financial Performance
The study sought to understand the cash conversion cycle for the energy and petroleum
companies listed in the Nairobi Securities Exchange. The Table 4.10 provides the
findings which indicated that the highest mean value for the cash conversion cycle was in
the year 2018 with increased number of days as 48 while in the lowest was in the year
2017 in which it decreased with 29 days. The maximum cash conversion days was
reported in the 2015 with increased value of 103 days while the minimum value was in
the year 2013 and 2014.
Table 4.10: Cash Conversion Cycle and Financial Performance
Minimum Maximum Mean Std. Deviation
2013 (77) 77 (12) 63
2014 (77) 77 (12) 63
2015 (9) 103 48 47
2016 24 56 38 12
2017 (48) (11) (29) 13
4.4.1 Correlations between Cash Conversion Cycle and Return on Assets
The Table 4.11 below shows the correlation between cash conversion cycle and return on
assets. The results of the correlation analysis showed a moderate negatively correlation
between cash conversion cycle and return on assets where the (P-value was 0.003<0.05,
and Sig. (2-tailed), was -0.566), of energy and petroleum companies listed in the Nairobi
Securities exchange.

44
Table 4.11: Correlations between Cash Conversion Cycle and Return on Assets
Cash Conversion
Cycle Return on Assets
Cash Conversion Cycle Pearson Correlation 1 -.566**
Sig. (2-tailed) .003
N 25 25
Return on Assets Pearson Correlation -.566** 1
Sig. (2-tailed) .003
N 25 25
**. Correlation is significant at the 0.01 level (2-tailed).
4.4.2 Regression Analysis between Cash Conversion Cycle and Return on Assets
The findings in the Table 4.12 indicates that R2 is 0.32 implying that independent variable
can predict the dependent variable at 32.0%. Also, the variation between dependent and
independent variable is explained by 32.0%. This shows a relationship between
dependent and independent variables. From the findings the value of R-squared is an
indication that there was variation of 32.0% on return on assets was due to changes in
cash conversion cycle at 95% confidence interval.
Table 4.12: Model Summary for Cash Conversion Cycle
Model Summary
Model R R Square Adjusted R Square
Std. Error of the
Estimate
1 .566a .320 .291 .63851
a. Predictors: (Constant), Cash Conversion Cycle
The Table 4.13 below shows the model result of model fitness which indicates an F -
statistic of 10.833 and a p-value of 0.003<0.05. The F-critical at 5% level of significance
was 4.2793 (the critical value is obtained from the F distribution table). Since F-
calculated is greater than the F-critical (value = 10.833), this shows that the overall model
was significant. This indicates that the model is fit for prediction at 95% confidence level.
Cash conversion cycle generally has significant effect on return on assets as a measure of
financial performance of energy and petroleum companies.

45
Table 4.13: Analysis of Variance (ANOVA) for Cash Conversion Cycle
ANOVAa
Model
Sum of
Squares df Mean Square F Sig.
1 Regression 4.416 1 4.416 10.833 .003b
Residual 9.377 23 .408
Total 13.793 24
a. Dependent Variable: Return on Assets
b. Predictors: (Constant), Cash Conversion Cycle
The results in the Table 4.14 show that when cash conversion cycle is taken into account
and the constant held at zero the net profit will be 5.653. However, the significance value
is 0.000 which is less than the critical value of 0.05. This implies that the constant is
statistically significant. The second research question was the effect of cash conversion
cycle which have a positive and statistically significant effect on return on assets of
energy and petroleum firms in Kenya (β = 0.566, p= 0.000). The results computed
indicates a 1% increase in the number of cash conversion cycle will lead to a 56.6%
increase in the return on assets of energy and petroleum firms in Kenya. The model of the
linear regression coefficients will be as follows; Return on Assets= 5.653 + 0.561Cash
Conversion Cycle
Table 4.14: Coefficients Analysis for Cash Conversion Cycle
Coefficientsa
Model
Unstandardized
Coefficients
Standardized
Coefficients
t Sig. B Std. Error Beta
1 (Constant) 5.653 .220 25.720 .000
Cash Conversion
Cycle
.561 .170 .566 3.291 .003
a. Dependent Variable: Return on Assets
4.5 Effects of Accounts Payables on Financial Performance
The researcher sought to understand the accounts payables for the energy and petroleum
companies. The results findings indicated that the highest mean was in the year 2015 with
an average of KES 32,942,826 while the lowest mean was KES 319,858 for the year
2017. The maximum amount of money that was paid was in the year 2015 with a value of
53,974,414 while the lowest value was KES 241, 952 which was in the year 2017. The

46
Table 4.15 below indicates the findings of the account’s payables for the energy and
petroleum companies listed in the Nairobi securities exchange.
Table 4.15: Descriptive Statistics on Accounts Receivables of Energy and Petroleum
Companies
Minimum Maximum Mean Std. Deviation
2013 4,943,371 7,922,747 6,559,696 1,080,800
2014 3,695,586 6,393,652 5,280,227 1,001,156
2015 22,464,988 53,974,414 32,942,826 12,659,324
2016 7,803,954 9,418,304 8,577,338 778,680
2017 241,952 401,266 319,585 59,686
4.5.1 Correlations between Accounts Payables and Return on Equity
The Table 4.16 below shows the correlation between accounts payables and return on
equity. The results of the correlation analysis showed a strong positive correlation
between accounts payables and return on equity where the (P-value was 0.000<0.05, and
Sig. (2-tailed), was 0.882), of energy and petroleum companies listed in the Nairobi
Securities exchange.
Table 4.16: Correlations between Accounts Payables and Return on Equity
Accounts
Payables Return on Equity
Accounts Payables Pearson Correlation 1 .882**
Sig. (2-tailed) .000
N 25 25
Return on Equity Pearson Correlation .882** 1
Sig. (2-tailed) .000
N 25 25
**. Correlation is significant at the 0.01 level (2-tailed).
4.5.2 Regression Analysis between Accounts Payables and Return on Equity
The results in the Table 4.17 below indicates that R2 is 0.779 implying that independent
variable can predict the dependent variable at 77.9%. Also, the variation between

47
dependent and independent variable is explained by 77.9%. This shows a relationship
between dependent and independent variables. From the findings the value of R-squared
is an indication that there was variation of 77.9% on return on equity was due to changes
in accounts payables at 95% confidence interval.
Table 4.17: Model Summary for Accounts Payables
Model Summary
Model R R Square Adjusted R Square
Std. Error of the
Estimate
1 .882a .779 .769 .36439
a. Predictors: (Constant), Accounts Payables
The analysis of variance in the Table 4.18 shows the model result of model fitness which
indicates an F -statistic of 80.883 and a p-value of 0.000<0.05. The F-critical at 5% level
of significance was 4.2793. Since F-calculated is greater than the F-critical (value =
80.883), this shows that the overall model was statistically significant. This indicates that
the model is fit for prediction at 95% confidence level. Accounts payables generally has
significant effect on return on equity which is a measure of financial performance of
energy and petroleum companies.
Table 4.18: Analysis of Variance (ANOVA) for Accounts Payables
ANOVAa
Model
Sum of
Squares df Mean Square F Sig.
1 Regression 10.739 1 10.739 80.883 .000b
Residual 3.054 23 .133
Total 13.793 24
a. Dependent Variable: Return on Equity
b. Predictors: (Constant), Accounts Payables
The results in the Table 4.19 shows that when accounts payable is taken into account and
the constant held at zero the return on equity will be 0.402. However, the significance
value is 0.004 which is less than the critical value of 0.05. This implies that the constant is
statistically significant. The third research question was on the effect of accounts payables
which have a positive and statistically significant effect on return on equity of energy and

48
petroleum firms in Kenya (β = 0.882, p= 0.000). The results computed indicates a 1%
increase in the number of accounts payable will lead to 88.2% increase in the return on
equity of energy and petroleum firms in Kenya. The model of the linear regression
coefficients will be as follows; Return on Equity= 0.402 + 0.992Cash Conversion Cycle
Table 4.19: Coefficients Analysis for Accounts Payables
Coefficientsa
Model
Unstandardized
Coefficients
Standardized
Coefficients
t Sig. B Std. Error Beta
1 (Constant) .402 .742 .541 .004
Accounts
Payables
.993 .110 .882 8.994 .000
a. Dependent Variable: Return on Equity
4.6 Chapter Summary
The chapter presented the results and findings of the study on the effect of working
capital on financial performance. The findings indicated that both accounts receivables
and accounts payables have a statistically significant relationship with net profit and
return on equity in which the relationship was positive, while cash conversion had a
negative statistically significant relationship with return on assets which was a measure of
financial performance. The next chapter presents the discussion, conclusions and
recommendations of the study on the effect of working capital management on financial
performance of energy and petroleum companies listed on the Nairobi Securities
exchange.
49
CHAPTER FIVE
5.0 DISCUSSION, CONCLUSIONS, AND RECOMMENDATIONS
5.1 Introduction
The chapter provides the summary, the discussions in relation on the literature review,
conclusions and recommendations of the study based on the purpose of the study. The
summary of the study is based on the quantitative findings per research question.
Conclusions is based on the findings on the effects of working capital management on
financial performance of firms listed under energy and petroleum in Nairobi securities
exchange.
5.2 Summary of the Study
The purpose of the study was to determine the effect working capital management on
financial performance of energy and petroleum companies listed in the Nairobi Securities
Exchange. The study was guided by the following research questions; What is the effect
of accounts receivables on financial performance of energy and petroleum companies
listed in the NSE? What is the effect of cash conversion cycle on financial performance of
energy and petroleum companies listed in the NSE? and how do accounts payables affect
financial performance of energy and petroleum companies listed in the NSE?
The study adopted the use of descriptive. Descriptive was used because the study is a
non- experimental research design used to measure a variable when little conceptual
background has been developed on specific aspects of the variables under study. The
population used comprised of all the Energy and Petroleum companies listed in the
Nairobi Securities Exchange as at 31st December 2017 namely; Kenol Kobil Ltd, Total
Kenya Ltd, Kenya Electricity Generating Company PLC, Kenya Power and Lighting Ltd
and Umeme Ltd. Sampling frame for the study included all the energy and petroleum
companies quoted in the Nairobi Securities Exchange as at 31st December 2017. The
study adopted the use of census technique where all members of the entire population
were sampled.
This study collected secondary data in which quantitative data was obtained for the five
companies in the energy and petroleum sector of the Nairobi Securities Exchange. The
data was collected from the audited financial statements obtained from the company
websites, the Nairobi Securities Exchange for the year 2013 to 2017. With the help of

50
Statistical Packages for Social Sciences version 24, data was coded and analyzed and
presented in the form of tables and graphs. The study used descriptive statistics which
included the percentages, mean and standard deviation. Inferential statistics was used in
the study to establish the degree of relationship between the independent variables and
dependent variables. Correlation and Linear regression model were used to test the effects
of working capital management on the financial performance of the energy and petroleum
firms listed in the Nairobi Securities Exchange.
The findings on the first research question indicated that there was a strong positive
correlation between accounts receivables and net profit where the (P-value was
0.000<0.05, and Sig. (2-tailed), was 0.931) for the energy and petroleum companies listed
in the Nairobi Securities exchange. From the findings the study established the extent in
which the variations of accounts receivables on the net profit in which the value of R-
squared is indicated that there was variation of 86.7% on net profit of firms listed under
energy and petroleum sector at the Nairobi securities exchange was due to changes in
accounts receivables at 95% confidence interval.
The results of the correlation analysis on the second research question indicated that there
was moderate negatively relationship between cash conversion cycle and return on assets
where the (P-value was 0.003<0.05, and Sig. (2-tailed), was -0.566) for the energy and
petroleum companies listed in the Nairobi Securities exchange. The study established the
extent in which the variations of cash conversion cycle on return on assets in which the
value of R-squared indicated that there was variation of 32.0% on return on assets was
due to changes in cash conversion cycle at 95% confidence interval.
The findings on the third research question indicated a strong positive correlation between
accounts payables and return on equity where the (P-value was 0.000<0.05, and Sig. (2-
tailed), was 0.882) for the energy and petroleum companies listed in the Nairobi
Securities exchange. The study established the extent in which the variations of accounts
payables on return on equity in which the value of R-squared indicated the variation of
77.9% on return on equity was due to changes in cash accounts payables at 95%
confidence interval. From the findings their positive effect between accounts receivables
and accounts payables with net profit and return on equity while there was negative effect
between cash conversion cycle and return on assts.
51
5.3 Discussion
5.3.1 Effects of Account Receivables on Financial Performance
The findings of the first research question indicated that there was a strong positive
correlation between accounts receivables and net profit of energy and petroleum
companies listed in the Nairobi Securities exchange. The finding is in agreement with that
of Divya, Simran and Vartika (2017) who determined the effects of accounts receivables
management on the profitability of the commercial vehicle industry in India. The findings
indicated a significant positive relationship between debtor’s turnover ratio and
profitability of the firm. This implies that receivables management should be a key focus
point for improving profitability in the commercial vehicle industry. Another study that
supports the findings is that of Ksenjia (2015) who conducted a study to determine the
effects of accounts receivable management on profitability of firms during the financial
crisis in Serbia. The study showed that between accounts receivables and two dependent
variables on profitability, return on total asset and operating profit margin, there was a
positive but no significant relation. The study concluded that the impact of receivables on
firm’s profitability changes in times of crisis.
The findings of the correlation is in agreement with that of Osman and Ayuma (2018)
who conducted a study to determine the impact of accounts receivable management on
the financial performance of Small and Medium Firms in Mogadishu-Somalia. Inferential
statistics such as Pearson correlation coefficient and coefficient correlation were used to
analyze quantitative data and descriptive statistics was employed for variables of the
study. The study concluded cash flow management and other independent variables (debt
management, credit policy management and inventory management) have positive
significant effect on financial performance at 5% level of significance. Ahmet (2012),
who noted that efficient accounts receivable management affords a firm improve on its
profitability by reducing the transaction costs of raising funds in case of liquidity crisis.
Munene and Tibbs (2018) conducted a study that is in agreement and which aimed at
establishing the relationship between accounts receivable management and financial
performance of Embu Water and Sanitation Company Limited. Average collection period
and current ratio was found to be significant positive association with return on equities,
indicating that if time period of debtor’s payment is increased then overall financial
performance increases.
52
The findings is in disagreement with the study conducted by Abdullahi, Rahima and
Abass (2016) who determined the effects of receivables and inventory management on
the performance of SMEs in Malaysia. The result indicated that days account receivable
and inventory turnover in days are negatively related to SME profitability substitutes
which include return on assets, return on equity and net operating profit. The result
implies that profitability of SME manufacturing depends upon effective of working
capital components management. Another study that disagrees is that of Aondana, Saka
and Ipevnor (2017) who examined the relationship between working capital management
and the financial performance of brewery firms quoted on the Nigerian Stock Exchange.
The findings of the study revealed a significant negative impact of average period of debt
settlement and a statistically significant relationship between average collection period
and financial performance.
The findings of the regression established the extent in which the variations of accounts
receivables on the net profit in which the value of R-squared is indicated that there was
variation of 86.7% on net profit of firms listed under energy and petroleum sector at the
Nairobi securities exchange was due to changes in accounts receivables. The finding is
supported by a study conducted by Kilonzo, Memba and Njeru (2016) who conducted a
study to determine the effects of accounts receivable on the financial performance of
firms funded by government venture capital in Kenya. Analysis for variance (ANOVA)
and regression analysis were used to test the hypothesis. The results showed there is a
positive relationship between accounts receivables and financial performance of firms
funded by government venture capital in Kenya. Accounts receivable explained 25.7% of
the financial performance of firms funded by government venture capital in Kenya while
the variation of 74.3% is explained by other factors.
5.3.2 Effects of Cash Conversion Cycle on Financial Performance
The results of the correlation analysis indicated that there was moderate negatively
relationship between cash conversion cycle and return on assets of energy and petroleum
companies listed in the Nairobi Securities exchange. The findings is supported by the
findings of Muhammad, Abdul and Zahid (2014) who conducted a study to determine the
effects of cash conversion cycle on the performance of the cement industry in Pakistan.
The correlation and regression analysis are used to examine the relationship between cash
conversion cycle and firm’s performance i.e. return on assets. The findings of the study
53
showed negative relationship between firm’s cash conversion cycle and profitability.
Another study that is in agreement is that of Majeed, Aziz, Saleem and Makki (2013) who
conducted a study to determine the relationship between cash conversion and profitability
of firms. Correlation and regression analyses were used to examine the relationship of
Cash Conversion Cycle with performance of the firms using profitability measures such
as return on assets, return on equity and operating profit. The study examined the impact
of different variables of cash conversion cycle on firm’s performance. Similar to the
findings by Muhammad et al., (2014), the study found that the average collection period
of accounts receivables, inventory conversion period and cash conversion cycle have
negative relationship with firm’s performance.
Another study that agrees with the findings is that of Nimal and Anandasayanan (2015)
who conducted a study to determine the impact of cash conversion cycle on the
profitability of listed hotels and travels companies in Sri Lanka. Correlation and
regression analyses were used to examine the relationship of CCC with performance of
the firms with profitability measures of return on assets, return on equity and net profit
margin. The study found that the cash conversion cycle (CCC) has significantly negative
association with firm’s performance. Another study that supports the findings is that of
Panigrahi (2013) who determined the relationship between cash conversion cycle and the
profitability of cement manufacturing companies in India. Firm size and debt ratio are
taken as control variables. Results showed that the selected companies had low average
return on asset and return on equity with significantly negative cash conversion cycle.
Regression results after adjusting for heteroskedasticity of data to minimize the effects of
outliers showed that cash conversion cycle has a significant positive association with both
return on assets and equity indicating that it is not necessary that always the lesser the
cash conversion cycle the greater would be the profitability measured through return on
assets and equity. Similarly, to the findings, a study by Chuke, Agbo and Christian (2018)
conducted a study to determine the effect of cash conversion cycle on the financial
performance of public listed insurance companies. Return on assets was used as the
dependent variable. The results indicated that CCC had negative and significant effect on
profitability. Based on the findings, the study recommended that insurance companies
should endeavor to reduce their number of days in CCC always in order to enhance their
profitability.
54
The findings of the regression results established the extent in which the variations of
cash conversion cycle on the net profit in which the value of R-squared indicated that
there was variation of 32.0% on return on assets was due to changes in cash conversion
cycle. Similarly, to a study conducted by Murtala and Sani (2016), aimed to determine the
impact of conversion cycle on the profitability of listed telecommunication companies in
Nigeria. The R2 value means that 26% proportion of variation in the ROA was explained
by the independent variables. The findings confirmed that cash conversion cycle is a good
in influencing firm performance of the firms in ICT sector in the Nigeria. The study also
concluded that decrease in one day for conversion of inventory to sales can lead to
increase in return on assets. Another study that support the findings is that of Muturi
(2015) established the effects of cash conversion cycle on profitability of tea factories in
Meru County. The correlation and regression analyses were used to analyze and describe
the nature of the relationship between CCC and the firm’s profitability. This study found
out that the CCC significantly negatively affects firm’s profitability. The study thus
recommended that there is need therefore for the finance managers to shorten the net cash
conversion cycle to improve profitability.
5.3.3 Effects of Accounts Payable on Financial Performance
The findings indicated a strong positive correlation between accounts payables and return
on equity of energy and petroleum companies listed in the Nairobi Securities exchange.
The result is supported by the study conducted by Doan, Bui and Hoang (2016) on the
impact of working capital on financial performance of the small and medium-sized
enterprises in Vietnam. In line with accounts payable, the accounts payable period and
inventory conversion period have a direct relationship with corporate financial
performance. In addition, the results of the study also found that the growth rate, size, and
age of enterprises also affect financial performance directly. The findings is also
supported by Moodley, Ward and Muller (2017) who conducted a study to determine the
relationship between accounts payables and financial performance/ return on investors.
The study applied a buy-and-hold portfolio methodology to an extensive database of
Johannesburg Stock Exchange over the period 1986 to 2014. The study findings indicate
that companies in industries that have a significant investment in payables, there is a
significant positive association between changes in payable days return to investors and
financial performance.
55
The findings of the correlation is in disagreement with the study by Duru and Okpe
(2015) who examined the effect of accounts payable management on corporate
profitability of Brewery Manufacturing Companies in Nigeria. The variables include,
accounts payable, debt ratio and sales growth rate. Secondary sources of data were used
for the period 2000-2011. The results show that accounts payable had negative but non-
significant relationship with profitability ratio of the companies under Brewery
manufacturing companies in Nigeria. Debt ratio had positive and significant relationship,
while sales growth rate was negative and significant with the profitability ratio of
Brewery companies in Nigeria. Another study that is in disagreement is that of Adolphus
(2014) who conducted a research to analyze the relationship between accounts payable
management policy and corporate profitability in Nigerian quoted companies based on
the data of 107 quoted companies spread across 23 sectors for the period 2006-2013. The
study found that all the sectors adopted an aggressive accounts payable management
strategy by relying heavily on current liabilities for financing their working capital needs.
The findings also indicated the adoption of this strategy produced negative profitability in
most of the sectors.
The results of the regression revealed that the variations of accounts payables on the net
profit in which the value of R-squared indicated the variation of 77.9% on return on
equity was due to changes in cash accounts payables was strongly positive. The findings
is supported by the study by Achode and Malingu (2016) who conducted a study to
determine the effects of accounts payable as a source of financing on the performance of
listed manufacturing firms at the Nairobi Securities Exchange. A multiple regression
model was used to test the relationship between the Accounts payable and firm
performance. The results from this research suggested that in most of the manufacturing
firms listed at the NSE, there was a direct positive relationship between Accounts Payable
and the firm performance.
The finding is supported by the study conducted by Kapkiyai and Mugo (2015) who
established the relationship between accounts payable and SME financial performance for
a sample of 50 audited Kenyan SMEs. Analysis was conducted using both inferential and
descriptive statistics specifically mean and standard deviation. Inferential statistics where
Pearson correlation coefficient to determine the degree of relationship while Multiple
regression model was used to test the hypotheses. Findings indicated that accounts
56
payable positively affected liquidity, profit margin and return on assets. Another study
that supports the findings is that of conducted by Kung’u (2015) who established the
effects of working capital management on the profitability of manufacturing firms in
Kenya. The results of the study showed that there was positive linear relationship between
accounts payable and the profitability of manufacturing firms in Kenya.
5.4 Conclusions
5.4.1 Effects of Account Receivables on Financial Performance
Account receivables is an important facet of financial management, and its adequate
management brings continuous growth and survival of firms. The study concludes that
there was a strong positive relationship between accounts receivables and net profit of
energy and petroleum companies listed in the Nairobi Securities exchange. Accounts
receivables influences the financial performance of the listed companies and which makes
them profitable.
5.4.2 Effects of Cash Conversion Cycle on Financial Performance
The study concludes that there was negatively relationship between cash conversion cycle
and return on assets of energy and petroleum companies listed in the Nairobi Securities
exchange.
The results imply that financial performance of listed energy and petroleum firms
depends upon effective working capital management. Above all the study concludes that
the need for efficient cash management cannot be over emphasized. This is so because,
the results showed that the overall financial performance of listed energy and petroleum is
enhanced if cash is properly managed as measured by the cash conversion cycle
components.
The firms can enhance their performance by lessening their length of cash conversion
cycle through reducing the account receivables ratio, decreasing the inventory conversion
ratio and increasing the credit payment period. The study further concludes that the
shorter the cash cover ratio, the more efficient cash is managed and ultimately the more
profitable the firm; as less borrowing cost is involved. On the other hand, the longer the
cash to cash cycle, the lesser the cash is made available and ultimately decreasing
profitability due to increased borrowing cost.

57
5.4.3 Effects of Accounts Payable on Financial Performance
The study concludes that there was a strong positive relationship between accounts
payables and return on equity of energy and petroleum companies listed in the Nairobi
Securities exchange. Accounts payables was found to be significant positive association
with return on equity, indicating that if time period of supplier ‘s payment is increased
then overall firm‘s financial performance also improves for the energy and petroleum
companies listed in the Nairobi Securities exchange.
5.5 Recommendations
5.5.1 Recommendations for Improvement
5.5.1.1 Effects of Account Receivables on Financial Performance
The study suggested that there is need for managers to delay payment to suppliers and
take advantage of the funds as short-term credit which does not attract interest costs to
reinvest in order to generate more income for shareholders. Credit monitoring should be
enhanced to assess the quality of accounts receivables to reduce over-investment in
accounts receivable. The firms should automate their invoicing systems to cut down on
the time taken to present invoices to their customers. This will reduce the average
collection period. Automated invoicing will also seek to address the errors in invoices that
always arise in the firm.
5.5.1.2 Effects of Cash Conversion Cycle on Financial Performance
The study recommends that energy and petroleum managers can improve the profitability
of their firms by reducing their cash conversion cycle which is the components of days
account receivable, inventory turnover in days. It is generally argued that firms need to
accelerate their cash collections and slowdown their payments. The findings indicate that
finance manager can enhance performance of the firms by reducing the number of days in
inventories, Cash Conversion Cycle and accounts payables to a reasonable minimum.
This is only possible if the components of Cash Conversion Cycle may be dealt
individually and an optimal policy is formulated for these components. Furthermore,
efficient Management and financing of working capital increase the operating
profitability of firms.

58
5.5.1.3 Effects of Accounts Payable on Financial Performance
The study recommended that listed firms should maximize profitability and add value by
adopting the conservative accounts payable management strategy provided the operating
environment. The study recommends that finance managers and financial officers of
companies should establish a long-term relationship with their vendors in order to access
trade credit in a more easy and fast way, as increased use of trade credit enhances
performance of companies through increased financial performance. The listed firms
should manage their trade credits prudently in order to remain profitable and competitive.
Managers should ensure an accounts payable policy is in place which stipulates the target
Accounts payable period which should be embedded in the performance targets for the
Finance Managers. Strained relationship with suppliers due to late or non-payment of
suppliers may negatively affect the ability of the companies to maintain optimal
inventories.
5.5.2 Recommendations for Further Studies
The purpose of the study was to determine the effect working capital management on
financial performance of energy and petroleum companies listed in the Nairobi Securities
Exchange. There is need for further studies to carry out similar study for a longer time
period such as ten twenty years to establish the effect of independent and dependent
variables. A similar study should also be carried out on the working capital management
and financial performance of energy and petroleum companies in Kenya and
incorporating more financial and accounting variables such as gross profit, earning per
share for the dependent variables.

59
REFERENCES
Abdullahi, H. G., Rahima, A.A., & Abbass, A. (2016). Effect of trade receivables and
inventory management on SME performance in Malaysia. British Journal of
Economics, Management & Trade, 12(4), 1-8.
Achode, B.M., & Rotich, G. (2016). The effects of accounts payable on financial
performance of publicly listed Manufacturing Companies at NSE. International
Journal of Research Studies in Agricultural Sciences (IJRSAS), 2(4), 24-32.
Adamu, Y., & Hussaini, Bala. (2015). Working capital management and financial
performance of deposit money banks in Nigeria. Research Journal of Finance and
Accounting, 6(16), 57-74.
Adolphus J. T. (2014). Relationship between accunts payable management and corporate
profitability of Nigerian listed comapnies. International Journal of Financial
Management, 3(1), 9-20.
Afza, T. & Nazir, S. M. (2008). Working capital approaches and firm’s returns in
Pakistan. Pakistan Journal of Commerce and Social Sciences, 11(1), 25-36.
Ahmet, G.S., & Emin, H.C. (2012). Effects of working capital management on firms
performance. International Journal of Economics and Financial Issues, 2(4), 488-
495.
Akinyomi, O. J., & Tasie, C. (2016). Effects of working capital management on the
profitability of Nigerian Manufacturing Firms. Journal of Business Finance and
Accounting, 6(5), 309-324.
Amarjit, G., Nahum, B., & Neil, M. (2010). The relationship between working capital
management and profitability:Evidence from The United States. Business and
Economics Journal, 17(10), 1-10.
Angahar, P.A., Rose, S., & Mnena, I.J. (2017). Effect of accounts payable and accounts
receivables on financial performance of Brewery firms quoted in the Nigerian
Securities Exchange. Imperial Journal of Interdisciplinary Research (IJIR), 3(2),
209-219.
60
Ani, W. U., Okwo, I. M., & Ugwunta, D. O. (2017). Effects of working capital
management on profitability: Evidence from the top five beer brewery firms in the
world. Asian Economic and Financial Review, 23(4), 966–982.
Aondana, P.A., Saka, R., & Ipevnor, J.M. (2017). Effect of debt settlement and
receivables on the financial performance of brewery firms quoted on the Nigerian
Stock Exchange. Imperial Journal of Interdisciplinary Research (IJIR), 3(2),
1049-1058.
Azhagaiah, R., & Muralidharan, J. (2017). The relationship between working capital
management efficieny and earning before tax. Managing Global Transitions
Journal, 7(1), 61–74.
Besley, S., & Brigham, E. (2007). Essentials of Managerial Finance. Boston, NY:
Cengage Learning.
Bhalla, V. K. (2014). Working Capital Management. S. Chand Publishing.
Bougheas, S., Mateut, S., & Mizen, P. (2009). Corporate trade credit and inventories:
New evidence of a trade-off from accounts payable and receivable. Journal of
Banking & Finance, 33(2), 300-307.
Brigham, G., & Gapenski, L. C. (1999). Financial Management: Theory and Practice
(9th ed.). Dryden Press.
Bryman, A., & Bell, E. (2011). Business Research Methods. New York: Oxford
University Press.
Chuke, N.E., Agbo, E.I., & Christian, I.L. (2018). Effect of cash conversion cycle on the
profitability of Public Listed Insurance Companies. International Journal of
Economics and Financial Issues, 8(1), 111-117.
Cooper, D. R.,& Schindler, P. S. (2011). Business Research Methods. New York, NY,
USA: McGraw-Hill/Irwin.
Darush, Y. & Öhman, P. (2016). The impact of accounts receivable use on firm
performance. Journal of Advances in Management Research, 23(1), 44-63.
61
Divya, J., Simran, J., & Vartika, B.M. (2017). Effect of receivables management on
profitability: A study of commercial vehicle industry in India. International
Journal of Applied Sciences and Management, 2(2), 246-255.
Doan, T.H., Bui, D.H., & Hoang, T.H. (2016). The impact of working capital on financial
performance of the small and medium-sized enterprises in Vietnam. Review of
Contemporary Business Research, 5(1), 158-163.
Duru, A.N., & Okpe, I.I. (2015). Account payable management on corporate profitability
of Brewery Manufacturing Companies in Nigeria. Journal of Research in
Business and Management, 3(9), 7-14.
Etikan, I., Musa, S.A., Alkassim, R.S. (2016). Comparison of convinience sampling and
purposive sampling. American Journal of Theoretical and Applied Statistics, 5(1),
1-4.
Gamze, V., Ahmet, G.S., & Emin, H.C. (2012). Affects of Working Capital Management
on Firm’s Performance: Evidence from Turkey. International Journal of
Economics and Financial Issues, 2(4), 488-495.
Ganag, M.,Kalaiselvan, P. & Suriya, R. (2015). Evaluation of Financial Performance.
International Journal of Scientific and Research Publications, 5(4), 1-7.
Gill, A., Bigger, N., & Atnur, C. . (2011). The Relationship between working capital
management and profitability: Evidence from the United States. Business and
Economics Journal, 1-9.
Gitman, L. J., & Smith, M. B. (2010). Principles of managerial finance: Global and
southern African perspectives. New Jersey: Pearson/Prentice Hall.
Hamed, T. (2016). Sampling methods in research methodology: How to choose a
sampling technique for research. International Journal of Academic Research in
Management (IJAM), 5(2), 18-27.
Horne, S.D., & Wachowitz, S.T. (2010). Trends in working capital management and its
impact on firms’ performance: An Analysis of Mauritan Small Manufacturing
Firms. International Review of Business Research papers, 2(2), 45-58.
Ikechukwu, I.O., & Duru, A.N. (2016). Effect of cash conversion cycle on the financial
performance of Building Materials, Chemical and Paint Manufacturing

62
Companies in Nigeria. Journal Of Humanities And Social Science (IOSR-JHSS),
21(7), 62-69.
Irokwe, U., & Wakoma, D. (2017). Working capital management and firms financial
performance of Oil Companies in Nigeria. IOSR Journal of Business and
Management (IOSR-JBM), 19(1), 1-17.
Jyoti, M. & Uday, K. J. (2017). The impact of accounts payable and accounts receivables
on the financial peformance of the Indian Telecom Industry. International
Multidisciplinary Research Journal, 2(5), 1-4.
Kapkiyai, C. & Mugo, R. (2015). The relationship between accounts payable and SME
financial performance. International Journal of Economics, Commerce and
Management, 3(9), 184-189.
Khalaf, T. (2012). Impact of Working Capital Management Policy and Financial
Leverage on Financial Performance: Empirical evidence from Amman Stock
Exchange – listed companies. International Journal of Management Sciences and
Business Research, 1(8), 10-18.
Kilonzo, J.M., Memba, S.F., & Njeru, A. (2016). Effect of accounts receivable on
financial performance of firms funded by governement venture capital in Kenya.
Journal of Economics and Finance (IOSR-JEF), 7(1), 62-69.
KIPRA. (2017). Kenya Economic Report 2017. Retrieved from: http://kippra.or.ke/wp-
content/uploads/2017/05/KER-2017-Popular-Version-1.pdf. Nairobi : Kenya
Institute for Public Policy Research and Analysis.
Kothari, C. (2011). Research Methodology: Methods and Techniques. New Dehli: New
Age Publishers LTD.
Ksenija, D.M. (2015). Impact of accounts receivables management on the profitabililty
during the financial crisis in Serbia. 9th International ASECU Conference on
Systemic Economic Crisis: Current issues and perspectives (pp. 3-13). University
of Niš.
Kung'u, N.J. (2015). Effects of Working Capital Management on Profitability of
Manufacturing Firms in Kenya. Nairobi: Unpublished Doctoral Thesis; JKUAT.
63
MacMillan, J. H., & Schumacher, S. (2001). Descriptive statistics. Research in
Education: A Conceptual Introduction, 204-236.
Madubuko, U.C., & Anastasia, D. (2016). Effect of cash conversion cycle on the
profitability of Industrial and Domestic product firms in Nigeria. Journal of
Investment and Management, 5(6), 99-106.
Magudba, U.J., & Ogbonnaya, A.K. (2016). Working capital management practices and
financial performance of manufacturing companies in Nigeria. European Journal
of Accounting, Auditing and Finance Research, 4(9), 98-106.
Maina, A.M. (2010). The Relationship between Working Capital Management and
Financial Performance of Firms Listed in the Nairobi Securities Exchange.
Nairobi: Unpublished MBA Project: University of Nairobi.
Majeed, S., Aziz, T., Saleem, S., & Makki, M.A.M. (2013). The relationship of cash
conversion cycle and profitability of firms. Journal of Emerging Issues in
Economics, Finance and Banking (JEIEFB), 1(1), 35-52.
Mathenge, K.M. (2016). The effects of trade receivable management on the profitability
of manufacturing companies listed in the Nairobi Securities Exchange. Nairobi:
Unpublished MBA Project; University of Nairobi.
Mathuva, D. (2009). The influence of working capital management components on
corporate profitability: A survey on Kenyan listed firms. Research Journal of
Business Management, 3(1), 1-11.
Mathuva, D.M. (2014). An empirical analysis of the determinants of the cash conversion
cycle in Kenyan listed non-financial firms. Journal of Accounting in Emerging
Economies, 2(4), 175-196.
McBurney, H. D. & Theresa, L.W. (2010). Research Methods (8th ed.). Belmont, CA:
Cengage Publishers.
Mohamed, A.S. (2013). The effects of cash conversion cycle on the profitability of
companies listed in the Nairobi Securities Exchange. Nairobi: Unpublished MBA
Project; University of Nairobi.
64
Moodley, T., Ward, M., & Muller, C. (2017). The relationship between accounts payables
and financial performance/ return to investors. South African Journal of
Accounting Research, 31(1), 35-43.
Mugenda, O.M., & Mugenda A.G. (2003). Research Methods:Quantitative and
Qualitative Approaches. Nairobi: Act Press.
Muhammad, Y., Abdul, M., & Zahid, Y. (2014). Cash conversion cycle and its impact
upon firm performance: An evidence from cement industry of Pakistan. Global
Business and Management Research: An International Journal, 4(2), 139-149.
Muneeb, A.A., & Kashif, R. (2013). The optimal relationship of cash conversion cycle
with firm size and profitability. International Journal of Academic Research in
Business and Social Sciences, 2(4), 189-203.
Munene, F., & Tibbs, Y.C. (2018). Determine the effects of accounts receivable
management on financial performance of Embu Water and Sanitation Company.
International Academic Journal of Economics and Finance (IAJEF), 3(2), 216-
240.
Murtala, Z., Sani, S. (2016). The impact of cash conversion cycle on firm profitability:
Evidence from listed Nigerian Teleccommunication companies. Journal of
Finance and Accounting, 4(6), 342-350.
Muturi, M.H. (2015). Effects of cash conversion cycle on profitability of tea factories in
Meru County. International Journal of Economics, Commerce and Management,
3(8), 552-563.
Naeem, U.H., Malik, M. I., Muhammad, A., & Mehboob, H. (2014). Effects of working
capital management on firm Performance: An Empirical Study of Non-financial
listed Firms in Pakistan. International Journal of Academic Research in Business
and Social Sciences, 4(6), 114-133.
Nduta, M.W. (2015). The effect of working capital management on fiancial performance
of manufacturing firms listed in the Nairobi Securities Exchange. Nairobi:
Unpublished MBA Project: University of Nairobi.

65
Nimal, J.S.S., & Anandasayanan, S. (2015). The impact of Cash conversion cycle on the
performance of listed Hotels and Travels Companies in Sri Lanka. International
Journal of Research in Commerce, Economics and Management, 5(3), 61-74.
Niresh, J.A. (2012). Working Capital Management & Financial Performance of
Manufacturing Sector in Sri Lanka. European Journal of Business and
Management, 4(15), 23-32.
Nyabuti, W.N., & Ondiek, B.A. (2014). The relationship between working capital
management policy and financial performance of companies quoted at Nairobi
securities exchange, Kenya. International Journal of Economics, Finance and
Management Sciences, 2(3), 212-219.
Okpe, I.I., Nwakego, A.D. (2015). The effect of receivable management on the
profitability of Building Materials/Chemical and Paint Manufacturing in Nigeria.
Journal of Research in Humanities and Social Science, 3(10), 1-6.
Orjinta, H.I., & Okpalaukeja, R.U. (2018). Effect of cash to cash cycle on profitability of
Basic Material Firms listed in the Nigerian Stock Exchange. Journal of Financial
Innovation, 7(1), 12-28.
Osman, A.D., & Ayuma, C. (2018). The impact of accounts receivable management on
the financial performance of Small and Medium Firms in Mogadishu-Somalia.
International Journal of Management and Commerce Innovations, 6(1), 378-383.
Panigrahi, A.K. (2013). Cash conversion cycle and firm's profitability: A study of cement
manufacturing compamies of India. International Journal of Current Research,
5(6), 1484-1488.
Raheem, A. & Qaisar, A.M. (2014). Cash conversion cycle and firms’ profitability: A
study of listed manufacturing comapnies in Pakistan. Journal of Business and
Management (IOSR-JBM), 8(2), 83-87.
Ramesh, G., Hamad, A., & Tammam, A. (2017). Effects of working capital on the
financial performance of manufacturing firms in Sultanate of Oman. Innovative
Journal of Business and Management, 6(3), 38-42.

66
Rathiranee, Y. (2017). Working capital management and its impact on firms’ financial
performance: An analysis of trading firms. Journal of Financial Management and
Analysis, 19(1), 26-35.
Ray, D. (2012). Evaluating the impact of working capital management components on
corporate profitability: Evidence from Indian Manufacturing Firms. International
Journal of Economic Practices and Theories, 2(3), 127-136.
Richards, V. D., & Laughlin, E. J. (1980). A cash conversion cycle approach to liquidity.
Financial Management, 32-38.
Richey, R. C., & Klein, J. D. . (2014). Design and development research: Methods,
strategies, and issues. London: Routledge Publishers.
Roberts, C. A., & Burke, S. O. (1989). Nursing Research: A quantitative and qualitative
approach. Burlington: Jones & Bartlett Publishers.
Saunder, M., Lewis, P. & Thornhill, A. (2007). Research Methods for Business Students
(3rd ed.). New York: Pearson Publishers.
Sharma, A.K., & Kumar, S. (2011). The effect or working capital management of firm’s
profitability: Empirical Evidence from India. Global Business Review, 12(1), 159-
173.
Singh, P. K. (2004). Working capital management in Lupin laboratories Ltd.:A case
study. Journal of Management Accounting, 39(7), 534-541.
Tanveer, B., Muhammad, I.N., Khan, M.K., & Sadaf, R. (2016). The impact of working
capital management on firms financial performance: Evidence from Pakistan.
International Journal of Economics and Financial Issues, 6(3), 1097-1105.
Waema, P., & Nasieku, T. (2016). Effect of working capital management on the financial
performance of listed manufacturing firms in Kenya. Asian Journal of Business
and Management, 4(5), 195-209.
Weygandt, J. J., Kimmel, P. D., & Kieso, D. E. (2015). Financial and Managerial
Accounting. New York: John Wiley & Sons.

67
Yazdanfar, D. (2012). Information asymmetry and capital structure: an empirical study of
micro firms in Sweden. International Journal of Entrepreneurship and Small
Business, 17(3), 304-318.
Zahra, M., & Azam, J. (2012). The relationship between working capital management and
firm performance:Evidence from Iran. International Journal of Humanities and
Social Science, 2(2), 141-147.
Zikmund, W.G., Babin, B.J., Carr, J.C. & Griffin, M. (2013). Business Research Methods
(8th ed.). New York: South Western Cengage Learning.
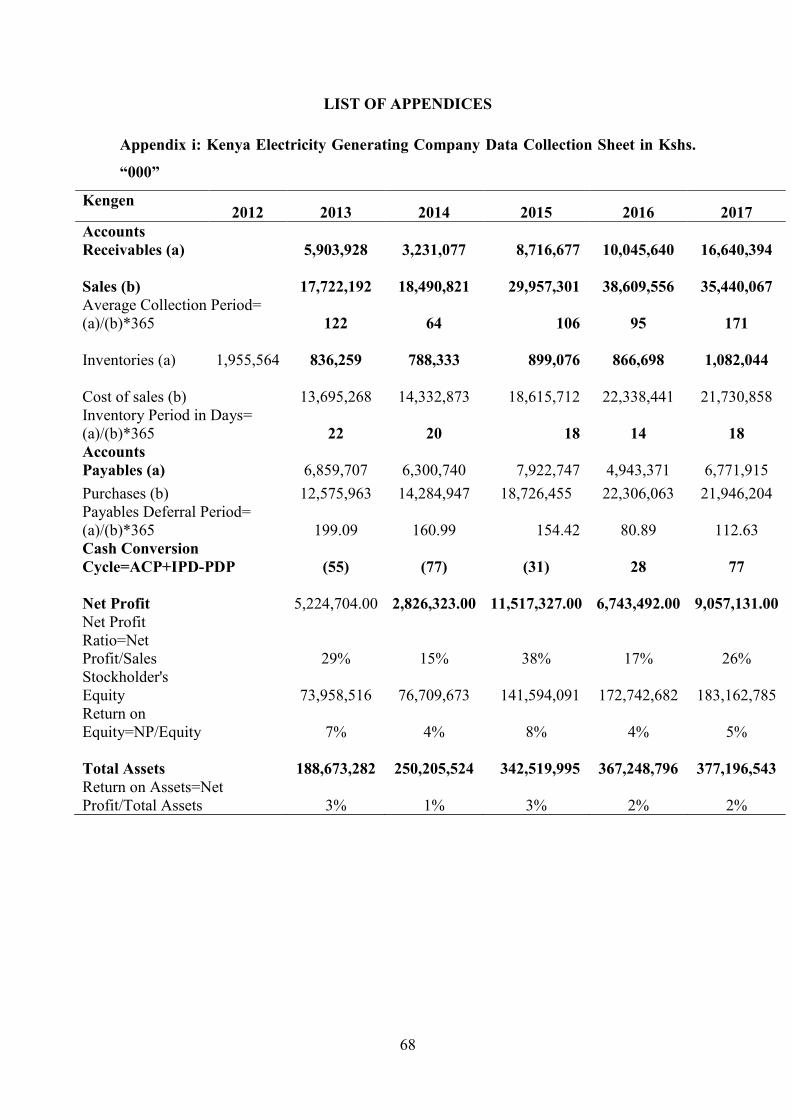
68
LIST OF APPENDICES
Appendix i: Kenya Electricity Generating Company Data Collection Sheet in Kshs.
“000”
Kengen 2012 2013 2014 2015 2016 2017
Accounts
Receivables (a)
5,903,928
3,231,077 8,716,677
10,045,640
16,640,394
Sales (b)
17,722,192
18,490,821 29,957,301
38,609,556
35,440,067
Average Collection Period=
(a)/(b)*365
122
64 106
95
171
Inventories (a) 1,955,564
836,259
788,333 899,076
866,698
1,082,044
Cost of sales (b)
13,695,268
14,332,873 18,615,712
22,338,441
21,730,858
Inventory Period in Days=
(a)/(b)*365
22
20 18
14
18
Accounts
Payables (a) 6,859,707
6,300,740 7,922,747
4,943,371
6,771,915
Purchases (b) 12,575,963 14,284,947 18,726,455 22,306,063 21,946,204
Payables Deferral Period=
(a)/(b)*365
199.09
160.99 154.42
80.89
112.63
Cash Conversion
Cycle=ACP+IPD-PDP
(55)
(77)
(31)
28
77
Net Profit
5,224,704.00 2,826,323.00 11,517,327.00 6,743,492.00 9,057,131.00
Net Profit
Ratio=Net
Profit/Sales 29% 15% 38% 17% 26%
Stockholder's
Equity
73,958,516
76,709,673 141,594,091
172,742,682
183,162,785
Return on
Equity=NP/Equity 7% 4% 8% 4% 5%
Total Assets
188,673,282
250,205,524 342,519,995
367,248,796
377,196,543
Return on Assets=Net
Profit/Total Assets 3% 1% 3% 2% 2%

69
Appendix ii: KenolKobil Data Collection Sheet in Kshs. “000”
Kenkobil 2012 2013 2014 2015 2016 2017
Accounts Receivables
(a)
10,756,595
9,725,617
6,524,544
7,773,875
8,718,072
Sales (b)
109,687,453
91,315,702
86,557,936
103,493,925
158,710,185
Average Collection Period=
(a)/(b)*365
36
39
28
27
20
Inventories (a) 7,729,755
6,528,533
4,141,183
3,095,900
5,828,398
6,914,376
Cost of sales (b)
105,422,286
85,088,414
80,720,486
96,110,370
150,798,637
Inventory Period in Days=
(a)/(b)*365
23
18
14
22
17
Accounts Payables
(a) 5,591,360
5,633,064
3,695,586
6,393,652
5,087,474
Purchases (b) 104,221,064 82,701,064 79,675,203 98,842,868 151,884,615
Payables Deferral Period=
(a)/(b)*365
19.58
24.86
16.93
23.61
12.23
Cash Conversion
Cycle=ACP+IPD-PDP
39
32
25
26
25
Net Profit
2,792,466.00 3,137,172.00 3,433,619.00 2,413,207.00 2,464,703.00
Net Profit Ratio=Net
Profit/Sales 3% 3% 4% 2% 2%
Stockholder's Equity
6,666,294
7,330,496
8,555,639 6,198,202.00
7,525,627
Return on
Equity=NP/Equity 42% 43% 40% 39% 33%
Total Assets 28,121,673
23,915,166
17,377,103
24,201,705
24,099,030
Return on Assets=Net Profit/Total
Assets 10% 13% 20% 10% 10%
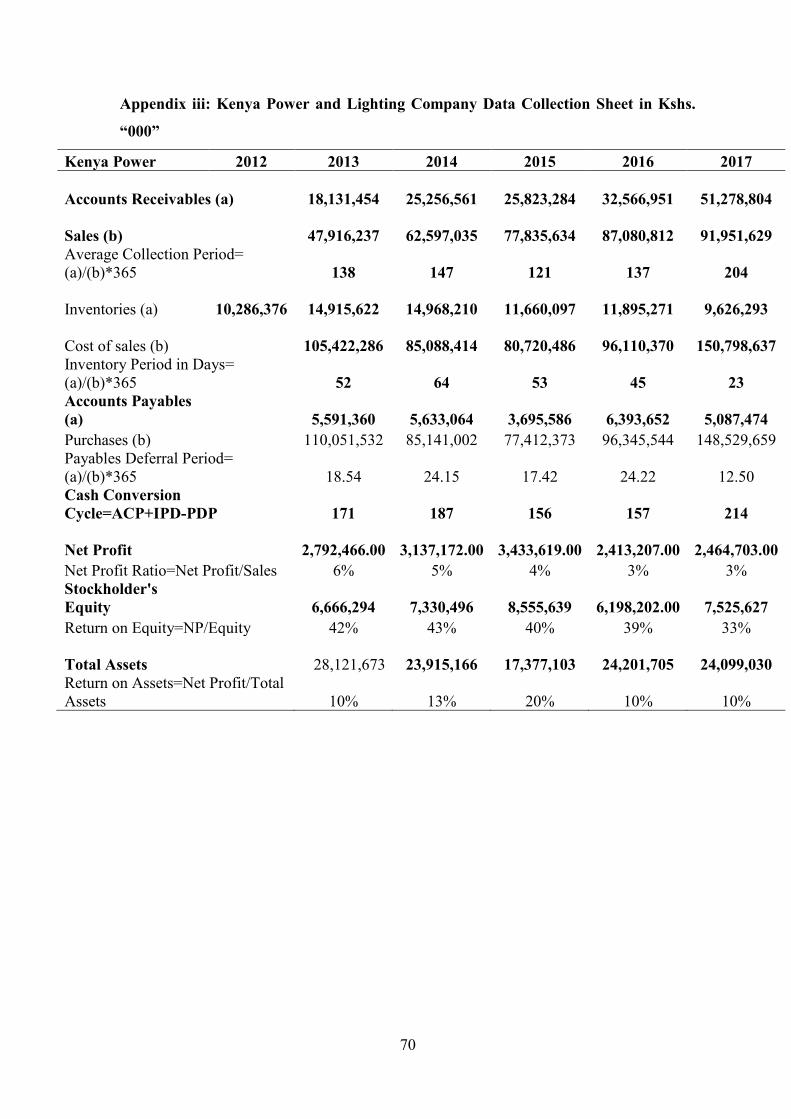
70
Appendix iii: Kenya Power and Lighting Company Data Collection Sheet in Kshs.
“000”
Kenya Power 2012 2013 2014 2015 2016 2017
Accounts Receivables (a)
18,131,454
25,256,561
25,823,284
32,566,951
51,278,804
Sales (b)
47,916,237
62,597,035
77,835,634
87,080,812
91,951,629
Average Collection Period=
(a)/(b)*365
138
147
121
137
204
Inventories (a) 10,286,376
14,915,622
14,968,210
11,660,097
11,895,271
9,626,293
Cost of sales (b)
105,422,286
85,088,414
80,720,486
96,110,370
150,798,637
Inventory Period in Days=
(a)/(b)*365
52
64
53
45
23
Accounts Payables
(a) 5,591,360
5,633,064
3,695,586
6,393,652
5,087,474
Purchases (b) 110,051,532 85,141,002 77,412,373 96,345,544 148,529,659
Payables Deferral Period=
(a)/(b)*365
18.54
24.15
17.42
24.22
12.50
Cash Conversion
Cycle=ACP+IPD-PDP
171
187
156
157
214
Net Profit
2,792,466.00 3,137,172.00 3,433,619.00 2,413,207.00 2,464,703.00
Net Profit Ratio=Net Profit/Sales 6% 5% 4% 3% 3%
Stockholder's
Equity
6,666,294
7,330,496
8,555,639 6,198,202.00
7,525,627
Return on Equity=NP/Equity 42% 43% 40% 39% 33%
Total Assets 28,121,673
23,915,166
17,377,103
24,201,705
24,099,030
Return on Assets=Net Profit/Total
Assets 10% 13% 20% 10% 10%

71
Appendix iv: Total Kenya Data Collection Sheet in Kshs. “000”
Total Kenya 2012 2013 2014 2015 2016 2017
Accounts
Receivables (a)
8,128,992
8,608,970
9,418,304 8,714,085
9,759,025
Sales (b)
154,626,092
155,101,692
120,253,994 89,060,924
111,423,554
Average Collection Period=
(a)/(b)*365
19
20
29 36
32
Inventories (a) 13,794,942
14,953,214
11,159,064
10,017,977 12,080,556
12,461,179
Cost of sales (b)
135,371,011
148,351,545
113,263,567 81,209,334
148,351,545
Inventory Period in Days=
(a)/(b)*365
40
27
32 54
31
Accounts
Payables (a) 8,128,992
9,418,304
9,418,304 7,803,954
8,117,137
Purchases (b) 136,529,283 144,557,395 112,122,480 83,271,913 148,732,168
Payables Deferral Period=
(a)/(b)*365
21.73
23.78
30.66 34.21
19.92
Cash Conversion
Cycle=ACP+IPD-PDP
38
24
30 56
43
Net Profit
1,312,277.00 1,424,088.00 1,424,088.00 2,234,292.00 2,738,216.00
Net Profit
Ratio=Net
Profit/Sales 1% 1% 1% 3% 2%
Stockholder's
Equity
15,379,060
16,425,423
17,599,746 19,349,290.00
21,417,219
Return on
Equity=NP/Equity 9% 9% 8% 12% 13%
Total Assets 39,984,165
32,541,800
34,225,035 36,185,372
38,012,115
Return on Assets=Net
Profit/Total Assets 3% 4% 4% 6% 7%

72
Appendix v: Umeme Plc Data Collection Sheet in Kshs. “000”
Umeme Plc 2012 2013 2014 2015 2016 2017
Accounts Receivables (a)
230,813
283,712
342,959
388,994
329,762
Sales (b)
965,752
977,664
1,161,008
1,358,206
1,476,430
Average Collection Period=
(a)/(b)*365
87
106
108
105
82
Inventories (a)
36,460
29,593
37,250
55,521
55,521
58,490
Cost of sales (b)
675,866
659,196
742,967
881,786
960,495
Inventory Period in Days=
(a)/(b)*365
16
21
27
23
22
Accounts Payables (a) 241,952
286,134
334,286
334,286
401,266
Purchases (b) 668,999 666,853 761,238 881,786 963,464
Payables Deferral Period=
(a)/(b)*365
132.01
156.61
160.28
138.37
152.02
Cash Conversion
Cycle=ACP+IPD-PDP
(29)
(30)
(25)
(11)
(48)
Net Profit
83,667.00 70,493.00 70,493.00 138,834.00 35,494.00
Net Profit Ratio=Net
Profit/Sales 9% 7% 6% 10% 2%
Stockholder's Equity
285,765
313,712
592,052 624,276.00
617,669
Return on Equity=NP/Equity 29% 22% 12% 22% 6%
Total Assets 888,906
1,211,939
1,774,869
2,226,053
2,349,433
Return on Assets=Net
Profit/Total Assets 9% 6% 4% 6% 2%

73
Appendix vi: Data Collection Sheet Summary for Period (2013-2017) in Kshs. “000”
Period Kengen Kenkobil Kenya Power Total Kenya Umeme Plc
Accounts Receivables AR2013 5,903,928 10,756,595 18,131,454 8,128,992 230,813
AR2014 3,231,077 9,725,617 25,256,561 8,608,970 283,712
AR2015 8,716,677 6,524,544 25,823,284 9,418,304 342,959
AR2016 10,045,640 7,773,875 32,566,951 8,714,085 388,994
AR2017 16,640,394 8,718,072 51,278,804 9,759,025 329,762
Accounts Payables AP2013 6,859,707 5,591,360 22,464,988 8,128,992 241,952
AP2014 6,300,740 5,633,064 26,648,209 9,418,304 286,134
AP2015 7,922,747 3,695,586 26,328,349 9,418,304 334,286
AP2016 4,943,371 6,393,652 35,298,171 7,803,954 334,286
AP2017 6,771,915 5,087,474 53,974,414 8,117,137 401,266
Cash Conversion Cycle CCC2013 (55) (55) 103 38 (29)
CCC2014 (77) (77) 89 24 (30)
CCC2015 (31) (31) 42 30 (25)
CCC2016 28 28 16 56 (11)
CCC2017 77 77 (9) 43 (48)
Net Profit NP2013 5,224,704 2,792,466 2,792,466 1,312,277 83,667
NP2014 2,826,323 3,137,172 3,137,172 1,424,088 70,493
NP2015 11,517,327 3,433,619 3,433,619 1,424,088 70,493
NP2016 6,743,492 2,413,207 2,413,207 2,234,292 138,834
NP2017 9,057,131 2,464,703 2,464,703 2,738,216 35,494
Total Assets TA2013 188,673,282 28,121,673 184,212,535 39,984,165 888,906
TA2014 250,205,524 23,915,166 220,926,514 32,541,800 1,211,939
TA2015 342,519,995 17,377,103 272,286,082 34,225,035 1,774,869
TA2016 367,248,796 24,201,705 297,542,180 36,185,372 2,226,053
TA2017 377,196,543 24,099,030 341,653,227 38,012,115 2,349,433
Stockholder's Equity TE2013 73,958,516 6,666,294 47,149,807 15,379,060 285,765
TE2014 76,709,673 7,330,496 54,743,822 16,425,423 313,712
TE2015 141,594,091 8,555,639 57,969,656 17,599,746 592,052
TE2016 172,742,682 6,198,202 64,021,813 19,349,290 624,276
TE2017 183,162,785 7,525,627 69,961,655 21,417,219 617,669
Return on Assets ROA2013 3% 10% 2% 3% 9%
ROA2014 1% 13% 3% 4% 6%
ROA2015 3% 20% 3% 4% 4%
ROA2016 2% 10% 2% 6% 6%
ROA2017 2% 10% 2% 7% 2%
Return on Equity ROE2013 7% 42% 7% 9% 29%
ROE2014 4% 43% 13% 9% 22%
ROE2015 8% 40% 13% 8% 12%
ROE2016 4% 39% 11% 12% 22%
ROE2017 5% 33% 9% 13% 6%

74
Appendix vii: Sample Frame
Energy and Petroleum Companies Listed in the Nairobi Securities Exchange as at
31st December 2017
1) Kenol Kobil Limited
2) Total Kenya Limited
3) KenGen Limited
4) Kenya Power and Lighting Company
5) Umeme Limited.
Source: Nairobi Securities Exchange 2018