effects of water to cementitious ratio on … cbu reports/rep-101.pdf · "effects of water to...
TRANSCRIPT

"EFFECTS OF WATER TO CEMENTITIOUS RATIO ON COMPRESSIVE STRENGTH OF CEMENT MORTAR CONTAINING FLY ASH"* By Tarun R. Naik, Ph.D., P.E. Director, Center for By-Products Utilization
Shiw S. Singh, Ph.D., P.E. Post-Doctoral Fellow Center for By-Products Utilization and Amr S. Hassaballah Research Associate Center for By-Products Utilization
Department of Civil Engineering and Mechanics College of Engineering and Applied Science The University of Wisconsin-Milwaukee P.O. Box 784 Milwaukee, WI 53201 Telephone: (414) 229-6904 Fax: (414) 229-6958
__________________________________________________________________ *Presented and Published at the ACI/CANMET-EPRI Sponsored Fourth
International Conference on Fly Ash, Silica Fume, Slag and Natural Pozzolans in Concrete, Istanbul, Turkey, May 1992.

"Effects of Water to Cementitious Ratio on Compressive Strength of Cement Mortar Containing Fly Ash" by Tarun R. Naik, Shiw S. Singh and Amr S. Hassaballah
ABSTRACT
This study was directed toward studying performance of ASTM Class
C and F fly ashes in mortars under varying water to cementitious
materials ratio. Four different basic mixtures were proportioned.
These mixes were proportioned to have cement replacements in the
range of 20 - 40 percent by the weight of fly ash. For each basic
mix, water to cementitious materials ratio varied between 0.25 - 5.0.
An ASTM Type I Portland cement obtained from one source was used
in all the tests. Mortar mixes containing 20% Class C fly ash
exhibited better results than that shown by both the control mix as
well as other mixes containing Class F fly ash. The optimum water
to cementitious materials ratio (weight of water divided by total
weight of cement plus Class C or Class F fly ash) was found to range
between 0.35 and 0.6 for mixes tested in this investigation.
INTRODUCTION
Researchers have shown that the addition of fly ash to concrete
mixes reduces water requirement for a given workability [1, 2, 3,
7]. The decrease in water demand has been attributed to increase

3
in workability due to decreased fiction between paste and large
aggregate particles resulting from ball bearing effects of spherical
particles of fly ash present in these mixes.
Minnick et al. [4] indicated that inclusion of fly ash can
increase or decrease the water requirement of mortar or concrete mixes
depending upon the carbon content (LOI), and the amount of material
retained by the 45 μm sieve. The increase in water demand results
due to water absorption by carbon particles and other porous
materials [4], and coarse particles cause increased frictional
resistance of the mix systems, especially between the paste and coarse
aggregate particles. Therefore, mixes containing large and/or coarse
fly ash particles, higher amounts of water will be required relative
to the control mix in order to produce mortars/concrete at a fixed
workability level. In general, mixes containing fly ash with finer
particles show decrease in water demand with increasing amount of
fly ash in the mixture.
Helmuth [4] reviewed critically the water-reducing properties
of fly ash in cement pastes, mortars, and concretes. Based on his
critical analysis of test data derived from several studies, he
concluded that the reduction in water requirement in these mixes may
not be because of ball bearing effects of spherical fly ash particles,
as generally described in the literature, but it may be primarily
due to absorption of very fine fly ash particles on cement particles

4
surfaces which in turn causes dispersion of the cement particles
similar to that obtained through addition of organic water-reducing
admixtures.
Variations in fly ash properties, physical, chemical, and
mineralogical, can have substantial effects on its performance in
mortar as well as in concrete. Also, considerable variations can
also occur due to variations in properties of cements and other mineral
admixtures depending upon their production processes, types and
brands. Therefore, it is of special importance to develop optimum
mix proportion for each fly ash type and source in order to make
effective utilization of fly ashes in mortars/concrete. This
research work was carried out to evaluate performance of fly ash in
mortar as a function of water requirements and water to cementitious
materials ratio. The result of this investigation would be useful
in determining optimum mix proportion for fly ash mortars, and later
concrete, containing either ASTM Class C or Class F fly ashes.
PREVIOUS STUDIES
Berry [6] studied development of compressive strength of mortars
made from blends of slag, fly ash and Portland cement. No significant
interaction was found to occur between them when granulated slag and
fly ash was used together. Mortars were made with binary or ternary
blends of cement, slag, and fly ash. Mortar cube specimens were tested

5
for compressive strength. The results showed that optimum amount
of fly ash containing finer particles (10.2% retained on Sieve # 325)
can be blended with cement and slag in the range of 10-30% of the
blend.
Lin and Hwang [8] evaluated effects of design parameters for
cement mortars containing Class F fly ash such as water to cementitious
ratio and curing temperature on the replacements of cement and fine
aggregates by fly ash. Based on the results obtained, they
recommended that in order to increase the early strength grain of
mortars containing fly ash: (a) replace part of cement by fly ash
and reduce water-cement ratio simultaneously; (b) replace part of
sand by fly ash and slightly increase the water-cement ratio to improve
its workability; (c) replace part of cement and sand simultaneously;
and, (d) cure with high temperature.
Compressive strength of mortars containing slag and fly ash have
been measured by Douglas et al. [9, 10]. Their study [9] revealed
that high-lime content fly ash develops higher compressive strength
than low-lime fly ash above 25% Portland cement replacement. They
further indicated that 50 percent cement replacement by the high-lime
content fly ash might provide an acceptable compromise with respect
to compressive strength and heat of hydration. Douglas et al. [10]
also reported that sulphate resistance of mortar containing 58 percent

6
of fly ashes with lime content up to 12.3 percent was significantly
higher compared to the reference mortars containing no fly ash.
TEST MATERIALS
For the research project reported herein, test materials
consisted of cement, sand, water, and fly ashes. ASTM Type I cement
was used throughout these tests. ASTM Class C and F ashes were
obtained from Pleasant Prairie Power Plant, Kenosha County, WI and
Valley Power Plant, Milwaukee, WI, respectively. Natural sand was
obtained from a local ready mix concrete producer.
MIX PROPORTIONING
In mixing the reference mortar mixes, cement to sand ratio was
taken as 1:2.75. This mix proportion for the control mix was
designated as Mix A.
Mortars were also proportioned to have cement replacement by
fly ash in the range of 20-40 percent. Three different basic mortar
mixtures containing fly ashes, designated as Mix B, Mix C, and Mix
D, were also proportioned, Table 1. For all mixes, except Mix B,
water to cementitious materials ratio was varied in the range of 0.25
- 5.0 (Tables 2 through 5). For Mix B water to cement cementitious
materials ratio varied in the range of 0.25 - 0.8.

7
PREPARATION AND TESTING OF CUBE SPECIMENS
For each mix, 2-in. mortar cubes were cast and moist-cured for
24 hours. Then demolded and stored in lime-saturated water until
time of testing. All cubes were tested for compressive strength at
7 and 28 days in accordance with the ASTM Test C-109.
RESULTS AND DISCUSSION
Test data are presented in Tables 2 through 5, and in Figures
1 through 7.
As expected, compressive strength increased with water to
cementitious ratio up to a certain level and then decreased. This
happens due to the well known fact that up to certain water to
cementitious ratio, below optimum, strength decreases because
insufficient amount of water is available for completion of hydration
reaction, and/or because of low fluidity of the mix, "dryness" of
the mix, compaction might be poor to achieve the potential strength.
Whereas above the optimum water requirement, strength decreases due
to increased porosity of the mortar mixture system resulting from
increased water content.

8
Generally, for optimum strength/performance, higher water to
cementitious materials is observed in the case of mortars compared
to concrete. Several factors can influence the water to cementitious
ratio of mortar and concrete mixes. The transition zone, the
interfacial region between aggregate and paste, is larger due to size
of coarse aggregate particles present in case of concrete with compared
to mortar. Also, for concrete, porosity of the transition zone
increases with increase in water content. The transition zone is
the weakest link and thus dictates the extent of concrete strength
that can be achieved due to the cementitious compounds hydration
reaction. Probably due to this factor, less than the required amount
of water for hydration could be added to concrete to avoid critical
porosity beyond which strength diminishes rapidly. This effect is
relatively small in case of mortars due to their finer aggregate
particles relative to coarse aggregate particles used in concrete.
Therefore, higher amount of water can be added to mortar mixes to
derive potential strength gain due to hydration reactions. The peak
strength, therefore, for mortars occurs at a higher value of water
to cementitious ratio.
Compressive strength data for Mix A as a function of water to
cementitious ratio by weight is presented in Table 2. The compressive
strength increased with increasing water to cementitious ratio up
to 0.57 and then diminished, for both 7-day and 28-day test ages.
9
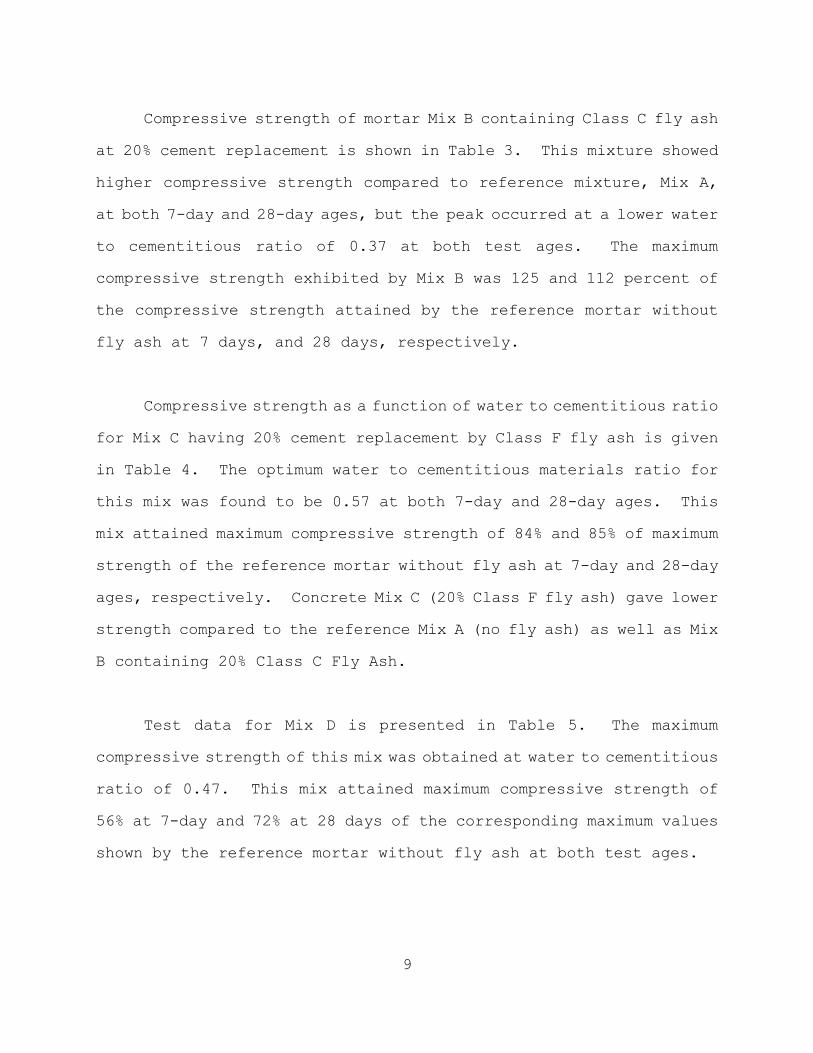
Compressive strength of mortar Mix B containing Class C fly ash
at 20% cement replacement is shown in Table 3. This mixture showed
higher compressive strength compared to reference mixture, Mix A,
at both 7-day and 28-day ages, but the peak occurred at a lower water
to cementitious ratio of 0.37 at both test ages. The maximum
compressive strength exhibited by Mix B was 125 and 112 percent of
the compressive strength attained by the reference mortar without
fly ash at 7 days, and 28 days, respectively.
Compressive strength as a function of water to cementitious ratio
for Mix C having 20% cement replacement by Class F fly ash is given
in Table 4. The optimum water to cementitious materials ratio for
this mix was found to be 0.57 at both 7-day and 28-day ages. This
mix attained maximum compressive strength of 84% and 85% of maximum
strength of the reference mortar without fly ash at 7-day and 28-day
ages, respectively. Concrete Mix C (20% Class F fly ash) gave lower
strength compared to the reference Mix A (no fly ash) as well as Mix
B containing 20% Class C Fly Ash.
Test data for Mix D is presented in Table 5. The maximum
compressive strength of this mix was obtained at water to cementitious
ratio of 0.47. This mix attained maximum compressive strength of
56% at 7-day and 72% at 28 days of the corresponding maximum values
shown by the reference mortar without fly ash at both test ages.

10
The data presented above revealed that increase in Class F fly
caused reduction in mortar strength. Furthermore, peak strength
occurred at a lower W/C+F ratio for the 40% Class F fly ash mix with
respect to the no fly ash mix and the 20% Class F fly ash mix (for
which peak occurred at the W/C+F ratio of 0.57. This may be because
of the fact that slower pozzolanic reaction occurs at early age due
to poor reactivity of the Class F ash used. Improvement in compressive
strength were not achieved even at 20% Class F fly ash replacement.
Mix B with 20% cement replacement by Class C fly ash showed encouraging
results due to its better cementitious and pozzolanic properties
relative to Class F fly ash. The higher pozzolanic activity in the
case of Class C fly ash is associated with its improved fineness,
and higher lime content. The test results showed that optimum water
to cementitious ratio by weight was in the range of 0.35 - 0.60 for
all the mortar mixes with and without Class C or F fly ash.
RELATIONSHIP BETWEEN WATER TO CEMENTITIOUS RATIO BY WEIGHT AND WATER
TO CEMENTITIOUS RATIO BY VOLUME
The water to cementitious ratio by weight can be expressed as:
RW =
WW
WCM
1
RW =
WW
(WC + W
FA) 2

11
Where
RW = Water to cementitious ratio by weight
WW = Weight of water
WCM = Weight of total cementitious materials (cement and fly
ash)
WFA = Weight of fly ash
P = Percent cement replacement by fly ash
RR = Replacement ratio, ratio of fly ash to cement
replacement used
The water to cementitious materials ratio by volume can be written
as
RW =
WW
WCM[(1 -
P
100) + P*RR
100 ]
3
RV =
VW
VC + V
FA
4
RV =
WW
ρW
[(1-P)
ρC
WCM +
P WCM RR
ρFA
]
5

12
where
Rv = Water to cementitious materials ratio by volume
ρW = Density of water
ρC = Density of cement
ρFA = Density of fly ash
SC = Specific gravity of cement
SFA = Specific gravity of fly ash
CF = Conversion factor, and it is given by the following
relation:
The values of CF can be multiplied by water to cementitious ratio
by weight to obtain the water to cement ratio by volume (Eq. 7).
Eq. 8 provides general conversion factor (CF) for converting
water to cementitious ratio by weight (RW) to water is cementitious
ratio by volume (RV). When the replacement ratio (RR) is set to zero,
RV =
WW
WCM
[1
(1-P)
SC
+ P*RR
SFA
] 6
RV = R
W * CF 7
CF = 1
[(1-P
SC
) + P*RR
SFA
]
8

13
then RW and RV become W/C by weight and W/C by volume, respectively
for mixes containing fly ash. For mixes containing no fly ash, both
P and RR will be set to zero to obtain the desired water to cement
ratios.
The general trend of the results remains the same as described
above for the weight ratio (Rw) when water to cementitious ratio is
expressed by volume (RV). However, the strength values will be
represented at a higher water to cementitious ratio by volume relative
to water to cementitious ratio by weight as determined by the factor
CF. The CF factor is a function of amount of cement replacement by
fly ash, replacement ratio (RR), specific gravity of cement and fly
ash. The computed values of CF is shown in Table 6. Compressive
strength data for mixes tested are plotted as a function of water
to cementitious ratio on both weight and volume basis (Figure 1 through
7).
CONCLUSIONS
(1) Addition of ASTM Class F fly ashes caused reduction in compressive
strength of cement mortars within the tested range of variables.
(2)Mortar made with mixes with 20% cement replacement by Class C fly
ash cement showed excellent results amongst all the mixes tested
in this investigation.

14
(3)The optimum water to cementitious material ratio by weight varied
in the range of 0.35 - 0.6 for all mortar mixes tested.
REFERENCES
1.Berry, E.E., and Malhotra, V.M., "Fly Ash for Use in Concrete -
A Critical Review", ACI Journal, Vol. 77, No. 2, March/April,
1980, pp. 59-73.
2.Naik, T.R., and Ramme, B.W., "High-Strength Concrete Containing
Large Quantities of Fly Ash", ACI Materials Journal, Vol. 86,
No. 2, March-April 1989, pp 111-116.
3.Berry, E.E., Hemmings, R.T., Langley, W.S., and G.G. Carette,
"Beneficiated Fly Ash: Hydration, Microstructures, and Strength
Development in Portland Cement Systems", in "Fly Ash, Silica
Fume, Slag, and Natural Pozzolans in Concrete", V.M. Malhotra,
Ed., proceedings of the Third International Conference,
Trandheim, Norway, June 1989, pp 241-273.

15
4.Minnick, L.J., Webster, W.C., and Purdy, E.J., "Predictions of the
Effects of Fly Ash in Portland Cement Mortar and Concrete", ASTM
J. of Materials, Vol. 6, No.1, 1971, pp. 163-187.
5.Helmuth, R.A., "Water-Reducing Properties of Fly Ash in Cement
Pastes, Mortars, and Concretes: Causes and Test Methods", in
"Fly Ash, Silica Fume, Slag and Natural Pozzolans in Concrete",
V.M. Malhotra, Ed., proceeding of the Second International
Conference, Madrid, Spain, Sp-91, Vol. I, April 1986, pp 723-740.
6.Berry, E.E., "Strength Development of Some Blended-Cement
Mortars", International Journal of Cement and Concrete
Research, Vol. 10, No. 1, 1990, pp. 1-11.
7.Naik, T.R. and Ramme, B.W., "Effects of High-Lime fly Ash Content
on Water Demand, Workability, Time of Set and Compressive
Strength of Concrete", Presented at the Third International
Conference on the Use of Fly Ash, Silica Fume, Slag and Natural
Pozzolan's, Trondheim, Norway, 1989.
8.Lin, C.Y., and Hwang, C.L., "The Effect of Fly Ash on Properties
of Cement Mortar" in "Fly Ash, Silica Fume, Slag and Natural
Pozzolans in Concrete", V.M. Malhotra, Ed., proceedings of the
Second International Conference, Madrid, Spain, April 1986,
pp 21-1 - 21-32.

16
9.Douglas, E., Elola, A., and Malhotra, V.M., "Characterization of
Ground Granulated Blast-Furnace Slag and Ashes and Their
Hydration in Portland Cement Blends", Cement, ASTM Journal of
Concrete and Aggregates, Summer, 1990, pp. 38-46.
10. Douglas, E., Huyssteen, E.V., and Malhotra, V.M., "Sulphate
Resistance of Mortars Made with High Volumes of Class F Fly Ash
or Granulated Blast-Furnace Slag - Progress Report", to be
Published in the proceedings of the Second International
Conference on Durability of Concrete, Montreal, Quebec, Canada,
Aug. 1991.

17
Table 1 - Description of Mix Proportions
════════════════════════════════
Mix A - no fly ash
Mix B - 20% Type C fly ash
Mix C - 20% Type F fly ash
Mix D - 40% Type F fly ash
════════════════════════════════

18
Table 2 -Compressive Strength of Concrete as a Function of Water to
Cementitious Ratio for Mix A (no fly ash)
Water/ Cementitious
Ratio
C O M P R E S S I V E S T R E N G T H, p s i +
7 days 28 days
Mean S.D. C.V.* Mean S.D. C.V.*
0.27 490 25 5.1 750 13 1.8
0.32 1347 88.1 6.50 1743 38.0 2.2
0.37 2200 25 1.1 3295 243 7.4
0.47 3278 84 2.6 4317 63 1.5
0.57 3482 78 2.2 4742 227 4.8
0.67 2627 153 5.8 4008 76 1.9
0.77 2403 102 4.2 3650 161 4.4
0.87 1550 41 2.6 2613 135 5.2
0.97 1548 54 3.5 2478 28 1.1
1.22 905 79 8.7 1823 18 1.0
1.47 696 48 6.9 1868 338 18.1
1.72 540 30 5.6 1443 306 21.2
1.97 362 63 17.5 847 86 10.2
2.47 213 3 1.4 535 113 21.1
2.97 235 68 28.8 463 63 13.6
3.97 336 12 3.7 393 106 27.1
4.97 ** ** ** 451 85 18.8
+ 1000 psi = 6.895 MPa
* C V. = Coefficient of Variation S.D. = Standard Deviation
*C.V.=S.D.
Meanx100

19
** Cubes could not be made to an appropriate dimension.

20
Table 3 -Compressive Strength of Concrete as a Function of Water to
Cementitious Ratio for Mix B (20% Class C Fly Ash)
Water/ Cementitious
Ratio
C O M P R E S S I V E S T R E N G T H, p s i +
7 days 28 days
Mean S.D.* C.V.* Mean S.D.* C.V.*
0.27 972 70 7.2 1150 61 5.3
0.32 3538 278 7.9 4408 118 2.7
0.37 4358 177 4.1 5283 101 1.9
0.47 3707 44 1.2 4867 76 1.6
0.57 3142 110 3.5 4675 43 0.9
0.67 2605 35 1.3 4162 88 2.1
0.78 1788 79 4.4 2872 109 3.8
+ 1,000 psi = 6.895 MPa

21
Table 4 -Compressive Strength of Concrete as a Function of Water to Cementitious Ratio for Mix C (20% Class F Fly Ash)
Water/ Cementitious
Ratio
C O M P R E S S I V E S T R E N G T H, p s i +
7 days 28 days
Mean S.D.* C.V.* Mean S.D.* C.V.*
0.27 392 18 4.5 475 18 3.7
0.32 973 113 11.6 1063 55 5.2
0.37 1953 80 4.1 2462 46 1.9
0.47 2664 29 1.1 3348 46 1.4
0.57 2922 29 1.0 4010 49 1.2
0.67 1973 85 4.3 2880 123 4.3
0.77 1676 30 0.17 2388 124 5.2
0.87 1125 90 8.0 2194 70 3.2
0.97 1250 78 6.3 1647 340 20.7
1.22 684 35 5.2 1326 75 5.7
1.47 531 60 11.3 930 92 9.9
1.72 417.5 9 2.1 767 25 3.3
1.97 248 32 12.8 556 9 1.6
2.47 199 27 13.8 357 48 13.4
2.97 149 17 11.4 252 36 14.3
3.97 105 16 14.8 251 49 19.5
4.97 53 21 40.1 78 8 9.8
+ 1,000 psi = 6.895 MPa

22
Table 5 -Compressive Strength of Concrete as a Function of Water to Cementitious Ratio for Mix D (40% Class F Fly Ash)
Water/ Cementitious
Ratio
C O M P R E S S I V E S T R E N G T H, p s i +
7 days 28 days
Mean S.D.* C.V.* Mean S.D.* C.V.*
0.27 414 19 4.5 573 20 3.6
0.32 703 47 6.7 1045 42 4.1
0.37 1767 263 14.9 2699 119 4.4
0.47 1955 61 3.1 3420 90 2.6
0.57 1819 8 0.42 3047 63 2.1
0.67 1417 33 2.3 1972 97 4.9
0.77 1271 31 2.5 2017 43 2.1
0.87 1004 66 6.5 1413 74 5.3
0.97 800 48 6.0 1443 150 10.4
1.22 598 31 5.1 973 13 1.3
1.47 293 4 1.2 588 79 13.5
1.73 313 25 7.9 560 13 2.4
1.97 280 31 11.2 508 93 18.2
2.47 103 3 2.8 278 8 2.7
2.97 95 15 15.8 312 76 24.5
3.97 83 4 4.3 205 91 44.5
4.97 48 4 7.4 123 15 11.9
+ 1,000 psi = 6.895 MPa
23
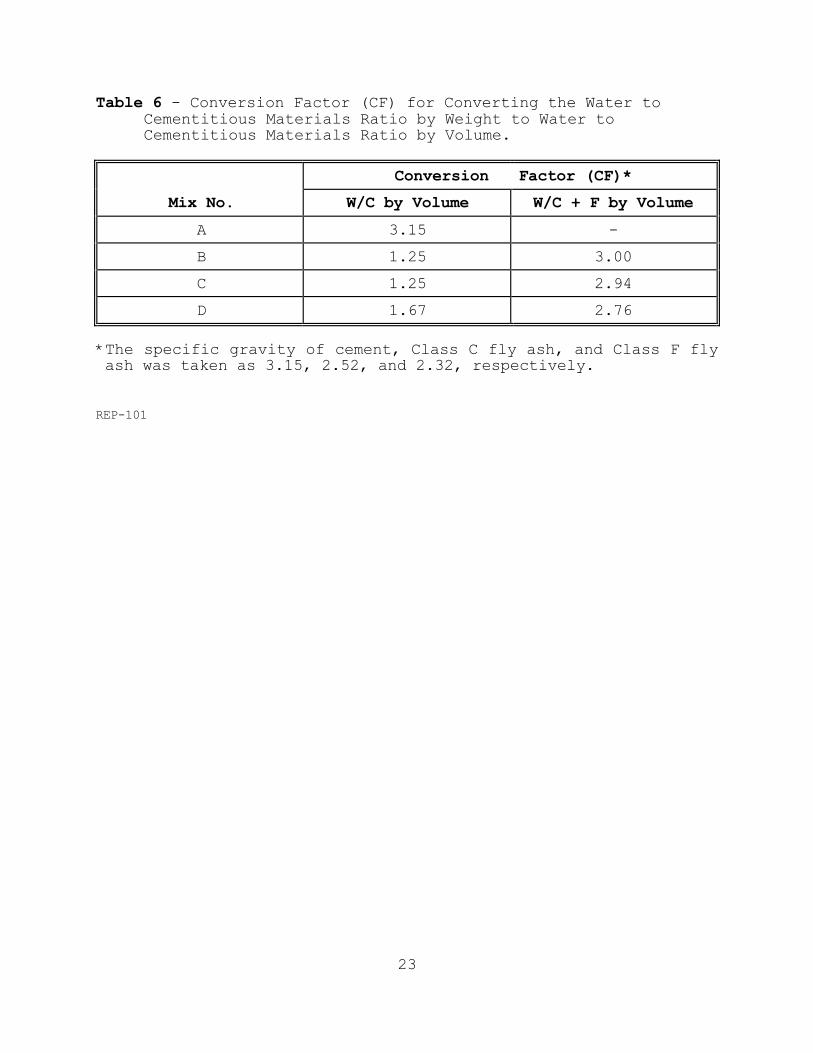
Table 6 - Conversion Factor (CF) for Converting the Water to Cementitious Materials Ratio by Weight to Water to Cementitious Materials Ratio by Volume.
Conversion Factor (CF)*
Mix No. W/C by Volume W/C + F by Volume
A 3.15 -
B 1.25 3.00
C 1.25 2.94
D 1.67 2.76
*The specific gravity of cement, Class C fly ash, and Class F fly ash was taken as 3.15, 2.52, and 2.32, respectively.
REP-101