effects of viral enrichment on the mortality and growth of ... · effects of viral enrichment on...
TRANSCRIPT
I
Vol. 18: 1-13.1999 1 AQUATIC MICROBIAL ECOLOGY Aquat Microb Ecol l Published July 16
Effects of viral enrichment on the mortality and growth of heterotrophic bacterioplankton
Rachel T. Noble1.*, Mathias Middelboe2, Jed A. Fuhrman'
'University of Southern California, AHF 107, University Park, Los Angeles, California 90089-0371, USA ' ~ a r i n e Biological Laboratory. University of Copenhagen, Strandpromenaden 5, DK-3000 Helsingar, Denmark
ABSTRACT: The direct effects of viral enrichments upon natural populations of marine viruses and bacteria were studied in seawater from Santa Monica Bay, CA. USA. Active virus concentrates, or con- trol additions (ultrafiltered seawater or autoclaved virus concentrate) were added to 2 1 incubations of protist-free seawater, and the effects were monitored for about 3 d. At the beginning of the experi- ments, the virus numbers reflected the expected addition of intact virus particles as determined by transmission electron microscopy (TEM). Subsequently, the mean frequency of visibly infected bacte- ria [FVIB; % bacteria which were visibly infected with 5 or more virus-like particles) was greater in the enriched incubations than in the controls. In controls, the estimated percent of bacteria that were infected remained constant at about S to 10% of the total bacterial population, but with active enrich- ment, 10 to 35% of the total bacterial population was infected at a given time. Therefore, by increasing the concentration of active viruses in seawater incubations we were able to increase the amount of bac- terial mortality attributed to virus infection. Even with the presumed increase in bacterial mortality, the net increases in bacterial abundance in the samples that were enriched with active virus concentrate were higher than those seen in the controls. The viral abundance in bottles that were enriched with the active virus concentrate was significantly higher than that in the controls in Expts 2 and 3 (p < 0.05), but by the end of the experiments, viral abundances in the enriched incubations approached control levels. In Expts 1 and 2, rates of DOP hydrolysis were higher in the samples enriched with the active virus con- centrate, and may have been due to an increase in the incidence of viral lysis. However, overall analy- sis of DCAA, DFAA, and DOP hydrolysis were quite variable and difficult to interpret. Results indicate that viral enrichment increased the incidence of bacterial infection and consequently stimulated the growth of subpopulations of non-infected heterotrophic bacterioplankton.
KEY WORDS: Virus Bacteria - Infection. Dissolved organic matter
INTRODUCTION
Viruses are now known to be abundant throughout the world's oceans (e.g. Proctor et al. 1988, Bergh et al. 1989, Proctor & Fuhrman 1990, Cochlan et al. 1993, Fuhrman & Suttle 1993, Weinbauer & Peduzzi 1994, Weinbauer et al. 1995, Noble & Fuhrman 1998). Viruses can have a significant impact on the cycling of organic matter in the pelagic microbial food web as they are capable of contributing to as much as half of the heterotrophic bacterial mortality in coastal waters
' E-mail: [email protected]
8 Inter-Research 1999
(Fuhrman & Noble 1995). In contributing to the mortal- ity of specific populations of bacterioplankton and phytoplankton by cell lysis and to the growth of non- infected cells, viruses exert both positive and negative controls over microbial communities. On the whole, viral infection of bacteria is thought to shift more pro- duction and respiration toward the bacteria, effectively creating a 'short circuit' of carbon flow between the bacterial, viral, and dissolved organic carbon (DOC) components (Bratbak et al. 1990, 1992, Proctor & Fuhr- man 1990, Fuhrman 1992).
Temporal variations in virus abundance and produc- tion have been observed in a few studies (e.g. Bratbak et al. 1990, Weinbauer et al. 1995) and have been

2 Aquat Microb Ecol 18: 1-13, 1999
found to vary widely under different conditions. Brat- bak et al. (1990) suggested that short-term fluctuations in abundances of free viruses and planktonic bacteria indicated the importance of viruses in controlling bac- terial growth. However, it was also suggested that many of the newly produced virus particles rapidly dis- integrate upon release into seawater and do not go on to infect another host (Bratbak et al. 1990, 1992, 1994, 1996). Since numbers of viral particles are relatively constant in specific environments of the world's oceans (Wommack et al. 1992, Boehme et al. 1993, Cochlan et al. 1993, Steward et al. 1996), we might expect that where rates of viral production by lytic infection are relatively high, rates of viral degradation are also high (Steward et al. 1992, Weinbauer et al. 1995). Both pro- duction and loss processes are directly related to (but not limited to) the relative abundance of available host bacteria (Wilcox & Fuhrman 1994), whether for lytic infection (production) or for degradation of virus parti- cles by heat labile material and particles (loss) (Mitchell & Jannasch 1969, Noble 1998). Also, studies have shown that the loss of viral infectivity occurs at rates on the order of 1 to 20% h-', that different rates of decay of infectivity occur for different viruses, and that decay is dependent upon the environmental and bio- chemical conditions of the water column (Suttle &
Chen 1992, Suttle et al. 1992, Suttle & Chan 1993, Noble & Fuhrman 1997).
Technically, there are multiple hurdles to overcome in estimating the direct effects of viral infection on the growth and survival of bacterioplankton in natural sys- tems (Suttle 1994). First, culture-based studies, such as those described by Suttle & Chen (1992), Suttle et al. (1992), Middelboe et al. (1996), and Noble & Fuhrman (1997), are limited in their interpretation of processes occurring in natural systems due to the low proportion of the total bacteria in the ocean that are cultivatible (Staley & Konopka 1985). Even if culture-based studies were possible for all virus-host systems, we would not be able to mimic the changing environmental condi- tions. Second, from a marine biogeochemical point of view, viruses are operationally defined as a component of the pool of dissolved organic matter (DOM), as most of them pass through a 0.45 pm pore size filter and are often included in measurements of dissolved DNA (D- DNA) (Paul et al. 1991, Bsrsheim 1993, Weinbauer et al. 1993). Successful lytic infection of bacterial host cells and subsequent cell lysis releases cell contents and newly made virus particles into the water column. These products of lytic infection, i.e. D-DNA, RNA, proteins, dissolved free amino acids (DFAA), dissolved combined amino acids (DCAA), carbohydrates, and intact virus particles are rich in C, N, and P and are usable by non-infected bacterioplankton for growth (Paul et al. 1989, Jerrgensen et al. 1993, Jerrgensen &
Jacobsen 1996, Middelboe et al. 1996). Even though we can measure quantities of DOM that may originate from viral infection, it is still difficult to trace this mate- rial through the microbial food web. One way of deter- mining virus-mediated effects is to increase the rela- tive number of infectious particles in the seawater sample of interest, therefore increasing the number of potential encounters between virus and host.
Concentrates of the virus-sized fraction of seawater have been used previously to study the role of viruses in marine microbial communities (Proctor & Fuhrman 1990, 1992, Suttle et al. 1990, Suttle 1992, Peduzzi &
Weinbauer 1993a, Weinbauer & Peduzzi 1995). Suttle et al. (1990) showed that when particles ranging from 2 to 200 nm were concentrated from seawater samples and then added back into fresh seawater, primary pro- duction was reduced by as much as 78 %. Studies such as this, and one by Bratbak et al. (1993), have focused upon the importance of viruses in controlling algal populations, but have speculated that other substances in the concentrates might be responsible for some of the effects. Experimental studies of the complex nature of bacteria-virus interactions, which involve both the fate of the viral matter and the impacts of viruses on bacterial mortality and growth and nutrient cycling, have also been performed (Proctor & Fuhrman 1992, Weinbauer & Peduzzi 1995, Middelboe et al. 1996). Here, we have used natural viral populations concen- trated from seawater to moderately increase the virus concentrations in protist-free seawater samples. By fil- tering to remove protists from the seawater, we elimi- nated the loss factor of heterotrophic bacteria due to grazing, which is a significant component of the bacte- rial mortality (McManus & Fuhrman 1988, Pace 1988, Fuhrman & Noble 1995), and focused directly upon the effects of viral infection. We observed changes in the frequency of visibly infected bacteria (FVIB) and bac- terial abundance while minimally perturbing the sys- tem. In addition, we have measured the uptake and concentrations of seawater components such as DFAA, DCAA, and dissolved organic phosphate (DOP) to pro- vide estimates of turnover in the heterotrophic bacteri- oplankton. This is the first study of this type that has incorporated not just an active enrichment and a con- trol, but also an autoclaved enrichment to assess the difference between enriching with active infectious viruses versus heat inactivated virus material.
MATERIALS AND METHODS
Sample collection and concentration. Samples were collected in an acid-rinsed bucket, from Santa Monica Pier, CA, USA (34 05' N, 118 30' W) , transported to the University of Southern California, and processed

Noble et al.: Effects of viral enrichment 3
within 30 min. All 3 experiments were performed in February 1995.
To make a virus concentrate, 80 1 of seawater was serially pressure filtered through 142 mm diameter Gelman A/E and 142 mm diameter 0.22 pm pore size Millipore filters. Both filters were mounted in stainless steel filter holders which were attached to a 40 1 stain- less steel pressure filtration vessel (<l00 kPa). The fil- trate was ultraconcentrated with a 30 kD n~olecular weight cut-off spiral cartridge concentration unit (SY130, Amicon, Inc.). The final volume of the spiral cartridge concentrate was ca 200 ml, and was further concentrated to ca 20 m1 with Centriprep 30 concen- tration units (Amicon, Inc.). A small portion of this high n~olecular weight concentrate (HMWC) was retained and fixed with 2 % formalin (final conc.) and stored at 4°C for analysis by transmission electron microscopy (TEM). Half of the remaining HMWC material was autoclaved for 25 min to inactivate the virus particles (referred to as AHMWC). Ultrafiltrate, which was used for the control addition (referred to as UF control), was 0.02 pm filtered permeate from the spiral cartridge concentration system.
Seawater to be used for the experiment was taken from the same location at the same time, and stored at ambient seawater temperature until 1 h before the start of the experiment. At this time, the seawater was gravity filtered, first through a 47 mm Gelman A/E glass fiber filter and then through a 47 mm, 0.6 pm pore size Nuclepore filter, to remove protists. The fil- trate and the incubations were subsequently spot checked for the presence and growth of protists; none were found. To ensure that the filtered seawater for the incubations was homogenous, the filtrate was collected in 1 large container and then equally distributed into 2 l polycarbonate Nalgene sample containers.
The general experimental design involved incuba- tions of the 0.6 pm filtered seawater with additions of either UF control seawater, AHMWC, or HMWC. In the first experiment, there were the following 4 treat- ments: (1) an UF control (at the same volume as the 2- fold HMWC), (2) 2-fold enrichment with HMWC, (3) 5- fold enrichment with HMWC, or (4) 2-fold enrichment with AHMWC (autoclaved material added at the same volume as the 2-fold HMWC enrichment, see Table 1). By knowing the original virus concentration of the sea- water, the concentration factor, and with an assumed 50 % recovery of virus particles, volumes of virus con- centrate were added to approximate the 2- and 5-fold enrichments. The first experiment was a preliminary examination of the effects of the treatments and error within the methods, as the treatments were not repli- cated. Because there was not an apparent difference between the results with the 2- and 5-fold HMWC enrichments in the first experiment, and because our attempt was to minimally perturb the system, the sec- ond and third experiments involved 3 treatments in replicate bottles: 0.6 pm filtered seawater to which was added (1) an UF control, (2) 2-fold HMWC enrichment or (3) 2-fold AHMWC enrichment (Table 1). Subsam- ples for all measurements were taken by pouring into sterile sample tubes.
Virus and bacterial counts. Viruses and bacteria were counted by ultracentrifugation (120000 X g, 3 h, 20°C) of 4 m1 seawater samples (2% formalin-pre- served) onto carbon stabilized Formvar-coated 200 mesh copper grids (Ted Pella, Inc.) (Bsrsheim et al. 1990, Cochlan et al. 1993). Grids were then stained with 1 % uranyl acetate for 30 S. Viruses and bacteria were enumerated on a JEOL 100 CXII TEM. Taper cor- rections were implemented into the final calculations (Mathews & Buthala 1970, Suttle 1993). Viruses and
Table 1. Abundances (*SDI of viruses and bacteria and concentrations of the dissolved organic matter (DOM) compounds mea- sured in high molecular weight concentrate (HMWC) enriched, autoclaved HMWC (AHMWC) enriched and ultrafiltrate (UF) control incubations in 3 experiments immediately following enrichment. VA: viral abundance (n = 20); BA: bacterial abundance (n = 20); DFAA: dissolved free amino acids (n = 3); DCAA: dissolved combined amino acids (n = 3); DOP: dissolved organic phos
phate (n = 3); PO,: total phosphate (n = 3)
Expt Treatment
1 UF control 2-fold AHMWC 2-fold HMWC 5-fold HMWC
2 UF control 2-fold AHMWC 2-fold HMWC
3 UF control 2-fold AHMWC 2-fold HMWC
DFAA (nM)
126 (10) 138 (4) 136 (13) 165 (13)
135 (26) l06 (6) 102 (7)
210 (14) 73 (1) 90 (7)
DCAA (nM)
303 (39) 291 (52) 284 (30) 215 (91)
395 (6) 374 (27) 440 (41)
689 (82) 524 (36) 705 (8)
DOP (nM)
269 (142) 525 (87) 129 (116) 260 (130)
796 (522) 320 (155) 974 (96)
527 (7 3) 843 (27) 547 (189)
PO, Temp (nM) ("C)
608 (267) 17.2 462 (122) 535 (195) 413 (73)
170 (6) 16.5 246 (27) 164 (27)
329 (13) 17.0 371 (24) 342 (26)
4 Aquat Microb Ecol 18: 1-13, 1999
bacteria were counted on quadruplicate grids at 27OOOx and lOOOOx (80 keV), respectively. More than 200 cells or viruses were counted per grid. Each HMWC was examined by adding 50 p1 of the concen- trate to 3.95 m1 of 0.02 pm filtered seawater, and fol- lowing the method outlined above.
The FVIB was determined by looking through bacte- rial cells at higher accelerating voltage (100 keV), and observing virus-shaped particles within bacteria, as described by Weinbauer et al. (1993). Only those bac- teria which were stained lightly enough to enable some visualization of the cell's interior were consid- ered for counting. Bacteria were counted as infected if they contained 5 or more virus-like particles. More than 500 bacterial cells were counted for each sample. Quadruplicate grids were counted to determine an average value of FVIB. Average values are reported with the standard deviations of quadruplicate counts.
Acridine orange direct counts (AODC) of bacteria (Hobbie et al. 1977) were also performed for each sam- ple by filtering formalin-preserved (2% final concen- tration) seawater samples onto black 0.2 pm pore size filters (Nuclepore), and staining with 0.1 % (w/v) acri- dine orange. Slides were counted by epifluorescence microscopy under green excitation with an Olympus Vanox microscope.
For consistency, bacterial abundances reported in this paper were determined by TEM using the same grids from which the virus counts and FVIB determina- tions were made. The total proportion of the bacterial population which was infected was calculated using the FVIB numbers and the total bacterial abundances as determined by TEM. The ratio of AODC to TEM bacterial counts was determined for each experiment and was 0.94 + 0.1 (mean -t SD, n = 8) in Expt 1, 0.99 * 0.06 in Expt 2, and 0.99 * 0.03 in Expt 3. Net changes in bacterial abundance were est~mated from TEM counts by point to point calculations of bacteria gain or loss over time, and are reported as cells 1-' d-' Virus production was estimated using the % FVIB, multi- plied by a conversion factor of 5.0 (middle conversion factor reported by Weinbauer & Peduzzi unpubl, for same method) to account for the total portion of the bacterial population which was infected at that time (since intact virus particles are only visible inside the cell a small fraction of the time), multiplied by the bac- terial abundance and an average assumed burst size of 20 viruses produced per infected bacterial cell (Brat- bak et al. 1992, Fuhrman & Noble 1995, Guixa- Boixareu et al. 1996)
Bacterial growth rates. The thymidine incorporation method was modified from Fuhrman & Aza.m (1982). At each time point, duplicate 42 m1 samples and l % for- malin-killed controls were subsampled into well-rinsed sterile 50 m1 polypropylene tubes (VWR brand). Sam-
ples were inoculated with 5 nM (3H-methyl) thymidine (obtained from Dupont New England Nuclear). Sub- samples were incubated in the lab at seawater temper- ature in a fluorescent-lighted (during daytime, dark at night) incubator. After 30 min incubations, duplicate 20 m1 samples from each tube were filtered through HAWP Millipore filters (mixed cellulose acetate and cellulose nitrate, 0.45 pm nominal pore size) in cold stainless steel filtration funnels on a 10-place manifold (Hoefer Scientific), then filtration valves were closed and 2 m1 ice-cold 5% trichloroacetic acid (TCA) was added. After 2 min, the TCA was filtered through and the filters and funnels were rinsed 3 times with 1 m1 of cold 5 % TCA, then the funnels were removed and the edge of the filters was rinsed 3 times with 1 m1 5 % TCA. Filters were placed in a glass 20 m1 vial and 1 m1 1 N HC1 was added, followed by heating to 90-100°C in an oven for 1 h (to hydrolyze the nucleic acids). After the vials cooled, 5 m1 Ecoscint (National Diagnostics) was added and the samples were counted by liquid scintil- lation with dpm correction (Packard). Conversion fac- tors used to calculate production from the moles of thymidine incorporated were the averages reported in Fuhrman & Azam (1982) at 2 X 10¹⁸ cells produced per mole thyrnidine incorporated. Results of these measure- ments indicated unexpected problems with isotope di- lution in the enriched samples, and were deemed unus- able. We used the bacterial abundance results to calculate the net gain or loss in the bacterial popula- tions over time (see 'Virus and bacterial counts').
Amino acid assimilation. Assimilation of DFAA was determined by incubation of subsamples with a mix- ture of [3H]-labeled amino acids (Amersham), specific activity of -50 Ci mmol-l. Two hundred nCi (corre- sponding to about 0.4 nM amino acids) was added to 10 m1 triplicate subsamples and I killed control (2% formalin, final conc.) and incubated for 0.3 to 1 h (this allowed uptake of ca 10% of the added tracer). The incubations were stopped with 2% formalin (final conc.). Samples were filtered onto 0.2 pm cellulose nitrate filters (Whatman), rinsed 3 times with Milli-Q water (Millipore) and radioassayed by liquid scintilla- tion counting (LSC). Respiration of [3HJ-labeled amino acids during the incubation was assumed to be 50% of the assimilation (Middelboe et al. 1995).
Turnover of DCAA and DOP was estimated by the use of the fluorogenic substrate analog L-leucine-4- methyl-coumarinylamide hydrochloride (Leu-MCA) and 4-methylumbelliferyl phosphate (MUF-P), respec- tively (Middelboe et al. 1995, 1996). Triplicate 1 m1 subsamples were incubated with 500 nM Leu-MCA or 500 nM MUF-P (final conc.) for 2 to 8 h, and the turnover rate of the substrates was calculated from the increase in fluorescence caused by the enzymatic hydrolysis of the non-fluorescent substrates to the
Noble et al.. Effects of viral enrichment 5
highly fluorescent products 7-amino-4-methyl-cou- marin (AMC) and 4-methylumbelliferone (MUF). It is uncertain as to whether these additions represent additions at a tracer level. The increase in fluorescence was linear with time for the incubation times used. Background fluorescence at time zero was measured for each triplicate sample. A Spectrovision FD 200 (Chelmsford, MA, USA) fluorometer was used for the fluorescence measurements. Total DCAA hydrolysis was estimated from the concurrent measurement of the rate of Leu-MCA turnover and the actual concen- tration of DCAA. Likewise, total DOP hydrolysis was estimated from measurements of MUF-P turnover and DOP concentrations. The calculated hydrolysis of DCAA and DOP, thus, provide an estimate of the actual DCAA and DOP hydrolysis based upon the turnover rate of labeled substrate and the concentra- tion of total substrate at each time point. The estimates of total DCAA and DOP hydrolysis during the whole incubation (integrated over the incubation period) are presented for each treatment (Table 3). I t should be noted, however, that these estimates can only be con- sidered as rough approximations of the actual hydroly- sis rates. Since the addition of 500 nM Leu-MCA and MUF-P caused a 2- to 4-fold increase in the actual con- centration of DCAA and DOP (Table 1) the estimated rates may represent an overestimation of the actual hydrolysis of substrate. Consequently, variations in the natural substrate concentrations during the incubation may affect the degree of saturation of the enzymes with artificial substrate, and therefore the measured rates. However, assuming that net changes in natural substrate concentration are small relative to the bulk concentration, it is reasonable to believe that the esti- mated values are comparable within each experiment, although the values of DCAA and DOP turnover may not represent the actual hydrolysis rates.
Chemical analysis. For measurements of DFAA, DCAA, and DOP concentration, triplicate subsamples of 50 m1 were filtered through 0.2 pm sterile filters (Sartorius, Inc.) and stored frozen. Concentrations of DFAA were measured by high performance liquid chromatography (HPLC) and pre-column derivatiza- tion with o-phthaldialdehyde (Lindroth & Mopper 1979, Jsrgensen et al. 1993). For measurements of DCAA, 1 m1 subsamples were freeze-dried and hydro- lyzed in vapor phase under nitrogen atmosphere for 20 min at 150°C by a microwave technique (Jsrgensen & Jensen 1997). The hydrolyzed material was re- dissolved in borate buffer at pH > 10 to obtain optimal o-phthaldialdehyde reaction, and the total amino acid concentration in the sample was quantified by HPLC. For measurements of the concentration of total dis- solved phosphorus, 125 mg potassium peroxydisulfate was added to 10 m1 subsamples and autoclaved (121°C, 45 min) to hydrolyze the organic P to PO, (Koroleff 1968). The phosphate concentration was then measured photometrically by standard procedures (Strickland & Parsons 1972). The DOP concentration was calculated by subtraction of PO4 concentrations in the untreated samples from the PO4 concentration in the hydrolyzed samples.
Statistical analyses. Analyses of results in Expt 1 al- lowed a preliminary examination of the differences be- tween the treatment bottles, and the use of different methods. Analyses of results between treatment bottles in Expts 2 and 3 were performed using a repeated mea- sures ANOVA with the use of Sigma Statistical soft- ware. To isolate the group or groups that were different from the others, the authors used a multiple comparison procedure called the Student-Newman-Keuls Method. All results reported as 'statistically significant' reflect p < 0.05. Results for FVIB in Table 2 are mean values over the entire duration of the experiments.
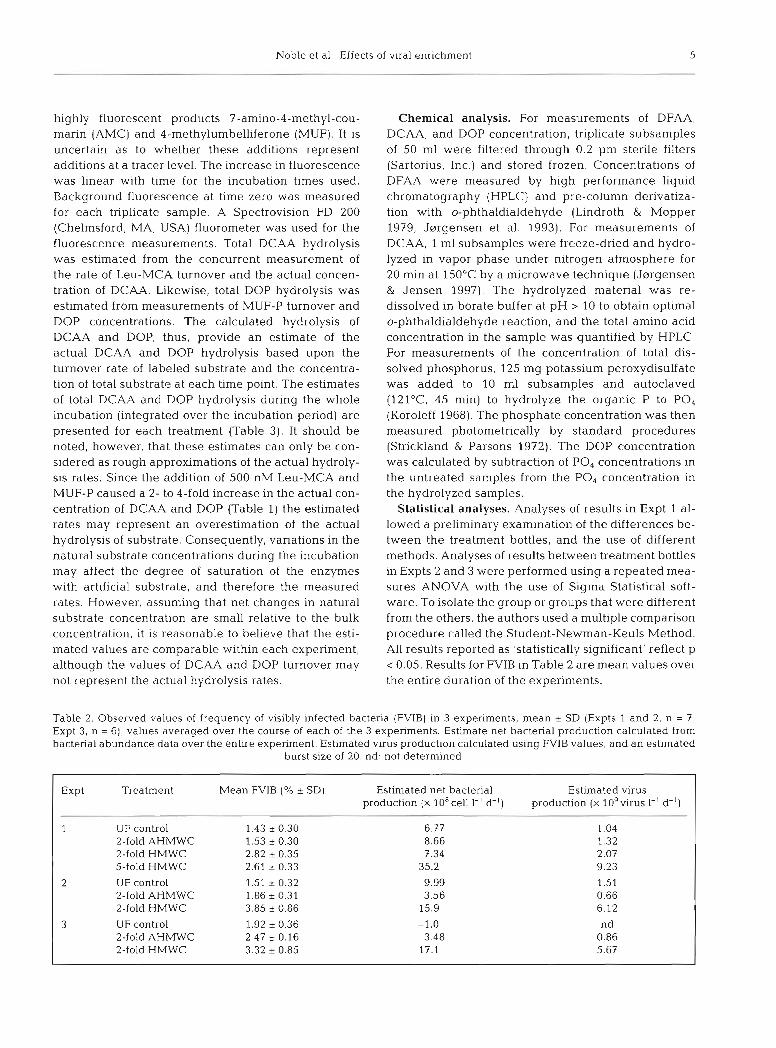
Table 2. Observed values of frequency of vlsibly infected bacteria (FVIB) in 3 experiments, mean i SD (Expts 1 and 2, n = 7; Expt 3, n = 6), values averaged over the course of each of the 3 experiments. Estimate net bacterial production calculated from bacterial abundance data over the entire experiment. Estimated virus production calculated using FVIB values, and an estimated
burst size of 20. nd: not determined
I Expt
Treatment Mean FVIB (% i SD) Estimated net bacterial Estimated virus production (X 108cell 1-' d-') production (X 109virus I-' d-l)
1 UF control 1.43 + 0.30 6.77 1.04 2-fold AHMWC 1.53 i 0.30 8.66 1.32 2-fold HMWC 2.82 * 0.35 7.34 2.07 5-fold HMWC 2.61 * 0.33 35.2 9.23
UF control 2-fold AHMWC 2-fold HMWC
UF control 2-fold AHMWC 2-fold HMWC

6 Aquat Microb Ecol 18: 1-13, 1999
RESULTS cally range from 1 to 7 X 10⁷ and 0.8 to 6 X 10⁶ ml-l, respectively (Noble 1998).
Santa Monica Bay, CA, is a mesotrophic system char- acterized by surface coastal water temperatures that range between 14 and 23"C, chlorophyll a concentra- Viral abundance tions that typically range from 1 to 5 pg 1-', and rates of primary production that range from 0.411 to 1.254 g C In all 3 experiments, the virus abundance at 0 h re- m-2 &l (Small et al. 1989). Viral and bacterial abun- flected the expected ennchments (Fig. lA,B,C). The dances in the coastal waters of Santa Monica Bay typi- first experiment was performed by enriching seawater
with either HMWC, which approximated
6.0 2- and 5-fold increases in virus abun- dance, AHMWC, or UF control (Table 1). Virus counts at 0 h reflected that the at- tempted 5-fold enrichment in Expt 1
L 4.0 caused an actual increase in viral abun-
E dance by a factor of 5.5. In all 3 experi- V)
2 ments, the 2-fold enrichments increased .- > the actual virus abundance by a range of
h
o factors from 2.2 to 3.1. Additionally, with 2.0
X the 5-fold HMWC enrichment, the results were not obviously different from the 2- fold enrichment. Subsequently, Expts 2
0 and 3 involved only 2-fold HMWC enrich- ments (Table 1).
the concentrated virus material was Fig. 1 Changes In viral abundance over time in Expts 1 (A), 2 (B) , and 3 (C) (A) Ultrafiltrate ("F) control; ( W ) 2-fold high molecular weight concentrate 'lumped and'or sticky' thus making it ( H W C ) ennched; (o) 5-fold HMWC ennched; (A) 2-fold autoclaved more Onto parti-
0
HMWC (AHMWC) enriched cles and surfaces. However, the resulting
In the first experiment, measurements of virus abundance suggested differences between the enriched and control treat- ment bottles. In Expts 2 and 3, virus abun- dances were significantly higher in the HMWC-enriched samples compared to the UF control and the AHMWC-enriched samples (p < 0.05). Autoclaving of the HMWC appears to structurally destroy virus particles because the virus abun- dances in the AHMWC-enriched samples were similar to those in the UF controls in
2.0 1 B
major fraction of the viruses to bacterial host cells, possibly indicating the initia-
41
tion of infection, as the FVIB was at one of 0 15 30 45 60 "
the highest points of any of the 3 experi- time (hours) ments at 20 h at 4 .6%. It is possible that
-
L
all 3 experiments (Fig. lA,B,C).
f 0.5
In Expt 1, virus abundances in the 2- and the 5-fold HMWC-enriched samples dropped over the time course to near con- trol levels (Fig. 1A). In Expt 3, virus abun- dances demonstrated a drastic drop to near control levels within about 10 h, to only 1/3 of their abundance at time 0 (Fig. 1C). The dramatic decline in viral numbers may be from adsorption of a
3.0 1 C
i t
Noble et al.: Effects of viral enrichment 7
rebound in virus numbers to the original levels in the HMWC incubation suggests that virus infection occurred to replenish the viral numbers.
Frequency of visibly infected bacteria
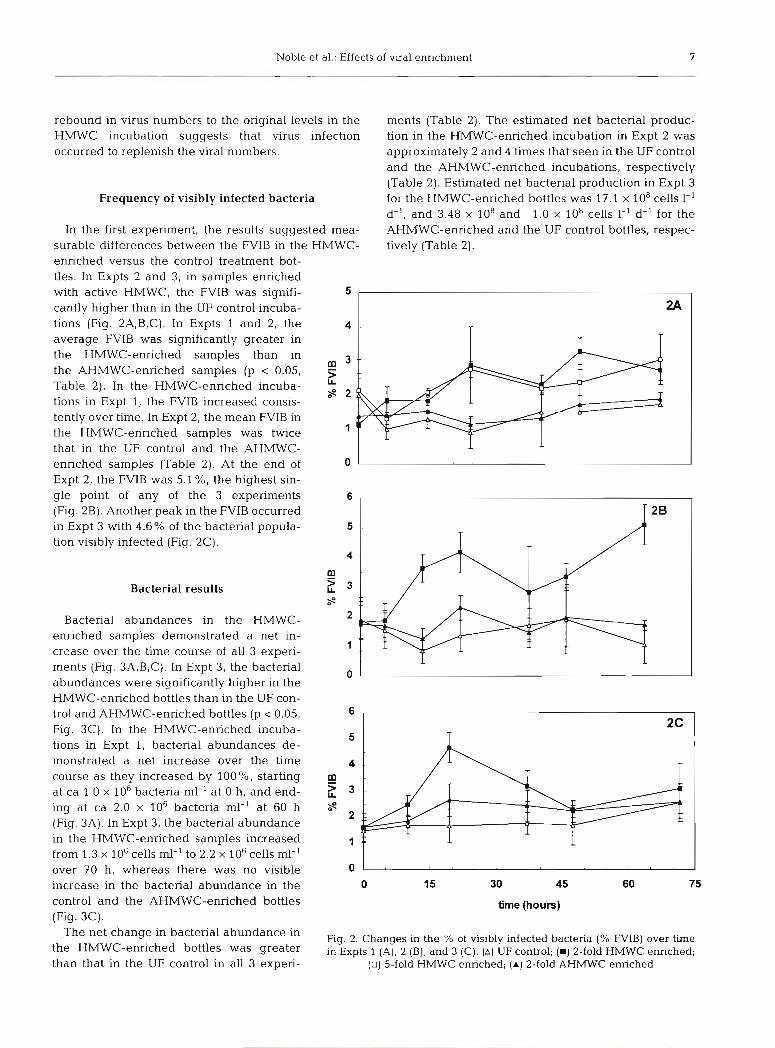
In the first experiment, the results suggested mea- surable differences between the FVIB in the HMWC- enriched versus the control treatment bot- tles. In Expts 2 and 3, in samples enriched with active HMWC, the FVIB was signifi- cantly higher than in the UF control incuba- tions (Fig. 2A,B,C). In Expts 1 and 2, the average FVIB was significantly greater in the HMWC-enriched samples than in the AHMWC-enriched samples (p 0.05, Table 2). In the HMWC-enriched incuba- tions in Expt 1, the FVIB increased consis- tently over time. In Expt 2, the mean FVIB in the HMWC-enriched samples was twice that in the UF control and the AHMWC- enriched samples (Table 2). At the end of Expt 2, the FVIB was 5.1 %, the hghest sin- gle point of any of the 3 experiments (Fig. 2B). Another peak in the FVIB occurred in Expt 3 with 4.6% of the bacterial popula- tion visibly infected (Fig. 2C).
Bacterial results
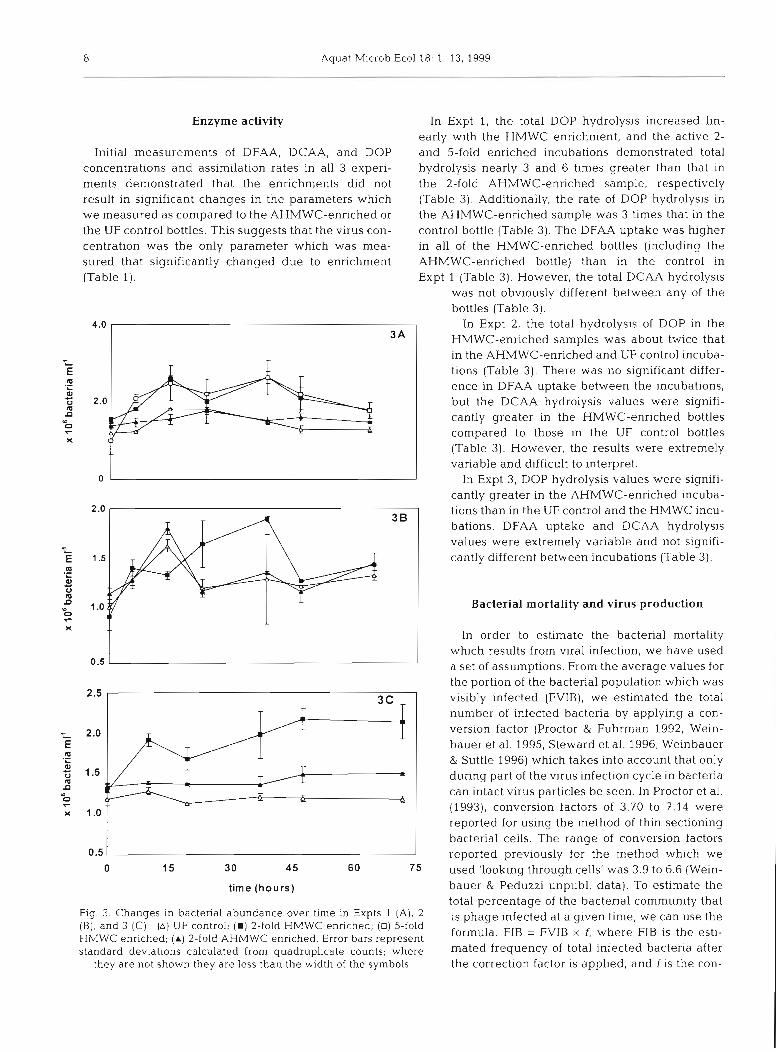
Bacterial abundances in the HMWC- enriched samples demonstrated a net in- crease over the time course of all 3 experi- ments (Fig. 3A,B,C). In Expt 3, the bacterial abundances were significantly higher in the HMWC-enriched bottles than in the UF con- trol and AHMWC-enriched bottles (p c 0.05, Fig. 3C). In the HMWC-enriched incuba- tions in Expt 1, bacterial abundances de- monstrated a net increase over the time course as they increased by loo%, starting at ca 1.0 X 10⁶ bacteria ml-' at 0 h, and end- ing at ca 2.0 X 10⁶ bacteria ml-' at 60 h (Fig. 3A). In Expt 3, the bacterial abundance in the HMWC-enriched samples increased from 1.3 X 10⁶ cells rnl-' to 2.2 X 10⁶ cells ml-' over 70 h, whereas there was no visible increase in the bacterial abundance in the control and the AHMWC-enriched bottles (Fig. 3C).
The net change in bacterial abundance in the HMWC-enriched bottles was greater than that in the UF control in all 3 experi-
ments (Table 2). The estimated net bacterial produc- tion in the HMWC-enriched incubation in Expt 2 was approximately 2 and 4 times that seen in the UF control and the AHMWC-enriched incubations, respectively (Table 2). Estimated net bacterial production in Expt 3 for the HMWC-enriched bottles was 17.1 X 10⁸ cells 1-' d-', and 3.48 X 10⁸ and -1.0 X 10⁸ cells 1-' d-' for the AHMWC-enriched and the UF control bottles, respec- tively (Table 2).
time (hours)
Fig. 2. Changes in the % of visibly infected bacteria (% FVIB) over time in Expts 1 (A), 2 (B), and 3 (C). (A) UF control; ( W ) 2-fold HMWC enriched;
(U) 5-fold HMWC enriched; ( A ) 2-fold AHMWC enriched
8 Aquat Microb Ecol 18. 1-13, 1999
Enzyme activity In Expt 1, the total DOP hydrolysis increased lin- early with the HMWC enrichment, and the active 2-
Initial measurements of DFAA, DCAA, and DOP and 5-fold enriched incubations demonstrated total concentrations and assimilation rates in all 3 experi- hydrolysis nearly 3 and 6 times greater than that in ments demonstrated that the enrichments did not the 2-fold AHMWC-enriched sample, respectively result in significant changes in the parameters which (Table 3). Additionally, the rate of DOP hydrolysis in we measured as compared to the AHMWC-enriched or the AHMWC-enriched sample was 3 times that in the the UF control bottles. This suggests that the virus con- control bottle (Table 3). The DFAA uptake was higher centration was the only parameter which was mea- in all of the HMWC-enriched bottles (including the sured that significantly changed d u e to enrichment AHMWC-enriched bottle) than in the control in (Table 1). Expt 1 (Table 3). However, the total DCAA hydrolysis
was not obviously different between any of the bottles (Table 3).
4.0 In Expt 2, the total hydrolysis of DOP in the HMWC-enriched samples was about twice that
7
L
in the AHMWC-enriched and UF control incuba- E tions (Table 3). There was no significant differ- m .- L Q
ence in DFAA uptake between the incubations, - 0 2.0 m
but the DCAA hydrolysis values were signifi- n
m cantly greater in the HMWC-enriched bottles 0 7
Y compared to those in the UF control bottles (Table 3). However, the results were extremely variable and difficult to interpret.
o In Expt 3, DOP hydrolysis values were signifi- cantly greater in the AHMWC-enriched incuba-
2 .O tions than in the UF control and the HMWC incu- ba t ion~ . DFAA uptake and DCAA hydrolysis values were extremely variable and not signifi-
L
E 1.5 cantly different between incubations (Table 3). m .- L Q - v m D
W 1 .0 Bacterial mortality and virus production E
time (hours)
X
0.5
Fig. 3 Changes in bacteria1 abundance over tlrne in Expts 1 (A) , 2 (B), and 3 (C) (A) UF control; ( W ) 2-fold HIVWC enriched, (0) 5-fold HMWC enriched; ( A ) 2-fold AHMWC enr~ched . Error bars represent standard deviations calculated from quadruplicate counts; where
they are not shown they a re less than the width of the symbols
number of infected bacteria by applying a con- version factor (Proctor & Fuhrman 1992, Wein- bauer et al. 1995, Steward et al. 1996, Weinbauer & Suttle 1996) which takes into account that only during part of the virus infection cycle in bacteria can intact virus particles be seen. In Proctor et al. (1993), conversion factors of 3.70 to 7.14 were reported for using the method of thin sectioning bacterial cells. The range of conversion factors reported previously for the method which we used 'looking through cells' was 3.9 to 6.6 (Wein- bauer & Peduzzi unpubl. data). To estimate the total percentage of the bacterial community that is phage infected at a given time, we can use the formula. FIB = FVIB X f, where FIB is the esti- mated frequency of total infected bacteria after the correction factor is applied, and f is the con-
a set of assumptions. From the average values for the portion of the bacterial population which was
2.5 1 3 c - I visibly infected (FVIB), w e estimated the total
L
In order to estimate the bacterial mortality which results from viral infection, we have used

Noble et al.. Effects of viral enr~chn~ent 9
Table 3. Total hydrolysis of dissolved organic phosphorus (DOP), uptake of dissolved free amino acids (DFAA), and total hydrol- ysis of dissolved combined amino acids (DCAA) integrated over the period of the entire incubation (mean * standard deviation).
Expt 1: n = 3; Expts 2 and 3: n = 2
UF Control 2-fold AHMWC 2-fold HMWC 5-fold HMWC (autoclaved control)
Expt l DOP hydrolysis (nmol I-') 24.5 * 1.7 132 T 12 321 * 46 558 i 54 DFAA uptake (pm01 I-') 10.8 * 0.6 14.6 2 0.9 13.4 * 0.9 13.7 i 0.8 DCAA hydrolysis (nmol I-') 89.5 t 6.5 110 * 5.0 101 * 5.0 109 i 6.0
Expt 2 DOP hydrolysis (nmol I-') 49 i 12 72 i 40 174 t 49 DFAA uptake (1.1mo1 I-') 20.5 i 3.1 29.9 -t 3.2 25.1 * 3.9 DCAA hydrolysis (nmol I-') 188 i 5.0 247 k 22 327 80
Expt 3 DOP hydrolysis (nrnol 1-') 68 * 31 366 * 110 160 i 10 DFAA uptake (pm01 I-') 11.0 i 1.5 5.72 * 0.76 11.8 i 2.0 DCAA hydrolysis (nmol l-l) 128 i 57 245 -+ 26 164 i 6.0
version factor used. We used a middle conversion were in the same range as values reported previously factor of 5.0. In the UF control samples, the calculated for Southern California waters, ranging from about percent of the bacterial population which was phage 0.7 to 9.2 X 10' virus 1-' d-' (Steward et al. 1992). In infected ranged from 7.2 to 9.6%; in the AHMWC- enriched incubations, rates of virus production were 2 enriched samples the range was 7.7 to 12.4 %, and in to 6 times those rates seen in unenriched incubations the HMWC-enriched samples from 13.1 to 19.3%. (Table 2). These values fall well within the range of those reported in the literature (Suttle 1994). To estimate the total mortality of the bacterial population the percent- DISCUSSION age values reported above would simply be doubled to reflect that when bacteria undergo binary fission, only We have demonstrated that addition of a virus con- 1 daughter cell survives to divide again (Proctor & centrate to a natural seawater sample directly influ- Fuhrman 1990), e.g. in the HMWC-enriched samples enced the heterotrophic bacterial population. By en- 26.2 to 38.6 % of the total mortality was attributable to riching seawater samples to increase virus abundances viruses. To determine the rate of virus production we to just 2-fold over normal concentrations, we have can use the FIB, an assumed burst size, and an esti- been able to stimulate the incidence of infection in the mate of the latent period, the doubling time (Proctor et heterotrophic bacterial population relative to controls. al. 1993, Steward et al. 1996, Weinbauer & Suttle There was no significant difference in viral abun- 1996). The calculation would follow the form of: V = dance between the AHMWC-enriched samples and FIB/Dt X v, where V = virus production, FIB = total the UF control samples, indicating that some drastic infected bacteria, Dt = doubling time estimated using physical breakdown of virus particles occurred during bacterial production values, and v = burst size. In Proc- the autoclaving of the enrichments (Fig. lA,B,C). It is tor et al. (1993) a comparison was made between the likely that autoclaving denatures the protein coats of latent period and the doubling time (Dt) of specific the concentrated marine viruses. Autoclaving the virus/host systems and it was determined that they enrichment did not cause significant increases in con- were about equal, so the doubling time (usually about centrations of DFAA, DCAA, or DOP (Table l ) , but 1 d) used in the calculation here is a representation of may have caused increases in other parameters which the latent period. Bacterial lysis resulting from infec- were not measured. We chose autoclaving of the tion of marine bacteria results in the production of 20 to enrichment rather than alternative heat treatment as 100 new viruses per event (referred to as the 'burst previous research by M. Karner (pers. comm.) demon- size', Bratbak et al. 1992, Weinbauer & Suttle 1996). strated measurable extracellular enzyme activity in Here, the assumed value for v will be 20, based upon seawater even after boiling or microwaving for up to TEM observations, and a burst size of 20 was used in 10 min. Fuhrman & Noble (1995). We did not observe increases in viral abundances in
Estimates of virus production for the 3 experiments the HMWC-enriched incubations as we might have reveal that rates of virus production in the samples expected from an increased incidence of bacterial
10 Aquat Microb Ecol 18: 1-13, 1999
infection. Virus numbers increased only once in the HMWC-enriched incubations, between the second and third time point in Expt 3. Also, near the end of each of the 3 experiments (about 3 d), virus abun- dances in the HMWC-enriched incubations ap- proached the abundances in the control incubations. The destruction rate of the viruses exceeded the pro- duction rate of the viruses. It is likely that the number and activity of host cells in the incubations that were enriched with the active virus concentrates was not high enough to balance virus production with the con- comitant processes that cause viral decay. In the actively enriched incubations, bacteria and/or phyto- plankton may have been responsible for increased production of enzymes that degrade viral proteins and nucleic acids. It has been suggested previously that healthy picoplankton are capable of exuding a mucus type substance to indirectly protect them from virus infection (Murray 1995), and it is also quite possible that viral enrichment triggers bacterial production of exoenzymes necessary for metabolism of degraded virus components. On the production side, it is also possible that many of the viruses added in the enrich- ments did not have a corresponding host in the seawa- ter incubations and that the burst size of the bacteria in our incubations was quite small relative to reported burst sizes in cultured bacteria. Marine bacteria are often much smaller in seawater than their cultured counterparts are in the laboratory, and therefore the bacteria in seawater may produce much fewer phages per cell infection event. As mentioned previously, the burst size which we assumed (20 virus particles per lysed cell) is on the low end of some which have been reported in the past (Bratbak et al. 1992, Weinbauer & Peduzzi 1994), but is relatively high to others that have been reported by Kokjohn et al. (1991), who argued that burst sizes were 5 to 7 phage per lysed cell in nat- ural waters, and were 27 to 65 phage per cell in full medium. Our assumed value is between these reported values, is supported by TEM observations, and was used for bacterial mortality estimates in the same waters (Fuhrman & Noble 1995). Of the newly produced virus particles, it is likely that few go on to infect yet another host, and most are probably de- graded and used by heterotrophic bacteria as a growth substrate. For example, if we assume that virus pro- duction occurred at an average rate of about 1.5 X 10⁵ virus ml-' h-' in the 2-fold HMWC-enriched incubation in Expt 1 (Table 2), then the degradation/removal of virus particles would have occurred at a rate of 2.0% h-' to result in the observed abundance. In the 5-fold enriched incubation, using an estimated virus produc- tion of about 4 X 10⁵ ml-' h-', the average degradation rate would have been 3.4 % h-'. These rates of removal of virus particles included processes of degradation (by
enzymes and other bioactive molecules) and adsorp- tion (onto bacterial cells, container walls and sticky macromolecules), and similar to rates of loss of infec- tivity and rates of degradation reported previously in the literature (ranges from about 1 to 20% h-', e.g. Bratbak et al. 1990, 1992, Suttle & Chen 1992, Suttle et al. 1992, Suttle & Chan 1993, Wommack et al. 1996, Noble & Fuhrman 1997, Noble 1998).
We were concerned that the concentration process might destroy the virus particles. However, by TEM analysis, our active HMWC appeared to contain intact and distinctly recognizable free virus particles, which were stained similarly to free viruses in the control samples. In addition, viruses were the most abundant particle type in the concentrates. Arguably, it is possi- ble that we have added some inactivated viruses to our experiments and other heat-labile high molecular weight bioactive material as has been reported by Sut- tle et al. (1992). However, even though all of the virus particles in the HMWC enrichments may not have been infectious upon addition to the seawater samples, the resulting FVIB values indicate the likelihood that at least a portion of the viruses were infective.
Even though the enrichment of seawater with virus concentrate would be likely to directly increase the frequency of bacterial cells which are infected, it has been suggested in the past that this type of enrichment may induce lysogens in the bacterial populations into the lytic phase (Weinbauer & Peduzzi 1995). Thus, in the enriched samples, if induction occurred we might have also observed a higher FVIB. However, if induc- tion occurred in a major fraction of the bacterial popu- lation, we would have expected there to be a crash in the bacterial population, and an ensuing increase in viral numbers (Jiang & Paul 1996), but neither occurred. It is possible that lysogens were induced in a small percentage of the population, but based on the work of Wilcox & Fuhrman (1994) it is likely that the predominant mode of infection was lytic.
We also found that even with an increased viral abundance, which resulted in a subsequent increase in the FVIB, the total bacterial abundance also increased. Bacterial mortality due to virus infection is a process which is controlled mainly by the encounter rate be- tween the virus and its host (Murray & Jackson 1992). In this system, where protist-mediated bacterial mor- tality was eliminated, we increased the number of potential virus to bacteria encounters, and thus in- creased the incidence of viral infection. However, it appears that growth of the non-infected bacterial pop- ulation was also stimulated. The net increases in bac- terial abundance were greater in the HMWC-enriched samples than those in the control incubations (Table 2). This increase suggests that the growth rate of the bac- terial population was higher than the mortality. These

Noble et al.: Effec :ts of viral enrichment 11
heightened rates of bacterial production may be the result of the use of lytic infection products as substrates for growth by non-infected bacteria (Lammers 1992, Middelboe et al. 1996). The growth of bacterial cells in the control incubations may have been limited by a nutrient that was otherwise found in sufficient amounts in the enriched incubations, or may have suf- fered from reduced host density, and a lower incidence of viral infection, due to the filtration to remove the protists. Alternatively, it has been previously specu- lated that the ultraconcentration process results in col- loid aggregation and particle formation (Paul et al. 1991). Not only would this material not be detected in measurements of DCAA, DFAA, or DOP due to the fact that it is present in the greater than 0.2 pm size frac- tion, but it would also be disrupted by autoclaving (Paul et al. 1991). It is possible that particle formation from the ultraconcentration process created a pre- ferred growth substrate for bacteria in those incuba- tions that were HMWC-enriched. The formation of particles could also provide surfaces for nutrient accu- mulation and create microzones that supported bacte- rial growth (Azam & Ammerman 1984).
With these enrichment experiments, we might have expected an increase in the bacterial growth rate, but it is not completely obvious why the total bacterial abundance would increase. This type of increase has also been reported by Weinbauer & Peduzzi (1995), Lammers (1992) and Peduzzi & Weinbauer (1993b). It is possible that the non-infected cells that grow at the expense of the infected cells are smaller (have a lower carbon content), i.e. that biomass is not increasing as suggested in Middelboe et al. (1996). Previous reports, such as Middelboe et al. (1996) suggest that the bacte- rial growth efficiency of non-infected cells in a virus- enriched incubation is lower than cells not subjected to virus enrichments. It may be that the input of labile viral lysates favors growth of some small, fast-growing bacteria. Lammers (1992) observed the same phenom- enon, although he did not comment on why he found a net increase in the bacterial population in virus amended cultures when growing on the same sub- strate as the control population without viruses.
Even though our measurements of amino acid and phosphate hydrolysis were difficult to interpret, there is weak evidence that enrichment caused an increase in rates of hydrolysis of DOP and DCAA and rates of DFAA uptake (Table 3). There was not a demonstrated increase in the levels of DOP directly attributed to the enrichments, but in Expts 1 and 2, we demonstrated that enzymatic breakdown of organic P was stimulated in seawater with active viral enrichments (Table 3). It is possible that these experiments behaved much like experiments reported by Zweifel et al. (1993), where the authors suggested that a P addition enhanced cell
division. It has also been reported by Poindexter (1987) that P availability regulates cell production rather than biomass production. An input of P from viral lysis or from enzyme enrichment in the HMWC-enriched bottles may have caused a similar enhancement of cell division and thus an increase in bacterial nunibers, with a possible decrease in bacterial cell size. In Wein- bauer & Peduzzi (1995), arguments on the release and recycling of nutrients by bacteria were based upon net changes in concentrations which may not reveal some of the direct effects of viral infection. The autoclaved enrichments may also have been chemically altered, in which case the enrichments were different both in viral activity and chemical content. Alternatively, per- haps the HMWC-enriched incubations contained heightened concentrations of active, free extracellular enzymes, which hydrolyzed the DOM into more labile components that were taken up by heterotrophic bac- teria, whereas in incubations that were enriched with AHWMC such enzymes were inactivated or destroyed by autoclaving. Free extracellular enzymatic activity is usually insignificant compared with the particle associ- ated activity in marine waters, (e.g. Hoppe 1983, Rosso & Azam 1987, Delmas et al. 1994), and the observed enzymatic activities were probably mainly associated with the bacteria.
Within this system, where protists have been re- moved, and where concentrations of viruses have been purposefully increased, there are discrepancies in pro- duction (growth and virus replication) measurements and loss (bacterial mortality and virus decay) measure- ments that indicate the effects of virus-mediated pro- cesses. We have focused upon the impact that natural virus populations have on natural bacterial assem- blages, and have shown that as little as a 2-fold increase in viral numbers is enough to affect the bacte- rial community. We have also demonstrated that an autoclaved virus enrichment does not elicit the same effects, indicating the likelihood that the results were due to viral infection processes and not just enrichment of seawater with available hydrolysable DOM. There is evidence from our experiments that viral activity increased both the levels of bacterial mortality and the total number of bacterial cells and we attribute this to heightened viral infection. Also, addition of virus con- centrates to seawater might have influenced the com- position of the bacterial community and consequently the degradation and transformation of DOM. Clearly, research on processes mediated by viruses indicates that they are not only important to bacterial and algal mortality (Fuhrman & Suttle 1993, Suttle 1994, Fuhr- man & Noble 1995) but that they also play potentially important roles in the release and recycling of C, N and P in the oceans (Weinbauer & Peduzzi 1995, Middelboe et al. 1996). Continued advancements in
12 Aquat Microb Ecol 18: 1-13, 1999
methods t o directly assess t h e rates of virus infection, virus production, a n d effects of viruses on bacterial mortality will permit a more complete understanding of t h e role of viruses i n the 'microb~al loop'.
Acknowledgements. We thank N. 0. G. Jsrgensen for assis- tance with the AA measurements. Work by M.M was sup- ported by the Danish Strategic Environmental Research Pro- gramme, the Carlsberg Foundation, the Beckett Foundation. and the Danish Pasteur Society. Research by R.T.N. was sup- ported by NSF Grant #OCE-9634028, the Danish Research Academy, the ARCS Foundation, and USC Sea Grant.
LITERATURE CITED
Azam F, Ammerman JW (1984) Flows of energy and nutrients in marine ecosystems Plenum Press, New York
Bergh O, Bsrsheim KY, Bratbak G, Heldal M (1989) High abundance of viruses found in aquatic environments. Nature 340:467-468
Boehme J , Frischer ME, Jiang SC, Kellogg CA. Pichard S, Rose JB, Steinway C, Paul JH (1993) Viruses, bacterio- plankton, and phytoplankton in the southeastern Gulf of Mexico: lstribution and contribution to oceanic DNA pools. Mar Ecol Prog Ser 97:l-10
Bersheirn KY (1993) Native marine bacteriophages. FEMS Microbiol Ecol 102:141-159
Bsrsheim KY, Bratbak G, Heldal M (1990) Enumeration and biomass estimation of plankton~c bacteria and viruses by transmission electron microscopy. Appl Environ Microbiol 56:352-356
Bratbak G, Heldal M, Norland S, Thingstad TF (1990) Viruses as partners in spring bloom microbial trophodynamics. Appl Environ Microbiol56:1400-1405
Bratbak G, Heldal M, Thingstad TF, Riemann B, Haslund OH (1992) Incorporation of viruses into the budget of microbial C-transfer. A first approach. Mar Ecol Prog Ser 83:273-280
Bratbak G. Egge JK, Heldal M (1993) Viral mortality of the marlne alga EmJliana huxleyi (Haptophyceae) and termi- nation of algal blooms. Mar Ecol Prog Ser 93:39-48
Bratbak G, Thingstad F, Heldal M (1994) Viruses and the microbial loop. Microb Ecol28:209-221
Bratbak G , Heldal M, Thingstad TF, Tuomi P (1996) Dynamics of vlrus abundance in coastal seawater FEMS Microbiol Ecol 19(4):263-269
Cochlan WP, Wikner J , Steward GF, Smith DC, Azam F (1993) Spatial distribution of viruses, bacteria and chlorophyll a in neritic, oceanic and estuarine environments. Mar Ecol Prog Ser 92:77-87
Delmas D. LeGrand C. Bechenun C, Collinot C (1994) Exo- proteolytic activity determined by flow injection analysis: its potential importance for bacterial growth in coastal marine ponds. Aquat Living Resour 7:17-24
Fuhrman JA (1992) Bacterioplankton roles In cycling of organlc matter. the microbial food web. In. Falkowski PG. Woodhead AD (eds) Primary productivity and biogeo- chemical cycles in the sea. Plenum Press, New York. p 361-383
Fuhrman JA, Azam F (1982) Thymidine incorporation as a measure of heterotrophic bacterioplankton production in marine surface waters: evaluation and field results. Mar Biol 66:109-120
Fuhrman JA, Noble RT (1995) Viruses and protists cause simllar bacterial mortality in coastal seawater. Limnol Oceanogr 40(7):1236-1242
Fuhrman JA. Suttle CA (1993) Viruses in marine planktonic systems. Oceanography 6:5 1-63
Guixa-Boixareu N, Calderon-Paz JI, Heldal M, Bratbak G, Pedros-Alio C (1996) Viral lysis and bacterivory as pro- karyotic loss factors along a salinity gradient. Aquat Microb Ecol 11:215-227
Hobbie JE, Daley RJ. Jasper S (1977) Use of Nuclepore filters for counting bacteria by fluorescence microscopy. Appl Environ Microbiol 33:1225-1228
Hoppe HG (1983) Sign~flcance of exoenzymatic activities in the ecology of brackish water: measurements by means of methylumbelhferyl-substrates. Mar Ecol Prog Ser 11: 299-308
Jiang SC, Paul JH (1996) Occurrence of lysogenic bacteria in marine microbial communities as determined by pro- phage induction. Mar Ecol Prog Ser 142:27-38
Jergensen NOG, Jacobsen CS (1996) Bacterial uptake and utilization of dissolved DNA. Aquat Microb Ecol 11. 263-270
Jsrgensen NOG, Jensen RE (1997) Determination of dis- solved combined amino acids using microwave assisted hydrolysis and HPLC precolumn derivatization for labelling of primary and secondary amines. Mar Chem 57: 287-297
Jsrgensen NOG, Kroer N, Coffin RB, Yang XH, Lee C (1993) Dissolved free amino acids, combined amino acids, and DNA as sources of carbon and nitrogen to marine bacteria. Mar Ecol Prog Ser 98:135-148
Kokjohn TA, Sayler GS, Miller RV (1991) Attachment and replication of Pseudornonas aeruginosa bacteriophages under conditions simulating aquatic environments. J Gen Microbiol 137:661-666
Koroleff F (1968) Determination of total phosphorus in natural waters by means of persulfate oxidation. ICES Coun Meet U33.209-212
Lammers WT (1992) Stimulation of bacterial cytokinesis by bacteriophage predation. Mar Freshw Biol 235:261-265
Lindroth P. Mopper K (1979) High performance liquid chro- matographic determinations of subpicomole amounts of amlno acids by precolumn fluorescence derivatization with o-phthaldialdehyde. Anal Chem 51:1667-1674
Mathews J, Buthala DA (1970) Centrifugal sedimentation of virus particles for electron microscope counting. J Virol 5(5):598-603
McManus GB, Fuhrman J A (1988) Control of marine bacteri- oplankton populatlons: measurement and s~gnificance of grazing. Hydrobiologia 159:5 1-62
Middelboe M, Borch NH, Kirchman DL (1995) Bacterial uti- lization of dissolved free amino acids, dissolved combined amino acids, and ammonium in the Delaware Bay estuary. effects of carbon and nitrogen limitation. Mar Ecol Prog Ser 128:109-120
Middelboe M, Jsrgensen NOG, Kroer N (1996) Effects of viruses on nutrient turnover and growth efficiency of non- infected marine bacterioplankton. Appl Environ Microbiol 62.1991-1997
Mitchell R, Jannasch HW (1969) Processes controlling virus inactivation in seawater. Environ Sci Technol3:94 1-945
Murray AG (1995) Phytoplankton exudation: exploitation of the microbial loop as a defence against algal viruses. J Plankton Res 17(5):1079-1094
Murray AG, Jackson GA (1992) Viral dynamlcs a model of the effects of size, shape, motion and abundance of single- celled planktonic organisms and other particles. Mar Ecol Prog Ser 89:103-116
Noble RT (1998) Fate of viruses in the marine environment. PhD thesis, University of Southern California, Los Angeles

Noble et al.: Effects of viral enrichment 13
Noble RT, Fuhrman JA (1997) Virus decay and its causes in coastal waters Appl Environ Microbiol63(1):77-83
Noble RT, Fuhrman JA (1998) Use of SYBR Green I for rapid epifluorescence counts of marine viruses and bacteria. Aquat Microb Ecol 14(2):113-118
Pace ML (1988) Bacterial mortality and the fate of bacterial production. Hydrobiologia 159:41-49
Paul JH, Jeffrey WH, David AW. DeFlaun MF, Cazares LH (1989) Turnover of extracellular DNA in eutrophic and oligotrophic environments of southwest Florida. Appl Environ Microbiol 55: 1823- 1828
Paul JH, Jiang SC, Rose J B (1991) Concentration of viruses and dissolved DNA from aquatic environments by vortex flow filtration. Appl Environ Microbiol 5?(8):219?-2204
Peduzzi P, Weinbauer MG (1993a) Effect of concentrating the virus-rich 2-200 nm size fraction of seawater on the for- mation of algal flocs (marine snow). Limnol Oceanogr 38: 1562-1565
Peduzzi P, Weinbauer MG (1993b) The submicron size frac- tion of seawater containing high numbers of virus parti- cles as bioactive agent in unicellular plankton community successions. J Plankton Res 15:1375-1386
Poindexter JS (1987) Bacterial response to nutrient limitation. In: Fletcher M, Gray TRG. Jones JG (eds) Ecology of microbial communities. Cambridge University Press, Lon- don, p 283-317
Proctor LM, Fuhrman JA (1990) Viral mortality of marine bac- teria and cyanobacteria. Nature 343:60-62
Proctor LM, Fuhrman JA (1992) Mortality of marine bacteria in response to enrichments of the virus size fraction from seawater. Mar Ecol Prog Ser 87:283-293
Proctor LM, Fuhrman JA, Ledbetter MC (1988) Marine bacte- riophages and bacterial mortality. EOS Trans Am Geophys Union 69:1111-1112
Proctor LM, Okubo A, Fuhrman JA (1993) Calibrating esti- mates of phage induced mortality in marine bacteria: ultrastructural studies of marine bacteriophage develop- ment from one-step growth experiments. Microb Ecol 25: 161-182
Rosso AL, Azam F (1987) Proteolytic activity in coastal oceanic waters: depth distribution and relationship to bac- terial populations. Mar Ecol Prog Ser 41:231-240
Small LF, Landry MR, Eppley RW, Azam F, Carlucci AF (1989) Role of plankton in the carbon and nitrogen budgets of Santa Monica Basin, California. Mar Ecol Prog Ser 56: 57-74
Staley JT, Konopka A (1985) Measurement of in situ activities of nonphotosynthetic microorganisms in aquatic and ter- restrial habitats. Annu Rev Microbiol 39:321-346
Steward GF, Wikner J , Cochlan WP, Smith DC, Azam F (1992) Estimation of virus production in the sea: 11. Field results. Mar Microb Food Webs 6(2):?9-90
Steward GF, Smith DC, Azam F (1996) Abundance and pro- duction of bacteria and viruses in the Bering and Chukchi Sea. Mar Ecol Prog Ser 131:28?-300
Strickland JDH, Parsons TR (1972) A practical handbook of
Editorial responsibility: Farooq Azam, La Jolla, California, USA
seawater analysis. Fish Res Board Canada, Ottawa Suttle CA (1992) Inhibition of photosynthesis in phytoplank-
ton by the submicron size fraction concentrated from sea- water. Mar Ecol Prog Ser 8?:105-112
Suttle CA (1993) Enumeration and isolation of marine viruses. In: Kemp PF, Sherr BF, Sherr EB, Cole J J (eds) Current methods in aquatic microbial ecology. Lewis Publishing, Boca Raton, p 121-134
Suttle CA (1994) The significance of viruses to mortality in aquatic microbial communities. Microb Ecol28:237-243
Suttle CA, Chan AM (1993) Marine cyanophages infecting oceanic and coastal strains of Svnechococcus: abundance, morphology, cross-infectivity, and growth characteristics. Mar Ecol Prog Ser 92:99-109
Suttle CA, Chen F (1992) Mechanisms and rates of decay of marine viruses in seawater. Appl Environ Microbiol 58: 3721-3729
Suttle CA, Chan AM, Cottrell MT (1990) Infection of phyto- plankton by viruses and reduction of primary productivity. Nature 38?:467-469
Suttle CA, Chen F, Chan AM (1992) Marine viruses: decay rates, diversity and ecological implications. In: Nash CC I1 (ed) International Marine Biotechnology Conference 'IMBC-91': short communications of the invited lectures ecology. W Brown CO, Dubuque, IA, p 153-163
Weinbauer MG, Peduzzi P (1994) Frequency, size, and distri- butlon of bacteriophages in different marine bacterial morphotypes. Mar Ecol Prog Ser 108:ll-20
Weinbauer MG, Peduzzi P (1995) Effect of vlrus-rich high molecular weight concentrates of seawater on the dynam- ics of dissolved amino acids and carbohydrates. Mar Ecol Prog Ser 127:245-253
Weinbauer MG, Suttle CA (1996) Potential significance of lysogeny to bacteriophage production and bacterial mor- tality in coastal waters of the Gulf-of-Mexico. Appl Envi- ron Microbiol 62(12):43?4-4380
Weinbauer MG, Fuks D, Peduzzi P (1993) Distribution of viruses and dissolved DNA along a coastal trophic gradi- ent in the Northern Adriatic Sea. Appl Environ Microbiol 59(12):4074-4082
Weinbauer MG, Fuks D, Puskaric S, Peduzzi P (1995) Diel, seasonal, and depth-related variability of viruses and dis- solved DNA in the Northern Adriatic Sea. Mlcrob Ecol30: 25-41
Wilcox RM, Fuhrman JA (1994) Bacterial viruses In coastal seawater: lytic rather than lysogenic production. Mar Ecol Prog Ser 114:35-45
Wommack KE, Hill RT, Kessel M, Russek-Cohen E, Colwell RR (1992) Distribution of viruses in Chesapeake Bay. Appl Environ Microbiol58:2965-2970
Wommack KE, Hill RT, Muller TA, Colwell RR (1996) Effects of sunlight on bacteriophage viability and structure. Appl Environ Microbiol62(4): 1336-1341
Zweifel UL, Norrman B, Hagstrom A (1993) Consumption of dissolved organic carbon by marine bacteria and demand for inorganic nutrients. Mar Ecol Prog Ser 101:23-32
Submitted: December 9, 1997; Accepted: September 22, 1998 Proofs received from author@): July 6, 1999