effects of varying organic matter content on the
TRANSCRIPT

Effects of varying organic matter content on the development of 1
green roof vegetation: a six year experiment 2
3 Adam J. Bates a, *, Jon P. Sadler b, Richard B. Greswell b, Rae Mackay c 4
a Biosciences, School of Science & Technology, Nottingham Trent University, Clifton, 5
Nottingham, NG11 8NS 6
b Geography, Earth & Environmental Sciences, The University of Birmingham, 7
Edgbaston, Birmingham, B15 2TT, UK 8
c School of Engineering and Information technology, Federation University Australia, 9
Gippsland Campus, Victoria 3800, Australia 10
* Corresponding author. Tel.: +44 (0)115 8483126 11
E-mail addresses: [email protected] (A.J. Bates), [email protected], 12
[email protected], [email protected] 13
14
Abstract 15
Green roofs can potentially be used to tackle a variety of environmental problems, and 16
can be used as development mitigation for the loss of ground-based habitats. Brown 17
(biodiversity) roofs are a type of green roof designed to imitate brownfield habitat, but 18
the best way of engineering these habitats requires more research. We tested the effects 19
of altering organic matter content on the development of vegetation assemblages of 20
experimental brown (biodiversity) roof mesocosms. Three mulch treatments were 21
tested: (1) Sandy loam, where 10mm of sandy loam mulch (about 3% organic matter by 22
dry weight) was added to 100mm of recycled aggregate; (2) Compost, where the mulch 23
also contained some garden compost (about 6% organic matter by dry weight); and (3) 24
No mulch, where no mulch was added. Mesocosms were seeded with a wildflower mix 25
that included some Sedum acre, and vegetation development was investigated over a 26
six-year period. Species richness, assemblage character, number of plants able to seed, 27
and above-ground plant biomass were measured. Drought disturbance was an important 28
control on plant assemblages in all mulch treatments, but there were significant 29
treatment response interactions. The more productive Compost treatment was associated 30
with larger plant coverage and diversity before the occurrence of a sequence of drought 31
disturbances, but was more strongly negatively affected by the disturbances than the 32
two less productive treatments. We suggest that this was due to the over-production of 33
brought to you by COREView metadata, citation and similar papers at core.ac.uk
provided by Nottingham Trent Institutional Repository (IRep)

plant biomass in the more productive treatment, which made the plants more vulnerable 34
to the effects of drought disturbance, leading to a kind of ‘boom-bust’ assemblage 35
dynamic. The ‘ideal’ amount of added organic matter for these green roof systems was 36
very low, but other types of green roof that have a larger water holding capacity, and/or 37
more drought resistant plant floras, will likely require more organic matter or fertiliser. 38
Nonetheless, nutrient-supported productivity in green roof systems should be kept low 39
in order to avoid boom-bust plant assemblage dynamics. Research into the best way of 40
engineering green roof habitats should take place over a long enough multi-year time 41
period to include the effects of temporally infrequent disturbances. 42
Keywords brown roof; development mitigation; drought disturbance; productivity 43
diversity; recycled aggregate; succession 44
45
Highlights 46
Drought disturbance was a key factor influencing the green roof plant 47
assemblages 48
The assemblage response to drought disturbance was mediated by the 49
productivity of the system 50
Drought disturbance caused more reduction in plant coverage in the higher 51
productivity systems 52
A good understanding of green roof plant assemblages requires multiple years of 53
data 54
55
56 57 58
59 60
61
62
63 64 65 66 67
68 69

1 Introduction 70
71 Green roofs are associated with a wide range of potential environmental and 72
societal benefits including building insulation and cooling, improved roof materials 73
longevity, improved well-being, air pollution removal, reduced storm-water runoff, 74
urban cooling, and habitat provision (Bengtsson 2005, Brenneisen 2006, Mentens et al. 75
2006, Oberndorfer et al. 2007, Yang et al. 2008, Castleton et al. 2010, Francis and 76
Lorimer 2011, Rowe 2011, Rumble and Gange 2013, Li et al. 2014, Loder 2014). 77
Extensive green roofs use relatively thin (<20cm) growth substrates, and do not usually 78
require the substantial roof reinforcement and maintenance input often associated with 79
intensive green roofs (Oberndorfer et al. 2007). Therefore, extensive green roofs could 80
be installed on new-builds or retrofitted to existing buildings across wide areas, 81
potentially contributing to the alleviation of a range of environmental problems 82
(Dunnett and Kingsbury 2004, Getter and Rowe 2006). The approaches and materials 83
used to construct an extensive green roof will however strongly influence its 84
environmental benefits (Simmons et al. 2008, Bates et al. 2009, Rowe 2011). So, for 85
example, designing a roof to try and maximise its potential biodiversity benefit might 86
trade-off against its ability to delay and store storm water (Bates et al. 2009). 87
This research focuses on a type of extensive green roof designed mainly for 88
habitat creation, which are often called brown or biodiversity roofs (Gedge 2003, Grant 89
2006, Bates et al. 2013, 2015, Ishimatsu and Ito 2013). Brown roofs are designed to 90
replicate brownfield habitats, which are also known as derelict, post-industrial, or 91
wasteland sites. Because of the need for new development and their perceived low 92
visual appeal, brownfield sites are often lost to development (Harrison and Davies 2002, 93
Thornton and Nathanail 2005, Dallimer et al. 2011, Sadler et al. 2011, Hofmann et al. 94

2012). However brownfield habitats can be diverse and valuable wildlife habitats 95
(Gilbert 1989, Small et al. 2003, Woodward et al. 2003), and are now often considered 96
habitats worthy of conservation (Harrison and Davies 2002, Donovan et al. 2005). The 97
construction of brown roofs attempts to partially mitigate the loss of brownfield habitat 98
on the ground by creating brownfield habitats on roofs (Gedge 2003, Grant 2006, Sadler 99
et al. 2011). Brown roofs can be associated with rare species and diverse wildlife 100
assemblages (Brenneisen 2006, Kadas 2006, Francis and Lorimer 2011), but 101
moreresearch is required to properly understand which design approaches and 102
construction materials best support biodiversity. Vegetation takes time to establish on 103
green roofs, and many vegetation characteristics vary from season to season due to 104
periods of water shortage and successional processes, so medium and long-term 105
investigations of green roofs will likely generate more robust findings than short-term 106
ones (Köhler 2006, Dunnett et al. 2008, Köhler and Poll 2010, Nagase and Dunnett 107
2010, Rowe et al. 2012, Bates et al. 2013, 2015, Ishimatsu and Ito 2013, Lundholm et 108
al. 2014, Thuring and Dunnett 2014). 109
Like other types of green roofs, plant growth on brown roofs is strongly 110
controlled by characteristics of the growth substrate such as depth, porosity, water 111
retention, organic matter content, nutrient availability, and soil microbe assemblages 112
(Dunnett and Kingsbury 2004, Nagase and Dunnett 2011, Olly et al. 2011, Bates et al. 113
2013, 2015, Graceson et al. 2014b, Molineux et al. 2014). Well-designed brown roofs 114
share many of the substrate characteristics of brownfield habitat, such as containing 115
areas of bare ground, diverse substrate types and depths, and replication of brownfield 116
substrate characteristics (Brenneisen 2006, Kadas 2006, Bates et al. 2009, Madre et al. 117
2014). Brown roof substrates will therefore often be made up of recycled demolition 118

materials or industrial waste aggregates and include large clasts, which can limit water 119
holding capacity, making them vulnerable to drought disturbance (Kadas 2006, 120
Molineux et al. 2009, Bates et al. 2013, 2015). 121
Some theories predict that species diversity has a humped relationship with 122
productivity, is highest at low to intermediate levels of productivity, and that this varies 123
with disturbance regime (Grime 1973, Huston 1979, Michalet et al. 2006). However, a 124
wide variety of productivity - diversity relationships have been predicted and detected, 125
and there is also particular support for a positive monotonic relationship with 126
productivity (Abrams 1995, Mittelbach et al. 2001, Gillman and Wright 2006, Adler et 127
al. 2011). The main controls of plant productivity on green roofs are likely to be water 128
availability, and nutrient availability from fertiliser or organic matter. During long 129
periods of water shortage, substantial plant mortality can result, and a low productivity 130
due to a lack of water can become a drought disturbance. We believe that the interplay 131
of productivity and disturbance in both brown and green roof systems may well control 132
plant assemblage dynamics. Responses to productivity and disturbance are species 133
specific, and consideration of general life history strategies of plants, such as the 134
Competitive Stress-tolerant Ruderal strategies of Grime (1977) in green roof research 135
(Lundholm et al. 2014) have proved fruitful. 136
This document describes the effects over a six-year (medium-term) period, of 137
the experimental addition of two types of mulch on the diversity, character and amount 138
of brown roof vegetation. This experiment aimed to assess the relative suitability of the 139
two organic matter treatments for the growth of brownfield-like, wildflower vegetation 140
on green roof mesocosms. Specifically, our objectives were to test the effect of organic 141
matter content, time and weather conditions on the: species richness of the forb 142
assemblage, characteristics of that assemblage, ability of plant species to complete their 143
life-cycle (i.e. to seed), structure of the habitat (e.g. coverage of bare ground and moss), 144
and distribution of above-ground plant biomass in that assemblage. 145
2 Materials and methods 146
2.1. Study roof test array 147
The study site was at The University of Birmingham, UK (52΄΄27΄01.54΄΄N, 148
1΄΄55΄43.41΄΄W), which has a temperate maritime climate. The green roof test array was 149
installed on a flat 5-storey building roof and completed in May 2007. The edge of the 150
roof had a solid safety parapet of about 1.5m height, but due to the need to distribute 151
weight through the building support columns, the green roof mesocosms were elevated 152
about 1m above the roof and so were more directly exposed to wind and air circulation 153
above and below the mesocosms (Figure 1). This meant that the study mesocosms 154
would likely have different temperature and evapotranspiration regimes than if the 155
mesocosms had been sited on the roof surface. However, doing the same experiment on 156
a roof without a solid safety parapet, or on a roof of a different height might produce 157
similar differences in microclimate., andthe between-treatment findings should remain 158
robust. 159
Each mesocosm was separated by at least a 50cm air gap, meaning that plants 160
were only able to spread propagules between replicates via wind or bird movement. 161
Mesocosms were distributed using a stratified-randomised approach. Each column in 162
Figure 1 represented a strata, and the upper and lower half of the rows represented a 163
strata. Positions of treatments/controls were allocated randomly, providing no more than 164
three of each treatment/control were distributed in each strata. This approach equalised, 165
as far as possible, the effects of unwanted environmental variation (e.g. difference in 166
exposure to wind, and potential bias due to sampling order), but still allowed 167
randomisation within strata. 168
2.2. Study mesocosms 169
The study mesocosms were designed to replicate real extensive green roofs, with 170
drainage and filter layers underlying the different growth media treatments (Figure 2). 171
The mesocosm containers were built from 2.44x1.22m plywood sheets with 47mm wide 172
by 150mm deep timber sides, which were water-proofed and root-protected using 173
polyester reinforced PVC. The ‘egg-box’ drainage board that covered the floor of the 174
mesocosm container had fines filters at the top and bottom, and fines were prevented 175
from flowing around the edge of this board with the installation of an IKO filter fleece 176
around the edge. The mesocosms were on a 2 degree slope and drained in one corner 177
with a 50mm diameter domestic bath plug-hole. 178
Recycled crushed demolition aggregate (40mm down) was added to 179
approximately 100mm depth (approximately 110mm in the control, see below). This 180
aggregate was a material produced from the demolition of buildings that had been 181
stripped of glass, paint and other contaminants, with further treatment to remove silts 182
and clays. The material can be highly variable, but in this case was mainly concrete, 183
pebbles, brick, ceramics, and sand. Tests of leachate chemistry in the first year showed 184
that leachate pH did not vary between treatment and averaged 8.2 (unpublished results), 185
producing circumneutral to slightly alkaline growth conditions. The main coarse 186
crushed concrete component of demolition material, for the size make-up used in the 187
current study, typically absorbs about 2-4% water (Hansen 1992, Poon and Chan 2006), 188

so despite containing some brick and ceramics, the demolition aggregate had a 189
relatively limited moisture holding capacity. 190
For the two mulch treatments the substrate was topped with approximately 191
10mm of mulch. Both treatments and the control were surface seeded with the same, 192
mostly native, herbaceous seed mix used in the larger scale study of Bates et al. (2013), 193
at a density of around 1.6g per m2 (Supplementary Materials 1). The seed mix contained 194
some Sedum acre L. with the aim of facilitating improved neighbouring plant 195
performance (Butler and Orians 2011) during times of water deficit, although Lundholm 196
et al. (2014) did not find strong evidence for this effect. 197
Five replicates of two different treatments and a control were used in the study: 198
(1) Sandy loam, (2) Compost, and (3) No mulch control. ‘Sandy loam’ had a sandy 199
loam that contained about 3% organic matter (by dry weight) applied as mulch. The 200
mulch added in the ‘Compost’ treatment was a mix of this same sandy loam and mature 201
garden compost, which contained around 6% organic matter (by dry weight). The ‘No 202
mulch’ control had no mulch added. Whole profile substrate samples were taken after 203
the addition of the mulch for size analyses using dry sieving and loss on ignition at 550 204
oC for estimation of organic matter content. The organic matter content was 0.90% by 205
weight (95% confidence interval +/- 0.14, N = 5) for Compost, 0.58% by weight (95% 206
CI +/- 0.16, N = 5) for Sandy Loam, and 0.29% by weight (95% CI +/- 0.08, N = 5) for 207
No Mulch. The sediment size distribution of the three treatments varied little (Figure 3). 208
2.3. Vegetation surveys 209
We used several methods to survey the vegetation: (i) Domin-Krajina cover 210
abundance (Domin 1928, Krajina 1933) surveys over the whole six-year study period 211

(2007-12), which included measures of (a) total forb richness, and (b) the number of 212
forb species able to seed each year, (ii) point quadrat surveys, and (iii) biomass analysis 213
(ii and iii only in the final year of study, 2012). 214
2.3.1. Cover-abundance surveys 215
Seventeen cover-abundance surveys were carried out over 2007 to 2012. In 2007 216
and 2008 they were done at a higher temporal frequency to investigate seasonal changes 217
in vegetation cover. This was then reduced in the following years (2009-12) as the focus 218
became an analysis of inter-annual trends, with the timing of surveys designed to 219
coincide with the late spring/early summer peak in plant biomass (May to June) and the 220
period after most species had flowered and gone to seed (August to September). The 221
timing of surveys was also dependent on safe weather conditions and building access 222
(Supplementary Materials 2). 223
Cover-abundance surveys comprised both floristic and biostructural 224
components. For the floristic surveys all vascular plants, except graminoids, were 225
identified to species level where possible. The cover-abundance of each taxon in each 226
mesocosm was estimated by the same person (AJB) using the Domin-Krajina scale 227
(Supplementary materials 3). This semi-quantitative measure involved the rapid visual 228
estimation of abundance at low density, or cover at higher density, and although subject 229
to some degree of error it provided a good summary of the coverage of different taxa 230
(cf. Smartt et al. 1976). Species richness and details of which taxa had seeded or were 231
about to seed were also taken. The biostructural components measured were the Domin-232
Krajina cover-abundance of bare ground, moss, graminoids and forbs (Supplementary 233
materials 3). 234

2.3.2. Point quadrat surveys 235
Each mesocosm was surveyed twice in 2012 in the same two survey time 236
windows as the cover-abundance surveys. A 0.5 x 0.5m, 100-point quadrat (9.5% of the 237
total mesocosm area) was placed away from the edge of each mesocosm in an area 238
visually judged to be representative of the overall mesocosm. Forb species, moss, bare 239
ground and graminoids (graminoid cover was low so was not included in analyses) were 240
recorded if they occurred directly beneath the points of the quadrat. The data gathered in 241
this way were roughly equivalent to percent cover, however total cover could be over 242
100 due to layering of the different floristic and biostructural components (e.g. moss 243
underlying forb species). A comparative discussion of the two methods is included in 244
Supplementary Materials 4, but generally the two methods showed similar overall 245
patterns. 246
2.3.3. Biomass analyses 247
All above-ground growth of forbs and graminoids situated within the point 248
quadrats were harvested for analysis of biomass. Coverage of Sedum acre was less 249
spatially variable than other forb taxa, so it was harvested from a representative 250
0.25x0.25m quadrat from within the larger point quadrat. Taxa were oven dried at 50oC 251
until repeated weighing showed no further moisture loss (usually 2-4 days). S. acre and 252
Trifolium arvense did not lose all their moisture at this temperature, so were dried at 253
60oC. Biomass was recorded as g/m2. 254
2.4. Weather Data 255
Precipitation and air temperature data were taken from the Coventry: Coundon 256
(Latitude = 52.42N, Longitude = 1.53W; ~25km from the study site) UK 257

Meteorological Office MIDAS Land Surface Stations dataset. A weather station was 258
situated at the roof site from June 2007 to June 2008 inclusive, but the electronics were 259
destroyed by an electrical storm so no further data were gathered. The Coventry: 260
Coudon dataset showed good correlation with the roof dataset over this period with a 261
linear regression R2 of 0.998 for monthly average temperature, with an intercept of 262
minus 0.7oC (i.e. the roof was colder); and with a linear regression R2 of 0.939 for total 263
precipitation, with an intercept of 15.6mm (i.e. there was more rainfall on the roof, 264
probably mostly due to differences in the acoustic [roof] vs tipping bucket [Coventry: 265
Coudon] mechanism of the rainfall gages). Coventry: Coudon data from the study 266
period and the four previous years (2003-2012) were used as baseline data for 267
comparison with weather conditions in the study years. Total monthly precipitation, 268
average monthly temperature and monthly maximum number of days without rainfall 269
were calculated (Table 1). Periods of around two weeks or more without rain on green 270
roofs can cause many species of forbs to reach permanent wilting point (Nagase and 271
Dunnett 2010, Bates et al. 2013, 2015). These dry periods were identified in the rainfall 272
data and used to aid the interpretation of the results. The monthly average rainfall for all 273
of the dry periods identified were in the lower 10th percentile of the ten year baseline 274
data. 275
2.5. Statistical analyses 276
Effects of the between-subjects factor mulch treatment on the within-subjects 277
dependent variables richness and number seeded, in each sampling time window were 278
tested using mixed ANOVAs. Species richness, measured on each sampling occasion, 279
had 17 within-subject levels. Number seeded, which was measured during each year, 280
had six within-subject levels. Studentised residuals were calculated for each model and 281

checked for normality using normal Q-Q plots. No strong outliers were detected in the 282
studentised residuals (<+/- 3 standard deviations). Levene’s Tests of Homogeneity of 283
Variance were used to assess equality of variance between the three levels of mulch 284
treatment. For each mixed ANOVA there was very little departure from normality, few 285
outliers, and little indication of heterogeneity of variance. Mauchly’s Tests of Sphericity 286
showed that the variances of the differences were equal, so sphericity assumed degrees 287
of freedom were used for tests of within-subject effects. For richness and number 288
seeded, mixed ANOVAs indicated a significant interaction between time and mulch 289
effect, so simple main effects were determined using univariate and repeated measures 290
ANOVAs, for each time window and treatment respectively. Tukey HSD post hoc tests 291
(P<0.05) and pairwise comparisons of means (P<0.05) with Bonferroni confidence 292
interval adjustments were used to determine which values differed significantly, for 293
each time window and treatment respectively. 294
Point quadrat counts and measurements of plant biomass (g/m2) taken in June 295
and August 2012 from each mesocosm were averaged to give more representative 296
annual values. Point quadrat counts of forbs (excluding S. acre), S. acre, moss and bare 297
ground; total plant biomass (g/m2); and percent biomass comprised of S. acre, were 298
analysed using One-Way ANOVAs. Normality was checked using normal Q-Q plots. 299
Levene’s tests of homogeneity of variance showed that variance was homogenous. The 300
ANOVA F-statistic and Tukey post-hoc tests were therefore used to assess overall 301
significance and multiple comparisons between treatments. All analyses were done in 302
IBM® SPSS® Statistics Version 20.0.0 following guidance in Laerd Statistics (2013). 303
3 Results 304

A total of forty five forb taxa were recorded from the mesocosms in all. Of the 25 305
species in the seed mix, four were never recorded, and a further five species did not seed 306
in any year (Supplementary materials 5 and 6). The total number of taxa recorded, and 307
the specific taxa recorded over the whole study period were similar over the three mulch 308
treatments (Supplementary materials 5). However, Compost supported 43 taxa, Sandy 309
loam supported 39 taxa and No mulch supported 35 taxa overall. 310
Across all treatments some consistent temporal trends appeared andare 311
summarized for four species in Supplementary materials 7. There was an initial year-312
one flush of annual species, such as Centaurea cyanus, Agrostemma githago, Papaver 313
dubium and Papaver rhoeas. Some of these annuals persisted in small numbers (and 314
often as dwarfed individuals) throughout the study period, particularly after drought die-315
back of other species. Perennial species, such as Prunella vulgaris, Leucanthemum 316
vulgare and Lotus corniculatus tended to take longer to establish, usually starting to 317
seed in years two or three, with coverage increasing during this period (Supplementary 318
materials 6 and 7). All mesocosms showed declines in coverage of many taxa following 319
the sequence of dry periods (two-week periods without rainfall) in September 2009, 320
May 2010 and March-April 2011. However, the severity of this drought response varied 321
by treatment, with Compost showing the most severe response, and the No mulch 322
control showing the least response (Supplementary materials 7). The succulent Sedum 323
acre showed least response to the dry periods, steadily increasing in coverage 324
throughout the study period, with coverage only declining as a result of die-back after 325
summer flowering (Supplementary materials 7). 326
Strong temporal trends occurred in the biostructural data (Supplementary 327
materials 8). Bare ground coverage remained consistently high in the No mulch control, 328

stabilised at around 40% cover abundance after three years in the Sandy loam treatment, 329
and continued to decline throughout the study period in the Compost treatment. The 330
coverage of forbs and moss remained low in the No mulch controlthroughout the study 331
period, but forb coverage increased after one year, and moss coverage increased after 332
two years. Both overall forb and moss coverage generally increased over time in both 333
the Sandy loam and Compost treatments, but the increase was more consistent and 334
greater in the latter. 335
A mixed ANOVA of forb richness between treatments and the seventeen survey 336
time windows showed that there was a significant treatment time interaction (Table 2). 337
Compost forb richness declined over the first two years, but was higher than in the 338
Sandy loam treatment and No mulch control until the sequence of dry periods, during 339
which Compost forb richness was lower than the Sandy loam treatment and No mulch 340
control (Figure 4). Simple main effect univariate and repeated measures ANOVAs 341
showed that forb richness varied significantly with both treatment and time (Table 3). 342
The forb richness was usually significantly higher in the Compost than for Sandy loam 343
treatment and No mulch control in the first two study years. However, forb richness was 344
only nearly significantly lower (P exactly 0.05) than the Sandy loam treatment and No 345
mulch control during the two dry years (2010 and 2011) (Table 3). Both treatments and 346
control showed significant variations in forb richness over time, with richness higher in 347
the first two to three years than during the two dry years. This difference was strongest 348
in the Compost treatment, and least strong in the Sandy loam treatment (Table 3). 349
Interestingly the forb richness in the Compost treatment was significantly lower in 2009 350
before the periods of low rainfall, than at the beginning of the experiment. In all three 351
mulch treatments, the forb richness never regained the pre dry period levels (Figure 4). 352

A mixed ANOVA of the number of forb taxa able to seed also showed a 353
significant treatment time interaction (Table 2). The measure declined for the Compost 354
treatment but remained relatively stable for the Sandy loam treatment and No mulch 355
control over the first four years (Figure 5). In the first year of study both mulch 356
treatments and the control had significantly different numbers of forb taxa able to seed, 357
with Compost higher than Sandy loam, and Sandy loam higher than No mulch. In the 358
following two years, Compost and Sandy loam both had a significantly higher number 359
of species able to seed than No mulch (Table 4). The number of species able to seed in 360
the Compost treatment was significantly higher in the first two years than the following 361
one to three years. The number of species able to seed in the Sandy loam treatment was 362
significantly higher in 2009 than 2010. Whereas the number of species able to seed in 363
the No mulch control was significantly higher in the last year of the study than all other 364
years (Table 4, Figure 5). 365
One-way ANOVAs of mean point quadrat counts of S. acre, other forbs, moss 366
and bare ground for 2012 showed statistically significant differences for all response 367
variables (Table 5, Figure 6). Point quadrat counts of other forbs and S. acre were both 368
significantly higher in the Compost treatment than the Sandy loam treatment and No 369
mulch control. There was also significantly more moss in the Compost and Sandy loam 370
treatments than the No mulch control. In contrast No mulch had a significantly higher 371
amount of bare ground than Sandy loam and Compost. Sandy loam also had 372
significantly more bare ground than the Compost treatment (Table 5, Figure 6). 373
A one-way ANOVA of mean total plant biomass for 2012 showed that the 374
Compost treatment had significantly more plant biomass than Sandy loam and No 375
mulch, and that Sandy loam had significantly more plant biomass than No mulch (Table 376

5, Figure 7). The composition of this biomass remained fairly similar between the two 377
treatments and control, with the percentage of total plant biomass comprised of S. acre 378
not significantly different between the treatments (Table 5, Figure 8). 379
4 Discussion 380
4.1. Assemblage development and effects of drought 381
Plant richness on green roofs can decline in the first few years after construction 382
because of: (1) species unsuitability to the environmental conditions, (2) the 383
commencement of competitive exclusion of ruderal annual and perennial plants, and (3) 384
perhaps because of poorly established soil microbial assemblages on new roofs 385
(Dunnett and Kingsbury 2004, Rowe et al. 2012, Lundholm et al. 2014, cf. Molineaux 386
et al. 2014). However carefully designed, the physical establishment conditions on 387
every green roof will vary to some extent due to the weather conditions, roof character 388
(e.g. height, aspect, shading, exposure), and variations in installation procedure. This is 389
especially true when using recycled, rather than designed growth substrates, because of 390
the varying substrate character. Inevitably, some of the seeded species fail to establish 391
(or germinate), and there is a reduction in the number of species in the first year or two 392
after construction, as species unsuited to the environmental conditions die out. For 393
ruderal annual plants to persist over multiple growth seasons they require re-394
colonisation or a viable seed bank and sufficient resources (e.g. space, nutrients, water 395
and light) to allow the germination and establishment of new seedlings each year. The 396
establishment of biennial and perennial species in the second year means that most 397
available resources are already sequestered and it is difficult for annuals to do well after 398
the first year without disturbances creating resource space (e.g. Fenner 1978, 399

Mcconnaughay and Bazzaz 1987). There was some indication of recovery of some 400
ruderal annual plants following drought disturbances, but this recovery was weak, 401
individuals were stunted, and cover-abundance was usually too low to appear in the 402
datasets. 403
A significant reduction in the forb species richness was observed over the first 404
three years after construction, but only in the Compost treatment. The first three growth 405
seasons after construction were not subjected to extended (>14 day) periods without 406
rain, so it seems unlikely that drought disturbance was the cause of this decline in 407
richness. Instead it seems probable that this reduction in species richness was to some 408
extent due to competitive exclusion of some species by more competitive species better 409
able to take advantage of the higher productivity conditions in the Compost treatments 410
(cf. Grime 1973, 1977, Huston 1979). The legumes Lotus corniculatus and Trifolium 411
arvense did particularly well in the first three years after construction in the Compost 412
treatment, and may have begun to out compete and competitively exclude other species. 413
During the 2010 and 2011 growth seasons (4th and 5th year of development) 414
there were extended periods without rainfall that caused mortality and strongly reduced 415
the cover-abundance of most species of forbs and reduced the species richness in all 416
treatments. Such drought disturbances are an important controlling factor on plant 417
assemblages of green roofs, especially in those with a low capacity to retain water 418
(Monterusso et al. 2005, Nagase and Dunnett 2010, Rowe et al. 2012, Bates et al. 2013, 419
2015). Coverage of stress tolerant moss and the succulent S. acre either remained stable 420
or continued to increase through this disturbed period in both treatments and the control, 421
as might be expected given their adaptations for surviving xeric conditions (Dunnett and 422
Kingsbury 2004, Emilsson and Rolf 2005, Monterusso et al. 2005, Nagase and Dunnett 423

2010, Rowe et al. 2012, Lundholm et al. 2014). More competitive species with few 424
adaptations to xeric conditions, such as Lotus corniculatus and Leucanthemum vulgare, 425
declined markedly. The decline in cover-abundance in these species varied with mulch 426
treatment, with the strongest declines seen in the Compost treatment and the weakest in 427
the No mulch control. This pattern of a more marked decline over time in the Compost 428
treatment, compared to the Sandy loam treatment and No mulch control was also seen 429
for the overall forb richness, resulting in a significant treatment interaction. 430
Larger size and more leaves can confer a competitive advantage over other 431
species (e.g. Rösch et al. 1997, Keddy et al. 2002), but too much leaf mass can also 432
make a plant more vulnerable to drought (Rowe et al. 2006, Butler and Orians 2011, 433
Nagase and Dunnett 2011). It would seem that the greater productivity in the compost 434
treatment made these plants more vulnerable to drought disturbance than smaller less 435
leafy plants in the less fertile treatments. This decline occurred despite the tendency for 436
substrates with more organic matter content to hold more water (cf. Nagase and Dunnett 437
2011, Graceson et al. 2014a). The pattern of the most fertile treatments performing the 438
best initially, but declining more strongly during drought disturbances shown in the 439
current experiment, was also found in the similar, but larger-scale and observational 440
study of Bates et al. (2013). 441
There was some evidence to suggest that the plant assemblages on all treatments 442
had developed a level of resilience to further drought disturbances following the first 443
dry periods (September 2009 and May 2010 both occurred between the same two 444
sampling windows). The recovery from the second dry period (March to April 2011) 445
was more rapid, and a further long dry period in March 2012 (not >14 days) had little 446
apparent effect. Clearly, each dry period was not directly comparable in terms of water 447

availability because variations in wind, solar radiation and air temperature, and the 448
timing of dry periods would have affected the resilience of plants to them. However, it 449
is reasonable to speculate that some of the improved assemblage resilience to the later 450
dry periods was the result of changes to assemblage character following earlier 451
disturbances. Less hardy plants and less stress-tolerant plant species with shorter roots, 452
less drought adaptation or less favourable micro-substrate conditions, may already have 453
been eradicated from the assemblages by antecedent drought disturbances, with the 454
remainder therefore more resilient to future drought disturbances. After several years, 455
green roof plant assemblages tend towards a more stable state, with short-term changes 456
in response to variations in water availability, but relative stability when viewed over 457
the long term (Köhler 2006, Köhler and Poll 2010). The less marked response to later 458
drought disturbances in the current experiment could indicate that the mesocosms were 459
moving towards a more stable state. 460
4.2. Implications for the design of green roofs 461
The ideal amount of added organic matter is to some extent a value judgement 462
dependant both on the favoured habitat characteristics used, and the broader 463
environmental aims of green roof installation. Brown (biodiversity) roofs are designed 464
primarily for the mitigation of brownfield habitat loss, but the secondary broader 465
environmental aims could vary widely. If, for example, the most important secondary 466
aim was to maximise carbon sequestration (e.g. Getter et al. 2009), the Compost 467
treatment would be favoured, because this treatment had more plant biomass over most 468
of the six years. However if, for example, consistency of aesthetics, avoiding ‘messy’ 469
die-back as far as possible, was important (e.g. Loder 2014) the No mulch, or Sandy 470

loam treatments would perhaps be favoured due to less potential for drought disturbance 471
die-back. 472
From a habitat perspective, the Compost treatment supported the most forb 473
species overall, the highest initial forb species richness and the largest overall biomass; 474
the No mulch control had the highest amount of bare ground and had the most stable 475
plant assemblages; and the Sandy loam treatment was intermediate in terms of overall 476
forb species richness, biomass, plant assemblage stability and amount of bare ground. 477
An assessment that weighted the importance of the different biostructural (e.g. bare 478
ground) and biodiversity components (e.g. forb richness) of diversity evenly, and 479
favoured resistance to drought disturbance, would conclude that the intermediate Sandy 480
loam treatment was the ‘best’ from a habitat perspective. 481
Some theories suggest that under the same disturbance regime, species diversity 482
should demonstrate a humped relationship, with highest diversity at low to intermediate 483
levels of productivity (Grime 1973, Huston 1979, Michalet et al. 2006). However, a 484
range of productivity - diversity relationships have been predicted and observed, 485
particularly positive monotonic relationships with productivity (Abrams 1995, 486
Mittelbach et al. 2001, Gillman and Wright 2006, Adler et al. 2011). Despite the 487
difficulties associated with comparing different types of organic matter and comparing 488
amounts of organic matter by volume with by weight, it is clear that the current study 489
had low levels of organic matter in the growth substrates compared to other green roofs 490
experiments (e.g. Emilsson 2008, Molineux et al. 2009, Nagase and Dunnett 2011, 491
Graceson et al. 2014b). The current study could therefore be considered to sit at the 492
lower end of the green roof productivity spectrum, testing the effects of a relatively 493
small range of productivity for green roof habitats. At the end of the study period, forb 494

richness was very similar in both treatments and the control; however it has been argued 495
that the overall diversity was highest in the intermediate Sandy loam treatment, so there 496
is some tentative support for an intermediate level of productivity supporting the highest 497
diversity. Whatever the shape of the diversity productivity relationship in this system, 498
increasing productivity to even the low levels associated with the Compost treatment 499
did not increase diversity. The most suitable amount of added organic matter in these 500
brown roof systems was low. 501
In one of the two most similar experiments to the current investigation, Nagase 502
and Dunnett (2011) trialled four different amounts of green waste organic matter (0, 10, 503
25 and 50% by volume) mixed into a commercial crushed brick based substrate in 504
grass-herb assemblages under different watering regimes. They found that 10% organic 505
matter was the best treatment because 0% organic matter supported less biomass than 506
other treatments, and 25 and 50% organic matter produced too much growth in plants, 507
so that they were not able to withstand periods of low water availability. Graceson et al. 508
(2014b) tested crushed tile and crushed brick substrates containing 20 and 30% green 509
waste (by volume) with a flowering meadow mix that contained some Sedum species. 510
Over the two year experiment, which included dry periods, total biomass and Sedum 511
biomass was higher with more compost, but the forb (not including Sedum) biomass 512
was lower with more compost. It seems probable to us that this was due to excessive 513
growth in the higher organic matter content treatments, which left some species more 514
vulnerable to drought disturbance, as was observed by Nagase and Dunnett (2011), 515
Bates et al. (2013) and in the current study. However it should be noted that Graceson et 516
al. (2014b) did not come to the same conclusion. 517

In the current study, it has been argued that the ‘best’ plant assemblage in habitat 518
terms was the intermediate organic matter treatment, but this represented a low amount 519
of added organic matter. It is possible that Nagase and Dunnett (2011) and Graceson et 520
al. (2014b) might also have observed more consistent growth of drought resilient non-521
Sedum forbs had they tested substrates with an even lower amount of organic matter 522
content. However, the results of the current study have to be put into context; the 523
recycled demolition aggregate used does not hold as much water as the crushed brick 524
and crushed tile substrates of Nagase and Dunnett (2011) and Graceson et al. (2014b) so 525
the frequency of drought disturbances will be higher. A plant in ideal condition on a 526
green roof has the highest productivity in terms of size, leaf area, and number of leaves 527
possible whilst still being able to withstand low water availability. This ideal level of 528
productivity will vary in different green roofs (varying in climate, exposure, substrate 529
depth, substrate water holding capacity, etc.) depending on the overall availability of 530
water. So the ideal level of organic matter will be higher in green roofs where more 531
water is available. Nonetheless, too much organic matter will encourage plants to 532
become too large, with leaves that are too large and too numerous, making the plant 533
vulnerable to low water availability. 534
There are many advantages potentially associated with the addition of organic 535
matter, such as favourably altering the water holding capacity, dry bulk density and air 536
filled porosity of green roof substrates (Graceson et al. 2014a). However, the addition of 537
too much organic matter in green roof systems whose vegetation is not entirely 538
composed of drought resistant flora such as Sedum, is likely to create a ‘boom bust’ 539
system where plants grow too well, then die back in periods of dry weather (Nagase and 540
Dunnett 2011, Bates et al. 2013). So the amount of organic matter added to green roof 541

substrates has to be carefully considered, and the ideal amount will vary with the water 542
holding capacity of the substrate and the desired species in the plant assemblage. 543
5 Conclusions 544
This study demonstrates the importance of studying vegetation development on green 545
roofs in a field-setting for a sufficient multi-year period, in order that the effects of less 546
frequent drought disturbances are included in the findings. A treatment time interaction 547
showed that the ‘best’ amount of added organic matter at the beginning of the 548
experiment was not the ‘best’ over the whole six years of study, due to lower drought 549
resilience in the higher organic matter treatment. For brown roofs that support good 550
plant species richness, high availability of various biostructural microhabitats and 551
resilience to drought disturbances, the ideal amount of added organic matter is very low. 552
The ideal amount of added organic matter for other types of green roofs is likely to vary 553
with the water holding capacity of the substrate and the desired plant assemblage. 554
Acknowledgements 555
This research was funded by the European Union through the UNESCO SWITCH 556
sustainable urban water project. We thank Dusty Gedge and Emorsgate Seeds for 557
advising on the seed mix used, Rossa Donovan for initial input into the project, Kevin 558
Burkhill and Anne Ankcorn for the preparation of Figure 1, Maria Fernanda Aller and 559
Véronique Durand for help with the array construction, Siobhan King and Diego 560
Martelli for field and lab-work assistance, IKO for the provision and advice on the use 561
of green build materials, and Coleman and Company for the provision of recycled 562
aggregates. Weather data were used with permission from the UK Meteorological 563
Office MIDAS Land Surface Stations data (1853-current), [Internet] NCAS British 564

Atmospheric Data Centre, 2006, downloaded July 2014. Available from: 565
http://badc.nerc.ac.uk/view/badc.nerc.ac.uk__ATOM__dataent_ukmo-midas. 566
References 567 568 Abrams, P. A. 1995. Monotonic or Unimodal Diversity Productivity Gradients - What Does 569
Competition Theory Predict. Ecology 76:2019-2027. 570 Adler, P. B., E. W. Seabloom, E. T. Borer, H. Hillebrand, Y. Hautier, A. Hector, W. S. Harpole, L. 571
R. O'Halloran, J. B. Grace, T. M. Anderson, J. D. Bakker, L. A. Biederman, C. S. Brown, Y. 572 M. Buckley, L. B. Calabrese, C. J. Chu, E. E. Cleland, S. L. Collins, K. L. Cottingham, M. J. 573 Crawley, E. I. Damschen, K. F. Davies, N. M. DeCrappeo, P. A. Fay, J. Firn, P. Frater, E. I. 574 Gasarch, D. S. Gruner, N. Hagenah, J. H. R. Lambers, H. Humphries, V. L. Jin, A. D. Kay, 575 K. P. Kirkman, J. A. Klein, J. M. H. Knops, K. J. La Pierre, J. G. Lambrinos, W. Li, A. S. 576 MacDougall, R. L. McCulley, B. A. Melbourne, C. E. Mitchell, J. L. Moore, J. W. Morgan, 577 B. Mortensen, J. L. Orrock, S. M. Prober, D. A. Pyke, A. C. Risch, M. Schuetz, M. D. 578 Smith, C. J. Stevens, L. L. Sullivan, G. Wang, P. D. Wragg, J. P. Wright, and L. H. Yang. 579 2011. Productivity Is a Poor Predictor of Plant Species Richness. Science 333:1750-580 1753. 581
Bates, A. J., R. Mackay, R. B. Greswell, and J. P. Sadler. 2009. SWITCH in Birmingham, UK: 582 experimental investigation of the ecological and hydrological performance of extensive 583 green roofs. Reviews in Environmental Science and Bio/Technology 8:295-300. 584
Bates, A. J., J. P. Sadler, R. B. Greswell, and R. Mackay. 2015. Effects of recycled aggregate 585 growth substrate on green roof vegetation development: A six year experiment. 586 Landscape and Urban Planning 135:22-31. 587
Bates, A. J., J. P. Sadler, and R. Mackay. 2013. Vegetation development over four years on two 588 green roofs in the UK. Urban Forestry & Urban Greening 12:98-108. 589
Bengtsson, L. 2005. Peak flows from thin sedum-moss roof. Nordic Hydrology 36:269-280. 590 Brenneisen, S. 2006. Space for urban wildlife: Designing green roofs as habitats in Switzerland. 591
Urban Habitats 4:27-36. 592 Butler, C., and C. M. Orians. 2011. Sedum cools soil and can improve neighboring plant 593
performance during water deficit on a green roof. Ecological Engineering 37:1796-594 1803. 595
Castleton, H. F., V. Stovin, S. B. M. Beck, and J. B. Davison. 2010. Green roofs; building energy 596 savings and the potential for retrofit. Energy and Buildings 42:1582-1591. 597
Dallimer, M., Z. Y. Tang, P. R. Bibby, P. Brindley, K. J. Gaston, and Z. G. Davies. 2011. Temporal 598 changes in greenspace in a highly urbanized region. Biology Letters 7:763-766. 599
Domin, K. 1928. The relations of the Tatra mountain vegetation to the edaphic factors of the 600 habitat: a synecological study. Acta Botanica Bohemica 617:133-164. 601
Donovan, R., J. Sadler, and J. Bryson. 2005. Urban biodiversity and sustainable development. 602 Engineering Sustainability 2005:105-114. 603
Dunnett, N., and N. Kingsbury. 2004. Planting green roofs and living walls. Timber Press, 604 Portland, Oregon. 605
Dunnett, N., A. Nagase, and A. Hallam. 2008. The dynamics of planted and colonising species 606 on a green roof over six growing seasons 2001-2006: influence of substrate depth. 607 Urban Ecosystems 11:373-384. 608
Emilsson, T. 2008. Vegetation development on extensive vegetated green roofs: influence of 609 substrate composition, establishment method and species mix. Ecological Engineering 610 33:265-277. 611

Emilsson, T., and K. Rolf. 2005. Comparison of establishment methods for extensive green 612 roofs in southern Sweden. Urban Forestry & Urban Greening 3:103-111. 613
Fenner, M. 1978. Comparison of the Abilities of Colonizers and Closed-Turf Species to Establish 614 from Seed in Artificial Swards. Journal of Ecology 66:953-&. 615
Francis, R. A., and J. Lorimer. 2011. Urban reconciliation ecology: The potential of living roofs 616 and walls. Journal of Environmental management 92:1429-1437. 617
Gedge, D. 2003. '...From rubble to redstarts...'.in Greening Rooftops for Sustainable 618 Communities, Chicago. 619
Getter, K. L., and D. B. Rowe. 2006. The role of extensive green roofs in sustainable 620 development. Hortscience 41:1276-1285. 621
Getter, K. L., D. B. Rowe, G. P. Robertson, B. M. Cregg, and J. A. Andresen. 2009. Carbon 622 Sequestration Potential of Extensive Green Roofs. Environmental Science & 623 Technology 43:7564-7570. 624
Gilbert, O. 1989. The ecology of urban habitats. Chapman & Hall, London. 625 Gillman, L. N., and S. D. Wright. 2006. The influence of productivity on the species richness of 626
plants: A critical assessment. Ecology 87:1234-1243. 627 Graceson, A., M. Hare, N. Hall, and J. Monaghan. 2014a. Use of inorganic substrates and 628
composted green waste in growing media for green roofs. Biosystems Engineering 629 124:1-7. 630
Graceson, A., J. Monaghan, N. Hall, and M. Hare. 2014b. Plant growth responses to different 631 growing media for green roofs. Ecological Engineering 69:196-200. 632
Grant, G. 2006. Extensive green roofs in London. Urban Habitats 4:51-65. 633 Grime, J. P. 1973. Competitive Exclusion in Herbaceous Vegetation. Nature 242:344-347. 634 Grime, J. P. 1977. Evidence for the existence of three primary strategies in plants and its 635
relevance to ecological and evolutionary theory. The American Naturalist 111:1169-636 1194. 637
Hansen, T. C. 1992. Recycling of demolished concrete and masonry. Report of Technical 638 Committee 37-DRC Demolition and Reuse of Concrete. Chapman and Hall, London. 639
Harrison, C., and G. Davies. 2002. Conserving biodiversity that matters: practitioners' 640 perspectives on brownfield development and urban nature conservation in London. 641 Journal of Environmental management 65:95-108. 642
Hofmann, M., J. R. Westermann, I. Kowarik, and E. van der Meer. 2012. Perceptions of parks 643 and urban derelict land by landscape planners and residents. Urban Forestry & Urban 644 Greening 11:303-312. 645
Huston, M. 1979. General Hypothesis of Species-Diversity. American Naturalist 113:81-101. 646 Ishimatsu, K., and K. Ito. 2013. Brown/biodiverse roofs: a conservation action for threatened 647
brownfields to support urban biodiversity. Landscape and Ecological Engineering 648 9:299-304. 649
Kadas, G. 2006. Rare invertebrates colonizing green roofs in London. Urdan Habitats 4:66-86. 650 Keddy, P., K. Nielsen, E. Weiher, and R. Lawson. 2002. Relative competitive performance of 63 651
species of terrestrial herbaceous plants. Journal of Vegetation Science 13:5-16. 652 Köhler, M. 2006. Long-term vegetation research on two extensive green roofs in Berlin. Urban 653
Habitats 4:3-26. 654 Köhler, M., and P. H. Poll. 2010. Long-term performance of selected old Berlin greenroofs in 655
comparison to younger extensive greenroofs in Berlin. Ecological Engineering 36:722-656 729. 657
Krajina, V. J. 1933. Die Pflanzengesellschaften des Mlynica-Tales in den Vysoke Tatry (Hohe 658 Tatra). Mit besonderer Berücksichtigung der ökologischen Verhältnisse. Beihefte zum 659 Botanischen Centralblatt 50:774-957; 51:1-224. 660
Laerd Statistics. 2013. Laerd Statistics IBM SPSS guides https://statistics.laerd.com. 661

Li, D., E. Bou-Zeid, and M. Oppenheimer. 2014. The effectiveness of cool and green roofs as 662 urban heat island mitigation strategies. Environmental Research Letters 9. 663
Loder, A. 2014. 'There's a meadow outside my workplace': A phenomenological exploration of 664 aesthetics and green roofs in Chicago and Toronto. Landscape and Urban Planning 665 126:94-106. 666
Lundholm, J., A. Heim, S. Tran, and T. Smith. 2014. Leaf and life history traits predict plant 667 growth in a green roof ecosystem. Plos One 9(6): e101395. 668 doi:10.1371/journal.pone.0101395. 669
Madre, F., A. Vergnes, N. Machon, and P. Clergeau. 2014. Green roofs as habitats for wild plant 670 species in urban landscapes: First insights from a large-scale sampling. Landscape and 671 Urban Planning 122:100-107. 672
Mcconnaughay, K. D. M., and F. A. Bazzaz. 1987. The Relationship between Gap Size and 673 Performance of Several Colonizing Annuals. Ecology 68:411-416. 674
Mentens, J., D. Raes, and M. Hermy. 2006. Green roofs as a tool for solving the rainwater 675 runoff problem in the urbanized 21st century? Landscape and Urban Planning 77:217-676 226. 677
Michalet, R., R. W. Brooker, L. A. Cavieres, Z. Kikvidze, C. J. Lortie, F. I. Pugnaire, A. Valiente-678 Banuet, and R. M. Callaway. 2006. Do biotic interactions shape both sides of the 679 humped-back model of species richness in plant communities? Ecology Letters 9:767-680 773. 681
Mittelbach, G. G., C. F. Steiner, S. M. Scheiner, K. L. Gross, H. L. Reynolds, R. B. Waide, M. R. 682 Willig, S. I. Dodson, and L. Gough. 2001. What is the observed relationship between 683 species richness and productivity? Ecology 82:2381-2396. 684
Molineux, C. J., C. H. Fentiman, and A. C. Gange. 2009. Characterising alternative recycled 685 waste materials for use as green roof growing media in the UK. Ecological Engineering 686 35:1507-1513. 687
Molineux C. J., S. P. Connop, and A. C. Gange. 2014. Manipulating soil microbial communities in 688 extensive green roof substrates. Science of the Total Environment 493:632-638. 689
Monterusso, M. A., D. B. Rowe, and C. L. Rugh. 2005. Establishment and persistence of Sedum 690 spp. and native taxa for green roof applications. Hortscience 40:391-396. 691
Nagase, A., and N. Dunnett. 2010. Drought tolerance in different vegetation types for 692 extensive green roofs: Effects of watering and diversity. Landscape and Urban Planning 693 97:318-327. 694
Nagase, A., and N. Dunnett. 2011. The relationship between percentage of organic matter in 695 substrate and plant growth in extensive green roofs. Landscape and Urban Planning 696 103:230-236. 697
Oberndorfer, E., J. Lundholm, B. Bass, R. R. Coffman, H. Doshi, N. Dunnett, S. Gaffin, M. Kohler, 698 K. K. Y. Liu, and D. B. Rowe. 2007. Green roofs as urban ecosystems: ecological 699 structures, functions, and services. Bioscience 57:823-833. 700
Olly, L. M., A. J. Bates, J. P. Sadler, and R. Mackay. 2011. An initial experimental assessment of 701 the influence of substrate depth on floral assemblage for extensive green roofs. Urban 702 Forestry & Urban Greening 10:311-316. 703
Poon, C. S., and D. X. Chan. 2006. Feasible use of recycled concrete aggregates and crushed 704 clay brick as unbound road sub-base. Construction and Building Materials 20:578-585. 705
Rose F., and C. O'Reilly. 2006. The wild flower key. Frederick Warne 706 Rösch, H., M. W. VanRooyen, and G. K. Theron. 1997. Predicting competitive interactions 707
between pioneer plant species by using plant traits. Journal of Vegetation Science 708 8:489-494. 709
Rowe, D. B. 2011. Green roofs as a means of pollution abatement. Environmental Pollution 710 159:2100-2110. 711

Rowe, D. B., K. L. Getter, and A. K. Durhman. 2012. Effect of green roof media depth on 712 Crassulacean plant succession over seven years. Landscape and Urban Planning 713 104:310-319. 714
Rowe, D. B., M. A. Monterusso, and C. L. Rugh. 2006. Assessment of heat-expanded slate and 715 fertility requirements in green roof substrates. Horttechnology 16:471-477. 716
Rumble, H., and A. C. Gange. 2013. Soil microarthropod community dynamics in extensive 717 green roofs. Ecological Engineering 57:197-204. 718
Sadler, J., A. Bates, R. Donovan, and S. Bodnar. 2011. Building for biodiversity: accomodating 719 people and wildlife in cities. Pages 286-297 in J. Niemelä, J. H. Breuste, G. 720 Guntenspergen, N. E. McIntyre, T. Elmqvist, and P. James, editors. Urban ecology. 721 Patterns, processes and applications. Oxford University Press, Oxford. 722
Simmons, M. T., B. Gardiner, S. Windhager, and J. Tinsley. 2008. Green roofs are not created 723 equal: the hydrologic and thermal performance of six different extensive green roofs 724 and reflective and non-reflective roofs in a sub-tropical climate. Urban Ecosystems 725 11:339-348. 726
Small, E. C., J. P. Sadler, and M. G. Telfer. 2003. Carabid beetle assemblages on urban derelict 727 sites in Birmingham, UK. Journal of Insect Conservation 6:233-246. 728
Smartt, P. F. M., S. E. Meacock, and J. M. Lambert. 1976. Investigations into Properties of 729 Quantitative Vegetational Data .2. Further Data Type Comparisons. Journal of Ecology 730 64:41-78. 731
Thornton, G., and P. Nathanail. 2005. Are incentives for regenerating UK brownfield sites 732 sustainable? Land Contamination & Reclamation 13:327-338. 733
Thuring, C. E., and N. Dunnett. 2014. Vegetation composition of old extensive green roofs 734 (from 1980s Germany). Ecological Processes 3:4. 735
Woodward, J. C., M. D. Eyre, and M. L. Luff. 2003. Beetles (Coleoptera) on brownfield sites in 736 England: an important conservation resource? Journal of Insect Conservation 7:223-737 231. 738
Yang, J., Q. Yu, and P. Gong. 2008. Quantifying air pollution removal by green roofs in Chicago. 739 Atmospheric Environment 42:7266-7273. 740
741 742 743 744
745 746 747 748 749
750 751 752
753 754 755 756
757 758 759

Table 1 Total monthly precipitation (Tot. prec.) and average monthly temperature (Ave. 760
temp.) during each month, together with baseline average data mean over ten years (10th 761 and 90th percentiles in brackets). Numbers in parenthesis for months are the maximum 762 number of days without rainfall (> two weeks without rainfall in bold). 763 764
Ave. 2003-2012 2007 2008 2009 2010 2011 2012
Tot. prec. (mm)
Jan. 54.7 (19.4-92.0) - 93.4 61.5 53.0 43.8 39
Feb. 40.0 (19.1-87.2) - 25.3 33.0 55.0 57.0 22.8
Mar. 38.7 (6.9-67.2) - 66.0 (5.5) 25.4 (9.5) 50.2 (11) 5.8 (16.5) 16.8 (14)
Apr. 40.5 (3.4-89.5) - 68.4 (2) 36.7 (8.5) 38.4 (9.5) 3.2 (17) 91.6 (4)
May 60.7 (25.1-112.4) - 86.0 (6.5) 44.2 (7) 23.4 (17) 40.2 (7.5) 53.6 (10)
June 70.7 (26.8-162.5) - 37.4 (8) 53.2 (7.5) 46.4 (9.5) 40.0 (8) 140.2 (2)
July 76.2 (40.2-144.4) - 85.2 (7.5) 103.0 (4) 40.2 (9.5) 40.6 (11.5) 102.2 (7)
Aug. 77.3 (26.7-141.4) - 110.0 (7) 42.0 (7.5) 136.0 (3) 56.2 (7.5) 58.2 (7)
Sept. 46.2 (14.1-92.1) 31.8 (13) 94.4 (9.5) 13.2 (24) 57.6 (7.5) 25.2 (4) -
Oct. 63.3 (31.2-106.8) 42.7 (10) 64.4 (5.5) 30.0 (4) 61.4 (7) 41.8 (9) -
Nov. 65.6 (34.1-116.6) 50.8 (7.5) 78.4 (3) 106.0 (1) 50.0 (2.5) 45.6 (7) -
Dec. 54.4 (18.9-103.3) 59.3 46.4 51.6 18.8 61.0 -
Ave. temp. (oC)
Jan. 4.7 (1.6-7.1) - 6.6 2.9 1.4 3.8 5.3
Feb. 4.5 (2.7-6.4) - 5.1 4.0 2.6 6.5 4.0
Mar. 6.6 (4.7-7.9) - 6.1 6.9 6.0 6.8 8.0
Apr. 9.4 (7.1-11.8) - 7.7 10.0 9.2 11.9 7.0
May 12.2 (11.3-13.2) - 13.3 12.2 11.3 12.4 11.9
June 15.4 (15.3-19.9) - 14.8 15.1 15.9 14.3 13.4
July 16.7 (15.3-19.9) - 16.6 16.1 17.3 15.7 15.5
Aug. 16.5 (15.2-18.4) - 16.3 16.6 15.1 15.7 16.4
Sept. 14.4 (12.9-16.5) 14.0 13.2 14.1 13.6 15.1 -
Oct. 10.8 (8.9-13.0) 11.0 9.4 11.2 10.1 12.5 -
Nov. 7.2 (5.2-9.1) 7.0 6.7 8.3 5.0 9.2 -
Dec. 4.3 (0.3-6.3) 4.8 3.7 3.1 0.0 5.7 -
765
766
767
768
769
770
771
772

Table 2 Mixed ANOVA interaction results for species richness and number seeded. 773
Interactions in both models were significant, so simple main effects were tested 774
separately. 775
Mixed ANOVA
Interaction df F Sig.
Taxa richness Time x mulch 32 6.50 <0.001
Number seeded Time x mulch 10 4.72 <0.001
776
777
778
779
780
781
782
783
784
785
786
787
788
789
790
791
792
793
794
795

Table 3 Simple main effects for the relationship between (A) taxa richness and time 796
modelled using univariate ANOVA and (B) taxa richness and mulch treatment using 797
repeated measures ANOVA. 798
(A) Univariate ANOVA df F Sig. Post hoc P<0.05
Jun07 2 22.92 <0.001 Compost>Sandy loam & No mulch
Jul07 2 18.99 <0.001 Compost>Sandy loam & No mulch
Sept07 2 14.05 0.001 Compost>Sandy loam & No mulch
Oct07 2 14.40 0.001 Compost>Sandy loam & No mulch
Dec07 2 4.13 0.043 Compost>No mulch
Apr08 2 11.20 0.002 Compost>Sandy loam & No mulch
May08 2 4.94 0.003 Compost>Sandy loam & No mulch
Jul08 2 2.28 0.145 -
Sept08 2 1.96 0.183 -
Jun09 2 0.07 0.931 -
Sept09 2 0.94 0.416 -
Jun10 2 3.64 0.058 -
Aug10 2 2.98 0.089 -
May11 2 3.90 0.050 Not significant with Tukey post hoc P = 0.068
Aug11 2 0.37 0.701 -
Jun12 2 0.35 0.714 -
Aug12 2 0.50 0.618 -
(B) Repeated measures ANOVA df F Sig. Pairwise comparison of means P<0.05
Compost 16 60.84 <0.001 Jun07>Jun09, Sept09, Jun10, Aug10, May11, Aug11, Jun12; Jul07>Jun09, Sept09, Jun10, Aug10, May11, Aug11; Sept07>Jun10, Aug10, May11, Aug11; Oct07>Jun10, Aug10, May11; Dec07>Aug10, May11, Aug11; Apr08>Jun10, Aug10, May11, Aug11; May08>Jun10, Aug10, May11, Aug11; Jul08>Jun10, Aug11; Jun09>Aug10, Aug11
Sandy loam 16 15.90 <0.001 Jul08>Aug10 No mulch 16 20.24 <0.001 Jun07>May11, Aug11; Jul07>Aug11, Aug12;
Sept07>Aug12; Oct07>Jun10, Aug11, Jun12; May08>Aug11; Jul08>Jun12; Sept09>Jun10
799
800
801
802
803
804
805
806
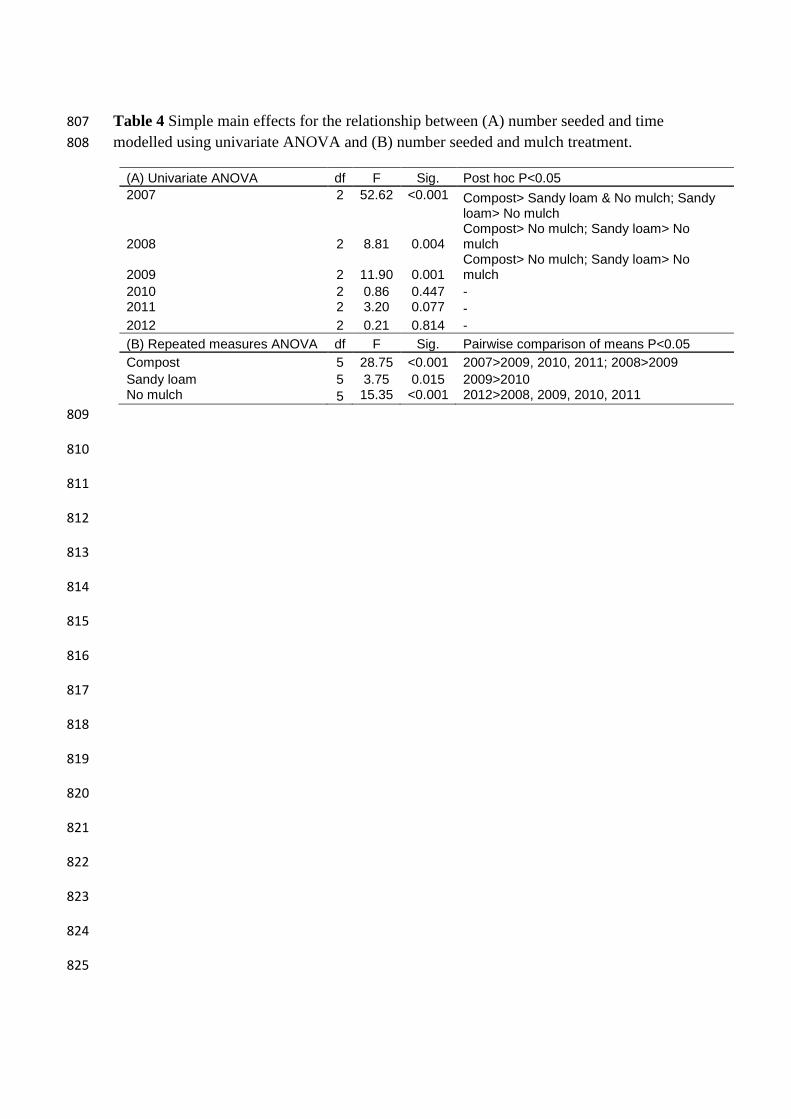
Table 4 Simple main effects for the relationship between (A) number seeded and time 807
modelled using univariate ANOVA and (B) number seeded and mulch treatment. 808
(A) Univariate ANOVA df F Sig. Post hoc P<0.05
2007 2 52.62 <0.001 Compost> Sandy loam & No mulch; Sandy loam> No mulch
2008 2 8.81 0.004 Compost> No mulch; Sandy loam> No mulch
2009 2 11.90 0.001 Compost> No mulch; Sandy loam> No mulch
2010 2 0.86 0.447 - 2011 2 3.20 0.077 -
2012 2 0.21 0.814 -
(B) Repeated measures ANOVA df F Sig. Pairwise comparison of means P<0.05
Compost 5 28.75 <0.001 2007>2009, 2010, 2011; 2008>2009
Sandy loam 5 3.75 0.015 2009>2010 No mulch 5 15.35 <0.001 2012>2008, 2009, 2010, 2011
809
810
811
812
813
814
815
816
817
818
819
820
821
822
823
824
825

Table 5 One-way ANOVA results of mulch treatment effects for four average quadrat 826
counts, average total biomass and Sedum acre as an average percentage of biomass for 827
2012. 828
Measure df F Sig.
Average quadrat count 'other forbs' 2012 2 4.99 0.026
Average quadrat count Sedum acre 2012 2 18.02 <0.001
Average quadrat count moss 2012 2 13.37 0.001
Average quadrat count bare ground 2012 2 88.92 <0.001
Average total biomass 2012 2 36.79 <0.001
Average % S. acre biomass 2012 2 0.23 0.796
829
830
831
832
833
834
835
836
837
838
839
840
841
842
843
844
845
846
847

Figure 1 Stratified-random spatial distribution of the two replicate treatments Compost 848
(Comp) and Sandy loam (Loam) and the No mulch control used in the study. 849
850
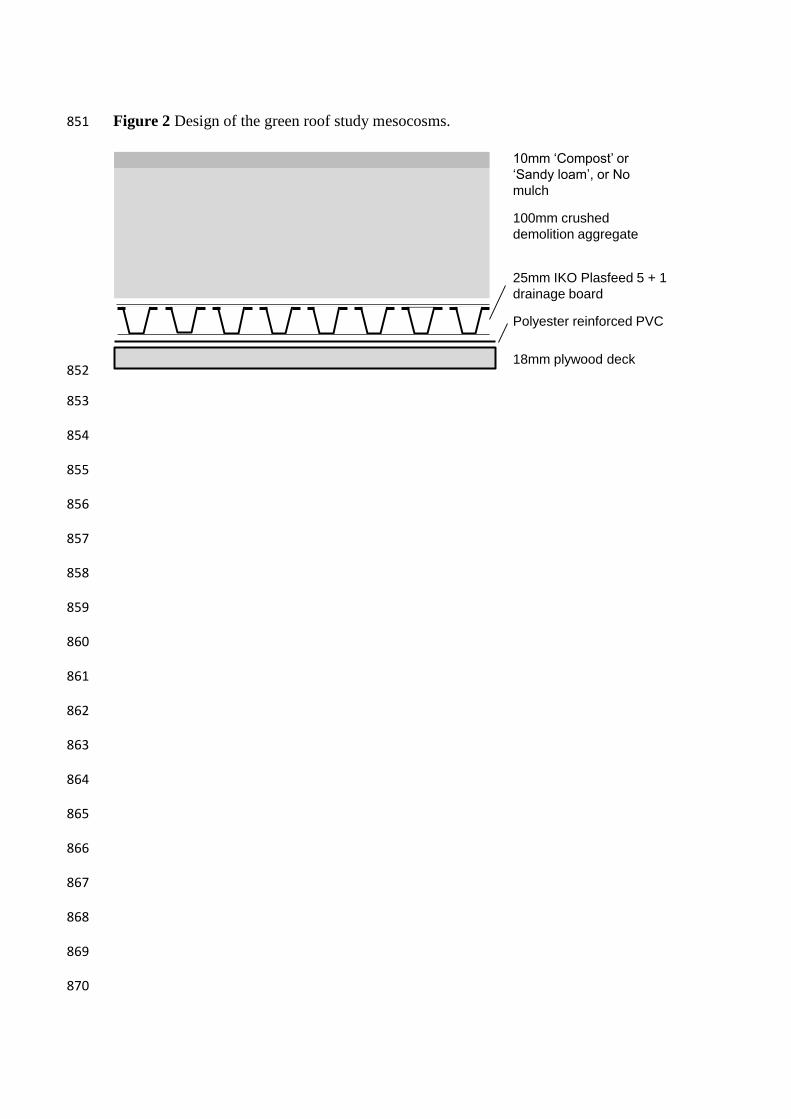
Figure 2 Design of the green roof study mesocosms. 851
852
853
854
855
856
857
858
859
860
861
862
863
864
865
866
867
868
869
870
10mm ‘Compost’ or
‘Sandy loam’, or No
mulch
100mm crushed
demolition aggregate
25mm IKO Plasfeed 5 + 1
drainage board
Polyester reinforced PVC
18mm plywood deck

Figure 3 Mean (n = 5, +/- 95% confidence interval) cumulative percentage Wentworth 871
scale size distribution of sediments for the three study treatments. 872
873
874
875
876
877
878
879
880
881
882
883
884
885
886
0
20
40
60
80
100
Compost
Sandy loam
No mulch
Cu
mu
lati
ve
per
cen
tage
Size class (mm)
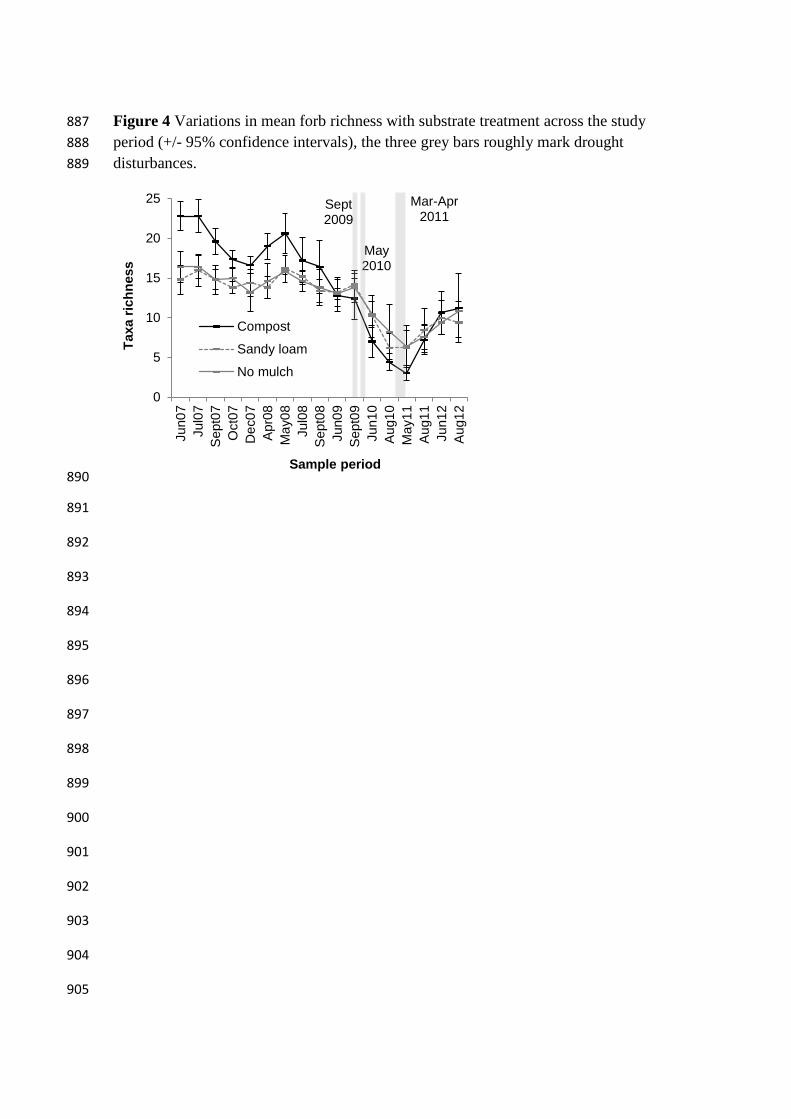
Figure 4 Variations in mean forb richness with substrate treatment across the study 887
period (+/- 95% confidence intervals), the three grey bars roughly mark drought 888
disturbances. 889
890
891
892
893
894
895
896
897
898
899
900
901
902
903
904
905
0
5
10
15
20
25
Jun0
7
Jul0
7
Sept0
7
Oct0
7
De
c0
7
Apr0
8
Ma
y0
8
Jul0
8
Sept0
8
Jun0
9
Sept0
9
Jun1
0
Aug1
0
Ma
y1
1
Aug1
1
Jun1
2
Aug1
2
Compost
Sandy loam
No mulch
May 2010
Sept 2009
Mar-Apr 2011
Taxa r
ich
ness
Sample period

Figure 5 Variations in mean number of forb taxa seeding with substrate treatment 906
across the study period (+/- 95% confidence intervals). 907
908
909
910
911
912
913
914
915
916
917
918
919
920
921
922
923
0
2
4
6
8
10
12
14
2007 2008 2009 2010 2011 2012
Compost
Sandy loam
No mulch
Nu
mb
er
of
taxa a
ble
to
seed
Year

Figure 6 Variations with mulch treatment in the mean point quadrat count for forbs 924
(without Sedum acre), S. acre, moss, and bare ground for 2012 (+/- 95% confidence 925
intervals). Values that do not share letters were found to be significantly (P<0.05) 926
different using Tukey HSD multiple comparisons tests. 927
928
929
930
931
932
933
934
935
936
937
938
939
940
941
942
0
10
20
30
40
50
60
70
80
Compost Sandy loam No mulch
Other forbs
S. acre
Moss
Bare ground
Po
int
qu
ad
rat
co
un
t
Mulch treatment
a
ab
b
a
a
b
b
a
bb
a
c
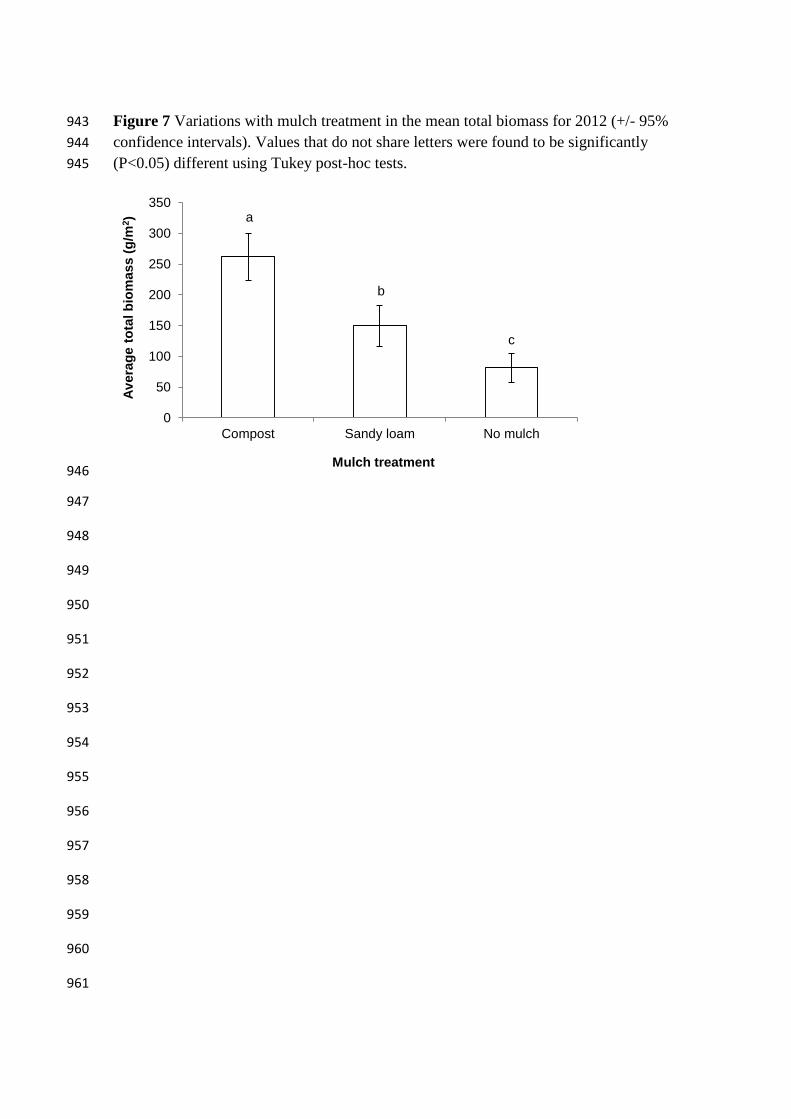
Figure 7 Variations with mulch treatment in the mean total biomass for 2012 (+/- 95% 943
confidence intervals). Values that do not share letters were found to be significantly 944
(P<0.05) different using Tukey post-hoc tests. 945
946
947
948
949
950
951
952
953
954
955
956
957
958
959
960
961
0
50
100
150
200
250
300
350
Compost Sandy loam No mulch
Av
era
ge t
ota
l b
iom
ass (
g/m
2)
Mulch treatment
a
b
c

Figure 8 Variations with mulch treatment in the mean biomass of Sedum acre as a 962
percentage of all plant biomass for 2012 (+/- 95% confidence intervals). No significant 963
(P<0.05) differences were detected. 964
965
966
967
968
969
970
971
972
973
974
975
976
977
978
979
980
0
10
20
30
40
50
60
70
80
90
100
Compost Sandy loam No mulch
% S
.acre
bio
mass
Mulch treatment

Supplementary materials 981
Supplementary materials 1 Seed mix used in the study. 982
% by weight Latin name Common English name
5.6 Agrimonia eupatoria Agrimony
5.6 Agrostemma githago Corn Cockle
4.6 Anthyllis vulneraria Kidney Vetch
4.6 Centaurea cyanus Cornflower
4.6 Centaurea nigra Common Knapweed
2.8 Daucus carota Wild Carrot
4.6 Echium vulgare Viper's-bugloss
5.6 Knautia arvensis Field Scabious
4.6 Leontodon hispidus Rough Hawkbit
3.7 Leucanthemum vulgare Oxeye Daisy
0.9 Linaria vulgaris Common Toadflax
4.6 Lotus corniculatus Birdsfoot Trefoil
1.9 Origanum vulgare Wild Marjoram
1.9 Papaver dubium Long-headed Poppy
3.7 Papaver rhoeas Common Poppy
4.6 Plantago media Hoary Plantain
4.6 Prunella vulgaris Selfheal
4.6 Ranunculus bulbosus Bulbous Buttercup
4.6 Reseda lutea Wild Mignonette
5.6 Sanguisorba minor ssp. minor Salad Burnet
6.3 Sedum acre Biting Stonecrop
4.6 Silene vulgaris Bladder Campion
0.9 Trifolium arvense Hare's-foot Clover
0.9 Verbascum thapsus Great Mullein
3.7 Viola tricolor Wild Pansy
983
984
985
986
987
988
989
990

Supplementary materials 2 Survey time windows for vegetation survey and sampling. 991
Survey time windows displayed as follows: code (day/month/year - day/month/year): 992
Jun07 (21/6/07 – 2/7/07), Jul07 (31/7/07 – 1/8/07), Sept07 (4/9/07 – 7/9/07), Oct07 993
(15/10/07 – 18/10/07), Dec07 (11/12/07 – 14/12/07), Apr08 (4/4/08 – 11/4/08), May08 994
(21/5/08 – 2/6/08), Jul08 (16/7/08 – 24/7/08), Sept08 (18/9/08 – 29/9/08), Jun09 (1/6/09 995
– 3/6/09), Sept09 (17/9/09 – 21/9/09), Jun10 (28/6/10 – 30/6/10), Aug10 (27/8/10 – 996
31/8/10), May11 (24/5/11 – 25/5/11), Aug11 (18/8/11 – 19/8/11), Jun12 (6/6/12 – 997
14/6/12) and Aug12 (14/8/12 – 3/9/12). 998
999
1000
1001
1002
1003
1004
1005
1006
1007
1008
1009
1010
1011
1012
1013
1014
1015

Supplementary materials 3 A detailed description of the Domin-Krajina cover 1016
abundance method used. 1017
The cover abundance scale used was: + = solitary, 1 = seldom, insignificant cover, 2 = 1018
<1% cover, 3 = 1-5% cover, 4 = 5-10% cover, 5 = 10-25% cover, 6 = 25-33% cover, 7 1019
= 33-50% cover, 8 = 50-75% cover, 9 = >75% cover, and 10 = approximately 100% 1020
cover. Modal values of the replicates of each treatment were used in floristic analyses, if 1021
there were two cover-abundance classes with the same count, the highest class was 1022
chosen. For the biostructural analyses, modes of the Domin-Krajina coverage scores 1023
(abundance scores were ignored, if a draw the highest chosen) across replicates were 1024
converted to median percent cover abundance (e.g. 7 = 33-50%, converted to 41.5%) for 1025
better visual representation of the coverage of each biostructural element. It should be 1026
noted that the total median percent cover abundance would often be greater than 100% 1027
because the biostructural elements moss, graminoids and forbs can overlap in vertical 1028
coverage, and two biostructural categories could round-up to more than there was 1029
actually present (e.g. forbs of approximately 35% coverage, with a median percent 1030
cover abundance of 41.5%, plus bare ground of approximately 55% coverage, with a 1031
median percent cover abundance of 62.5% = 103.5% total median percent cover 1032
abundance). 1033
1034
1035
1036
1037
1038
1039

Supplementary materials 4 A comparative discussion of the point quadrat and Domin-1040
Krajina cover abundance methods. 1041
Compared to cover-abundance, the point quadrat method tended to produce higher forb 1042
cover and lower bare ground cover. This was likely because in the mesocosm 1043
construction process, the raking of the aggregate to fill the mesocosms tended to 1044
produce a coarser area around the edge of the mesocosms where it was harder for some 1045
forb species to grow, which consequentially had lower forb cover and higher bare 1046
ground cover. This coarser area was recorded in cover-abundance surveys, but not in the 1047
point quadrat surveys. 1048
1049
1050
1051
1052
1053
1054
1055
1056
1057
1058
1059

Supplementary materials 5 List of forb species found on the different mulch 1060
treatments and control. Seeded species are marked with *. Annual (A), biennial (B), and 1061
perennial information taken from Rose and O’Reilly (2006). 1062
Taxa Common name Compost Sandy loam No mulch
Papaveraceae Papaver dubium L. * Long-headed Poppy (A) x x x
Papaver rhoeas L. * Common Poppy (A) x x x
Chenopodiaceae Chenopodium album L. Fat-hen (A) x x x
Chenopodium polyspermum L. Many-seeded Goosefoot (A) x
Caryophyllaceae Agrostemma githago L.* Corn Cockle (A) x x x
Silene latifolia Poir. White Campion (AP) x x Silene vulgaris (Moench) Garcke * Bladder Campion (P) x x x
Arenaria serpyllifolia L. Thyme-leaved Sandwort (A) x x Cerastium fontanum Baumg. Common Mouse-ear (P) x x x
Sagina procumbens L. Procumbent Pearlwort (P) x x x
Polygonaceae Rumex acetosella L. Sheep's Sorrel (P) x x Rumex obtusifolius L. Broad-leaved Dock (P) x x
Viola Viola tricolor L. * Wild Pansy (AP) x x x
Brassicaceae Sisymbrium officinale (L.) Scop. Hedge Mustard (AB) x Cardamine hirsuta L. Hairy Bitter-cress (A) x x x
Coronopus didymus (L.) Lesser Swine-cress (AB) x
Recedaceae Reseda lutea L. * Wild Mignonette (BP) x x x
Crassulaceae Sedum acre L. * Biting Stonecrop (P) x x x
Rosaceae Fragaria vesca L. Wild Strawberry (P) x x x
Sanguisorba minor Scop * Salad Burnet (P) x x x
Fabaceae

Lotus corniculatus L. * Common Bird's-foot-trefoil (P) x x x
Trifolium arvense L. * Hare's-foot Clover (A) x x x
Trifolium dubium Sibth. Lessor Trefoil (A) x x Trifolium repens L. White Clover (P) x x x
Onagraceae Epilobium ciliatum Raf. American Willowherb (P) x x x
Apiaceae Daucus carota L. * Wild Carrot (B) x x x
Boranginaceae Echium vulgare L. * Viper's-bugloss (B) x x x
Lamiaceae Prunella vulgaris L. * Selfheal (P) x x x
Origanum vulgare L. * Wild Marjorum (P) x x x
Plantaginaceae Plantago media L. * Hoary Plantain (P) x x
Scrophulariaceae Verbascum thapsus L. * Great Mullein (B) x x x
Linaria vulgaris Mill. * Common Toadflax (P) x x x
Veronica persica Poir. Common Field-speedwell (A) x x x
Asteraceae Centaurea cyanus L. * Cornflower (A) x x x
Centaurea nigra L. * Common Knapweed (P) x x x
Leontodon hispidus L. * Rough Hawkbit (P) x x x
Sonchus asper (L.) Hill Prickly Sowthistle (A) x x x
Sonchus oleraceus L. Smooth Sowthistle (A) x Mycelis muralis (L.) Dumort. Wall Lettuce (P) x Taraxacum agg. Dandelions (P) x x x
Conyza spp. Fleabane (A) x x x
Leucanthemum vulgare Lam. * Oxeye Daisy (P) x x x
Matricaria recutita L. Scented Mayweed (AP) x x x
Matricaria discoidea DC. Pineappleweed (A) x Senecio vulgaris L. Groundsel (A) x x x
1063
1064
1065

Supplementary materials 6 Forb species able to seed by year (‘10’ = 2010 for 1066
example) on the different mulch treatments. 1067
Taxa Compost Sandy loam No mulch
Agrostemma githago 07, 08 07, 08 08
Arenaria serpyllifolia 12 11 Cardamine hirsuta 07 08 Centaurea cyanus 07, 11, 12 07, 08, 11, 12 07, 12
Centaurea nigra 12 Cerastium fontanum 07, 08, 09, 12 07, 08, 09, 12 08, 10, 11, 12
Chenopodium album 07 07 07
Chenopodium polyspermum 07
Conyza spp. 11, 12 11, 12 11, 12
Coronopus didymus Daucus carota 08, 09, 10, 12 Echium vulgare Epilobium ciliatum 08, 12 Fragaria vesca Leontodon hispidus 12
Leucanthemum vulgare 08, 10, 12 08, 09, 10, 11, 12 09, 10, 11, 12
Linaria vulgaris 08, 09, 12 Lotus corniculatus 08, 09, 10, 12 08, 09, 10, 11, 12 09, 10, 11, 12
Matricaria discoidea 07 Matricaria recutita 07, 12 07 07
Mycelis muralis Origanum vulgare Papaver dubium 07 07 07
Papaver rhoeas 07 07 07
Plantago media Prunella vulgaris 08, 09, 11 08, 09, 12 09, 11, 12
Reseda lutea Rumex acetosella 08 Rumex obtusifolius Sagina procumbens 07, 08, 09, 10, 11, 12 08, 09, 12 09, 10
Sanguisorba minor 09, 10 09, 10 12
Sedum acre 08, 09, 10, 11, 12 08, 09, 10, 11, 12 08, 09, 10, 11, 12
Senecio vulgaris 07, 08, 11, 12 07, 08, 11, 12 08, 11, 12
Silene latifolia 10 Silene vulgaris 09 07, 08, 09, 10, 11, 12 07, 08, 09, 10, 12
Sisymbrium officinale 08 Sonchus asper 11, 12 11 Sonchus oleraceus Taraxacum agg. 12 Trifolium arvense 08, 09, 10, 11, 12 08, 09, 10, 11, 12 11, 12

Trifolium dubium 08, 09 Trifolium repens 09, 10, 12 10 Verbascum thapsus Veronica persica 07, 08, 11, 12 Viola tricolor 07, 08, 12 07, 08, 12 08, 12
1068
1069
1070
1071
1072
1073
1074
1075
1076
1077
1078
1079
1080
1081
1082
1083
1084
1085
1086
1087
1088
1089

Supplementary materials 7 Change in the modal Domin-Krajina cover-abundance of 1090
four seeded species of forb over time for the three mulch treatments: (a) Compost, (b) 1091
Sandy loam, and (c) No mulch. 1092
1093
0
1
2
3
4
5
6
7
8
Ju
n0
7
Ju
l07
Se
pt0
7
Oct0
7
De
c0
7
Ap
r08
Ma
y0
8
Ju
l08
Se
pt0
8
Jun0
9
Sept0
9
Ju
n1
0
Au
g1
0
Ma
y1
1
Au
g1
1
Ju
n1
2
Au
g1
2
(a)
0
1
2
3
4
5
6
7
8
Ju
n0
7
Ju
l07
Se
pt0
7
Oct0
7
De
c0
7
Apr0
8
Ma
y0
8
Ju
l08
Se
pt0
8
Ju
n0
9
Se
pt0
9
Ju
n1
0
Au
g1
0
Ma
y1
1
Au
g1
1
Jun1
2
Au
g1
2
P. rhoeas
L. vulgare
S. acre
L. corniculatus
Do
min
-Kra
jin
a c
ov
er-
ab
un
da
nc
e (b)
0
1
2
3
4
5
6
7
8
Ju
n0
7
Ju
l07
Se
pt0
7
Oct0
7
De
c0
7
Ap
r08
Ma
y0
8
Ju
l08
Se
pt0
8
Ju
n0
9
Se
pt0
9
Ju
n1
0
Au
g1
0
Ma
y1
1
Au
g1
1
Jun1
2
Aug1
2
Survey time window
(c)
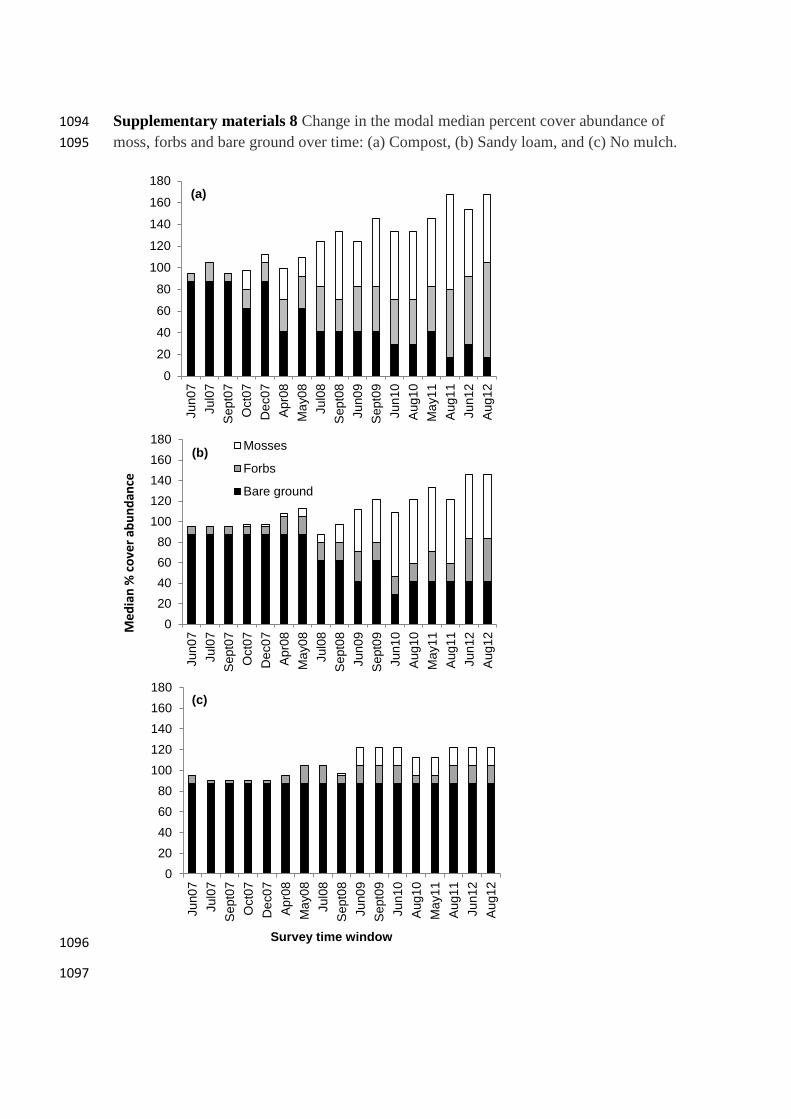
Supplementary materials 8 Change in the modal median percent cover abundance of 1094
moss, forbs and bare ground over time: (a) Compost, (b) Sandy loam, and (c) No mulch. 1095
1096
1097
0
20
40
60
80
100
120
140
160
180Ju
n0
7
Ju
l07
Se
pt0
7
Oct0
7
De
c0
7
Ap
r08
Ma
y0
8
Ju
l08
Se
pt0
8
Ju
n0
9
Se
pt0
9
Ju
n1
0
Au
g1
0
Ma
y1
1
Aug1
1
Ju
n1
2
Au
g1
2
(a)
0
20
40
60
80
100
120
140
160
180
Ju
n0
7
Ju
l07
Se
pt0
7
Oct0
7
De
c0
7
Ap
r08
Ma
y0
8
Ju
l08
Se
pt0
8
Ju
n0
9
Se
pt0
9
Ju
n1
0
Au
g1
0
Ma
y1
1
Au
g1
1
Ju
n1
2
Au
g1
2
Mosses
Forbs
Bare ground
Med
ian
% c
ove
r ab
un
dan
ce
(b)
0
20
40
60
80
100
120
140
160
180
Ju
n0
7
Ju
l07
Se
pt0
7
Oct0
7
De
c0
7
Ap
r08
Ma
y0
8
Ju
l08
Se
pt0
8
Ju
n0
9
Se
pt0
9
Ju
n1
0
Au
g1
0
Ma
y1
1
Aug1
1
Jun1
2
Aug1
2
Survey time window
(c)