effects of urbanization changes on landuse in yenagoa ... commons attribution license, ......
TRANSCRIPT

International Journal of Development and Sustainability
ISSN: 2186-8662 – www.isdsnet.com/ijds
Volume 6 Number 8 (2017): Pages 728-745
ISDS Article ID: IJDS17072801
Effects of urbanization changes on landuse in Yenagoa Metropolis, Bayelsa State, Nigeria (1986-2013)
Olatunde Sunday Eludoyin *, Andrew Adesola Obafemi, Theophilus Hardy
Department of Geography and Environmental Management, University of Port Harcourt, Port Harcourt, Nigeria
Abstract
This study investigated the impacts of urbanization on landuse change in Yenagoa Metropolis. Landsat imageries of
1986, 2009 and 2013 were acquired from the United States Geological Survey for the study. Supervised classification
using the Maximum Likelihood Classification Algorithm was employed. The impact of urbanization on other landuse
was determined by using Overlay (INTERSECT module). The areal extent captured by built-up area in each of the
overlay analyses was calculated in squared kilometres. The probability landuse change of 5 years, 10 years and 20
years was predicted using Probability Markovian Algorithm. Percentage land consumption rate (PLCR) was also
determined using a standard method. Descriptive statistics were employed to explain the landuse trend and
magnitude of landuse change. Findings show that built-up area was 36.09km2 in 1986, 83.27km2 in 2009 and
102.25km2 in 2013 while the percentage change of built-up area from 1986 to 2013 was 66.16 km2. Sparse
vegetation had the highest probability of changing to built-up area in 2023 (39.81%), 2033 (46.27%) and 2043
(54.83%). The PLCR was 0.085%, 0.035% and 0.039% in 1986, 2009 and 2013 respectively. The study
recommended that campaign against deforestation and sensitise people on the effects of improper landuse change
should be encouraged.
Keywords: Urbanization; Landuse/Landcover; Landuse Change; Landsat; Yenagoa
* Corresponding author. E-mail address: [email protected]
Published by ISDS LLC, Japan | Copyright © 2017 by the Author(s) | This is an open access article distributed under the
Creative Commons Attribution License, which permits unrestricted use, distribution, and reproduction in any medium,
provided the original work is properly cited.
Cite this article as: Eludoyin, O.S., Obafemi, A.A. and Hardy, T. (2017), “Effects of urbanization changes on landuse in Yenagoa
Metropolis, Bayelsa State, Nigeria (1986-2013)”, International Journal of Development and Sustainability, Vol. 6 No. 8, pp. 728-
745.

International Journal of Development and Sustainability Vol.6 No.8 (2017): 728-745
ISDS www.isdsnet.com 729
1. Introduction
Urban population is experiencing rapid growth as a result of the influx of many people and the growing level
of industrial activities which has affected environmental conservation management practices in Nigeria
(Iyorakpo, 2015). The world’s urbanization since 1850 partly reflects a corresponding acceleration of world
population growth, but urbanization is not merely an increase in the average density of human settlement
(Lowry, 1990). Thus, there is a global shift of world’s urban population from developed to developing
countries, which will account for about 80 percent of world’s urbanites by 2030, doubling from 40 percent in
1950 (Soja and Kanai, 2007). Today’s increasingly global and interconnected world, over half of the world’s
population (54%) lives in urban areas. The continuing urbanization and overall growth of the world’s
population is projected to add 2.5 billion people to the urban population by 2050, with nearly 90% of the
concentrated in Asia and Africa (United Nations Department of Economics and Social Affairs, Population
Division (UNDESAPD, 2014).
However, landuse planning which aims at organizing various landuse to secure maximum economy and
convenience for the populace is becoming a huge challenge in the developing world (Adeyemo and Arokoyu,
2002). The study of landuse/landcover change is very important to have proper planning and utilization of
natural resources and their management. One of the critical concerns of the world today is on land use/land
cover change because of the consequences they have on weather and climate, surface run-off in relation to
erosion and flooding, ecological biodiversity, socio-economic and health (Lambin et al., 2003). This is largely
because landuse/land cover change has considerable effects on bio-physical, bio-geophysical, bio-
geochemical, hydro-meteorological processes (Abubakar et al., 2002; Ndabula et al., 2013).
Land use and land cover is driven by a variety of socio-economic, economic, political, cultural,
technological and bio-physical factors (De Sherbinin, 2002). Land cover change is one of the most important
variables of environmental change and represents the largest threat to ecological systems (Foody, 2002). The
quest and strive toward industrialization, technological innovations and the drive to modernism have
resulted to modification and change in landuse and landcover in a region. Geospatial technologies are have
been used for advanced ecosystem management, landuse mapping and planning; and the collection of
remotely-sensed data facilitates the synoptic analyses of earth-system functions, patterning, and change at
local, regional as well as at global scales over time (Lambin, 2007). As a result of technological advancements,
changes of the earth’s surface have become visible by satellite imagery and at such remote sensing and
geographic information systems have become the most effective tool for assessing and monitoring and
detecting environmental changes (Anderson et al., 2001; Musaoglu et al., 2002; Tardie and Congalton, 2002).
Yenagoa City is characterized by remarkable growth in population, expansion and developmental activities
which have resulted in increased land consumption and alteration of the earth surface (land).The increasing
concern for the management of natural resources in recent times has been necessitated by the increase in
demographic pressure and its associated anthropogenic activities which have led to serious environmental
stress and ecological instability. The outcome of the natural and socio-economic factors of landuse and land
cover in Yenagoa calls for an accurate investigation in the causes, processes and rate of landuse and
landcover change in the metropolis.

International Journal of Development and Sustainability Vol.6 No.8 (2017): 728-745
730 ISDS www.isdsnet.com
Several researches on landuse and land cover change in the Niger Delta have been reported in literature.
For instance, Mmom (2008) investigated the impact of land use change on urban floodplains in Port Harcourt
Metropolis. Chukwu-Okeah and Mmom (2012) studied the implication of landuse change on hydro-
meteorological events in Port Harcourt. Kurotiminipre and Winston (2013) investigated land use and land
cover changes between 1998 and 2008 in Yenagoa. None of these studies considered the influence of
urbanization on landuse and land cover of any part in the Niger Delta especially Yenagoa City and majority of
the studies made use of questionnaire as the instrument of investigation which is mere perception of
landuse/ land cover change by the residents. The use of geospatial technologies to quantify and ascertain the
past and present landuse in Yenagoa City was scanty. This suggests also that little is documented on the
impact of urbanization on landuse in Yenagoa City. Against this background, the present study examined the
current status of landuse and land cover of Yenagoa City with a view to determining the influence of
urbanization on the landuse and land cover using satellite images of 1986, 2009 and 2013.
2. Methodology
2.1. Study area
The study area is Yenagoa City in Yenagoa LGA of Bayelsa State. The study area lies along latitudes between
4o 48ʹ 00ʹʹ North and 5o 24ʹ 10ʹʹEast; and longitudes between 6o 12ʹ 00ʹʹE and 6o 39ʹ 30ʹʹE (Figure 1). It is
bounded by Rivers State on the North and East, Delta State on the North West and West, Ogbia LGA on the
South East and Southern Ijaw on the South west. Yenagoa LGA has a population of 352,285 by 1996 estimate
(National Bureau of Statistics, 2006). The climate of Yenagoa LGA is an equatorial type of climate (Iyorakpo,
2015). Rainfall occurs generally every month of the year. The mean monthly temperature is 25oC to 31oC. The
hottest months are December to April. The difference between the wet season and dry season on
temperature is about 2oC. Relative humidity is high throughout the year and decreases slightly during the dry
season. The study area is located within the lower delta plain believed to have been formed during the
Holocene of the quaternary period by the accumulation of sedimentary deposits. Generally, Yenagoa is
situates on lowland with the elevation between 3m and 7m above mean sea level and characterized by flood
plains. It is drained by Epie Creek, Orashi River and Ekole Creek. The major soil types in the state are young,
shallow and poorly drained soils. There are, however, variations; some soils occupy extensive areas whereas,
some are of limited extent. The soil texture ranges from medium to fine grains. Like any other area in the
Niger Delta; the vegetation is composed mangrove forests, freshwater swamp and lowland rain forests. The
main occupations include farming and fishing.
2.2. Landuse change detection and landuse percentage change
Landuse map of different periods in Yenagoa metropolis was acquired from the landsat imagery of 30m x
30m of 1986, 2009 and 2013 obtained from the United States Geological Survey (USGS). Composite analysis
was done on the imageries in each period to produce a false composite imagery in ArcGIS 10.1. From the

International Journal of Development and Sustainability Vol.6 No.8 (2017): 728-745
ISDS www.isdsnet.com 731
ground-truthing of the land use types in the area derived through reconnaissance survey, four major landuse
types were identified namely built-up area, sparse vegetation/farmland, thick vegetation and waterbodies.
The built-up area landuse was chosen to represent urbanization (Mohapatra et al., 2014). The boundary of
Yenagoa metropolis was derived from the topographic map and this was used to clip the imageries to
maintain the boundary of the study area.
Figure 1. Yenagoa Metropolis
In Erdas Imagine 9.1, training sites were generated from the imagery to carry out supervised classification
using the Maximum Likelihood Classification Algorithm. The landuse detected were subjected to accuracy
test with the use of Kappa’s index. The spatial coverage of each landuse type was determined in squared
kilometers using the calculate geometry module of ArcGIS 10.1.
The area of landuse in each year was calculated and simple arithmetic was done by subtracting the area of
landuse in initial year from the final year. The difference gave the landuse change in terms of spatial coverage
and direction of change. The percentage change of each landuse was then computed to determine the
percentage increase or decrease of each landuse using the formula in Eq. 1.
International Journal of Development and Sustainability Vol.6 No.8 (2017): 728-745
732 ISDS www.isdsnet.com
LU Final – LU Initial x 100 (Eq. 1)
2.3. Prediction landuse map and determination of the impact of urbanization on other landuse
The probability landuse change of 5 years, 10 years and 20 years was predicted using Probability Markovian
Algorithm in Idrisi Selva. This gave room to determine the probability of built-up area changing to another
landuse and vice versa in Yenagoa metropolis. The built-up area was considered the index of urbanization.
The impact of urbanization on other landuse was determined by overlaying the landuse of previous year on
the later year (1986 on 2009; 2009 on 2013) using INTERSECT module. The areal extent captured by built-
up area in each of the overlay analyses was calculated in squared kilometres.
2.4. Land Absorption Rate (LAR)
LCR is a measure of detecting the rate at which land is being consumed by the residing population (Bankole
and Bakare, 2011). Through this measure, a prediction of land that is expected to be consumed by the
teeming resident population could be determined, which could also be used to determine the rate of urban
expansion (Bankole and Bakare, 2011). It could therefore be concluded that LCR is a function of increase in
urban land use (that is change in urban landuse) (Bankole and Bakare, 2011). Land consumption rate is the
ratio of spatial coverage of built-up area and population in the recent year of consideration (Eq. 2).
L.C.R = A/Px100 (Eq. 2)
where, A denotes areal extent of the city in squared kilometers, and P denotes population (Yeates and Garner,
1976).
Both the 2009, 2013, 2023, 2033, 2043 population figures were estimated from the 1991 and the
estimated 2006 population figures of Yenagoa Metropolis (with 14 years interval each) using the
recommended National Population Commission (NPC) 2.3% growth rate as obtained from the 1991/2006
censuses (Bankole and Bakare, 2011).
Population projection formula applied was arithmetic progression in nature. Projection equation is Pt =
Po (1 + r t), where,
Pt = size of the population in year t (estimated population of 2009, 2013, 2023, 2033, 2043)
Po = size of the population in the base year (1991 and 2006 population figures)
r = average annual rate of growth (2.3%) (NPC, 1991; National Bureau of Statistics (NBS), 2012)
t = length of the time interval,
and
Population in 1991 =105887 (NPC, 1991)
Population in 2006 = 219199 (NBS, 2012)
Population in 1986 = 42355 (Determined from 1991 population census as it was discovered that
population have increased by 3.0% from 1963 to 1991 (Osungade, 1995).
Population in 2009 (Projected from population of 2006)

International Journal of Development and Sustainability Vol.6 No.8 (2017): 728-745
ISDS www.isdsnet.com 733
Population in 2013 (Projected from population of 2009)
2.5. Method data analysis
Descriptive statistics was employed in this study to explain the percentages of the area of landuse direction
and magnitude of landuse change. Spearman’s rank correlation statistics was used to test the relationship
between population growth and vegetal cover in Yenagoa metropolis between 1986 and 2013 while analysis
of variance was used to test the variation in the influence of urbanization (built-up area) on other landuse
between 1986 and 2013.
3. Results
3.1. Landuse pattern between 1986 and 2013
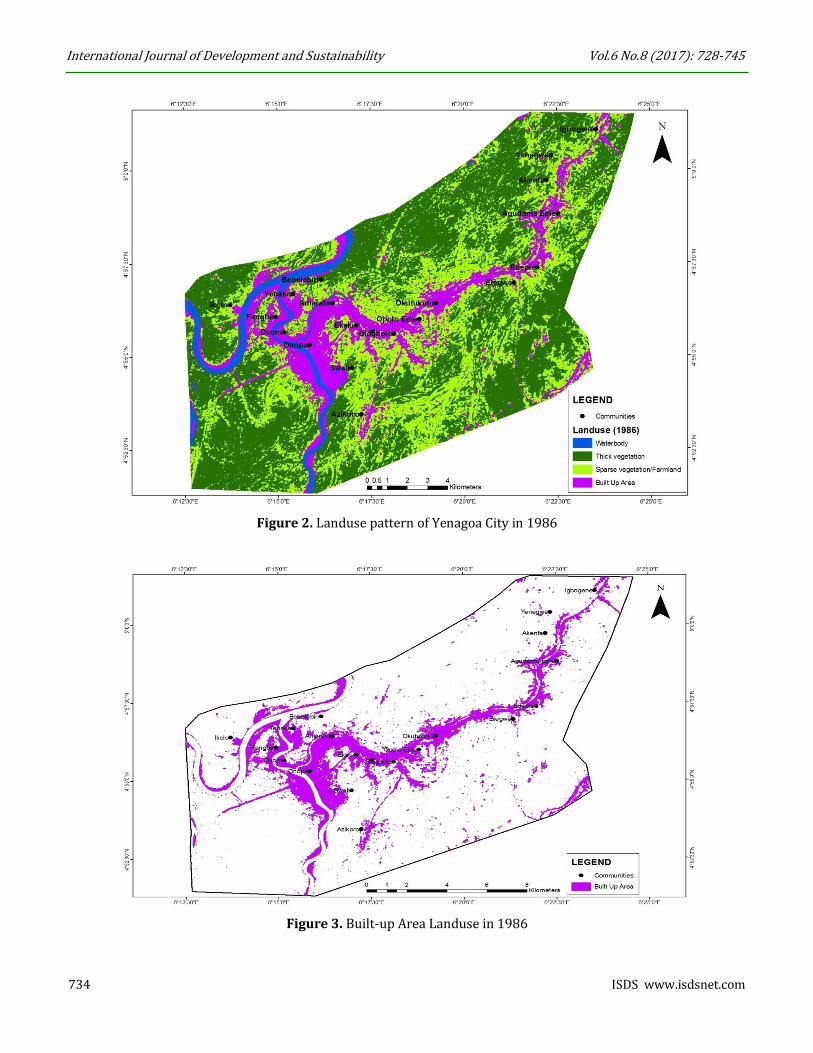
Table 1 shows the landuse pattern of Yenagoa City between 1986 and 2013. In 1986, it is revealed that the
waterbodies had 8.34 km2 (3.25%) of total areal of Yenagoa City, thick vegetation had 129.64 km2 (50.46%),
Sparse vegetation/farmland had 82.86 km2 (32.25%) while built-up area had 36.09 km2 (14.05%) (Figure 2;
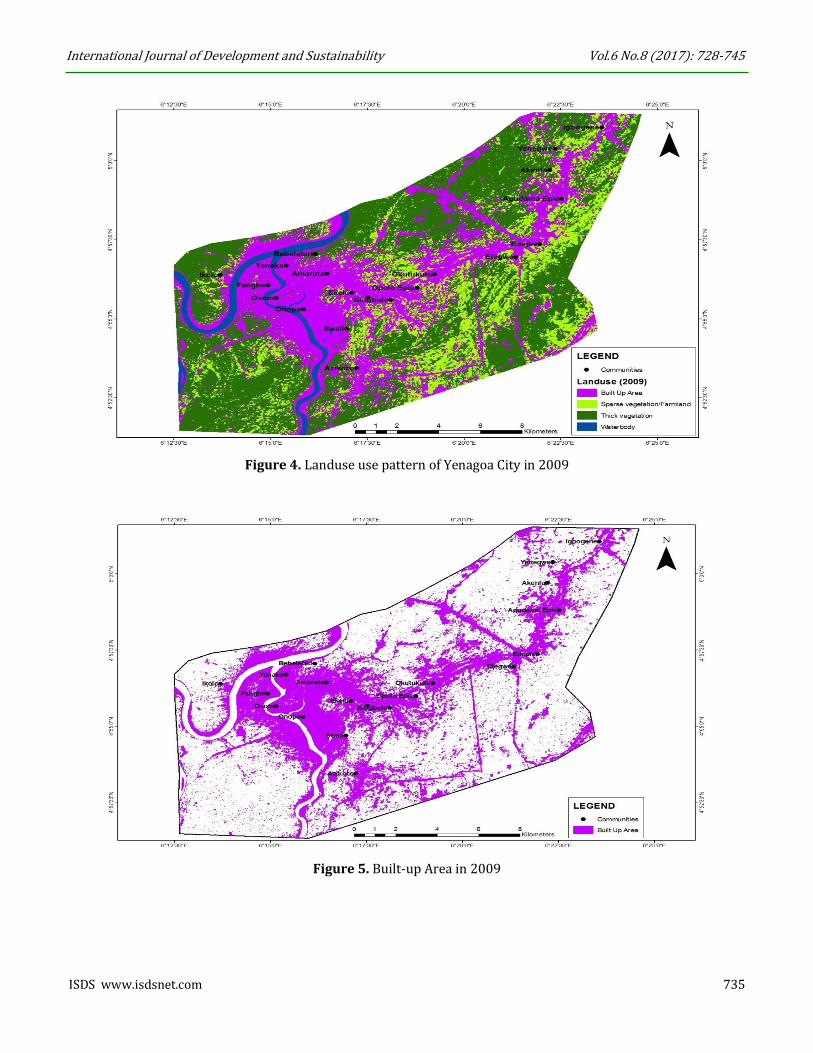
Figure 3). In 2009, the analysis reveals that waterbodies reduced to 8.30 km2 (3.23%) while thick vegetation,
sparse vegetation/farmland and built-up area had 114.93 km2 (44.73%), 50.43 km2 (19.63%) and 83.27 km2
(32.41%) respectively (Figure 4; Figure 5). In 2013, waterbodies had 9.01 km2 (3.51%), thick vegetation had
105.74 km2 (41.15%), sparse vegetation/farmland had 39.94 km2 (15.54%) while built-up area had 102.25
km2 (39.80%) (Figure 6; Figure 7). From the analysis, it is shown that the extent of waterbodies was
fluctuating from 1986 to 2013 while thick vegetation and sparse vegetation/farmland continued to decrease.
However, built-up area was increasing from 1986 to 2013.
Table 1. Landuse pattern of Yenagoa City between 1986 and 2013
1986 2009 2013
Landuse Areal
coverage
(km2)
Percentage
(%)
Areal
coverage
(km2)
Percentage
(%)
Areal
coverage
(km2)
Percentage
(%)
Waterbodies 8.34 3.25 8.30 3.23 9.01 3.51
Thick vegetation 129.64 50.46 114.93 44.73 105.74 41.15
Sparse vegetation/Farmland
82.86 32.25 50.43 19.63 39.94 15.54
Built-up Area 36.09 14.05 83.27 32.41 102.25 39.80
Total 256.94 100.00 256.94 100.00 256.94 100.00
International Journal of Development and Sustainability Vol.6 No.8 (2017): 728-745
734 ISDS www.isdsnet.com
Figure 2. Landuse pattern of Yenagoa City in 1986
Figure 3. Built-up Area Landuse in 1986
International Journal of Development and Sustainability Vol.6 No.8 (2017): 728-745
ISDS www.isdsnet.com 735
Figure 4. Landuse use pattern of Yenagoa City in 2009
Figure 5. Built-up Area in 2009

International Journal of Development and Sustainability Vol.6 No.8 (2017): 728-745
736 ISDS www.isdsnet.com
Figure 6. Landuse pattern of Yenagoa City in 2013
Figure 7. Built-up Area in 2013

International Journal of Development and Sustainability Vol.6 No.8 (2017): 728-745
ISDS www.isdsnet.com 737
3.2. Landuse change and percentage change
The landuse change and percentage change is presented in Table 2. Waterbodies decreased between 1986
and 2009 by 0.04 km2 (0.48%) while thick vegetation and sparse vegetation/farmland also decreased 14.71
km2 (11.35%) and 32.43 km2 (39.14%) respectively during these periods. However, built-up area increased
between 1986 and 2009 by 47.18 (130.73%). Between 2009 and 2013, waterbodies increased by 0.71 km2
(8.55%), thick vegetation and sparse vegetation/farmland decreased by 9.19 km2 (8.00%) and 10.49 km2
(20.80%). Meanwhile, built-up area increased by 18.98 km2 (22.79%).
Table 2. Landuse change and percentage change between 1986 and 2009
Landuse 1986 2009 Change (km2) Percentage
Change (%)
Waterbodies 8.34 8.30 -0.04 -0.48
Thick vegetation 129.64 114.93 -14.71 -11.35
Sparse vegetation/Farmland 82.86 50.43 -32.43 -39.14
Built-up Area 36.09 83.27 +47.18 +130.73
Total 256.94 256.94
Landuse 2009 2013 Change (km2) Percentage
Change (%)
Waterbodies 8.30 9.01 +0.71 +8.55
Thick vegetation 114.93 105.74 -9.19 -8.00
Sparse vegetation/Farmland 50.43 39.94 -10.49 -20.80
Built-up Area 83.27 102.25 18.98 +22.79
Total 256.94 256.94
Landuse 1986 2013 Change (km2) Percentage
Change (%)
Waterbodies 8.34 9.01 +0.67 +8.03
Thick vegetation 129.64 105.74 -23.90 -18.44
Sparse vegetation/Farmland 82.86 39.94 -42.92 -51.80
Built-up Area 36.09 102.25 +66.16 +183.32
Total 256.94 256.94
Generally, between 1986 and 2013, waterbodies increased by 0.67 km2 (8.03%), thick vegetation decreased
by 23.90 km2 (18.44%), sparse vegetation/farmland decreased by 42.92 km2 (51.80%) while built-up area

International Journal of Development and Sustainability Vol.6 No.8 (2017): 728-745
738 ISDS www.isdsnet.com
increased by 66.16 km2 (183.32%). It is therefore revealed from the analysis of percentage change that
waterbodies and built-up area increased in terms of areal extent while thick vegetation and sparse
vegetation/farmland continued to decrease between 1986 and 2013.
3.3. Impacts of urbanization on other Landuse in Yenagoa Metropolis
Table 3, Figure 8 and Figure 9 presents the spatial extent of other landuse captured by built-up area in
Yenagoa metropolis between 1986 and 2013. It was discovered that between 1986 and 2009, built-up area
captured 0.55 km2 (1.11%) of waterbodies, 16.95 km2 (34.13%) of thick vegetation and 32.16 km2 (64.76%)
were lost to built-up area. However, 1.41 km2 (3.31%) of waterbodies, 19.75 km2 (46.44%) and 21.37 km2
(50.25%) were lost to built-up area between 2009 and 2013. Thus, the total spatial extent of other landuse
lost to built-up area (urbanization) between 1986 and 2009 was 49.66 km2 while it was 42.53% km2
between 2009 and 2013.
3.4. Probability of Landuse change in Yenagoa Metropolis
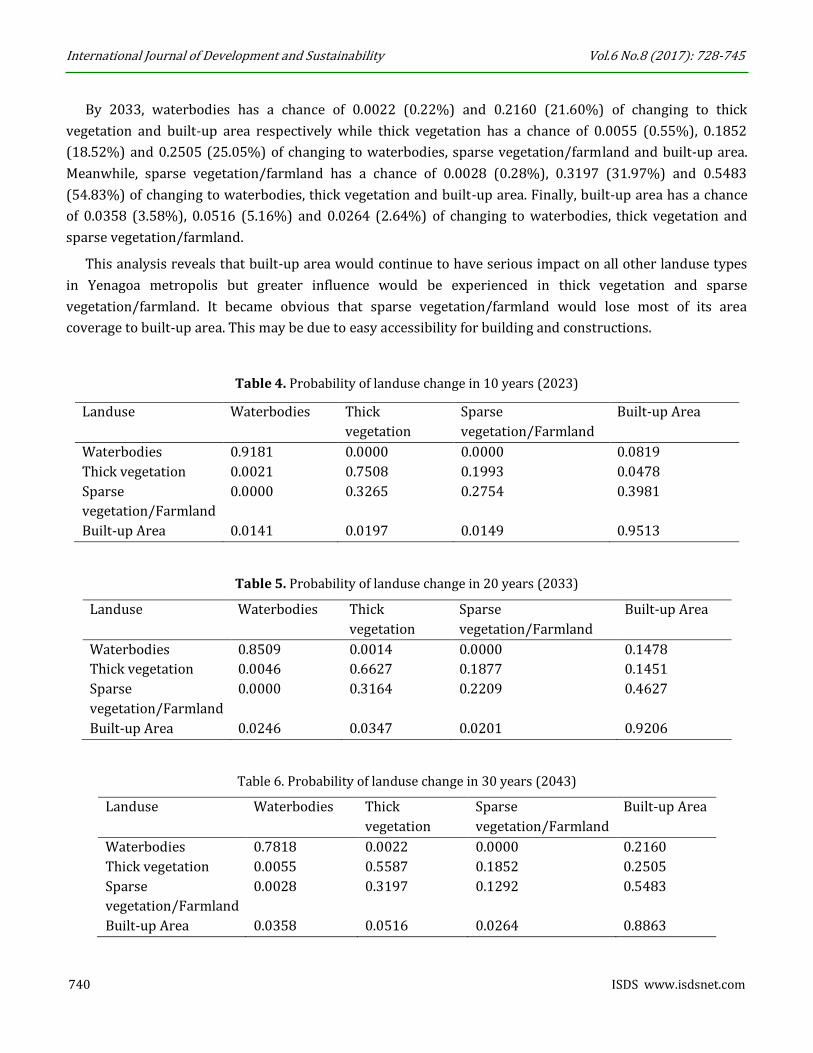
Tables 4, 5 and 6 show the probabilities of landuse to change to another in Yenagoa Metropolis in 2023, 2033
and 2043 respectively. By 2023, waterbodies has a chance of 0.0819 (8.19%) of changing to built-up area
while thick vegetation has a chance of 0.0021 (0.21%) of changing to waterbodies, 0.1993 (19.93%) of
changing to sparse vegetation/farmland and 0.0478 (4.78%) of changing to built-up area. However, sparse
vegetation/farmland has chance of 0.3265 (32.65%) of changing to thick vegetation and 0.3981 (39.81%) of
changing to built-up area. Built-up area has a chance of 0.0141 (1.41%), 0.0197 (1.97%) and 0.0149 (1.49%)
of changing to waterbodies, thick vegetation and sparse vegetation/farmland respectively.
By 2023, waterbodies has a chance of 0.0014 (0.14%) and 0.1478 (14.78%) of changing to thick
vegetation and built-up area while thick vegetation has a chance of 0.0046 (0.46%), 0.1877 (18.77%) and
0.1451 (14.51%) of changing to waterbodies, sparse vegetation/farmland and built-up area respectively.
Moreover, sparse vegetation/farmland has a chance of 0.3164 (31.64%) and 0.4627 (46.27%) of changing to
thick vegetation and built-up area respectively while built-up area has a chance of 0.0246 (2.46%), 0.0347
(3.47%) and 0.0201 (2.01%) of changing to waterbodies, thick vegetation and sparse vegetation/farmland
respectively.
Table 3. Urbanization impacts on landuse
Landuse 1986-2009 2009-2013 Change
Spatial Coverage
(km2)
Percentage
(%)
Spatial Coverage
(km2)
Percentage
(%)
Waterbodies 0.55 1.11 1.41 3.31 +0.86
Thick vegetation 16.95 34.13 19.75 46.44 +2.8
Sparse
vegetation
32.16 64.76 21.37 50.25 -10.79
Total 49.66 100.00 42.53 100.00 -7.13

International Journal of Development and Sustainability Vol.6 No.8 (2017): 728-745
ISDS www.isdsnet.com 739
Figure 8. Urbanization impacts on landuse between 1986 and 2009
Figure 9. Urbanization impacts on landuse between 2009 and 2013
International Journal of Development and Sustainability Vol.6 No.8 (2017): 728-745
740 ISDS www.isdsnet.com
By 2033, waterbodies has a chance of 0.0022 (0.22%) and 0.2160 (21.60%) of changing to thick
vegetation and built-up area respectively while thick vegetation has a chance of 0.0055 (0.55%), 0.1852
(18.52%) and 0.2505 (25.05%) of changing to waterbodies, sparse vegetation/farmland and built-up area.
Meanwhile, sparse vegetation/farmland has a chance of 0.0028 (0.28%), 0.3197 (31.97%) and 0.5483
(54.83%) of changing to waterbodies, thick vegetation and built-up area. Finally, built-up area has a chance
of 0.0358 (3.58%), 0.0516 (5.16%) and 0.0264 (2.64%) of changing to waterbodies, thick vegetation and
sparse vegetation/farmland.
This analysis reveals that built-up area would continue to have serious impact on all other landuse types
in Yenagoa metropolis but greater influence would be experienced in thick vegetation and sparse
vegetation/farmland. It became obvious that sparse vegetation/farmland would lose most of its area
coverage to built-up area. This may be due to easy accessibility for building and constructions.
Table 4. Probability of landuse change in 10 years (2023)
Landuse Waterbodies Thick
vegetation
Sparse
vegetation/Farmland
Built-up Area
Waterbodies 0.9181 0.0000 0.0000 0.0819
Thick vegetation 0.0021 0.7508 0.1993 0.0478
Sparse
vegetation/Farmland
0.0000 0.3265 0.2754 0.3981
Built-up Area 0.0141 0.0197 0.0149 0.9513
Table 5. Probability of landuse change in 20 years (2033)
Landuse Waterbodies Thick
vegetation
Sparse
vegetation/Farmland
Built-up Area
Waterbodies 0.8509 0.0014 0.0000 0.1478
Thick vegetation 0.0046 0.6627 0.1877 0.1451
Sparse
vegetation/Farmland
0.0000 0.3164 0.2209 0.4627
Built-up Area 0.0246 0.0347 0.0201 0.9206
Table 6. Probability of landuse change in 30 years (2043)
Landuse Waterbodies Thick
vegetation
Sparse
vegetation/Farmland
Built-up Area
Waterbodies 0.7818 0.0022 0.0000 0.2160
Thick vegetation 0.0055 0.5587 0.1852 0.2505
Sparse
vegetation/Farmland
0.0028 0.3197 0.1292 0.5483
Built-up Area 0.0358 0.0516 0.0264 0.8863
International Journal of Development and Sustainability Vol.6 No.8 (2017): 728-745
ISDS www.isdsnet.com 741
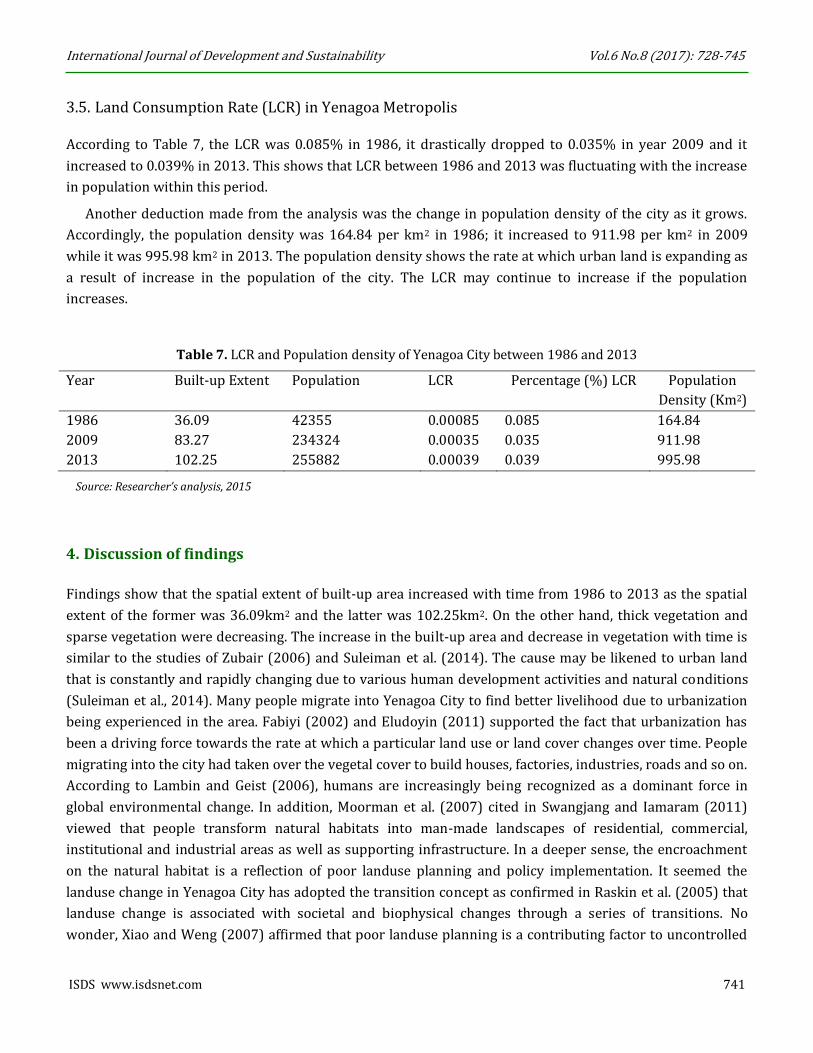
3.5. Land Consumption Rate (LCR) in Yenagoa Metropolis
According to Table 7, the LCR was 0.085% in 1986, it drastically dropped to 0.035% in year 2009 and it
increased to 0.039% in 2013. This shows that LCR between 1986 and 2013 was fluctuating with the increase
in population within this period.
Another deduction made from the analysis was the change in population density of the city as it grows.
Accordingly, the population density was 164.84 per km2 in 1986; it increased to 911.98 per km2 in 2009
while it was 995.98 km2 in 2013. The population density shows the rate at which urban land is expanding as
a result of increase in the population of the city. The LCR may continue to increase if the population
increases.
Table 7. LCR and Population density of Yenagoa City between 1986 and 2013
Year Built-up Extent Population LCR Percentage (%) LCR Population
Density (Km2)
1986 36.09 42355 0.00085 0.085 164.84
2009 83.27 234324 0.00035 0.035 911.98
2013 102.25 255882 0.00039 0.039 995.98
Source: Researcher’s analysis, 2015
4. Discussion of findings
Findings show that the spatial extent of built-up area increased with time from 1986 to 2013 as the spatial
extent of the former was 36.09km2 and the latter was 102.25km2. On the other hand, thick vegetation and
sparse vegetation were decreasing. The increase in the built-up area and decrease in vegetation with time is
similar to the studies of Zubair (2006) and Suleiman et al. (2014). The cause may be likened to urban land
that is constantly and rapidly changing due to various human development activities and natural conditions
(Suleiman et al., 2014). Many people migrate into Yenagoa City to find better livelihood due to urbanization
being experienced in the area. Fabiyi (2002) and Eludoyin (2011) supported the fact that urbanization has
been a driving force towards the rate at which a particular land use or land cover changes over time. People
migrating into the city had taken over the vegetal cover to build houses, factories, industries, roads and so on.
According to Lambin and Geist (2006), humans are increasingly being recognized as a dominant force in
global environmental change. In addition, Moorman et al. (2007) cited in Swangjang and Iamaram (2011)
viewed that people transform natural habitats into man-made landscapes of residential, commercial,
institutional and industrial areas as well as supporting infrastructure. In a deeper sense, the encroachment
on the natural habitat is a reflection of poor landuse planning and policy implementation. It seemed the
landuse change in Yenagoa City has adopted the transition concept as confirmed in Raskin et al. (2005) that
landuse change is associated with societal and biophysical changes through a series of transitions. No
wonder, Xiao and Weng (2007) affirmed that poor landuse planning is a contributing factor to uncontrolled
International Journal of Development and Sustainability Vol.6 No.8 (2017): 728-745
742 ISDS www.isdsnet.com
expansion of the urban area. Eludoyin (2011) agreed that the decrease in the spatial extent of mangrove,
primary forest, and sparse vegetation is mainly due to encroachment into these landuse types largely due to
constructions. Thus, the outcome of the encroachment into the vegetal cover of Yenagoa City would have
resulted into serious environmental degradation. Pellika et al. (2004) believed that the outcome of the
pressure are numerous and they included intensified agriculture, decreasing amount of forestland, loss of
biodiversity, intensified land degradation and soil erosion.
The LCR increased in 1986 and dropped in 2009 and started increasing in 2013. This is similar to Zubair
(2006) whereby the progressive spatial expansion of Ilorin in 1972/1986 dropped between 1986 and 2001.
The rising population are the basis of the growth the city is experiencing, though the population are unevenly
distributed but their aggregate impact on the development of the city may be tremendous which if not
properly controlled may be hazardous to the city (Bankole and Bakare, 2011).
The sparse vegetation/farmland decreased from 1986 to 2013. This is contrary to the study of Abubakar
et al. (2002) which reported that agricultural land increased from 117.00 km2 to 158.50 km2 in Talata Mafara
Area, Northern Nigeria. The sparse vegetated areas can be occupied easily by human activities especially
constructions while the decrease in the farmlands could be due to other means of livelihood aside farming in
the area especially crude oil exploration and exploitation. Though, Lambin et al. (2003) asserted that
historically humans have increased agricultural output mainly by bringing more land into production.
The crude oil production in Yenagoa City and its environs have made many people abandon farming for oil
work. This has been the tradition of many Niger Delta urban cities since the discovery of oil in 1957. United
Nations Development Programme (UNDP) (2006) affirmed that recently, the Niger Delta environment has
changed and continues to change rapidly. The human population has grown at a high rate. Industrialization,
urban development, and oil and gas exploration and exploitation have infringed on the people and their
environment, leading to the opening up of previously pristine ecosystems. This has resulted in the alteration
of habitats, biodiversity loss, deforestation and pollution. It is even more risky in future for the sparse
vegetation/farmland because the landuse projected analysis has revealed that built-up area had greater
chance of occupying sparse vegetation/farmland in the next 10 years, 20 years and 30 years. This may bring
food security under threat in which many people may lack adequate meal per day.
In addition waterbodies did not have a pattern between 1986 and 2013 but the projection analysis reveals
that built-up area would continue to occupy more of the spatial extent of waterbodies as 8.19%, 14.78% and
21.60% would be captured by built-up area in the next 10 years, 20 years and 30 years respectively. Built-up
area would occupy the thick vegetation but the greater impacts would be felt in 30 years’ time. This is a sign
of great depletion of forest in Yenagoa metropolis in future and as a result, global warming phenomenon is
very imminent. Effiong (2011) noted that forest reduced overtime in Calabar River Catchment and
propounded that if current rate of reduction in the high forest area is allowed to continue, there may be no
high forest again in the area in the next 50 years, jeopardizing the need of the future generation and causing
greater harm to the environment. Generally, the landuse change projection analysis gives the residents of
Yenagoa the doom expected on different landuse with respect to urbanization which may generally cause

International Journal of Development and Sustainability Vol.6 No.8 (2017): 728-745
ISDS www.isdsnet.com 743
environmental problems in Yenagoa metropolis. Bello and Arowosegbe (2014) concluded that landuse
change and environmental degradation have made too much damage in the world’s natural resources.
Finding also shows that the impact of urbanization was much on sparse vegetation/farmland and thick
vegetation within the years considered for this study. The percentage loss to built up area was still highest
despite the large spatial extent occupied by sparse vegetation/farmland landuse between 2009 and 2013.
Also, within this period, the spatial extent covered by urbanization into the waterbodies and thick vegetation
became higher than 1986-2009 period. The increase in the spatial area coverage into waterbodies could be
due to the sandfilling activities of some swampy, river beds and creeks in the area. As the sandfilling is done,
vegetation must be cut to have access, thus, thick vegetation becomes reduced.
5. Conclusion and recommendations
Urbanization has impacted other landuse type namely thick vegetation, sparse vegetation/farmland and
waterbodies between 1986 and 2013 using geo-information technologies. The rate at which development is
occurring in Yenagoa City though moderately but the residents need to be cautious so that the fragile
environment can be protected. It is therefore recommended that government should enact and implement
policies restraining individuals of illegal construction; educate individuals on illegal acquisition of virgin
land; campaign against deforestation; sensitize people on the effects of improper landuse change; and
encourage to assess landuse change periodically to discover the trend of change and to foresee the possible
landuse change in future.
References
Abubakar, S.M., Kudanmiya, Y.R. and Eyongs, P.N. (2002), “Assessing of Environmental Degradation Using
Satellite Remote Sensing Technologies in Talata Mafara Area, Northern Nigeria”, Environmental Review, Vol. 4
No. 1, pp. 577-586.
Adeyemo, A.M. and Arokoyu, S.B. (2002), Spatial Organisation: The Patterning of Human Behaviour in Space.
Port Harcourt, Amethyst & Colleague Publishers.
Anderson, J.R., Hardy, E.E., Roach, J.T. and Witmer, R.E. (2001), “A Landuse And Land Cover Classification
System For Use With Remote Sensor Data”, Geological Survey Professional Paper 964, U.S. Geological Survey
Circular 671. pp1-41.
Bankole, M.O. and Bakare, H.O. (2011), “Dynamics of urban land use changes with remote sensing: Case of
Ibadan”, Journal of Geography and Regional Planning, Vol. 4 No. 11, pp. 632-643.
Bello, I.K. and Arowosegbe, O.S. (2014), “Factors Affecting Land-Use Change on Property Values in Nigeria”,
Journal of Research in Economics and International Finance, Vol. 3 No. 4, pp. 79-82.

International Journal of Development and Sustainability Vol.6 No.8 (2017): 728-745
744 ISDS www.isdsnet.com
Chukwu-Okeah, G.O. and Mmom, P.C. (2012), “Sand Dredging and River Morphology Change along Parts of
New Calabar River in Akpor Area of Rivers State, Nigeria: Implications for Biological Resource Conservation”,
Res. J. Environ. and Earth Sci., Vol. 4 No. 1, pp. 76-91.
De Sherbinin, A., Kline, K. and Raustiala, K. (2002), “Remote Sensing Data; Valuable Support for
Environmental Treaties”, Enviroment, Vol. 44 No. 1, pp. 20-31.
Effiong, J. (2011), “Changing Pattern of Land Use in the Calabar River Catchment, South-eastern Nigeria”,
Journal of Sustainable Development, Vol. 4 No.1, pp 92-102.
Eludoyin, O.S., Wokocha, C.C. and Ayolagha, G. (2011), “GIS Assessment of Land Use and Land Cover Changes
in Obio/Akpor L.G.A., Rivers State, Nigeria”, Research Journal of Environmental and Earth Sciences, Vol. 3 No. 4,
pp. 307-313.
Fabiyi, O. (2002), “Geographical Information System, Techniques and Methods”, Research Support Services,
Ibadan, Nigeria, pp. 1-147.
Foody, G.M. (2002), “Status of Land Cover Classification Accuracy Assessment”, Remote Sensing of the
Environment, Vol. 80, pp 185–201.
Iyorakpo, J. (2015), “Impact of Rapid Urbanization on Environmental Quality in Yenagoa Metropolis, Bayelsa
State-Nigeria”, European Scientific Journal, Vol. 11 No. 23, pp. 255-268.
Kurotiminipre, A.L. and Winston, A.A. (2013), “Landuse/ Land cover Changes in Yenagoa, Bayelsa State”, In
FIG Working Week 2013 Environment for Sustainability Abuja, Nigeria, 6- 10 May 2013.
Lambin, E.F., Geist. H.J. and Lepers, E. (2003), “Dynamics of Land Use and Land Cover Change in Tropical
Regions”, Annu. Rev. Environ. Resour, Vol. 28, pp 205- 241.
Lambin, E.F., Geist, H.J. and Rindfuss, R.R. (2006), “Introduction: local processes with global impacts”, In:
Lambin, E.F., Geist, H.J. (Eds.), Land-Use and Land-Cover Change: Local Processes and Global Impacts, The IGBP
Series. Springer-Verlag, Berlin, Heidelberg, pp. 1- 8.
Lowry, I.S. (1990), “World Urbanization in Perspective”, Population and Development Review, Vol. 16, pp. 148-
176.
Mmom, P.C. (2008), “Urban Land Use Change and Its Socio-Economic Impact”, A Technical paper presented at
the Nigerian Environmental Society’s Annual Conference held in Calabar in 2008, Nigeria.
Mohapatra, S.N., Pani, P. and Sharma, M. (2014), “Rapid Urban Expansion and Its Implications on
Geomorphology: A Remote Sensing and GIS Based Study”, Geography Journal, Vol. 2014, pp 1-10.
Moorman, C., Mason, J., Hess, G. and Sinclair, K. (2006), “Designing Suburban Greenways to Provide Habitat
for Forest-Breeding Birds”, Landsc. Urban Plan, Vol. 80, pp. 153-164.
Musaoglu, N., Kaya, S., Seker, D.Z. and Goksel, C. (2002), “A Case Study of Using Remote Sensing Data and GIS
for Land Management, Catalca Region”, in FIG XXII International Congress Washington, DC, USA.
National Bureau of Statistics (NBS) (2012), “ Annual Abstract of Statistics, 2012” , Available at
https://www.nigerianstat.gov.ng/pdfuploads/annual_abstract_2012.pdf.
International Journal of Development and Sustainability Vol.6 No.8 (2017): 728-745
ISDS www.isdsnet.com 745
National Population Commission (1991), National Population Census 1991, Federal Government Printer,
Lagos.
Ndabula, C., Averik, P.D., Jidauna, G.G., Abaje, I., Oyatayo, T.K. and Iguisi, E.O. (2013), “Analysis of the Spatio-
temporal Dynamics of Landuse/land cover Structures in the Kaduna Innercore City Region, Nigeria” ,
American Journal of Environmental Protection, Vol. 1 No. 4, pp. 112-119.
Osungade, I.O. (1995), “The Nigerian Population Statistics”, In: Ipinyomi, R.A. (ed), 1995 Directory of Nigerian
Statisticians, List of Practising Statisticians and Related Workers with Papers on Population Figures and
Statistics, Vol. 2, pp. 46-71.
Pellika, P., Clark, B., Hurskainen, P., Keskinen, A., Lanne, M., Masalin, K., Nyman-Ghezelbash, P. and Sirvio, T.
(2004), “Land Use Change Monitoring Applying Geographic Information Systems in the Taita Hills, SE-Kenya”,
Proceedings of the 5th African Association of Remote Sensing of Environment Conference, 17- 22 Oct., 2004,
Nairobi, Kenya.
Raskin, P., Monks, F., Ribeiro, T., vanVuuren, D., and Zurek, M. (2005), “Global Scenarios in Historical
Perspectives”, In: Carpenter P.L.P.S.R., Bennett E.M. and Zurek M.B. (eds): Ecosystems and Human Well-Being
Scenarios: Findings of the Scenarios Working Group of the Millennium Ecosystem Assessment, Washington, DC,
USA, Island Press. Vol. 2, pp. 35-44.
Soja, E. and Kanai, M. (2007), “The Urbanization of the World”, In: Burdett R. and Sudjic D. (eds), The Endless
City, Phaidon, London.
Suleiman, Y.M., Saidu, S., Abdulrazaq, S.A., Hassan, A.B. and Abubakar, A.N. (2014), “The Dynamics of Land
Use Land Cover Change using Geospatial Techniques to Promote Sustainable Urban Development in Ilorin
Metropolis, Nigeria”, Asian Review of Environmental and Earth Sciences, Vol. 1 No. 1, pp. 8-15.
Swangjang, K. and Iamaram, V. (2011), “Change of Land Use Patterns in the Areas Close to the Airport
Development Area and Some Implicating Factors”, Sustainability, Vol. 3, pp. 1517-1530.
Tardie, P.S. and Congalton, R.G. (2002), “A Change Detection Analysis using Remotely-sensed Data to Assess
the Progression of Development in Essex County, Massachusetts from 1990 to 2001”, Proceedings of
ACSM/ASPRS Annual Conference in 2002, available at: http://www.unh.edu/naturalresources/pdf/tardie-
paper 1.pdf.
UNDP (2006), “Niger Delta Human Development Report”, UN House, Garki, Abuja, Nigeria, 384P.
UNDESAPD (2014), World Urbanization Prospects, United Nations, Department of Economic and Social Affairs,
Population Division (UNDESAPD), The 2014 Revision and Highlights (ST/ESA/SER.A/352).
Xiao, H. and Weng, Q. (2007), “The Impact of Landuse and Land Cover Changes On Land Surface Temperature
in a Karst Area of China”, J. Environ Manag., Vol. 85 No.1, pp. 245-257.
Yeates, M. and Garner, B. (1976), The North American City, Harper and Row Publishers, New York.
Zubair, A.O. (2006), Change Detection in Landuse and Land Cover Using Remote Sensing Data and GIS (A Case
Study of Ilorin and its Environs in Kwara State), Unpublished MSc Dissertation submitted to Department of
Geography, University of Ibadan. 1-54.