effects of the covid-19 pandemic on telehealth
TRANSCRIPT

Effects of the COVID-19 Pandemic on Telehealth
April 2021

Telehealth ObservationsAfter spiking in March 2020, the share of all ambulatory health visits conducted
virtually leveled off and ranged between 19-25% through January 2021.
– Prior to March 2020, virtual health represented only 0.3% of ambulatory visits.
– The volumes of ambulatory visits fell around the 3rd week of March 2020.
Organizations responded by shifting visits to the virtual environment, either with
telephone or video approaches.
– In the 4th quarter of 2019, only about 25,000 telehealth visits per month were performed by all
organizations. More than 2 million visits were recorded just in April of 2020.
▪ Only 8 organizations billed more than 8,000 telehealth visits in all of 2019. Members averaged
12,000 visits in April of 2020 alone.
– Telephone visits provided an opportunity to easily pivot to virtual. 29% of the virtual visits in April
2020 were telephone-only. By October, that had dropped to 17%.
– Even organizations with established Telehealth programs used telephone encounters to scale
upward.
Some clinical areas were better able to utilize telehealth than others.
– In April of 2020, specialty areas like Primary Care, Cardiology, Behavioral Health and Neurology
performed more than 70% of their ambulatory visits virtually.
– As in-person visits rose to near-normal in September and October, Behavioral Health and
Neurology retained telehealth as an approach with 63% and 33% virtual visits, respectively.
Vizient Presentation │ April 20212

Telehealth Key Takeaways
Behavioral Health and Neurology virtual visits have remained high.
– While virtual visits in many areas dropped after their early peak, Behavioral Health and
Neurology appointments represented 68% and 40% of visits in January 2021, respectively.
Consumer preferences forecast continued utilization of virtual environment.
– According to a January 2021 survey, 78% indicated a desire to continue virtual visits once the
crisis abates, while 93% said they were likely to continue video sessions moving forward with
existing providers.
– Vizient projects a continued rise in virtual sessions over the next decade, with levels matching or
exceeding peak pandemic levels.
Social determinants of health, including access to reliable internet, continues to
impact access to care.
– Increased access to broadband may increase availability/uptake of telehealth.
– Medicare patients were more likely than commercially insured or Medicaid to use phone visits for
their virtual visits.
– Medicaid patients had less virtual visits than commercially insured and Medicare patients.
Vizient Presentation │ April 20213

Virtual visit volumes were relatively low in the pre-pandemic years, but were on the rise
4
Source: CPSC (Q1 2017-Q4 2019)
24,405 25,492 28,36233,915
41,420 43,005 41,776
52,189
61,73168,518 68,582
76,338
Q1 Q2 Q3 Q4 Q1 Q2 Q3 Q4 Q1 Q2 Q3 Q4
2017 2018 2019
Virtual Visit Volumes by Quarter 2017-2019Based on 153,244 providers and more than 700M patient encounters
AAMC-Vizient Clinical Practice Solutions Center │April 2021

Beginning in March the share of virtual health visits to all visits rose, peaking in April 2020
AAMC-Vizient Clinical Practice Solutions Center │April 20215
0.3% 0.3%
14%
65%
49%
30%
25%22%
20% 19% 20%24% 22%
Jan Feb Mar Apr May Jun Jul Aug Sep Oct Nov Dec Jan
2020 2021
% of Ambulatory Virtual Visits by Month66.6 million visits - 96,500 providers - 18,000 locations
Includes all visits with Site of Service: Telehealth, Office, On Campus Outpatient Hospital and Off Campus Outpatient
Hospital. Standard visit codes (e.g. 99211-99215) are categorized as online visits if billed with telehealth service site
or modifier.

Without the shift to virtual care, more than 200,000 patient visits would not have taken place in April
6
Total ambulatory visits dropped 41% in April with virtual visits accounting
for 65% of the completed visits.
AAMC-Vizient Clinical Practice Solutions Center │April 2021
Includes all visits with Site of Service: Telehealth, Office, On Campus Outpatient Hospital and Off Campus Outpatient
Hospital. Standard visit codes (e.g., 99211-99215) are categorized as online visits if billed with telehealth service site
or modifier.
0
1,000,000
2,000,000
3,000,000
4,000,000
5,000,000
6,000,000
7,000,000
Jan Feb Mar Apr May Jun Jul Aug Sep Oct Nov Dec
2020 CPSC Member Monthly Visit Volumes66.6 million visits - 96,500 providers - 18,000 locations
In Person
Phone
Online

Behavioral Health virtual visits remained high across the year
AAMC-Vizient Clinical Practice Solutions Center │April 20217
Includes all visits with CMS Site of Service: Telehealth, Office, On Campus Outpatient Hospital and Off Campus
Outpatient Hospital.
Neurology also maintained high proportions of virtual visits throughout
the year.
65%71%
40% 41%
49%45%
40%
79% 79%83%
22% 24%
13%6%
15% 17%10%
17%
68%
40%
0%
20%
40%
60%
80%
100%
% of Ambulatory Visits Delivered VirtuallyTop 10 Specialties by Volume
26.9 million visits - 96,500 providers - 18,000 locations
20-Apr 20-Jul 20-Oct Jan-21

Observations on the Impact of Organization Size on Telehealth Utilization
8 Vizient Presentation │ April 2021

Larger organizations appeared to ramp virtual care up faster and sustained virtual services at a slightly higher level in 2020
Vizient Presentation │ April 20219
0%
10%
20%
30%
40%
50%
60%
70%
80%
Jan Feb Mar Apr May Jun Jul Aug Sep Oct Nov Dec
Percent of Ambulatory Visits Via Telehealth62.1 million visits - 96,500 providers - 18,000 locations
Small Organizations (<1,000 providers) Large Organizations (>1,000 providers)
Small organization cohort included 24 organizations and 17,500 providers. Large organization cohort included 39
organizations and 79,000 providers.
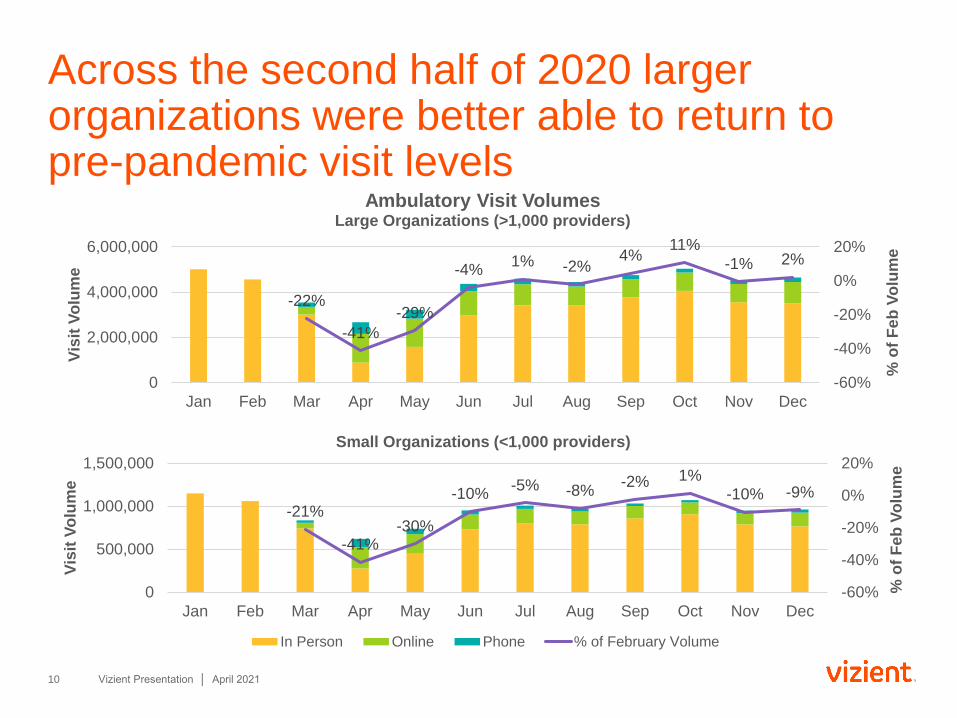
Across the second half of 2020 larger organizations were better able to return to pre-pandemic visit levels
Vizient Presentation │ April 202110
-22%
-41%
-29%
-4%1% -2%
4%11%
-1% 2%
-60%
-40%
-20%
0%
20%
0
2,000,000
4,000,000
6,000,000
Jan Feb Mar Apr May Jun Jul Aug Sep Oct Nov Dec
% o
f F
eb
Vo
lum
e
Vis
it V
olu
me
Ambulatory Visit Volumes Large Organizations (>1,000 providers)
-21%
-41%-30%
-10%-5% -8%
-2% 1%-10% -9%
-60%
-40%
-20%
0%
20%
0
500,000
1,000,000
1,500,000
Jan Feb Mar Apr May Jun Jul Aug Sep Oct Nov Dec
% o
f F
eb
Vo
lum
e
Vis
it V
olu
me
Small Organizations (<1,000 providers)
In Person Online Phone % of February Volume

Larger organizations consistently had a higher percentage of ambulatory encounters performed virtually
Vizient Presentation │ April 202111
Small Orgs (<1,000 providers) Large Orgs (> 1,000 providers)
% of Feb Volume % Telehealth % of Feb Volume % Telehealth
Feb 0% 0%
Mar -21% 11% -22% 15%
Apr -41% 56% -41% 67%
May -30% 38% -29% 51%
Jun -10% 23% -4% 32%
Jul -5% 21% 1% 26%
Aug -8% 19% -2% 23%
Sep -2% 17% 4% 21%
Oct 1% 15% 11% 20%
Nov -10% 17% -1% 21%
Dec -9% 20% 2% 24%
As COVID-19 cases rose at year’s end, the increased levels of virtual care helped larger
organizations maintain their levels of visits and serve more patients.

Consumer preference and projected shift to virtual care
12 Vizient Presentation │ April 2021
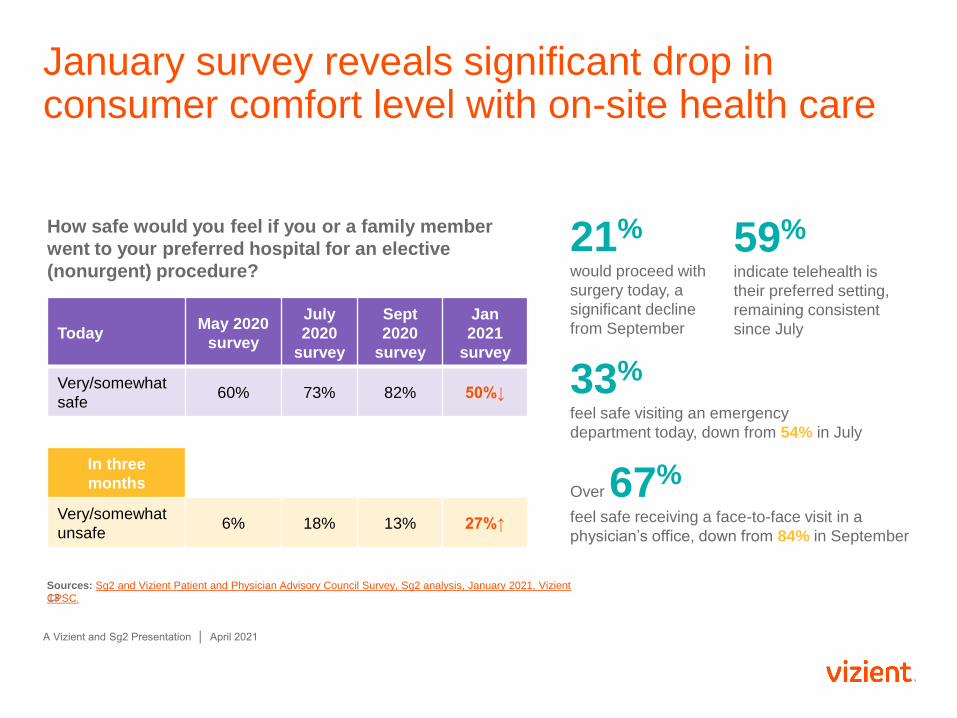
January survey reveals significant drop in consumer comfort level with on-site health care
21%
would proceed with
surgery today, a
significant decline
from September
59%
indicate telehealth is
their preferred setting,
remaining consistent
since July
33%
feel safe visiting an emergency
department today, down from 54% in July
Over 67%
feel safe receiving a face-to-face visit in a
physician’s office, down from 84% in September
A Vizient and Sg2 Presentation │ April 2021
13
TodayMay 2020
survey
July
2020
survey
Sept
2020
survey
Jan
2021
survey
Very/somewhat
safe60% 73% 82% 50%↓
In three
months
Very/somewhat
unsafe6% 18% 13% 27%↑
How safe would you feel if you or a family member
went to your preferred hospital for an elective
(nonurgent) procedure?
Sources: Sg2 and Vizient Patient and Physician Advisory Council Survey, Sg2 analysis, January 2021, Vizient
CPSC.
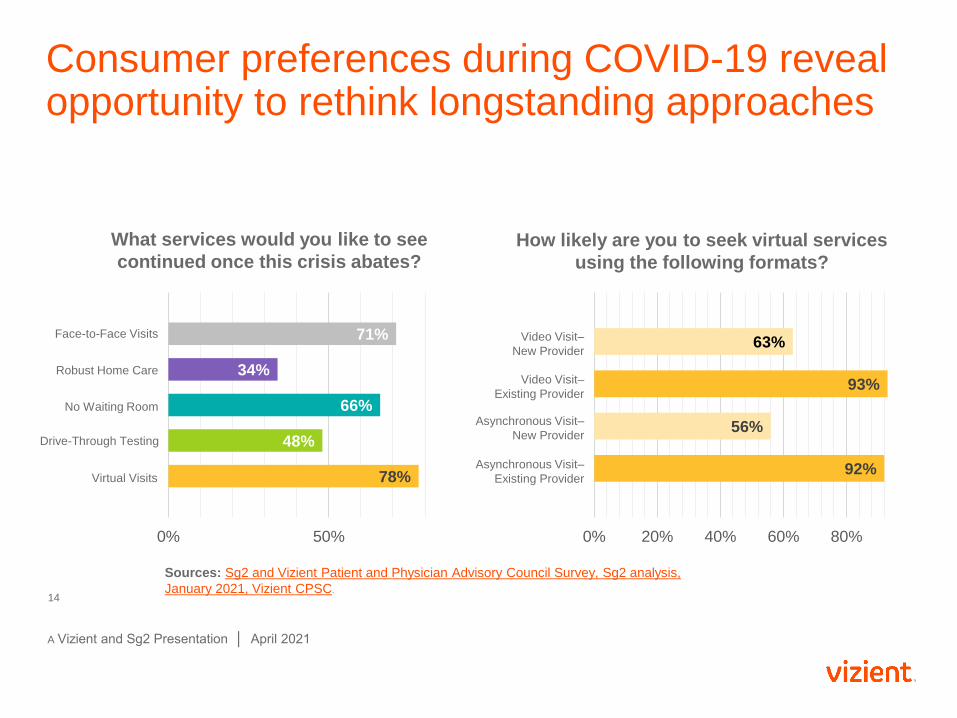
Consumer preferences during COVID-19 reveal opportunity to rethink longstanding approaches
14
What services would you like to see
continued once this crisis abates?
78%
48%
66%
34%
71%
0% 50%
Virtual Visits
Drive-Through Testing
No Waiting Room
Robust Home Care
Face-to-Face Visits
How likely are you to seek virtual services
using the following formats?
92%
56%
93%
63%
0% 20% 40% 60% 80%
Asynchronous Visit–
Existing Provider
Asynchronous Visit–
New Provider
Video Visit–
Existing Provider
Video Visit–
New Provider
Sources: Sg2 and Vizient Patient and Physician Advisory Council Survey, Sg2 analysis,
January 2021, Vizient CPSC.
A Vizient and Sg2 Presentation │ April 2021

Cardiovascular
Women’s Health
0%
5%
10%
15%
20%
25%
30%
35%
40%
45%
50%
55%
2019 2024 2029
Shift to Virtual Is Variable Across Service Line Groups
Source: Sg2 Analysis, 2021.
Virtual Visit Shift by Service Line Group
US Market, 2019–2029
1-Year 10-Year
Behavioral Health
Neurosciences
Medicine
Surgery
Cancer
Orthopedics
Spine
2020 CPSC Data

Observations on Telehealth for Primary Care, Behavioral Health and Neurology
16 Vizient Presentation │ April 2021

Primary Care Observations
• In-person ambulatory visits dropped 79% from February to April 2020.
• Of the visits that still occurred in April 2020, 65% were virtual. By January
2021, this was down to 22%.
• In this same time period, general exams by primary care providers dropped
86%. By July, these visits had nearly returned to pre-pandemic levels.
General exam visits were almost entirely in-person, just 4% virtual by the
fall.
• Primary care visits for patients with diagnoses of “Exposure to
communicable diseases,” which includes COVID-19, started rising in April
and remained high through the summer, with a second spike starting in
October as COVID cases surged.
• Primary care visits for hypertension and Type 2 Diabetes, chronic
conditions requiring sustained care, remained relatively high, with just 35%
and 42% drops from February to April.
Vizient Presentation │ April 202117

In April 2020, primary care provider visits for communicable disease exposure (which included COVID-19) began to rise and remained high through the end of 2020
Vizient Presentation │ April 202118
Includes visits with primary care providers and CMS Site of Service: Telehealth, Office, On Campus Outpatient
Hospital and Off Campus Outpatient Hospital.
0
20,000
40,000
60,000
80,000
100,000
Jan Feb Mar Apr May Jun Jul Aug Sep Oct Nov Dec
2020 Primary Care Provider VisitsSuspected exposure to communicable diseases
15.7 million visits - 12,000 primary care providers - 3,100 locations
In Person
Online
Phone

Behavioral Health Observations
• While overall ambulatory visits fell 41% from February to April, Behavioral
Health specialties (Psychiatry, Psychology and Social Work) fell by just
13% due to a rapid shift to virtual health.
• In April, 80% of Behavioral Health visits happened virtually, and remained
high at 69% in December.
• Visits for conditions pertaining to stress, depression and anxiety rose
across the year until peaking in October.
Vizient Presentation │ April 202119

Without the shift to virtual visits, 165,000 behavioral health encounters may have been lost in April 2020
20
Includes visits with behavioral health providers, including psychologists, psychiatrists and social workers and CMS
Site of Service: Telehealth, Office, On Campus Outpatient Hospital and Off Campus Outpatient Hospital.
AAMC-Vizient Clinical Practice Solutions Center │April 2021
0
50,000
100,000
150,000
200,000
250,000
300,000
Jan Feb Mar Apr May Jun Jul Aug Sep Oct Nov Dec
2020 Behavioral Health VisitsAll Diagnoses
2.8 million visits - 4,000 providers - 1,500 locations
In Person Online Phone
Neurology Observations
• Neurology specialty total patient activity dropped 29% in April from
February but had returned to normal levels by the fall of 2020.
• In April 2020, 84% of Neurology visits were virtual and were still at 41%
virtual by December.
• The largest drop in activity was seen for general complaints of cognitive
function and awareness while chronic conditions such as migraine,
epilepsy, Parkinson’s and MS held fairly steady but with a significant shift
to virtual delivery.
• Care for Epilepsy, MS and Migraines saw a 13% drop in activity in April
2020, but with 89% of visits virtual. Parkinson’s disease saw a slightly
higher drop in all activity (24%) with 88% occurring virtual.
• Neurology chronic care was still 40% virtual by the fall of 2020.
Vizient Presentation │ April 202121

Neurology visits for non-chronic care saw a large drop in volume in April 2020
Vizient Presentation │ April 202122
Neurology visits for ‘other symptoms involving cognitive functions and
awareness’ includes patients seeking evaluation and treatment for non-
disease specific, or currently undiagnosed neurological concerns.
Includes visits with neurology providers and CMS Site of Service: Telehealth, Office, On Campus Outpatient Hospital
and Off Campus Outpatient Hospital.
0
5,000
10,000
15,000
Jan Feb Mar Apr May Jun Jul Aug Sep Oct Nov Dec
Neurology VisitsOther symptoms involving cognitive functions and awareness
2 million visits - 2,900 providers - 1,000 locations
Phone
Online
In Person

Observations on Demographics for Telehealth Users
23 Vizient Presentation │ April 2021

Older patients have the highest volume of total visits but lower rates of telehealth than other adults by December 2020
AAMC-Vizient Clinical Practice Solutions Center │April 202124
Includes all visits with CMS Site of Service: Telehealth, Office, On Campus Outpatient Hospital and Off Campus
Outpatient Hospital.
55%
18%20%
65%
28% 29%
67%
24% 25%
67%
20% 21%
63%
20% 21%
0
200,000
400,000
600,000
800,000
1,000,000
1,200,000
1,400,000
1,600,000
1,800,000
Apr-20 Aug-20 Dec-20 Apr-20 Aug-20 Dec-20 Apr-20 Aug-20 Dec-20 Apr-20 Aug-20 Dec-20 Apr-20 Aug-20 Dec-20
0 - 20 21 - 40 41 - 60 61 - 80 81+
Ambulatory Volume by Patient Age RangeApril, August and December 2020
14.1 million visits – 96,500 providers – 18,000 locationsIn Person Telehealth

All ages saw fewer phone visits as a percentage of overall telehealth in Dec as acceptance and availability shifted
AAMC-Vizient Clinical Practice Solutions Center │April 202125
17%
17%
24%41%
55%0
200,000
400,000
600,000
800,000
0 - 20 21 - 40 41 - 60 61 - 80 81+
Telehealth Delivery By Patient Age3.4 million visits – 96,500 providers – 18,000 locations Online Phone
6%
8% 14% 29%
44%0
200,000
400,000
600,000
800,000
0 - 20 21 - 40 41 - 60 61 - 80 81+
April
2020
Decem
ber
2020
Includes all visits with CMS Site of Service: Telehealth, Office, On Campus Outpatient Hospital and Off Campus
Outpatient Hospital.

Medicaid patients had less virtual visits than commercial and Medicare patients
Vizient Presentation │ April 202126
Includes all visits with CMS Site of Service: Telehealth, Office, On Campus Outpatient Hospital and Off Campus
Outpatient Hospital.
69%
56%68%
55%
25%
19%
22%
25%
27%
21%
23%
24%
0
500,000
1,000,000
1,500,000
2,000,000
2,500,000
3,000,000
Co
mm
erc
ial
Me
dic
aid
Me
dic
are
Self
Pa
y
Co
mm
erc
ial
Me
dic
aid
Me
dic
are
Self
Pa
y
Co
mm
erc
ial
Me
dic
aid
Me
dic
are
Self
Pa
y
Apr-20 Aug-20 Dec-20
Ambulatory Visits by Payer Type19.9 million visits - 96,500 providers - 18,000 locations
In Person

Medicare patients were more likely than Commercial or Medicaid to use phone visits for their virtual visits
Vizient Presentation │ April 202127
Includes all visits with CMS Site of Service: Telehealth, Office, On Campus Outpatient Hospital and Off Campus
Outpatient Hospital.
17%
19%
47%
35%
10%
14%
35%
25%
9%
12%
34%
19%0
200,000
400,000
600,000
800,000
1,000,000
1,200,000
Co
mm
erc
ial
Me
dic
aid
Me
dic
are
Self
Pa
y
Co
mm
erc
ial
Me
dic
aid
Me
dic
are
Self
Pa
y
Co
mm
erc
ial
Me
dic
aid
Me
dic
are
Self
Pa
y
Apr-20 Aug-20 Dec-20
Virtual Visit Delivery By Payer4.7 million visits - 96,500 providers - 18,000 locations Online Phone

Methodology – Data Identification
Unless noted otherwise, the data reported in this presentation was
derived from the Clinical Practice Solutions Center (CPSC) developed by
the Association of American Medical Colleges (AAMC) and Vizient.
Based on clinician professional fee billing data, these views represent
activity captured from 96,500 physicians in 18,000 locations.
For this reporting:
• Visits include any billed patient evaluation and management visit
CPT® code eligible for telehealth via CMS or commercial carriers.
• Ambulatory includes CPT Codes billed at one of the following CMS
Sites of Service: Telehealth, Office, On Campus Outpatient Hospital or
Off Campus Outpatient Hospital. All other sites of service, including
inpatient and emergency room, were excluded from the evaluation.
28
CPT® is a registered trademark of the American Medical Association
AAMC-Vizient Clinical Practice Solutions Center │April 2021

Methodology - Telehealth Visit Identification
For this evaluation, telehealth includes any synchronous care, i.e. live, real-time
settings where the patient interacts with a provider via phone or video.
• Phone visits include a provider using audio only real-time communication.
These are identified using specific CPT codes (98966-98968, G0406-G0408,
G0459, G2012, 99441-99443 and G0071). CMS also approved additional
codes for audio-only service but did not provide coding to distinguish between
audio only or online visits, so will be included in online visits below.
• Online visits include a provider using an interactive audio and video
telecommunications system that permits real-time communication. These
visits are flagged as telehealth using the telehealth CMS place of service,
specific telehealth modifiers and/or CPT codes designated for online visits.
AAMC-Vizient Clinical Practice Solutions Center │April 202129

This information is proprietary and highly confidential. Any unauthorized dissemination,
distribution or copying is strictly prohibited. Any violation of this prohibition may be subject
to penalties and recourse under the law. Copyright 2020 Vizient, Inc. All rights reserved.
Copyright 2021 Vizient, Inc. All rights reserved