effects of small-gap timber harvests on songbird community
TRANSCRIPT

The University of MaineDigitalCommons@UMaine
Electronic Theses and Dissertations Fogler Library
5-2003
Effects of Small-gap Timber Harvests on SongbirdCommunity Composition and Site-fidelityMitschka John Hartley
Follow this and additional works at: http://digitalcommons.library.umaine.edu/etd
Part of the Forest Biology Commons, Forest Management Commons, and the Poultry or AvianScience Commons
This Open-Access Dissertation is brought to you for free and open access by DigitalCommons@UMaine. It has been accepted for inclusion inElectronic Theses and Dissertations by an authorized administrator of DigitalCommons@UMaine.
Recommended CitationHartley, Mitschka John, "Effects of Small-gap Timber Harvests on Songbird Community Composition and Site-fidelity" (2003).Electronic Theses and Dissertations. 644.http://digitalcommons.library.umaine.edu/etd/644
EFFECTS OF SMALL-GAP TIMBER HARVESTS ON SONGBIRD
COMMUNITY COMPOSITION AND SITE-FIDELITY
BY
Mitschka John Hartley
B.S. Cornell University, 1992
M.S. Louisiana State University, 1994
A THESIS
Submitted in Partial Fulfillment of the
Requirements for the Degree of
Doctor of Philosophy
(in Wildlife Ecology)
The Graduate School
The University of Maine
May, 2003
Advisory Committee:
Malcolm L. Hunter, Professor of Wildlife Ecology & Libra Professor of Conservation
Biology, Advisor
Raymond O'Connor, Professor of Wildlife Ecology
William Glanz, Associate Professor of Zoology
Alan White, Professor of Forest Ecology & Silviculture
William Halteman, Associate Professor of Mathematics

O 2003 Mitschka John Hartley All Rights Reserved

EFFECTS OF SMALL-GAP TIMBER HARVESTS ON SONGBIRD
COMMUNITY COMPOSITION AND SITE-FIDELITY
By Mitschka John Hartley
Thesis Advisor: Dr. Malcolm L. Hunter, Jr.
An Abstract of the Thesis Presented in Partial Fulfillment of the Requirements for the
Degree of Doctor of Philosophy (in Wildlife Ecology)
May, 2003
I investigated effects of small-gap timber harvests on bird communities at nine
sites (10 ha each) within the Penobscot Experimental Forest (PEF), grouped into three
replicated "blocks" (three sites each). Blocks were randomly treated with three
treatments: 10% harvest, 20% harvest, and no harvest (i.e., control). I examined how
treatments affected breeding songbird abundance, richness, and site-fidelity over four
consecutive summers, including 1-3 years before and after each site was harvested.
Ability to detect treatment effects was limited by the small number of replicates, but
power analyses indicated that given the experimental design and observed variability,
there was a high (>go%) probability to detect 20-30% differences in overall abundance
among treatment groups. There was no evidence that treatments caused changes of this
magnitude, or affected densities of individual species, avian richness, or which species
were most abundant before versus after treatment. Annual variations in densities were
much stronger than differences between treatment groups.

Of 96 male Hermit Thrushes and 74 male Ovenbirds captured within sites, an
average of 62% and 28% of respective males were recaptured annually. Of these, 90% of
male Hermit Thrushes and 94% of male Ovenbirds were recaptured on the same site in
successive years, regardless of the site's treatment status. However, there was a
significantly higher tendency for Hermit Thrush to disperse to new sites if they were
previously captured on treated versus control sites.
In Chapter 3 I argue that annual fluctuations in bird densities may be driven
largely by predator (i.e., red squirrel, Tamiasciurus hudsonicus) population dynamics.
Previous research has shown that avian nest-predation by red squirrels strongly affects
local breeding productivity of birds, and that red squirrel populations are regionally
synchronous. I examined four lines of evidence that are consistent with the premise that
squirrel population fluctuations can affect bird populations over large areas. Squirrel
populations in the PEF peaked in 1995 and crashed in 1996, while bird densities
decreased from 1995 to 1996, then increased sharply from 1996 to 1997. Breeding Bird
Survey data showed a similar pattern of avian population change (especially for
coniferous-forest birds) from 1995- 1997 at much larger scales.

DEDICATION
This dissertation is dedicated to my Mother, Rosita Ella Hiscock Hartley, and my
Grandmother, Gladys Inza Quimby Hiscock. More than anyone else in my life, these two
women taught me to believe in myself and to pursue my dreams. Most importantly, they
taught by example that effort is the currency of achievement, that hard work should be
done without expectation of praise, and that difficulties must be endured with patience
and without excessive complaint. I strive daily to keep these lessons in mind. Their
contributions to my character and philosophy are beyond enumeration, as are my feelings
of gratitude for their generosity, support, and love.

ACKNOWLEDGMENTS
My foremost thanks go to my advisor, Mac Hunter, for all of his patient support,
encouragement, ideas, and help. His edits were always more rapid than I could have
hoped for and his attention to detail and writing style were much appreciated. Perhaps
most significantly I thank Mac for his friendship and for the many ways he has served as
a role model in aspects both professional and personal. As much as I had enjoyed Maine
before meeting Mac, he and his wife Aram showed me some of its most special places.
I am deeply grateful for the insights of all of my committee members. I learned a
great deal from each of them, admired their abilities, and appreciated their friendship and
good-natured interactions. I have especially fond memories of bird hunting, and hiking
in Central America with Bill Glanz. I am indebted to my friends and fellow grad students
who proofread my very worst writing before it went to anyone else. I especially thank
Steve Campbell; he was as tireless with editorial assistance as with his companionship.
Bird and squirrel data in Chapter 3 were provided by ~atuxent Wildlife Research
Center (BBS trend data), R. Holmes (Dartmouth College), D. Harrison (University of
Maine), A. Jobes (Trent University), Canada Agriculture (Fredericton, New Brunswick),
C. Demers (SUNY-ESF, Huntington Forest) and R. Brooks (University of Guelph).
This research would not have been possible without the help of faculty and
graduate students involved with the Forest Ecosystem Research Program (FERP) at the
University of Maine. Bob Seymour especially was instrumental in shaping the FERP
research and teaching me most of what I know about silviculture. My research was
largely funded by the Maine Agriculture & Forest Experiment Station, through the FERP.
The Maine Department of Inland Fisheries & Wildlife provided a vehicle for all four

summers of my field work. The USDA Forest Service Northeast Experiment Station,
graciously provided my crew and I housing and other facilities in the Penobscot
Experimental Forest for four summers. This work was also funded in part by grants from
the Cooper Ornithological Society (through a Mewaldt-King Award), the American
Wildlife Research Foundation, and the Association of Graduate Students at the
University of Maine. During my graduate studies at UM I received funds for academic
travel from the Swedish Information Service (through a Bicentennial Exchange Grant)
and the American Bryological and Lichenological Society. I also received scholarship
support from the New England Outdoor Writers' Association (through a Scholarship and
an Arthur Sullivan Award), and the UM Department of Wildlife Ecology (through a
Howard L. Mendall Memorial Scholarship and an Outstanding Wildlife Graduate Student
Award). I was also supported by Audubon New York, a state office for the National
Audubon Society, during part of my thesis writing.
Finally, this project was largely carried upon the pale, bug-bitten backs of a large
and dedicated group of field assistants, to whom I owe a very large debt of gratitude.
They endured difficult conditions for very low pay; with few exceptions they were a
diligent and skilled bunch, dedicated not just to this research effort but to natural
resources in general. My heartfelt thanks therefore go to Rhonda Weunsch, Ann Savage,
Jen Norris, Boris, Brian Aust, Liz Burroughs, Chris Jacques, Chris Stauffer, Michelle
Soenksen, Harry Kahler, Dan Schieman, Karen Tremper, Denise Moore, Jason Hummel,
Megan Hughes, Mike Thibodeau, Kyle Apigian, Paul Miller, Erica Chipman, and Doug
Smart.

TABLE OF CONTENTS
... DEDICATION ......................................................................................................... 111
................................................................................................ ACKNOWLEDGMENTS iv
............................................................................................................ LIST OF TABLES x
. . ......................................................................................................... LIST OF FIGURES xi1
Chapter
1 . EFFECTS OF 10% AND 20% TIMBER REMOVALS ON BIRD
COMMUNITY COMPOSTION ............................................................................ 1
................................................................................................. INTRODUCTION 1
........................................................................................................ Objectives 4
.......................................................................................... Hypotheses Tested -4
............................................................................................................ METHODS 4
...................................................................................... Experimental Design -4
....................................................................................................... Treatments 6
....................................................................................................... Study Area 7
............................................................................................... Avian Censuses 9
Analyses ..................................................................................................... 10
Treatment Groups: Classic ANOVA Approach ..................................... 11
Treatment Groups: Controlled Comparisons ......................................... 13
Bird Community Ordination .............................................................. 14
Qualitative Assessments of Avifaunal Change ....................................... 16
...................................................................................... Power Analyses 1 6

RESULTS ....................................................................................................... 17
Avian Richness and Abundance Among Years ............................................ 17
Avian Richness and Abundance Within Years ............................................. 19
.................................................................... Individual Species Abundances 21
Bird Community Ordination ......................................................................... 24
Qualitative Changes in Avifauna .................................................................. 27
..................................................................................................... DISCUSSION 28
CONCLUSIONS ................................................................................................ -33
LITERATURE CITED ...................................................................................... -35
2 . EFFECTS OF EXPERIMENTAL HABITAT DISTURBANCES ON
BREEDING SITE-FIDELITY OF ADULT HERMIT THRUSHES
......................... (Catharus guttatus) AND OVENBIRDS (Seiurus aurocapillus) 38
............................................................................................... INTRODUCTION 38
...................................................................................................... Objectives 40
......................................................................................... Hypotheses Tested 40
.......................................................................................................... METHODS 41
Avian Sampling ............................................................................................. 41
........................................................................................................ Analyses 44
............................................................................................ Return Rates 45
........................................................................................ Site-attachment 46
................................................................. Survival and Recapture Rates 48
vii

RESULTS ............................................................................................................ 49
.................................................................................................. Return Rates 49
.............................................................................................. Site-attachment 55
Survival and Recapture Rates ....................................................................... 59
.................................................................................................... DISCUSSION -59
Treatment Effects on Site-Fidelity ............................................................... -59
Survival and Recapture Rates ....................................................................... 61
Undetected Emigrants ............................................................................. 61
CJS and Short-Duration Studies .............................................................. 63
CONCLUSIONS ................................................................................................. 65
LITERATURE CITED ....................................................................................... 67
EFFECTS OF RED SQUIRREL (Tamiusciurus hudsonicus)
POPULATION FLUCTUATIONS ON BIRD POPULATIONS ...................... 70
INTRODUCTION .............................................................................................. -70
METHODS .......................................................................................................... 72
Local Analysis for Maine. 1995- 1997 ........................................................... 72
...................................................................... Regional Analysis. 1995- 1997 73
Local Analysis for Ontario. 1998-2000 ......................................................... 79
Local Analysis for New Brunswick. 1950- 1959 ........................................... 82
RESULTS ............................................................................................................ 85
........................................................... Local Analysis for Maine. 1995-1997 85
Regional Analysis. 1995- 1997 ...................................................................... 86
Red Squirrels ........................................................................................... 86
Birds ........................................................................................................ 87
viii

Local Analysis for Ontario. 1998-2000 ......................................................... 89
Local Analysis for New Brunswick. 1949- 1959 ........................................... 91
DISCUSSION ..................................................................................................... 91
....................................................................................... LITERATURE CITED 99
BIBLIOGRAPHY ...................................................................................................... 103
APPENDICES ............................................................................................................... Ill
APPENDIX A . Data and Analyses Related to Chapter 1 ................................ 112
APPENDIX B . Power Analyses Related to Chapter 1 .................................... 123
APPENDIX C . Data and Analyses Related to Chapter 2 ................................ 129
APPENDIX D . Data and Analyses Related to Chapter 3 ................................ 136
APPENDIX E . Scientific Names of Birds ...................................................... 139
BIOGRAPHY OF THE AUTHOR ............................................................................... 141

Table 1.1.
Table 1.2.
Table 1.3.
Table 2.1.
Table 2.2.
Table 2.3.
Table 2.4.
Table 2.5.
Table 2.6.
Table 2.7.
Table 2.8.
Table 3.1.
Table 3.2.
Table 3.3.
Table A . 1 .
Table A.2.
Table A.3.
LIST OF TABLES
Treatment schedule for nine research areas (RA) at the Penobscot
......................................................................... Experimental Forest (PEF) 6
Number and size of harvest gaps ................................................................ 8
............. Mean avian species richness for nine research areas in the PEF 23
Mistnet effort and number of captures per year ....................................... 43
........................................................... Recapture rate. by species and sex 51
Recapture rate by species. age. and sex ................................................... 52
Contingency tables of recaptures by treatment for Hermit
Thrush and Ovenbird ................................................................................ 53
Numbers of recaptured male birds remaining on a site versus
dispersing to a new site ............................................................................ 54
Distances between capture locations of successive years ........................ 57
Summary of statistical test results for differences in site-
attachment distances ................................................................................. 58
Estimated survival (4) and recapture (p) rates ......................................... 60
Population trends for birds in northern New England .............................. 80
Regional comparison of number of bird species fitting
hypothesized patterns of population change ............................................ 81
............. Bird species fitting hypothesized pattern of population changes 90
Abundance of bird territories in 1995 .................................................. 1 13
Abundance of bird territories in 1996 .................................................... 1 14
Abundance of bird territories in 1997 .................................................... 1 15

Table' A.4.
Table AS .
Table A.6.
Table A.7.
Table A.8.
Table C . 1 .
Table C.2.
Table C.3.
Table C.4.
Table C.5.
Table C.6.
Table D . 1 .
Table E . 1 .
Abundance of bird territories in 1998 .................................................... 1 16
Mean abundance of bird territories over all years ( 1995- 1998) ............. 117
................ Kruskal-Wallis tests of differences among treatment groups 118
................ Analysis of variance (ANOVA) for richness and abundance 121
...................... Results of iterative analysis-of-variance (ANOVA) tests 122
................................... Differences in site-attachment distances by year 130
........................... Differences in site-attachment distances by treatment 131
.................. Differences in site-attachment distances by dispersal status 132
................. Differences in site-attachment distances by treatment status 133
Differences in site-attachment distances by treatment status
(year "t+ 1") .......................................................................................... 134
Results of competing Cormack-Jolly Seber models for
............................. mark-recapture data analyzed with Program MARK 135
.......................................... Bird population trends for combined region 137
Scientific names of birds .................................................................... 1 4 0

Figure 1.1.
Figure 1.2.
Figure 1.3.
Figure 1.4.
Figure 1.5.
Figure 3.1.
Figure 3.2.
Figure 3.3.
Figure 3.4.
Figure B.1.
Figure B.2.
Figure B.3.
Figure B.4.
Figure B.5.
LIST OF FIGURES
Location of research areas in the Penobscot Experimental
.............................................................................................. Forest (PEF) -8
Mean avian abundance (per 10 ha) for nine research areas in
.................................................................................................... the PEF 1 8
Difference in abundance between two control sites and six treated
............................................................................................ research sites 20
........................... Mean avian abundance (per 10 ha) by treatment group 22
.................. Mean density of species with apparent treatment preference 25
Abundance of birds and red squirrels in the PEF ..................................... 76
Red squirrel abundance at five locations in northeastern
......................................................................................... North America -77
Abundance of birds and red squirrels at Algonquin Provincial
......................................................................... Park. Ontario. 1998-2O00 83
Spruce budworm (A). bird (B). and red squirrel (C) population
..................... changes from 1949-1959 in Green River. New Brunswick 84
............................................................................ Scenario 1. 1998 Data 125
........................................................................... Scenario 2. 1998 Data 1 2 6
............................................................................ Scenario 3. 1998 Data 126
............................................................................ Scenario 1. 1997 Data 127
............................................................................ Scenario 2. 1997 Data 128
............................................................................ Figure B.6. Scenario 3. 1997 Data 128
xii

Chapter 1
EFFECTS OF 10% AND 20% TIMBER REMOVALS ON BIRD COMMUNITY
COMPOSTION: AN EXPERIMENTAL APPROACH
INTRODUCTION
In recent decades there has been considerable research into the effects of forest
management on bird populations (Sallabanks and Marzluff 2000). However, the even-
aged practice of clearcutting has been the focus of most of this research (Sallabanks et al.
2000), whereas other methods (e.g., partial cutting) have received much less attention
(Thompson et al. 2000). Consequently, for most forest types and avian species we have a
poor understanding of the level of timber removal that triggers abandonment or invasion
of a forest patch, or density changes that can be considered a response to habitat
alteration. To understand how timber harvest intensity affects bird communities within a
relatively homogenous forest area (or "stand") it is necessary to either: a) examine bird
composition across many different stand replicates treated with a variety of harvest
intensities or b) compare pre- and post-harvest bird communities on stands treated with
specific levels of timber harvesting, and on unharvested controls. However, few studies
have measured bird densities across a range of harvest intensities, and even fewer have
examined pre- and post-harvest data from stands with randomly applied harvest
treatments and a rigorous experimental design (Sallabanks et al. 2000).
Most of these studies have focused on partial harvests (e.g, Annand and
Thompson 1997) that removed a large proportion (e.g., 40-60%) of mature timber rather
uniformly throughout a stand (e.g., shelterwood cuts), or on stands that are mostly mature

and intact but contain one or more small-scale (e.g., 1 ha) clearcuts, often called patch
cuts (Derleth et al. 1989, Lent and Capen 1995). These types of harvest are of lower
intensity than is clearcutting because some mature trees are left unharvested in stands.
Previous studies examining patch cuts defined the treatments as small-scale disturbances
(Derleth et al. 1989, Lent and Capen 1995), but patch cuts really are high-intensity
removals done on a scale (e.g., 0.5-2 ha) that is smaller than traditional, commercial
clearcuts (e.g., 10-50 ha). Patch cuts examined in earlier studies were large enough to
result in new patches of young forest that were invaded and occupied by a suite of
pioneer species adapted to that habitat (Lent and Capen 1995, Buford and Capen 1999).
Annand and Thompson (1 997) measured avian abundance in mature oak-pine
stands and those harvested by clearcut, shelterwood, group selection, and individual-tree
selection, and is one of the very few works that can help identify cutting levels that affect
bird communities. However, it is unclear whether results from a study in Missouri oak-
pine forests can be generalized to other forest types and regions such as my study area in
Maine, though the bird community described by Annand and Thompson (1997) is
generally similar to bird communities in Maine (Hagan et al. 1997).
Few studies have focused on how bird communities are affected by removing a
relatively small proportion (e.g., 10-20%) of mature trees, especially when the size of cut
patches is very small (e.g., 0.1 ha). Removing a few individual trees from a forest stand
will probably not affect the breeding bird community in a stand, unless the trees provide a
critical resource that is otherwise lacking in the forest. However, at some level, removal
of mature trees will change the vertical andlor horizontal structure of a stand to a point at

which some species will find it unsuitable or less suitable habitat while others may invade
or increase in density (Annand and Thompson 1997).
In a recent review of nearly 100 papers published over the last 25 years,
Sallabanks et al. (2000) criticized the scientific rigor of research on forestry and birds.
Studies with only one replicate per treatment were most common in the literature (27%),
and only 27% of studies exceeded four replicates per treatment. Most studies (68%) were
only 1-2 years in duration, with only seven of 95 studies lasting longer than four years
(Sallabanks et al. 2000). Though most studies measured relationships between timber
harvest and relative avian abundance, only 32% measured bird densities. Especially
lacking have been studies using experimental manipulations that allow for direct
comparisons of pre- and post-treatment data (Sallabanks et al. 2000). Only 16% of all
studies collected data before and after timber harvests. Most significantly, not one paper
published between 1972 and 1997 incorporated a manipulative experimental design in
which treatments were assigned randomly to experimental units (Sallabanks et al. 2000).
The Forest Ecosystem Research Program (FERP) at the University of Maine
started in 1993, to address the need for a rigorous approach to research on the effects of
timber harvests on forest ecosystems. FERP researchers designed an experiment to
examine how forest structure and function are affected by timber harvests that were
explicitly designed to mimic natural disturbance patterns. Using the research areas and
experimental design established by the FERP, my research examines whether low-
intensity, small-scale timber harvests cause changes in the breeding bird community.

Objectives
The objective of my research was to determine whether FEW harvest treatments
caused changes in the avifauna on 10 ha research areas (hereafter sites). This objective
was subdivided into examination of effects on the entire bird community (all species
considered simultaneously) and effects on individual species.
Hypotheses Tested
Using avian territory census data from nine sites during 1995-1998, I tested the
following research hypotheses:
Null hypothesis 1 : there is no difference in the abundance or richness of birds on
control sites and sites treated with 10% or 20% harvests.
Null hypothesis 2: after 10% or 20% harvest treatments are implemented, no species
becomes more or less abundant on treated versus control sites.
Null hypothesis 3: bird community composition, measured by dissimilarity matrices, is
not different for treated versus control sites before or after harvest.
METHODS
Experimental Design
In 1994 the Forest Ecosystem Research Program (FEW) at the University of
Maine began to evaluate effects of low-intensity timber harvests on forest ecosystem
structure and function. The FERP designed silvicultural treatments that were meant to
somewhat mimic the temporal and spatial pattern of natural disturbances in the
northeastern United States. Natural disturbance frequencies range from 0.5-2% per year
in temperate forests across North America (Runkle 1985), so the FEW chose two levels
of harvest intensity to examine: 1% and 2% annual mortality of canopy trees. To

achieve these disturbance levels with a practical silvicultural system, the FERP planned
for harvests every ten years that removed approximately 10% and 20% of canopy trees.
To evaluate the effects of these two harvest treatments on forest ecosystems, the
FERP established a randomized complete block design (Sokal and Rohlf 2000) with
replication of treatments in space and time. The FERP design included comparison of
treated and untreated (i.e., control) sites, and pre- and post-treatment data collection. The
FERP experiment was carried out on nine mature mixed conifer-deciduous forest sites
that were 10 ha in size, and were similar in terms of soils, tree species composition,
stocking, and time since harvest (>50 years). These nine sites were grouped in three
blocks of three sites each. Sites within a block generally were in the same geographic
area, and were thought to be most similar. These blocks thus represent three replicates,
with the three treatments (i.e., two harvest levels and a control) randomly applied to one
site in each block. For replication over time, treatments were imposed over three
consecutive years (Table 1. I). The staggered-entry design for FERP treatments was due
to constraints in funding, which allowed for pre-harvest baseline vegetation data
collection on only one block of three sites each summer.
In 1995 pre-treatment bird data were collected on all sites, except one control
(Research Area 8) that was not established until 1996. The following winter (i.e.,
February 1996) the first three research areas (#I-3) were randomly chosen to receive the
20% harvest, 10% harvest, or be an untreated control. During the next two successive
winters, the second and third block of sites were randomly assigned treatments and
harvested (except for controls). Thus, by the summer of 1998 all sites had been treated
(Table 1.1).

Table 1.1. Treatment schedule for nine research areas (RA) at the Penobscot Experimental Forest (PEF). Treatments are labeled " 10-30" and "20- 10" respectively, as approximately 10% and 20% of timber is harvested every 10 years, and 30% and 10% of live trees are marked for permanent retention through a 100 year rotation. Treatments are listed in bold type for the first year treated, and their label remains unchanged for all years after treatment. Untreated stands are considered as a control until treated.
Triplet 1 1
2 3
1995 control control control
control control control
control control control
1996 20-10 10-30 control
control control control
control control control
1997 20- 10 10-30 control
control 10-30 20-10
control control control
1998 20- 10 10-30 control
control 10-30 20-10
10-30 control 20-10
Treatments
The spatial pattern of natural disturbances that predominate in eastern forests are
on the scale of one or a few trees falling (Lorimer 1977), so FERP treatments were
designed as a series of small (0.10-0.20 ha) harvest gaps distributed across each 10 ha
site. The size and number of gaps varies slightly among sites within each treatment
group (Table 1.2). After natural disturbances some mature trees often survive within a
disturbed area (Lorimer 1977), which typically results in greater structural diversity than
is found in many patch cuts after harvest (Hunter 1990). Therefore, FERP harvest gaps
were marked before treatment so that some mature trees would be permanently retained
throughout all harvest entries. Criteria for reserve-tree selection included one or more of
the following: large-diameter trees, trees with existing cavities, representative species
composition, andlor preservation of uncommon native species. The targeted level of
retention was 10% of mature trees for the 20%-harvest treatment, and 30% of mature

trees for the 10% harvest treatment. Therefore, FEW treatments are labeled as "20-10
and "10-30," to signify their level of harvest (every ten years) and retention, respectively
(Fig. 1.1, Table 1.1).
Study Area
All FERP research areas (Fig. 1.1) are within the Penobscot Experimental Forest
(PEF) located in the towns of Bradley and Eddington, Penobscot County, Maine
(approximately 44O52.7' North, 68O39.2' West). This 1540 ha (3,800 acre) property has
been managed by the USDA Forest Service from 1950-1 994, and jointly by the Forest
Service and the University of Maine from 1994 to the present. Approximately 30% of
the land area of the PEF is occupied by long-term research sites managed for timber and
monitored for research purposes by the USDA Forest Service. The forests of the PEF
had experienced some light timber cutting for conifer sawlogs approximately 20-40 years
before 1950, at which time most stands on the PEF were 60-100 years old, with older
individual trees scattered throughout the area.
The climate at the PEF is cool and humid; the mean (1 95 1 - 1980) annual
temperature for nearby Bangor, Maine is 6.6"C. February, the coldest month, has an
average daily temperature of -7. 1°C, whereas July, the warmest month, averages 20°C.
Mean annual precipitation is 1060 rnrn, with 48% falling from May-October. The PEF is
within the Acadian forest type of the northeastern US and Canada. The forest vegetation
across most of the PEF is predominately mixed conifers, mixed conifer-deciduous, or
(rarely) deciduous-dominated. Dominant species include eastern hemlock (Tsuga
canadensis), red spruce (Picea rubens), balsam fir (Abies balsamea), eastern white pine
(Pinus strobus), red maple (Acer rubrum), paper birch (Betula papyrifera), aspen

Table 1.2. Number and size of harvest gaps. The number of gaps per research area (n), mean and median gap size, variance measures, 95% confidence interval around means, and total area harvested are listed for all six research areas (and all areas pooled), grouped by treatment (Treat.). All sites are in the Penobscot Experimental Forest, Bradley, Maine, and were treated from 1996-1998.
Figure 1.1. Location of research areas in the Penobscot Experimental Forest (PEF). PEF is located in Penobscot County, Maine.

(Populus grandidentata and P. tremuloides), and American beech (Fagus grandifolia).
FERP research areas are on moderately well-drained soils, and contain approximately
60% coniferous tree species and 40% deciduous tree species, though small areas within
each site may contain higher (e.g., 90%) proportions of either type. It should be noted
that a few small canopy gaps from natural disturbance events existed on all sites (i.e.,
treatments and controls) prior to implementation of any treatments. These natural gaps
were similar in size to treatment harvest gaps, but were established before our study
began, and therefore varied in terms of the amount or height of regenerated vegetation.
Avian Censuses
All nine FEW research areas in the PEF had marked, parallel transects that were
spaced 50 m apart and ran the length (and around the perimeter) of the site; depending
on the shape of the site and the orientation of the lines, there were 5-10 transects per site.
From 1995-1998, each site was visited on 10 mornings from 21 May to 7 July by an
observer who spent approximately two hours walking along each transect to map bird
territories, using standardized spotmapping methods (IBCC 1970). I conducted 3-5 of the
ten censuses on every site in all four years. Censuses were also conducted by 1-2
additional observers who differed each year. Each year all observers visited the nine sites
in nearly equal proportions, with each observer counting birds on two sites per morning
in good weather. Observer-bias was minimized by training and practice to ensure that
techniques were similar among all observers in all years.
Consecutive visits to a site started at different corners, and transects were walked
in a direction opposite to the previous visit. Bird observations were not collected during
any precipitation, or when winds were >15 k m h . Each site had a similar proportion of

early (beginning before 0400 EST) and later (beginning around 0700 EST) morning
censuses. After all ten census visits were completed, all registrations for each species
were examined to determine how many territories were occupied by each species.
A territory was defined by an individual of a species detected in the same area on
at least six of ten visits (IBCC 1970). Multiple territories for a species typically were
delineated by counter-singing registrations. A temtory with 250% of registrations
outside the boundaries of a 10 ha research area was counted as 0.5 territories, as long as
three registrations were within site boundaries. Birds observed <6 times, or only seen
flying over the forest were not considered to be territorial.
To supplement census data collected from 1995-1998, I made one early-morning
visit to each treated site during the first week of June, 2002, and spent ten minutes
observing birds at each of the harvest-created gaps in each research area. This single visit
was intended to determine whether pioneer species had occupied any gaps since 1998, or
whether any species was obviously numerically abundant in or around gaps.
Analyses
The avifaunal metrics I examined among treatment groups were: 1) species
richness (i.e., number of species per site, with 2 0.5 territory); 2) total abundance (i.e.,
number of territories, pooling all species); 3) individual species abundance; 4) matrices
with all pair-wise comparisons of sites in terms of their percent dissimilarity index,
calculated from bird community abundance matrices. A fifth analytic approach was to
qualitatively assess which species were numerically dominant on sites before and after
harvest treatments, and determine whether any differences could be attributed to

treatments. Also, I determined whether "pioneer species" that prefer disturbed forests
tended to be observed on treated versus control sites after harvesting.
Treatment Groups: Classic ANOVA Approach
To determine whether harvest treatments affected bird communities, analyses
were conducted using two different approaches. The first was a "classic ANOVA
approach" that divided the nine sites into three treatment groups, based on whether they
received the 10-30 or 20-10 silvicultural treatment or were a control. Total avian
richness and abundance values were examined for normality for all years combined and
within each year. Both variables were normally distributed, so group differences were
tested with analysis of variance (ANOVA) methods (Zar 1999). Each variable was tested
in a factorial ANOVA model with 'year' and 'treatment group' as main effects and a
'year*treatment' interaction term (SAS 1990). The year-term generally was significant,
but treatment and interaction terms were not (see Results), so avian abundance and
richness were examined separately for each year. For each year, both abundance and
richness were compared across sites with one-way ANOVA, with treatment group as the
main-effect tested. Duncan's multiple comparison test was used to determine which
means differed significantly (SAS 1990) at an alpha level of 0.05.
In ANOVA models, I grouped sites by the treatment they would eventually
receive and compared all variables of interest among these groups, in 1995 (before
harvesting occurred), in 1998 (after all harvests), and in the intervening years when
treatments were applied to some but not all of the replicated blocks. Comparing the same
"fixed treatment groups with data from before and after they are treated is necessary to
distinguish between treatment effects per se and fundamental differences among the sites

that make up each treatment group. In the intervening years (i.e., 1996-1997), sites were
analyzed by these same "fixed" treatment groups, to see whether there were tendencies
for group differences in 1996 and 1997, when only one or two of the three sites within
each group had been treated, respectively (Table 1.1).
It may seem counterintuitive to analyze data for each year with sites grouped by
their eventual treatment, but there were no groups in 1995, as all sites were untreated.
Likewise, in 1996 only one site had been treated in the 20-10 and 10-30 groups (Table
1. I), so tests for treatment effects were confounded with differences related to individual
sites. By 1997, two of the three sites within each group had been treated (Table 1. I), so if
treatment effects were sufficiently strong they may have been evident. For 1997 data,
separate analyses were run using the "actual" treatment groups, and results are presented
when they differ qualitatively from analyses with "fixed treatment groups.
In addition to analyses on the pooled richness and abundance variables described
above, I examined whether the abundance (per 10 ha) of individual species differed
among treatments, for all species found on at least one site within each treatment group.
Because abundance data for individual species were not normally distributed for many
species in some or all years, treatment effects on individual species were examined using
JSruskall-Wallis analyses. The power of JSruskall-Wallis tests generally was low because
there were only three replicates per group, and the density per 10 ha for all species was
57; for most species it was 13. Therefore, individual species tests for treatment effects
were considered significant if pIO. 10 (Appendix A; Table A.6).

Treatment Groups: Controlled Comparisons
The second approach to examining treatment effects took advantage of the fact
that I had gathered before- and after-treatment data on all treated sites, and also sampled
untreated controls in the same periods. This approach was designed to explicitly examine
each variable of interest (e.g., pooled abundance), in terms of how it changed on treated
sites relative to controls, from the summer before to the summer after it was first treated.
No sites were examined two or three years post-treatment, because all three replicated
blocks of treated sites had one year of post-treatment data, but only two sets of replicates
had data from the second summer after treatment. As bird species richness was not
expected to change much from year to year, compared to pooled abundance, only pooled
abundance data were examined with the "controlled comparison" approach. As this
analysis was supplemental to the classic ANOVA analyses described above, individual
species abundances were compared between treatment groups (and to controls) only for
those few species that were most numerically abundant on a site andlor species for which
there was some evidence that treatments may have had an effect on their densities (see
Results). Because only two control sites (i.e., RA 3 and 4) were sampled in all four years,
the average of these two sites was used as the benchmark against which changes in
treated stands were measured.
The controlled comparison approach examined changes in abundance variables
from year "n" (the summer before treatment) to year "n-1" (after treatment) for each
treated site, but these values were subtracted from the mean change experienced on
control sites during the same period. Thus, if overall abundances dramatically decreased
or increased from one year to the next, as happened during all years of this study, this

analysis is designed to account for that change by determining whether abundances
increased or decreased more or less on treated sites relative to controls. Each replicate of
the three treated blocks provided two values (one from each treated site) representing the
change in abundance (relative to controls) that occurred after a site was treated.
The three pairs of comparisons (one for each block in each time period) were then
analyzed in two different ways. First, the mean of the pooled set of six values was tested
against the null hypothesis of zero, using a Student's t-test (Zar 1999). This tested
whether the six treated sites (pooled) were different from controls. Also, means for each
of the two treatment groups (n = 3 per group) were compared by a paired t-test (Zar
1999) to see if there was a difference in the relative change in abundance between the two
harvest treatments.
Bird Community Ordination
I used Mantel tests (Sokal and Rohlf 1995) and Multi-response Permutation
Procedures (MRPP) in PC-ORD (McCune and Mefford 1997) to assess bird community
differences among sites, treatment groups, and years. These ordination techniques are
based on comparisons of all pairs of sites in terms of their ecological distance or
dissimilarity, which is calculated by comparing complete species-abundance matrices for
the two sites. The statistical tests are performed on matrices of the pairwise-comparisons
of ecological distance among all nine sites. I used the Sorensen (or Bray-Curtis)
dissimilarity index (McCune and Mefford 1997) to measure percent dissimilarity between
sites. Compared to traditional Euclidean distance, this coefficient retains sensitivity in
more heterogeneous data sets and gives less weight to outliers (McCune and Mefford
1 997).

The Mantel test tested the null hypothesis of no relationship between two
dissimilarity matrices (McCune and Mefford 1997), and was used in two different ways.
First, I compared dissimilarity matrices for 1995 and 1998, for the eight sites sampled in
both years. This test examined the extent to which relationships among sites in 1995
changed after harvesting. I also used Mantel tests to examine whether site-by-site
dissimilarity matrices (for 1995 and 1998) were independent of treatment groups, by
comparing the dissimilarity matrix and a design matrix with zeros for sites within a
treatment group and ones for sites in different groups. This test is a nonparametric
equivalent of analysis-of-variance with statistical power similar to ANOVA (Sokal and
Rohlf 1995). Data from 1998 were analyzed with all nine sites, to maximize statistical
power. Data from 1998 were also analyzed with the eight sites sampled in 1995, to
enable direct comparisons of treatment effects between 1995 and 1998, and determine
whether there were a priori group differences unrelated to treatments. Mantel tests were
also run separately with sites in the 10-30 and 20-10 harvest treatment groups combined
and compared with unharvested controls.
I also examined treatment effects using MRPP. This test compared the mean
Sorensen dissimilarity index for sites within a treatment group to the mean for all groups
(yielding the observed test statistic, delta) and compared this value with an expected
delta, calculated to represent the mean delta for all possible partitions of the data
(McCune and Mefford 1997). I ran MRPP for 1995 and 1998. As with the Mantel tests
above, I ran MRPP for 1998 with all nine sites and with the same eight sites sampled in
1995, to enable direct comparison between results for 1995 and 1998. I also ran a set of

analyses with the two harvest treatments pooled into one group and compared to
unharvested controls.
Qualitative Assessments of Avifaunal Change
For each of the eight sites with data from all four years (1995-1998), I compared
lists of "numerically dominant" species for each site in 1995 and 1998, to see what
proportion of the dominant species were the same before and after treatments were
implemented. Numerical dominance was determined by tallying the shortest possible list
of species which comprised more than 50% of the total abundance for a site in a given
year. For all sites and years examined, a mean (and median) of six species dominated
each site. I compared the similarity of each site's list of dominant species in 1995 and
1998, to compare the extent of changes in dominance for treated versus control sites. In
determining which species were most dominant in 1998, I allowed any species with the
same abundance in 1998 to be substituted for each other.
Power Analyses
Tests for significant differences among treatment groups are not meaningful
without an estimation of the effect size that was likely to be detected, given the
experimental design and the variability of measured parameters. To estimate effect sizes
detectable in this study, I used software PASS (Hintze 2001) to plot the statistical power
of one-way ANOVA tests as a function of the within-group standard deviation of the
response variable, with separate curves for alpha levels of 0.05 and 0.10. These tests
were run iteratively with fixed effect sizes that reflected lo%, 20% and 30% differences
between values of the response variable in one treatment group (e.g., the control) and
values in one or both of the other groups. These curves can then be viewed in the context

of the standard deviations observed in this study for each treatment group, in each year of
interest (Appendix B).
Formal power analyses were conducted for only one response variable: total
avian abundance. Relative to total abundance, analyses of avian richness have much
greater power because this variable had much lower variability. Conversely, analyses of
individual species abundances were much more variable than total abundance; therefore
it was a given that these tests had sufficient power to detect only differences of a large
magnitude. An informal estimate of detectable effect size was also carried out for MRPP
tests. This was done by iteratively re-running MRPP analyses ten times, after randomly
selecting 10% and 20% of all individuals on sites that received the 10-30 and 20-10
treatments, respectively, and then recalculating species abundance matrices with these
individuals removed.
RESULTS
Avian Richness and Abundance Among Years
Strong year-to-year fluctuations in both species richness and abundance were
evident from 1995- 1998 (Fig. 1.2), but these fluctuations were observed on all sites and
could not be attributed to harvest treatments. Mean species richness (+standard error) per
10 ha site ranged from 20.8 (k0.4) in 1995 to 25.3 (k0.8) in 1997, with 95% confidence
intervals overlapping from 1996-1998. An ANOVA model for species richness with
year, treatment, and year*treatment interaction terms was significant (p=0.025), and had
a highly significant year-term (p=0.0006), but treatment and interaction terms were not
significant (Appendix A; Table A.7). Pooling across species and sites, mean abundance
(f standard error) of territories per 10 ha decreased from 50.8 (+I .4) in 1995 to

1995 1 996 1997 1998
Year Figure 1.2. Mean avian abundance (per 10 ha) for nine research areas in the PEF. Error bars represent 95% confidence intervals.
41.6 (k1.4) in 1996, then increased by 44% to 59.8(+1.6) in 1997, with no overlap in 95%
confidence intervals around any of these three means (Fig. 1.2). In 1997 and 1998,95%
confidence intervals overlapped slightly. An ANOVA model for avian abundance with
treatment, year, and treatment*year interaction terms was not significant (p=0.497),
though a subsequent one-way test of year-effects was marginally significant (p=0.06; see
Appendix A; Table A.7.). These strong year-effects are interesting, and are explored
further in Chapter 3. Because year-effects from 1995-1998 were significant for both
avian richness and abundance, subsequent analyses were conducted separately by year.
The controlled comparison of pooled abundance showed that changes in
abundance from pre-treatment to the first summer post-treatment were significantly
greater on the six treated sites than on two control sites (t-value 3.47, 5 d.f., p = 0.02).

On average, the annual changes in treated sites resulted in 6.75 more birds than on
controls. This represents a 13% increase over the mean (pooling all sites and years)
abundance of 5 1 birds per 10 ha site. However, changes in abundances on treated sites
were high relative to controls only for the first summer after treatment; this pattern did
not hold up in the second or third summer after harvest.
For example, from 1995 to 1996 all nine sites showed decreases in avian
abundance, but the two treated sites (i.e., RA1 and RA2) decreased less than did controls.
However, from 1996 to 1997 these same two sites increased more slowly than did
controls (mean increase in total abundance = 11.75 for treated sites versus 19 for
controls); from 1997 to 1998 abundances decreased similarly on treated and control sites
(-7.75 versus -8.75, respectively). Similarly, the second block of sites (i.e, RA5 and
RA6) showed higher increases in abundance than did controls from 1996 to 1997 (mean
increase of 23.5 versus 19 in controls) but then decreased twice as much as controls from
1997 to 1998 (mean decrease of -17.5 versus -8.75 in controls). Nevertheless, before
any sites were treated in 1995 the mean abundance for the two control sites was
significantly higher than was the mean for six sites that were slated for eventual harvest,
whereas in 1998 controls generally had lower abundances than did treated sites (Fig. 1.3),
though the difference in 1998 was not significant.
Avian Richness and Abundance Within Years
When sites were grouped by their eventual treatment, bird abundance in 1995
(i.e., before any treatments had been applied) differed significantly among the three
treatment groups (p=0.02), with higher abundance in the control (n = 2 sites) and 10-30
group (n = 3) than in the 20- 10 group (n = 3; Fig. 1.4). In 1997, if sites were

Research Areas (RA)
a 20-10 Treatment (hatched plots)
B. Research Areas (RA)
Figure 1.3. Difference in abundance between two control sites and six treated research sites. Measured as the control mean minus the abundance on each site. Data are from 1995 (Fig. 1.3A) before treatments had occurred, and from the summer after each site had been treated (Fig. 1.3B). T-tests of the null hypothesis of zero difference were significant in 1995 (t = 2.58,5 d.f., p = 0.05), but not for post-treatment (t = -1.73, 5 d.f., p = 0.14).

grouped by the actual treatments received, there was a marginally significant difference
among groups (p=O. 107). Duncan's Multiple Comparison test indicated that the 10-30
group (n = 2) had significantly more territories than the 20-10 group (n = 2), with the
control group (n = 5) intermediate between (and not significantly different from) the two
harvest treatments. However, there were no differences among these treatment groups
(all with n =3 sites) in 1998, after all sites had been treated (Fig. 1.4).
Power analyses indicated that at an alpha level of 0.10 there was very low power
to detect 10% differences among treatment groups, based on data from 1997 (power .=
0.45) and 1998 (power .= 0.20), using average within-group standard deviation. Power to
detect 20% differences among groups was much higher for both 1997 (power .= 0.93) and
1998 (power = 0.60). For detecting intergroup differences of 30%, power was very high
for 1997 even at an alpha of 0.05 (power = 1.0); it was also high for 1998 data (power
4 . 8 8 at alpha = 0.10). Therefore, the lack of significant treatment effects, viewed in the
context of power analyses, indicates that treatments probably did not reduce total avian
abundance by 20-30% for any treatment.
Mean species richness for sites grouped by treatment were similar among years,
and usually differed by <1 species per 10 ha (Table 1.3). One-way ANOVA'S with
species richness as the dependent variable and treatment group as the main-effect were
not significant in any year (Table 1.3), nor were multiple comparison tests.
Individual Species Abundances
Densities of individual species observed on each of the nine sites from 1995-1998
(Appendix A; Tables A.1 -A.4) were averaged over all years (Appendix A; Table AS)
and by treatment group within each year (Appendix A; Table A.6). Kruskal-

Control I A A A
I A A B A A A
T
1997
Year
Figure 1.4. Mean avian abundance (per 10 ha) by treatment group. Sites grouped by the treatment they will receive, regardless of actual treatment status in a given year. Sample size is three sites per group, except for controls in 1995 (n=2). Error bars represent 95% confidence intervals. In each year, bars with the same letter do not differ significantly according to Duncan Comparison Tests.
Wallis tests for treatment effects on each species and year (Appendix A; Table A.6)
showed very few species for which densities were significantly different, at an alpha level
of 0.10. No species showed treatment effects in >1 year. The two species for which
Kruskal-Wallis results were most significant (p < 0.05) were the Blue Jay (Cyanocitta
cristata) and Brown-headed Cowbird (Molothrus ater). In 1997, Blue Jays were twice as
abundant (p=0.02) on two stands with the 10-30 treatment compared to other groups.
However, Blue Jay mean densities were generally low and similar across groups and
years (Appendix A; Table A.6), so the statistical significance of this result is of little
ecological interest. Likewise, Brown-headed Cowbirds were significantly (p=0.05) more
abundant in the control group in 1997, but were rare overall, occurring on only one site in

Table 1.3. Mean avian species richness for nine research areas in the PEF. Sites grouped by the treatment (Treat.) they will eventually receive, regardless of treatment status in a given year. For 1997, data are presented with treatment groups "fixed," and alternately based on the treatments actually applied (i.e., "actual") in that year. Means with the same letter are not different, according to ~uncan's Multiple Comparison Test. P-values presented for ANOVA analyses within each year. Abbreviations are: number of stands in group (N), standard deviation (SD), standard error (SE), and confidence interval (CI).
Year Treat. N Mean SD SE Lower Upper 95% CI 95% CI
Control 2 21.50" 0.707 0.500 15.147 27.853 1995 10% cut 3 20.67 " 1 .527 0.882 16.872 24.46 1
20% cut 3 20.33 " 0.577 0.333 18.899 2 1.768 ANOVA: pd.53
1996 10% cut 3 21.33" 4.042 2.333 1 1.294 3 1.373 -
20% cut 3 21.67 " 4.042 2.333 1 1.627 3 1.706 ANOVA: ~9.97 - Control 3 25.67 " 1.155 0.667 22.798 28.535
1997 10% cut 3 25.33 " 4.042 2.333 15.294 35.373 -
(Fixed) 20% cut 3 25.00 " 2.646 1 .527 18.428 3 1.572 ANOVA: ~=0.96 - - Control 5 25.40 A 1.673 0.748 23.322 27.478
1 997 10% cut 2 26.50~ 4.950 3.500 -17.972 70.972 (Actual) 20% cut 2 24.00 " 2.828 2.000 -1.412 49.4 1 2
ANOVA: p=0.67 Control 3 25.00" 2.646 1 .527 1 8.428 3 1.572
1998 10% cut 3 24.00" 1.732 1 .OOO 19.697 28.303 20% cut 3 24.33 " 1.155 0.667 2 1 A65 27.202 ANOVA: p=0.82
1995, no sites in 1996, four sites in 1997 (three were controls), and at low densities
across all treatment groups in 1998 (see Appendix A; Tables A.4 and A.6).
Two other species differed significantly among groups in 1998: the American
Robin (Turdus americanus) and Red-breasted Nuthatch (Sitta canadensis). The
American Robin was generally rare, and its significant in 1998 is due to its absence on all
groups but one (Appendix A; Table A.6). That Red-breasted Nuthatch were more
abundant on the 20-10 treatments in 1998 is especially interesting when you consider that
its abundance was lowest on this set of sites in 1995. In 1995, Red-breasted Nuthatch

was most abundant on control sites, but it decreased on controls over the next four years
while increasing on harvested stands (Fig. 1 SA); this species is discussed further below.
Although only three species differed significantly among treatments in 1998, four other
species showed patterns that might indicate a preference for harvested or control sites,
though differences were not significant: Blackburnian Warbler (Dendroicafisca),
Winter Wren (Troglodytes troglodytes), and Eastern Wood-Pewee (Contopus virens)
increased on sites with the 20-10 treatment while decreasing on controls, from 1995-1998
(Fig. 1.5). On sites with the 10-30 treatment, these species' abundances were
intermediate between the 20-10 group and controls. A fourth species, Black-throated
Blue Warbler (Dendroica caerulescens), seemed to favor untreated sites (Fig. 1 SE).
As mentioned in the Methods, power to detect treatment effects on individual
species was quite low. Thus, the tests' lack of significance indicates only that differences
among treatment groups were not of a large magnitude, e.g. 50%. An informal
examination of statistical power for analyses of individual species abundances was done
by artificially reducing abundance values by 50% on treated versus control sites and
testing for treatment effects. After the artificial reductions in abundance, treatment
effects were highly significant for almost all species.
Bird Community Ordination
Mantel tests on dissimilarity matrices for 1995 and 1998 showed a significant
positive association (Standardized Mantel r = 0.521; p = 0.006), indicating that
differences in bird community composition were similar before and after harvesting
occurred. This result can be viewed as a rejection of the null hypothesis that research

Treabnent Grwp
B) Blackburnian Warbler Treabnent Gmup
A) Red-breasted Nuthatch
-1 0 1030 Ca*d
Treatment Group Treatment Group
C) Winter Wren D) Eastern Wood-Pewee
Treatment Group
E) Black-throated Blue Warbler
Figure 1.5. Mean density of species with apparent treatment preference. Preferences are for treatment 20-10 (A-D) or control (E). Each treatment group with n=3 sites (10 ha) except for controls in 1995 (n=2). Error bars represent one standard deviation.

areas with the same treatments were more similar to each other than they were to sites
with other treatments (including controls).
For the eight sites sampled in both 1995 and 1998, there was no evidence that
site-to-site differences were related to treatment groups, as Mantel tests for group
differences (using a design matrix) were not significant for 1995 (Standardized Mantel r
= -0.107; p = 0.226) or 1998 (Standardized Mantel r = -0.213; p = 0.1 19). When sites in
the 20- 10 and 10-30 treatment groups were combined and compared to controls, results
similarly indicated no differences attributable to treatment, either before (1995:
Standardized Mantel r = -0.153; p = 0.348) or after harvesting (1998: Standardized
Mantel r = -0.193; p = 0.221). A set of Mantel tests for group effects that included all
nine sites in 1998 was similar to the tests above for eight sites. Whether all three
treatment groups were considered (Standardized Mantel r = -0.039; p = 0.332), or when
sites in two harvest treatment groups were pooled and compared to controls
(Standardized Mantel r = 0.200; p = 0.200), there was no evidence that site-by-site
dissimilarity matrices were related to treatment groups.
The Multi-response Permutation Procedures (MRPP) results for 1998 indicated no
treatment effects, whether all three groups were considered (R = 0.0003; p = 0.463) or
only two groups (harvested vs. control) were used (R = 0.005 1; p = 0.363). Though
group differences were not significant, there was a trend towards greater heterogeneity
among control sites, and more similarity among harvested sites (average percent
dissimilarity for control group = 0.283; 10-30 group = 0.252; 20-10 group = 0.229).
Iterative MRPP tests with 10% and 20% of individuals artificially removed from the 10-
30 and 20- 10 treatment groups, respectively, indicated that power to detect differences of
this magnitude among three treatment groups was low. Comparing among all three
treatment groups, none of ten MRPP iterations (with artificial reductions) were
significant at alpha = 0.10. Tests with only two groups, harvested sites versus controls,
were more significant: three of 10 iterations had p-values 50.10, and the mean p-value
was 0.163. Therefore, MRPP tests probably would have detected only effects that were
equivalent to 20-30% reductions in abundance between treated versus control sites.
Qualitative Changes in Avifauna
For all eight sites examined, the list of numerically dominant species (i.e., those
comprising >50% of territories on a site) was very similar in 1995 and 1998 (see
Appendix A for relative abundance of all species, sites, and years). For five of the eight
sites examined, five of six species (83.33%) that were most abundant in 1995 were also
most abundant in 1998; one control site shared four of six dominant species, whereas
two other sites had the same six most abundant species in 1995 and 1998. Grouped by
treatment, the percentage of the six most abundant species that were the same in 1995 and
1998 were 83.3% (20-10 treatment), 88.9% (10-20 treatment) and 83.3% (controls).
These data reflect the fact that the species composition overall was very similar among
years both at treated and control sites. This is true whether one examines numerically
dominant species or less common ones (Appendix A).
Virtually no "pioneer species" (those preferring disturbed habitats) were found on
treated sites in the years after they were harvested. The only evidence of use of treated
sites by pioneer species was a single White-throated Sparrow (Zonotrichia albicollis)
territory that was observed within one large gap on Research Area 1 (in one year) and
Research Area 6 (two years in a row) after they were harvested. No other species known

to prefer disturbed habitats (Lent and Capen 1995) was observed during this study. On
one brief visit (a 10 minute point count) to each harvest gap in 2002 no new pioneer
species were observed. A single White-throated Sparrow was observed on three of the
harvested sites in 2002, but only at one harvest gap per site.
DISCUSSION
This study provided little evidence that 10% or 20% timber removals in small
patches with overstory retention caused major changes to breeding bird communities on
10 ha sites. Differences among sites and yearly fluctuations in bird densities generally
were much stronger than those attributable to harvest treatments examined 1-3 years after
cutting. Within any year, when harvested sites were compared to controls, or pre- and
post-treatment data were compared for individual sites, treatment effects were not
apparent in terms of species richness, total abundance, or the abundance of individual
species. In 1998, after all sites were treated, avian abundance and species composition
were very similar to what was seen in 1995, before any sites were treated.
Bird abundance did increase more andlor decrease less on treated sites than on
controls in the first summer after treatment, but this tendency was not seen in the second
or third summer after treatment. Notably, there were significantly more birds on control
sites before any treatments were implemented (i.e., in 1995), whereas there generally
were fewer birds on control sites after all treatments were implemented (Fig. 1.3). This
suggests that avian abundances may have temporarily increased approximately 10% in
response to the treatment. The relatively high abundance on treated sites was seen
despite the fact that no new species occupied harvested stands, avian species richness was

not higher in harvested stands, nor was the abundance of any single species greater on
treated versus control sites.
Perhaps the clearest finding of this study was that the harvest treatments did not
effect ecologically important changes in the species composition of birds using the
treated sites, relative to birds on controls. Dissimilarities in bird communities among
sites in 1995 were significantly related to the relationship among stands in 1998, whereas
dissimilarity matrices were unrelated to treatment groups in either year. With the
possible exception of four species that showed (mostly non-significant) tendencies for
higher or lower abundance in treated sites, this study demonstrates that this type of
disturbance was not of sufficient intensity to effect noticeable changes in bird
communities of mixed-wood forests. This is important information, because researchers
have a poor idea of what levels of timber harvest intensity affect most species, and some
forest managers would like to use harvest systems that minimize ecological impacts.
Few studies have investigated relatively low-intensity timber harvests, and those
that have generally examined cutting intensities that are greater-and on larger spatial
scales-than FERP harvest treatments. Three studies in Vermont (Lent and Capen 1995,
Germaine et al. 1997, Buford and Capen 1999) evaluated bird community effects from
10-36% timber removals, but these studies focused on small clearcuts that were actually
much larger than the harvest gaps I studied. Other research looked at relatively low
harvest rates such as 10% (Buford and Capen 1999) or 18-35% (Welsh and Healy 1993),
but evaluated effects on bird communities over large spatial scales, e.g., 500 ha (Buford
and Capen 1999) or 64 ha (Welsh and Healy 1993), and sampled birds only in
unharvested portions of their study areas.

The different spatial scale of cuts in earlier studies is important because patch
clearcuts often create habitat patches used by "pioneer" bird species that prefer young
forests, but not used by mature-forest birds. Early-forest species such as Chestnut-sided
Warbler (Dendroica pensylvanica), White-throated Sparrow, and Common Yellowthroat
(Geothlypis trichas) reached high densities in patch cuts studied by Lent and Capen
(1995), Germaine et al. (1997), and Derleth et al. (1989). In contrast, young-forest bird
species were completely absent from the FERP harvest gaps I studied, with the exception
of two White-throated Sparrow territories. This is probably due to the fact that the
smallest known songbird territories are approximately 0.07 ha (Bird 1999), but more
typically are >1 ha (Bird 1999, Smith and Shugart 1987), and many species require
habitat patches much larger than their actual territory if they are to breed successfully
(Lynch and Whigham 1984, Opdam et al. 1985). Gap sizes in the PEF research areas
averaged 0.12 ha ( a . 0 1 SE) and 0.07 ha ( a .01 SE) for the 20-10 and 10-30 treatments
(Table 1.2), and the largest gaps available were only 0.21 ha and 0.13 ha, respectively.
It may also be important that patch cuts studied by others (Lent and Capen 1995,
Germaine et al. 1997, Buford and Capen 1999) had little or no overstory retention within
gaps, whereas FERP harvest gaps always contained retention trees, including some large,
canopy-trees. To my knowledge, there have been no studies that have looked at early-
forest bird abundance or habitat use as a function of the amount of vegetation retained
within cut gaps, andlor clearcut patch size, from very small (e.g., 0.05 ha) to territory-
sized (e.g., 1-5 ha) to stand-sized (e.g., 10-100 ha), though Rudnicky and Hunter (1993)
examined clearcuts from 2- 107 ha, and found that some species did prefer larger cuts.

I monitored bird community changes on harvested stands only 1-3 years after
harvests (Table 1. l), which may have been too soon to see some changes that may have
occurred. For example, high site-fidelity of songbirds could result in territorial birds
returning and remaining on treated sites each summer, as long as they are alive. If this
occurs, the most marked changes in density and community composition may occur four
or five years after treatment, after most resident birds have died. In Chapter 2, I explore
how treatments affected site-fidelity of two species, within 1-3 years after treatment.
Another reason that bird community changes may have occurred more than 1-3
years after treatment would be if it took more than three years for the disturbed habitats to
change sufficiently (in terms of vegetation regeneration) to attract new or different
species to the disturbed patches, or increase their densities. Vegetation 1-3 m high had
regenerated in some harvest gaps by the third growing season after harvest, but there was
relatively little vegetative response in the summer immediately after harvest, especially
within small and/or heavily-shaded harvest gaps. Other studies have shown that bird
communities change dramatically 1-2 years after harvest (Derleth et al. 1989, Lent and
Capen 1995, Norton and Hannon 1997, Gram et al. 2001, Tittler et al. 2001, and
references therein). However, the rate of change in vegetation after harvest is probably
directly related to harvest intensity and patch size, all else being equal. Therefore, low-
intensity, small-scale harvests such as I studied may have a slower vegetative response,
which might increase response time in the bird community.
It is not known whether any FERP harvest gaps were occupied by pioneer bird
species since 1998. Based on a single visit to each harvest gap in 2002, there was no

evidence of any new pioneer species using gaps, nor was any one species obviously
abundant in or around gaps, compared to earlier surveys.
Having only three (10 ha each) replicates per treatment resulted in my having
limited statistical power to detect differences, especially for individual species. For
example, if mean densities (and variance) were the same for Blackburnian Warbler, but
sample sizes were doubled from three to six sites per group, a Kruskall-Wallis test for
treatment effects would have been significant (p=0.03). Verner and Milne (1990) argued
that observer and analyst variability in spot map data limits the power to detect
differences in densities of individual species unless there are many (e.g., 30) samples per
group. According to Verner and Milne (1990), three or four (for one- or two-tailed test)
samples per treatment are needed even to detect 50% differences among groups, with an
alpha level of 0.10 and power of 0.80. However, variability was much less and power
much greater when the entire bird community was the variable of interest. Others
(07Connor 1981) have indicated that careful methodology reduces spotmapping
variability to low levels. I used spotmapping and analytic methods specifically intended
to minimize variability among sites and treatments, and thus maximize statistical power.
Despite having few replicates, the complete randomized block design of the FERP
experiment is more rigorous than the vast majority of studies (but see Gram et al. 2001)
of how harvest treatments affect birds (Thompson et al. 2000). Still, given the low power
of my Kruskal-Wallis tests, there was a distinct possibility of making Type II errors, i.e.,
failing to reject a null hypothesis (of no treatment effect) that was false. This must be
considered in deciding whether it is biologically significant that five species showed

apparent preferences for either harvested or control sites. It is clear, however, that most
species did not differ in density among the treatment groups.
I examined studies from across the northeastern US to see if there was similar
evidence of an apparent preference for harvested areas for Red-breasted Nuthatch,
Blackburnian Warbler, Eastern Wood-Pewee, and Winter Wren, or for unharvested areas
for Black-throated Blue Warbler. Overall, most studies showed that abundances of all
five species were similar in harvested and unharvested areas (e.g., Webb et al. 1977,
Welsh and Healy 1993). Some studies indicated a preference for harvested areas for
Blackburnian Warbler and Red-breasted Nuthatch (Buford and Capen 1999), Eastern
Wood-Pewee (Derleth et al. 1989), and even Black-throated Blue Warbler (Derleth et al.
1989). Other studies indicated a preference for unharvested areas for Blackburnian
Warbler (Webb et al. 1977, Derleth et al. 1989), Red-breasted Nuthatch (Webb et al.
1977), and Black-throated Blue Warbler (Buford and Capen 1999).
CONCLUSIONS
Experimental removals of 0%, 1096, and 20% of mature trees on nine 10 ha
mixed-wood sites in Central Maine, in small (<0.07-0.12) gaps with residual trees,
caused few significant changes in bird communities within sites before versus after
harvesting, or between harvested and unharvested sites. Most (SO%) of the same
species were numerically dominant on all sites before and after harvesting, and virtually
no pioneer species invaded the treated sites. Annual changes in bird abundance were
strong on all sites; these differences among years were much greater than differences
among sites within any year. Measured as a function of year-to-year changes in
abundance, birds were relatively more abundant on treated sites one year after harvesting

than on controls, but this difference did not persist two or three years after treatment.
Apparently, removals of >20% of timber or harvests done on a larger scale are necessary
to cause detectable increases or decreases in individual bird species, or invasion by
species preferring young versus mature forests. Based on power analyses, a study design
like mine had a high probability of detecting differences in abundance of approximately
30% in any year, and had much higher power to detect differences in abundance in some
years, and in species richness in all years.

LITERATURE CITED
Annand, E.M., and F.R. Thompson, III. 1997. Forest bird response to regeneration practices in central hardwood forests. Journal of Wildlife Management 61 : 159- 17 1.
Bird, D.M. 1999. The bird almanac. Key Porter Books Limited, Toronto. 460 pp.
Blake, J.G., J.M. Hanowski, G.J. Niemi, and P.T. Collins. 1994. Annual variation in bird populations of mixed conifer-northern hardwood forests. Condor 96:38 1-399.
Buford, E.W., and D.E. Capen. 1999. Abundance and productivity of forest songbirds in a managed, unfragmented landscape in Vermont. Journal of Wildlife Management 63:180-188.
Derleth, E.L., D.G. McAuley, and T.J. Dwyer. 1989. Avian community response to small-scale habitat disturbance in Maine. Canadian Journal of Zoology 67:385-390.
Germaine, S. S., S.H. Vessey, and D.E. Capen. 1997. Effects of small forest openings on the breeding bird community in a Vermont hardwood forest. Condor 99:708- 71 8,
Gram, W.K., V.L. Sork, R.J. Marquis, R.B. Renken, R.L. Clawson, J. Faaborg, D.K. Fantz, J.Le Corff, J. Lill, and P.A. Porneluzi. 2001. Evaluating the effects of ecosystem management: a case study in a Missouri Ozark forest. Ecological Applications 1 1 : 1667- 1679.
Hagan, J.M., P.S. McKinley, A.L. Meehan, and S.L. Grove. 1997. Diversity and abundance of landbirds in a northeastern industrial forest. Journal of Wildlife Management 61 :7 18-735.
Holmes, R.T., and T.W. Sherry. 1988. Assessing population trends of New Hampshire forest birds: local vs. regional patterns. Auk 105:756-768.
Hunter, M.L., Jr. 1990. Wildlife, forests, and forestry: principles of managing for biological diversity. Prentice-Hall, Inc. Englewood Cliffs, NJ. 370 pp.
I.B.C.C.(International Bird Census Committee) 1970. An international standard for a mapping method in bird census work recommended by the I.B.C.C. Aud. Field Notes 24:722-736.
Lent, R.L., and D.E. Capen. 1995. Effects of small-scale habitat disturbance on the ecology of breeding birds in a Vermont (USA) hardwood forest. Ecography 18:97- 108.
Lorimer, C.G. 1 977. The presettlement forest and natural disturbance cycle of northeastern Maine. Ecology 58: 139-148.

Lynch, J.F., and D.F. Whigham. 1984. Effects of forest fragmentation on breeding bird communities in Maryland, USA. Biological Conservation 28:287-324.
McCune, B., and M.J. Mefford. 1997. Multivariate analysis of ecological data. Version 3.09. MjM Software, Gleneden Beach, OR.
Norton, M.R., and S.J. Hannon. 1997. Songbird response to partial-cut logging in the boreal mixedwood forest of Alberta. Canadian Journal of Forest Research 27:44- 53.
O'Connor, R.J. 198 1. The influence of observer and analyst efficiency in mapping method censuses. Studies in Avian Biology 6:372-376.
Opdarn, P., G. Rijsdijk, and F. Hustings. 1985. Bird communities in small woods in an agricultural landscape: effects of area and isolation. Biological Conservation 34~333-352.
Rudnicky, T., and M.L. Hunter, Jr. 1993. Reversing the fragmentation perspective: effects of clearcut size on bird species richness in Maine. Ecological Applications 3:357-366.
Runkle, J.R. 1985. Disturbance regimes in temperate forests. Pp. 17-33 in S. T. A. Pickett, and P.S. White. The ecology of natural disturbance and patch dynamics. Academic Press, Orlando, FL. 472 pp.
Sallabanks, R., and J.M. Marzluff. 2000. Forest management and bird populations: an introduction. Wildlife Society Bulletin 28: 1086-1087.
Sallabanks, R., E.B. Amett, and J.M. Marzluff. 2000. An evaluation of research on the effects of timber harvest on bird populations. Wildlife Society Bulletin 28: 1 144- 1 155.
SAS Institute. 1990. SASISTAT user's guide, version 6. SAS Institute, Cary, NC.
Smith, T.M., and H.H. Shugart. 1987. Territory size variation in the Ovenbird: the role of habitat structure. Ecology 68:695-704.
Sokal, R.R., and F.J. Rohlf. 2000. Biometry. W.H. Freeman and Company, New York. 887 pp.
Thompson, F.R. ID, J. D. Brawn, S. Robinson, J. Faaborg, and R.L. Clawson. Approaches to investigate effects of forest management on birds in eastern deciduous forests: How reliable is our knowledge? Wildlife Society Bulletin 28: 11 11-1 122.
Tittler, R., and S.J. Hannon. 2000. Nest predation in and adjacent to cutblocks with variable tree retention. Forest Ecology and Management 136: 147- 157.

Verner, J., and K.A. Milne. 1990. Analyst and observer variability in density estimates from spot mapping. Condor 92:3 13-325.
Webb, W.L., D.F. Behrend, and B. Saisorn. 1977. Effect of logging on songbird populations in a northern hardwood forest. Wildlife Monographs No. 55. 35 pp.
Welsh, C.J.E., and W.M. Healy. 1993. Effect of even-aged timber management on bird species diversity and composition in northern hardwoods of New Hampshire. Wildlife Society Bulletin 21 : 143- 154.
Zar, J. H. 1999. Biostatistical Analysis, 4" Edition. Prentice Hall, NJ. 929 pp.

Chapter 2
EFFECTS OF EXPERIMENTAL HABITAT DISTURBANCES ON BREEDING
SITE-FIDELITY OF ADULT HERMIT THRUSHES (Catharus guftatus) AND
OVENBIRDS (Seiurus aurocapillus)
INTRODUCTION
In most passerine bird species, adults have a high probability of returning to the
same breeding area each year (Greenwood and Harvey 1982). This site-fidelity usually is
stronger for males versus females (Darley et al. 1977), and older versus younger birds
(Greenwood and Harvey 1977). Given the fitness costs associated with breeding
dispersal (Dieckmann et al. 1999, Danchin and Cam 2002), it is not surprising that site-
fidelity is directly related to breeding success. Successful breeders show stronger site-
fidelity than unsuccessful birds (Greenwood and Harvey 1982, Beletsky and Orians 1987,
Slagsvold and Lifjeld 1989) and site-faithful birds are more successful than birds that
disperse to a new area (Greenwood and Harvey 1982, but see Beletsky and Orians 1987).
Therefore, factors that increase avian breeding dispersal likely reduce productivity.
Given the links between productivity, fitness, and breeding dispersal, it is
important to understand how natural and anthropogenic habitat disturbances affect a
species' site-fidelity. It seems reasonable to assume that severe disturbances such as
intense fires or clearcuts-especially those covering large areas-render breeding habitat
unsuitable for many species, and effect sudden and high rates of breeding dispersal. It is
not clear how important less-severe disturbances may be because most studies of site-
fidelity have been in areas where habitat disturbances were absent or unmentioned.
Across various North American forests, natural disturbances cause mortality of
canopy trees at a rate of 0.5-2% per year (Runkle 1985, Seymour et al. 2002). Another

important disturbance in North American forests is timber harvesting, which varies in
intensity from low-intensity "partial-harvests" to complete removals of mature trees (e.g.,
clearcuts). Though application rates of various silvicultural methods vary both in space
and time, forest practices affect millions of hectares of North American forests each year.
Considering natural and anthropogenic disturbances, habitat for millions of resident and
migratory songbirds is disturbed annually, yet we have little understanding of how these
disturbances affect most aspects of avian life history, including breeding dispersal.
If a habitat disturbance does not reduce breeding habitat quality, birds should
return to disturbed and undisturbed sites at similar rates (O'Connor 1985). If avian
habitat quality is reduced by a disturbance of a given intensity and scale, several
responses are possible. Birds that bred on undisturbed sites in year "t" might be less
likely to return to their site if it has been disturbed before the breeding season in year
"t+l." Alternately, birds could return to disturbed and undisturbed sites at similar rates in
year "t+lW but choose not to return to disturbed sites in year "t+2" or any subsequent
year. Likewise, a bird on a disturbed site in year "t" may be less likely to return to the
site in year "t+l" compared to a bird on a site that is undisturbed in year "t" and "t+l."
In this study I examined how site-fidelity of two common forest birds, Hermit
Thrushes (Catharus guttatus) and Ovenbirds (Seiurus aurocapillus), were affected by
experimental disturbances that were within the range of intensity and of a spatial scale
typical of natural disturbances in the region. Site-fidelity and breeding dispersal of adult
birds were examined using three complementary approaches. First, I compared between
treated and control sites the proportion of birds captured on a site in year "t" that returned
to that site in year "t+ 1" and year "t+2." Return rates to a site are partly a function of the

size of sites examined (Barrowclough 1978), as return likelihood decreases as the site
approaches the size of a bird's territory. Therefore, it is also useful to measure site-
fidelity as a continuous variable using the distance between a bird's territories in two
successive years. This distance, a measure of "breeding dispersal" (Greenwood 1980),
has been referred to as a bird's "site-attachment" (Holmes and Sherry 1992). To put site-
fidelity dynamics into a broader life-history perspective, and to use a large sample of
marked birds, I also examined survival and recapture rates for the two focal species.
Because observed (i.e., "apparent") return rates are a product of both these parameters,
they must be considered separately to avoid bias (Clobert and Lebreton 1991).
Objectives
The primary objective of this research was to determine whether the breeding
dispersal of Hermit Thrush or Ovenbird was affected by experimental disturbance
treatments where 10-20% of mature trees on 10-ha areas were removed in a series of
small (0.07-0.12 ha) gaps. A second objective was to use capture-mark-recapture
methods to estimate annual survival and recapture rates for both species.
Hypotheses Tested
The response of these two species (examined separately) to treatment were
measured in two ways, as indicated by the following null hypotheses:
Null hvuothesis 1: birds captured on a site in year "t" have the same probability of
returning to that site in year "t+lW whether the site is a control in both years, a control
in year "t" that is treated before year "t+l," or is treated before year "t."
Null hypothesis 2: the distance between territories of successive years (i.e., site-
attachment) does not differ for birds on treated versus control sites.

METHODS
This study was part of the Forest Ecosystem Research Program (FEW). See
Chapter 1 for a description of the study area (Penobscot Experimental Forest) and
experimental design. It should be reiterated in this chapter that each research area (i.e.,
each 10 ha site) was embedded within a continuous landscape of mature forest; with the
exception of one or two dirt roads and one or two houses, most sites were >5 km from
any openings in the forest (excepting minor natural disturbances). Another notable
aspect of this chapter is that, in contrast to Chapter 1, all analyses in Chapter 2 combine
the 20-10 and 10-30 harvest treatments and do not considered them as two separate
treatments, because relatively few birds were captured on treated sites of either type.
Therefore, all analyses of site-fidelity examine differences between treated and control
sites without distinguishing between the two types of harvest treatments.
Avian Sampling
Temtorial male Ovenbirds and Hermit Thrushes were actively captured in
mistnets, through taped song and call playbacks and a wooden Ovenbird replica placed
near the net center. Both male and female birds also were captured by 10- 12 mist-nets
placed systematically around each 10 ha research area (or "site"). Unless it was raining
or the weather was unusually cold or windy, nets were open from approximately 0400
EST until 1000 EST each day.
Each site was sampled about once per week from the last week of May until the
first week of August, 1995- 1998. Nets were generally moved 50- 100m to another
location within a site after two or three days of sampling in the same location. On
average, each site was sampled nine times per summer. However, sampling was uneven

in 1995, when only seven of nine sites (all but RA7 and RA8) were sampled. For these
seven sites sampling effort varied from 4-21 mornings of sampling per site, with an
average (+.standard deviation) of 11.7 (k6.3) days of sampling per site. From 1996-1998
effort was very similar across all nine sites, with means (standard deviation) of 7.7
(&SO), 9.1 (&.33), and 8.3 (a .50) days of sampling per site per summer in 1996-1998,
respectively. Over four years, sampling effort averaged nearly 4,000 net-hours per year,
with an average of 250 birds (of all species) captured per year (Table 2.1).
To better understand whether 10-ha sites were small relative to typical breeding
dispersal distances, and to determine how many birds may have escaped recapture by
dispersing outside of sites, I used tape-playbacks and mistnets to capture males in a 100-
m buffer around each site in 1997 and 1998. Beginning in early July, two observers
would spend one or two consecutive days sampling around the perimeter of each research
area. At 150-m intervals along the perimeter, observers would walk 100 m in a direction
perpendicular to the site boundary and set up one rnistnet and Ovenbird decoy. To attract
territorial males, taped songs and calls were played for ten minutes, or longer if birds
were observed near the net. In 1997 and 1998 (combined) a total of 17 male and four
female Hermit Thrushes and 11 male and three female Ovenbirds (plus one Ovenbird of
unknown sex) were captured in buffers outside of 10 ha sites. Three of the 17 male
Hermit Thrushes captured in 1997 were recaptured in the same buffer in 1998, as was one
male Ovenbird. The sample of birds captured in buffers outside sites were considered as
part of the total number of captures (see Table 2. l), but were excluded from all other
totals and analyses presented below.

Table 2.1. Mistnet effort and number of captures per year. Net hours equals number of nets times number of hours each net open. Total bird captures represents all species pooled, and includes all research areas.
YEAR
Net hours 4,893 3,248 3,791 3,973 1 5,905
Total bird captures 254 227 243 27 8 1,002
Hermit Thrush (new) captures: 38 28 5 5 43 164 Recaptures: 0 17 17 23 57* Total Hermit Thrush captures: 38 45 72 66 221*
Ovenbird (new) captures: 25 39 43 19 126 Recaptures: 0 5 12 14 31* Total Ovenbird captures: 25 44 5 5 33 157*
*Some individuals were recaptured in 22 years, so these totals include birds counted more than once. Total numbers of individuals recaptured on sites were 40 (Hermit Thrush) and 25 (Ovenbird), plus four and one, respectively, in buffers. - - -
All adult birds captured were given a uniquely numbered, aluminum U.S. Fish
and Wildlife Service (USFWS) band on their right leg, and three color bands: two on
their left leg and one on their right leg, above the USFWS band. For each capture and all
subsequent observations of a marked bird, the method of recapture was noted as was the
exact location. Recapture methods included passive mist-netting, active mist-netting
with playbacks, or making visual observations while conducting territory mapping or
travelling through sites. Observed locations were listed as a bearing and distance to the
nearest survey pin, which were spaced every 25m along parallel FEW transect lines (50
m apart) in each site.

Analyses
All analyses were done separately for male and female Hermit Thrushes and
Ovenbirds. As mentioned above, numbers of birds of either species captured on any
given site or treatment was small, so I pooled birds from the 10-30 and 20-10 harvest
treatments and thus compared treated versus control sites in all analyses. Tests for
differences in capture rates by age were not significant (see below), so all adult (i.e., after
hatch year) birds were pooled regardless of age. Year-effects in site-attachment data (see
below) were not significant, and sample sizes of recaptures within each year were small,
so I also pooled observations from across all years in all analyses below.
My reliance on song playbacks to facilitate captures biased my sample such that
more than twice as many males as females were captured and color-marked. Females
comprised 32.9% and 33.3%, respectively, of the 143 Hermit Thrushes and 11 1
Ovenbirds captured inside site boundaries and 3 1.1 % and 3 1.7% of the total samples of
164 and 126 birds, respectively. Females of these species comprised only 25% and 28%
of the respective 40 and 25 birds that were recaptured in later years. Whereas 31.3% and
24.3% of all male Hermit Thrushes and Ovenbirds captured on a site were recaptured in , another year, only 21.3% and 18.9% of respective females were. Further, males were
more likely than females to be recaptured in multiple years (see Results). Because of this
sex-biased sampling and the sex-related differences in site-fidelity reported elsewhere
(Greenwood and Harvey 1982), I conducted all analyses for males and females
separately. When sample sizes for females were prohibitively small, only data for males
are presented.

The primary focus of analyses was to determine whether site-fidelity differed
between birds captured on disturbed (i.e., treated) versus control sites. This was
accomplished by analyzing two sets of variables: 1) numbers and proportions of marked
birds that were recaptured at least one year after their initial capture, and 2) site-
attachment distances. A third set of analyses focused on estimating survival and
recapture rates using the capture-mark-recapture data for male birds.
Return Rates
I used 2 x 2 contingency tables to examine whether similar proportions of birds
captured in year "t" were recaptured (on any site) in year "t+l," with separate tables that
grouped birds according to sex, age, and treatment status. Because some birds were
recaptured in multiple years, and treatments were imposed over time, observations of
individual birds in multiple periods (e.g., 1995- 1996, versus 1997- 1998) were treated as
independent observations for most analyses. This allowed for individual bird's responses
(e.g., return status or site attachment distance) to be measured once if their site was a
control, and again later after the site was treated.
To examine whether recapture rates differed by sex, males and females were
compared in terms of numbers of birds that were recaptured (on any site) versus numbers
of birds that were never recaptured (Table 2.2A). This analysis was refined further by
focusing on the subset of birds that were recaptured, and evaluating whether recapture
frequency was independent of sex. I used a 2 x 3 contingency table to compare numbers
of birds 1) recaptured only in the year following initial capture, versus 2) recaptured only
once, but two or three years after the birds' initial capture, versus 3) birds recaptured in at
least two different years after their initial capture (Table 2.2B). Recapture rates were also

compared for the subset of male birds that were reliably aged in the field (Table 2.3). For
this analysis, second-year (SY) birds were compared to after-second-year (ASY) birds;
hatch-year birds and birds of unknown age were not included.
I examined treatment effects on return rates using 2 x 2 contingency tables, with
birds grouped by treatment status (treatment versus control) of the site on which a bird
was initially captured (i.e., in year "t") and whether or not it was recaptured in year "t+19'
(Table 2.4). For the subset of birds that were recaptured at least one year after initial
capture, I used 2 x 2 contingency tables to determine whether dispersal rate was
independent of treatment status (Table 2.5). Birds were grouped by whether they were
recaptured on the same site both in year "t" and year "t+lW, or whether they dispersed
from their capture site in year "t," and were captured on a new site in year "t+l" (Table
2.5A). I also examined the subset of recaptured birds that were originally captured on a
control in year "t," and examined whether dispersal rates differed for birds for which
their capture site was still a control in year "t+l," versus birds on sites that had been
treated between year "t" and year "t+l" (Table 2.5B). The significance of all
contingency tables was determined by Chi-square tests of independence (Zar 1999),
unless the average (for all cells) expected value was ~ 6 . 0 , in which case significance was
determined by Fisher's Exact Test (Zar 1999).
Site-attachment
Exact territory locations for individually-marked birds were difficult to assess, as
birds were usually heard but not seen during territory mapping. Further, capture
locations were often equidistant to one or more mapped territories, and multiple males
frequently responded to tape playbacks. Also, most (72% of Hermit Thrush and 7 1% of

Ovenbird) recaptured birds were caught only once in the year(s) following their initial
capture. Therefore, I calculated site-attachment distances as the distance between the
first capture location in one year and the first capture location in the subsequent year.
This distance was used in all analyses of site-attachment. Note that stronger site-
attachment is indicated by less distance (i.e., less dispersal), and higher distances denote
weaker site-attachment. Only birds captured in two consecutive years were used in
analyses of site-attachment; individuals captured only in the first and third, first and
fourth, or second and fourth years of study were excluded from analyses of site-
attachment.
Site-attachment distances were not normally-distributed, so I examined
differences in site-attachment using Mann-Whitney or Kruskall-Wallis tests (Zar 1999),
with separate tests for male Hermit Thrushes and Ovenbirds. I tested for differences in
site-attachment by sampling period (i.e., 19%- 1996, 1996-1997, or 1997- l998), for birds
captured on treated versus control sites (see below), and between birds captured on the
same site both in year "t" and year "t+lW versus birds that had dispersed to a new site in
year "t+ 1 ."
As expected, site-attachment distances were significantly higher for birds that
dispersed to new sites (see Table 2.6). Because such inter-site movements were rare in
any given year, I restricted my test for yeareffects to birds that remained on the same site
in two consecutive years; those data included 88% of all Hermit Thrush and 77% of all
Ovenbird recaptures. For this same subset of birds (i.e., those remaining on the same site
in consecutive years), I also examined whether site-attachment distances differed by the
treatment status of a bird's capture location, i.e., was the site a control in both years,

treated in both years, or a control in year "t" and then treated by year "t+l"? I also tested
for treatment effects over the entire sample of recaptures, by conducting two separate (but
similar) tests for (1) differences in site-attachment distances for birds on treated versus
control sites in year "t", regardless of their capture location in year "t+l," and (2)
differences between birds recaptured on treated versus control sites in year "t+l,"
regardless of their capture location in year "t" (Table 2.7).
Survival and Recapture Rates
Annual survival and recapture rates were estimated using Cormack-Jolly-Seber
(CJS) models in the software program MARK (White and Burnham 1999). I followed
the approach of Lebreton et al. (1992) and Anderson and Burnham (1 999a) to model
survival and recapture rates. Akeike's Information Criterion (AIC) was used to
distinguish the most parsimonious among all competing models, and determine whether
survival and recapture rates were relatively constant over time, or if they differed across
years (Anderson and Burnham 1999b). MARK was also used to examine goodness of fit
of mark-recapture data, by comparing observed variances with values from 100
bootstrapped simulations of the full model (with both survival and recapture varying by
year) and the best overall model.
Because birds were captured from 1995- 1998, three recapture periods were
examined: 1995- 1996, 1996- 1997, and 1997- 1998. MARK examines capture history
data for each bird in all periods of interest. Recapture probabilities are based on the
proportion of birds captured in any year "t" that are not observed in year "t+l," but are
observed in either year "t+2" or year "t+3." Therefore, only two robust sets of estimates
can be calculated with data from three recapture periods, as there is no information

available for the birds not recaptured in the last period that may still be alive. If either
survival or recapture probabilities are held constant over time, MARK estimates these
rates for the terminal period, though it cannot distinguish between survival versus
recapture in this period.
My sample sizes were small for CJS modeling (Table 2.1); consequently,
confidence intervals around parameter estimates were broad. When the sample was
divided into subgroups, parameters had even wider confidence intervals, so I had very
low power to detect any differences between groups (e.g., treatments). Further, goodness
of fit tests indicated that when observations were divided into subgroups data were
overdispersed for CJS modeling. Therefore, MARK was not used to test whether
survival or recapture rates differed by age, sex, or treatment. Therefore, males from
treated and control sites were pooled for all survival and recapture modeling. Also,
survival and recapture rates were estimated for males only, as there were not enough data
to robustly model parameters for females separately, and no reason to expect similar rates
for males and females (Greenwood 1980).
RESULTS
Return Rates
Male Hermit Thrushes and Ovenbirds showed a strong tendency to return to the
same site they were originally captured on. Ninety percent of male Hermit Thrush
individuals recaptured (n=30) and 90.9% of all (n=44) recapture events (including
individuals recaptured in multiple years), were on the same site in year "t" and "t+l."
Further, of the three male Hermit Thrushes who moved to a new site, one of those birds
returned its original capture site in year "t+2." If this individual is considered site-

faithful over the long-term, 93.3% of individual males and 95.5% of Hermit Thrush
returns were to the same 10-ha site. Similarly, 94.4% of male Ovenbird individuals
(n=18) and 95.5% of all male Ovenbird recapture events (n=22) were on the same site in
year "t" and "t+l." For both species far fewer females were captured and recaptured, and
site-fidelity was somewhat lower for females than for males. Seven of 10 (70%)
individual female Hennit Thrushes and six of seven (85.7%) individual female Ovenbirds
(and six of eight recapture events) recaptured were site-faithful.
For both Hermit Thrush and Ovenbird, there was no significant difference in
recapture likelihood based on a bird's sex (Table 2.2) or age (Table 2.3). Compared to
females, males of both species appeared more likely to be recaptured two or three years
after their initial capture (Table 2.2B). Of all recaptured males, 40% and 50% of Hennit
Thrushes and Ovenbirds, respectively, were recaptured at least two years after their initial
capture, compared to only 20% and 14% of females recaptured (Table 2.2B); however,
these differences were not statistically significant (p>0.10).
For both Hermit Thrush and Ovenbird, there was no evidence that a bird's
likelihood of recapture depended on whether their initial capture location was a treatment
or a control site (Table 2.4). However, there was evidence that Hermit Thrush rates of
dispersal to new sites were affected by harvest treatments (Table 2.5). Across all
recaptures, male Hennit Thrushes were nearly eight times more likely to disperse to a
new site if they were first captured on a treated versus a control site the previous year (n
= 44, P = 0.097, Table 2.5A). None of 20 male Ovenbirds captured on controls dispersed
to a new site in later years, while one of the two birds captured on a treated site did,
though this difference was not significant (n = 22, P = 0.145, Table 2.5A).

Table 2.2. Recapture rate, by species and sex. Hermit Thrush and Ovenbird tallied separately; for both, data are pooled for all years 1995-1998. Table 2.2A compares the numbers of birds recaptured ("Recap" ) versus not recaptured ("No Recap") at least one year after their initial capture. Table 2.2B focuses on the subset of birds that were recaptured, and compares the number of birds recaptured one year after their initial capture ("l"), birds recaptured only once, but 22 years after their initial capture (i.e., "1 *"), and birds recaptured in 1 2 years (i.e., "2+"). Small cell sizes for Ovenbird (in 2.3B) precluded a statistical test of independence.
A. Hermit Thrush Ovenbird
Recap No Recap Recap No Recap
Male 30 44 Male 18 47 Sex Sex
Female 10 25 Female 7 22
Chi-square (x2 = 1.00) p = 0.32
Chi-square (x2 = 0.0 1 ) p = 0.91
B. Hermit Thrush Ovenbird
Number of Recaptures: Number of Recaptures: 1 l * 2+ 1 l * 2+
Male 18 3 9 Male 9 5 4 Sex
Female 8 2 0 Female 6 0 1
Chi-square (x2 = 4.06) p = 0.13

Table 2.3. Recapture rate by species, age, and sex. Focuses on the subset of captures that were reliably aged, with Hermit Thrush and Ovenbird males and females tallied separately; all data are pooled for all years 1995-1998. "SY indicates second-year birds; "ASY indicates birds 2 1 year older than SY birds. "Recap" indicates numbers of birds captured in year "t" that were recaptured in year "t+l" or later; "No Recap" indicates birds captured only in year "t." Table 2.3A is for males, Table 2.3B is for females.
A. Hermit Thrush (Males) Ovenbird
Recap No Recap Recap No Recav
Age ASY 15 18
Chi-square (x2 = 0.97) p = 0.32
ASY 11 25
Chi-square (x2 = 0.59) p = 0.44
B. Hermit Thrush (Females) Ovenbird
Recap No Recap Recap No Recap
Age ASY 5 14
Chi-square (x2 = 0.001) p = 0.95
SY 2 3
ASY 2 13
Fisher's Exact Test p = 0.50

Table 2.4. Contingency tables of recaptures by treatment for Hennit Thrush and Ovenbird. Tallied separately by species and sex. Data are pooled for all years 1995- 1998. Birds are grouped by the treatment status of the site they were captured on ("Site") in any year "t" and whether they were recaptured ("Recap") in a later year or never recaptured ("Not"). For birds that were recaptured in more than one year, each successive capture-recapture event is treated independently. Therefore the number of birds in the Recap category is larger than the total number of individuals that were recaptured. Birds captured only in 1998 (i.e., with no opportunity for recapture) are excluded from analyses. Table 2.4A is for males; Table 2.4B is for females.
A. Hermit Thrush (Males) Ovenbird
Recap Not Recap Not
Control 32* 36 Site
Treatment 1 2B 8
Chi-square (x2 = 0.58) P = 0.45
Control 20' 41 Site
Treatment 2D 6
Chi-square (x' = 0.001) P = 0.97
B. Hermit Thrush (Females) Ovenbird
Recap Not Recap &t
Control 5 19 Site
Treatment 5 6
Chi-square (x2 = 1.20) P = 0.27
Control 5 21 Site
Treatment 3E 1
Chi-square (X2 = 1.82) P = 0.18
* Represents 26 unique individuals Represents 4 unique individuals
C Represents 17 unique individuals Represents 1 unique individual Represents 2 unique individuals

Table 2.5. Numbers of recaptured male birds remaining on a site versus dispersing to a new ske. Hermit Thrush and Ovenbird tallied separately; for both, data are pooled for all years 1995-1998. Table 2.5A groups birds by the treatment status of their capture site in year "t", and whether they remained on the same site ("Same") or dispersed to a new site ("New") the following year ("t+lW). Table 2.5B groups birds by i.) whether their breeding site in two consecutive years ("Year t-Year t+ln) was a control in both years ("Con-Con") or was a control in one year then treated before the next summer ("Con- Trt"), and ii.) whether they remained on the site or dispersed to a new site the following year. Birds on sites that were treated in year "t" were excluded. P-value is for Chi- square Test of Independence or two-tailed Fisher's Exact Test for equal proportions.
A. Hermit Thrush
Year "t+17' Capture Site:
Same New - - Year "t" Control 31 1 Capture Site: Treatment 9 3
Chi-square (x2 = 2.75) P = 0.097
Hermit Thrush
Year "t+l" Capture Site:
Same New - - Con-Con 18 1
Year t-Year t+l : Con-Trt 13 0
Chi-square (x2 = 0.84) P = 0.85
Ovenbird
Year "t+ln Capture Site:
Same New Control 20 0
Treatment 1 1
Chi-square (x2 = 2.12) P = 0.145
Ovenbird
Year "t+l" Capture Site:
Same New Con-Con 12 0
Con-Trt 8 0
Fisher's Exact Test P = 1.00

An analysis of the subset of birds that were captured on sites in year "t" that were
treated during the following winter showed no tendency to disperse to new sites in year
"t+ 1 ", compared to birds captured on sites that were undisturbed in both years (Table
2.5B). Within this subset of birds, examining those recaptured in >2 years did not reveal
that either Hermit Thrushes or Ovenbirds were more likely to disperse to new sites in
year "t+2" or "t+3."
Sampling efforts in the 100-m buffer around each site resulted in 21 new Hermit
Thrush captures; 12 in 1997 and nine in 1998. Three of the birds captured only in
buffers in 1997 were recaptured in buffers (only) in 1998. Buffer sampling also resulted
in recaptures of seven marked Hermit Thrushes that originally had been marked within an
adjacent research area. Of these, two birds were recaptured only in a buffer, and five
were captured in buffers but also within the boundaries of an adjacent research area in the
same year. Buffer sampling yielded 15 new Ovenbird captures; 12 in 1997 and three in
1998. One of the birds captured in the buffer in 1997 was recaptured in the same location
in 1998. In addition, buffer sampling resulted in captures of 15 Ovenbirds that previously
had been captured and marked within an adjacent research area. Of these, three marked
birds were recaptured only in a buffer. These data indicate that only a small proportion
of birds was likely to avoid recapture by moving short distances into the forest
surrounding each research area.
Site-attachment
The mean site-attachment distance (+standard error) for male Hermit Thrushes
(n=39) was 144.4 (f 12.3) m, with a median distance of 136.5 m (Table 2.6). Female
Hermit Thrushes (n=8) averaged 169.8 (f49.9) m, with a median distance of 113.7 m.

The mean site-attachment distance (k standard error) for all male Ovenbirds (n=16) was
104.2 (k14.6.) m, with a median distance of 93.9 m (Table 2.6). Female Ovenbirds (n=8)
averaged 3 10.0 (k134.9) m, with a median distance of 155.1 m. It should be noted that
the mean for female Ovenbirds is skewed by two birds with unusually large dispersal
distances of 745 m and 1069 m.
The mean distance between capture locations within the same year for Hermit
Thrushes captured >1 time per year (n=33) was 155.3 (k14.1) m, based on an average of
2.49 (M. 13) capture locations per bird per year. The mean distance between capture
locations within the same year for Ovenbirds captured >1 time per year (n=16) was 1 15.1
(k27.2) m, based on an average of 2.38 (M. 13) capture locations per bird per year.
These within-year distances can be thought of as a sort of "sampling error" for basing
territory locations on the first capture of each year. These results suggest that, for both
species, the average distance between territories of successive years was similar to or less
than the average distance birds moved within their home range in the same summer.
Analyses of site-attachment distances did not indicate any significant differences
among years for either Hermit Thrush or Ovenbird (Table 2.7, Test I), based on birds that
were captured on the same site in two consecutive years. Likewise, birds remaining on
the same sites in years "t" and "t+l" showed no apparent difference in site-attachment
whether their site was a control in both years, treated in both years, or a control in year
"t" but treated by year "t+l" (Table 2.7, Test 2). Hermit Thrush site-attachment distances
were significantly higher (p=0.06) for birds that dispersed to a new site, compared to
birds that remained on the same site in two consecutive years (Table 2.7, Test 3);
Ovenbird distances followed the same pattern (Table 2.6), though differences in distance

Table 2.6. Distances between capture locations of successive years. Site-attachment distances (in meters) and sample sizes (in parentheses) for Hermit Thrush and Ovenbird are tallied separately. Only data for male birds are included. Each value below is a mean (and sample size) for a subgroup. Means are reported separately for birds that remained on the same site in both years versus those that moved to a new site. Distances are grouped by the treatment status of a bird's breeding site for the two-year period. Sites were considered controls until they were harvested.
Hermit Thrush
1995- 1996 1996- 1997 1997-1998 All Years Remained on same site:
Year "t"-Year "t+ln Control-Control 136.2 (12) 138.0 (4) 189.8 (2) 142.5 (18) Control-Treatment 211.4 (3) 111.4 (3) 157.6 (2) 160.5 (8) Treatment-Treatment --- 73.0 (2) 115.2 (7) 105.8 (9) All birds on same: 151.2 114.7 136.4 137.2 (35)
Moved to new site: Year "tw-Year "t+lW Control-Control 186.6 (1) --- --- 186.6 (1) Control-Treatment --- --- --- --- Treatment-Treatment --- 287.1 (1) 208.8 (1) 248.0 (2) Treatment-Control --- --- 146.3 (1) 146.3 (1) All birds on new site: 186.6 287.1 177.5 207.2 (4)
AN birds ~ooled: 153.4 (16) 131.9 110) 142.8 (13) 144.4 (391
Ovenbird
1995- 1996 1996- 1997 1997-1998 All Years Remained on same site:
Year "t"-Year "t+lW Control-Control 111.8(2) 115.6 (2) 92.1 (2) 106.5 (6) Control-Treatment 61.7 (1) 96.3 (3) 107.7 (2) 94.3 (6) Treatment-Treatment --- --- 67.9 (1) 67.9 (1) All birds on same: 95.1 104.0 93.5 97.9 (13)
Moved to new site: Year "t"-Year "t+lW Control-Control --- --- --- --- Control-Treatment --- 144.9 (1) --- 144.9 (1) Treatment-Treatment --- --- --- --- Treatment-Control --- --- 124.4 (2) 124.4 (2) All birds on new site: 144.9 124.4 131.2 (3)
All birds pooled: 95.1 (3) 110.8 (6) 102.3 (7) 104.2 (16)

Table 2.7. Summary of statistical test results for differences in site-attachment distances. Data are for males only, due to small sample sizes for females. Hermit Thrushes and Ovenbirds and analyzed separately. Test 1 compared site-attachment distances among years. Test 2 compared distances across treatment groups, based on whether the capture site was a control in both years, treated in both years, or was a control in year "t," but treated in year "t+lW. These first two tests were restricted to birds captured on the same site in two consecutive years. Test 3 compared birds found on the same site in two consecutive years versus birds that dispersed to a new site the second year. Test 4 compared birds captured (in year "t") on control versus treated sites, regardless of capture location in year "t+l." Test 5 compared birds captured (in year "t+l") on control versus treated sites, regardless of capture location in year "t." For the last four tests, data were pooled across all years 1995- 1998. See Appendix C (Tables C1-C5) for complete ANOVA tables and other information regarding these tests.
Hermit Thrush Ovenbird Test for differences in:
Year Kruskal-Wallis statistic:
Site Treatment Status Kruskal-Wallis statistic:
Same vs. New Site Mann-Whitney U statistic:
Year 1 Capture location, Control vs. Treatment Mann-Whitney U statistic:
Year 2 Capture location, Control vs. Treatment Mann-Whitney U statistic:

between the two groups were not statistically significant. Finally, there were no
differences in site-attachment distances between birds captured on treated versus control
sites, regardless of whether their treatment status was examined in either year "t" or in
year "t+l" (Table 2.7, Tests 4 and 5).
Survival and Recapture Rates
The most parsimonious model of Hermit Thrush survival and recapture rates
indicated that survival was time-dependent (i.e., year-specific) and recapture was
constant (model o(t)p(.) AICc = 241 .O, see Appendix C; Table C.6). However, as this
model and the two next-best models (o(t)p(t), o(.)p(.)) differed by only 2-2.6 AICc points,
all these models can be considered reasonable. For male Hermit Thrushes, annual
survival rate estimates (+standard error) ranged from 0.48 (M. 11) to 0.89 (M.15);
recapture rate estimates (*standard error) were 0.619 (M.11) (Table 2.8).
For Ovenbird males, the most parsimonious model was the reduced model &.)p(.),
which was seven times more likely than the next-best model (Appendix C; Table C.6).
Therefore, Ovenbird survival and recapture rates across the three time periods can be
considered to be constant. Annual survival rate (+standard error) was 0.721 (M. 18) for
male Ovenbirds (Table 2.8), with a recapture rate of 0.282 (M. 11).
DISCUSSION
Treatment Effects on Site-Fidelity
Overall, breeding site-fidelity of adult Hermit Thrushes and Ovenbirds was very
high, whether measured by return rates to 10-ha sites or by site-attachment distances.
Average distances between capture locations within a year were very similar to median or
mean site-attachment distances for both Hermit Thrushes and Ovenbirds (Table 2.6).

Table 2.8. Estimated survival (@) and recapture (p) rates. Data are for males only; Hermit Thrush (n=164) and Ovenbird (n=126) are analyzed separately. Standard Error, and Lower and Upper 95% confidence intervals (CI) are included for each estimate. For each separate analysis below survival rates ("@") and recapture rates ("p") could be estimated separately for each recapture interval, or estimated as a constant over all periods, based on the model chosen in Program MARK. See Appendix C, Table C.6 for more detailed output.
Hermit Thrush Males
Parameter Period @ 1995-96 @ 1996-97 @ 1997-98 P Constant
Ovenbird Males
Parameter Period 0 Constant P Constant
Value Std. Error 0.885 0.154 0.477 0.108 0.508 0.125 0.6 19 0.113
Value Std. Error 0.72 1 0.175 0.282 0.107
Lower CI U ~ w r CI 0.285 0.993 0.28 1 0.68 1 0.279 0.733 0.389 0.805
Lower CI U ~ w r CI 0.320 0.934 0.122 0.526
One can safely assume that most bird territories in successive years were separated by
little distance.
Even for research areas that were disturbed by 10% or 20% timber removals in
small gaps, the vast majority of birds (of either species) returned to the site of their initial
capture the following year. However, the proportion of birds that did disperse to new
sites was not independent of treatment. Birds of both species dispersed from treated sites
at somewhat higher rates than they did from controls, although this difference was
marginally significant (p=0.097) only for Hermit Thrushes (Table 2.5). These data
suggest that Hermit Thrushes may be more sensitive than Ovenbirds to this type of
habitat disturbance. Possibly this is because territories for Hermit Thrushes are larger
than for Ovenbirds (Jones and Donovan 1996, Van Horn and Donovan 1994). If birds

avoid having disturbed gaps in their territories, Ovenbirds may be better able to shift their
territory locations and avoid small gaps, whereas Hermit Thrush may require larger
patches that are undisturbed. However, my sample size for Ovenbird recaptures was only
half that of Hermit Thrushes, and only a very small proportion of Ovenbirds was captured
on treated sites (Table 2.5). Given the fact that Ovenbirds tended, like Hermit Thrushes,
to disperse more often from treated sites, there may be little actual difference between
how the birds respond to disturbances like those studied.
Survival and Recapture Rates
Average annual survival rates for both Hermit Thrush and Ovenbird males were
above 0.60 (Table 2.8). However, actual survival rates may have been substantially
higher because of undetected emigrants and the nature of short-duration CJS models.
Each of these issues is discussed separately below.
Undetected Emigrants
CJS models do not distinguish between mortality events and emigration events for
bird that are never resighted (Marshall et al. 2000). Thus, to the extent that the study
population is "open" (i.e., birds survive but emigrate without detection) survival rates are
biased to underestimate true survival. The relatively small size (10 ha) of my research
areas makes it difficult to accurately assess breeding dispersal rates because the typical
distance moved by birds is large relative to the area sampled (Banowclough 1978,
Dieckmann et al. 1999). My research areas varied somewhat in shape (Fig. 1 .I), but
movements >200 m would put most birds outside of my 10-ha research areas (the radius
of a circular 10-ha research area would be 178.4 m). Koenig et al. (1996) estimated that

the probability of detecting a disperser that moves a distance equal to the radius of the
study area is only about 45%.
Twenty percent of Hermit Thrush site-attachment distances (n=50) and 12% of all
Ovenbird movements (n=25) were >200 m. The implications of this are seen, in part, by
the fact that 10% and 2096, respectively, of all recaptures or resighting observations of
these species were on a different research area each year. These movements were
detected only because certain individuals happened to disperse in the direction of an
adjacent research area. Often, similar movements in a different direction likely would
have been missed, because eight research areas were surrounded on at least three sides by
contiguous forest that generally was not sampled, even though seven of nine research
areas were close to other research areas (Fig. 1.1). It is therefore highly unlikely that all
emigration events were detected. This undetected emigration results in biased survival
estimates that are lower than actual survival (Marshall et al. 2000).
Despite the likelihood that some emigration went undetected, I do not believe that
it affected survival estimates profoundly, for four reasons. First, my sample sizes of
marked birds were largest for the set of research areas (i.e., RA 1-6) that were most
closely clustered together (Fig. 1. I), increasing chances that emigrants would be found on
adjacent areas. Second, sampling 100-m buffers around research areas, though not done
intensively, yielded a very small proportion of emigrant birds. Of 3 1 total Hermit Thrush
captures in buffer zones, only two male Hermit Thrushes (6.5% of buffer captures and
5% of all 40 males recaptured) represented emigrants that moved outside of any research
area. Similarly, only three Ovenbirds were known to move outside of any research area,
which represents 9.7% of all captures in buffers (n=3 1) and 12% of all male Ovenbirds

recaptured (n=25). It should be noted, however, that almost all these "emigrants" were
captured within 50 m of the perimeter of the site they were originally captured on, so
from the bird's perspective their territory location had not necessarily moved far between
years. The numbers above do not account for the many birds recaptured in a site adjacent
to the site of their original capture. However, given the proximity of most sites to others,
this kind of emigration resulted from relatively small movements, and the sampling
design allowed for the detection of most of these movements. Also, my comparison of
intra- and inter-year distances between captures indicated that most birds moved no
farther between years than within a year, so most movements were not likely to result in a
bird escaping recapture. Finally, survival rates were quite high (see below), and thus
could not have been grossly underestimated.
CJS and Short-Duration Studies
Another reason to believe that survival rates may have been well above 0.60 was
because CJS model estimates from the first return interval are much higher than 0.60
(Table 2.8), and these estimates may be much more accurate than estimates from later
intervals, due to the short duration of my study. Unless recapture probabilities are close
to unity, survival estimates in CJS models are increased to account for the proportion of
birds in the sample that were likely to have survived without being recaptured. The
extent to which survival rates are raised depends on how many birds captured in year "t"
are missed in year "t+l" but recaptured in a later year. In my study, birds captured in
1995 could have been missed in 1996 and 1997, but resighted in 1998. However, birds
captured in 1996 and 1997, respectively, had one and zero opportunities to be missed and
still be recaptured later. Some birds from these years likely would have turned up alive

given more years of sampling; thus recapture probabilities for these intervals are biased,
and lead to biased (low) survival estimates.
When CJS models considered survival rates as time-period-dependent (see
above), estimates for survival in the first return interval were 0.89 for male Hermit
Thrushes; estimates even higher for the model with time-dependent recapture
probabilities. Similarly, in time-dependent models, male Ovenbird survival in the first
return interval was 0.85. These estimates for both species are much higher than average
survival reported for North American passerines: 0.53 (range 0.29-0.63, Johnson et al.
1997), 0.55 (Martin and Li 1992), and 0.50-0.59 (Rowley and Russell 1991), and are
higher still compared to European passerines (Rowley and Russell 1991, Johnston et al.
1997). In fact my estimates equal or exceed high CJS survival rates reported for two
tropical areas (Rowley and Russell 1991, Johnson et al. 1997).
Jones and Donovan (1996), in their Hermit Thrush species account, report that no
survival estimates are available for this species, though Brown et al. (2000) found that
only 18% of Hermit Thrush returned to the same wintering sites each year. Adult
Ovenbird survival rates (reviewed by Martin and Li 1992) were: 0.526 (n = 38; Savidge
and Davis 1974); 0.543 (n = 38; Hann 1948); and 0.845 (n=20; Roberts 1971). The
variability in these rates may simply reflect the fact that survival rates vary over space
and time across a bird's range. However, the three estimates above (cited by Martin and
Li 1992, Van Horn and Donovan 1994) may be underestimates, and not directly
comparable to mine because they did not use CJS models to estimate survival. Apparent
survival estimates are often biased low (Clobert and Lebreton 1991), unless recapture
probability is nearly 1 .O (Martin et al. 1995). To illustrate this point, 23 of 38 Hermit

Thrushes and nine of 26 Ovenbirds I captured in 1995 were later recaptured. These data
yield apparent survival rates (i.e., number of birds resightedhotal sample captured and
released) of 0.605 and 0.35, respectively, compared to CJS estimates of 0.87 and 0.69,
respectively. The difference stems from the fact that apparent survival assumes a
recapture rate near 1 .O (Martin et al. 1995), whereas in my study rates were much lower,
averaging 0.56 for Hermit Thrushes and 0.34 for Ovenbirds (Table 2.8).
CONCLUSIONS
Regardless of whether a site was a control or experienced experimental removals
of 10% or 20% of mature trees, >90% and 95% of adult male Hermit Thrushes and
Ovenbirds, respectively, remained on the same 10-ha research areas in successive years.
Though based on small sample sizes (i.e., 7-10 birds per species), female site-fidelity was
apparently lower, from 70-85%. Despite overall high site-fidelity, breeding dispersal
rates were somewhat higher from treated versus untreated areas, and this difference was
marginally significant for Hermit Thrushes. Though sample sizes were small, Hermit
Thrushes were nine times more likely to disperse from treated than from control sites.
This increased dispersal may reduce future breeding productivity for the minority of birds
that do move to new areas. Analyses of site-attachment, the distance between territories
of successive years, indicated that most Hermit Thrush and Ovenbird returned to within
one home-range width of their previous breeding location. Site-attachment measures
were similar across years and between treatments. Based on capture-mark-recapture
models, survival rates for male Hermit Thrushes and Ovenbirds, respectively, averaged
0.62 and 0.72, but were as high as 0.89 and 0.87 in the first year of study when estimates

were most accurate; these rates are higher than most reported rates for North American
and European passerines, which typically are <0.55.
LITERATURE CITED
Anderson, D., and K. Burnham. 1999a. General strategies for the analysis of ringing data. Bird Study 46(suppl.):S26 1-270.
Anderson, D., and K. Burnham. 1999b. Understanding information criteria for selection among capture-recapture or ring recovery models. Bird Study 46(suppl.):S 14-2 1.
Barrowclough, G.F. 1978. Sampling bias in dispersal studies based on finite area. Bird- Banding 49:333-341.
Beletsky, L.D., and G.H. Orians. 1987. Territoriality among male red-winged blackbirds. Behavioral Ecology and Sociobiology 20:21-34.
Blondel, J., and R. Pradel. 1989. Is adult survival of the Blue Tit higher in a low fecundity insular population than in a high fecundity mainland one? Pp. 13 1-144 in Population biology of Passerine birds (J. Blondell, A. Gosler, J.-D. Lebreton, and R. McCleery, Eds.). NATO AS1 Series G: Ecological Sciences, Vol. 24. Springer- Verlag, New York.
Brown, D.R., P.C. Stouffer, and C.M. Strong. 2000. Movement and territoriality of wintering hermit thrushes in southeastern Louisiana. Wilson Bulletin 112:347-353.
Clobert, J., and J.-D. Lebreton. 1991. Estimation of demographic parameters in bird populations. Pp. 75-104 in Bird population studies: relevance to conservation and management (C.M. Perrins, J.-D. Lebreton, and G.J.M. Hirons, Eds.). Oxford University Press, New York.
Danchin, E., and E. Cam. 2002. Can non-breeding be a cost of breeding dispersal? Behavioral Ecology and Sociobiology 5 1 : 153-1 63.
Darley, J.A., D.M. Scott, and K.M. Taylor. 1977. Effects of age, sex, and breeding success on site fidelity of Gray Catbirds. Bird-Banding 48: 145-1 5 1.
Dieckmann, U., B. O'Hara, and W. Weisser. 1999. The evolutionary ecology of dispersal. Trends in Evolution and Ecology 14:88-90.
Greenwood, P.J., and P.H. Harvey. 1977. Feeding strategies and dispersal of territorial Passerines: a comparative study of the Blackbird (Turdus merula) and the Greenfinch (Carduelis chloris). Ibis 1 l9:528-53 1.
Greenwood, P.J., and P.H. Harvey. 1982. The natal and breeding dispersal of birds. Annual Review of Ecology and Systematics 13: 1-21.
Hann, H.W. 1948. Longevity of the oven-bird. Bird-Banding l9:5- 12.

Holmes, R.T., and T.W. Sherry. 1992. Site fidelity of migratory warblers in temperate breeding and Neotropical wintering areas: Implications for population dynamics, habitat selection, and conservation. Pp. 563-575 442 in J. M. Hagan III, and D. W. Johnston, eds. Ecology and conservation of Neotropical migrant landbirds. ~mithsonian'Institution Press, Washington, 609 pp.
Johnston, J.P., W.J. Peach, R.D. Gregory, and S.A. White. 1997. Survival rates of tropical and temperate Passerines: a Trinidadian perspective. American Naturalist l50:771-789.
Jones, P.W., and T.M. Donovan. 1996. Hermit thrush (Catharus guttatus). In The birds of North America, no. 261 (A. Poole and F. Gill, Eds.). The Academy of Natural Sciences, Philadelphia, Pennsylvania; The American Ornithologists' Union, Washington, D.C.
Koenig, W.D., D. Van Vuren, and P.N. Hooge. 1996. Detectability, philopatry, and the distribution of dispersal distances in vertebrates. Trends in Evolution and Ecology 12:514-517.
Lebreton, J.D., K.P. Burnham, J. Clobert, and R. Anderson. 1992. Modeling survival and testing biological hypotheses using marked animals: a unified approach with case studies. Ecological Monographs 62:67-118.
Marshall, M.R., R.R. Wilson, and R.J. Cooper. 2000. Estimating survival of Neotropical-Nearctic Migratory Birds: are they dead or just dispersed? Pp. 195- 199 in R. Bonney, D.N. Pashley, R.J. Cooper, and L. Niles, eds. Strategies for bird conservation: the partners in flight planning process; Proceedings of the 3* Partners in Flight Workshop; Oct. 1-5, 1995; Cape May, NJ. Proceedings RMRS- P-16. Ogden, UT. USDA Forest Service, Rocky Mountain Research Station. 281 PP-
Martin, T.E. and P. Li. 1992. Life history traits of open- vs. cavity-nesting birds. Ecology 73579-592.
Martin, T.E., J. Clobert, and D.R. Anderson. 1995. Return rates in studies of life history evolution: are biases large? Journal of Applied Statistics 22:863-875.
O'Connor, R.J. 1985. Behavioural regulation of bird populations: a review of habitat use in relation to migration and residency. Pp. 105-142 in R.M. Sibly and R.H. Smith, eds. Behavioural ecology: ecological consequences of adaptive behaviour. Blackwell Scientific Publications, Boston.
Roberts, J.O.L. 197 1. Survival among some North American wood warblers. Bird- Banding 42: 165- 1 83.

Rowley, I., and E. Russell. 199 1. Demography of Passerines in the temperate southern hemisphere. Pp. 22-44 in C.M. Perrins, J.-D. Lebreton, and G.J.M. Hirons, eds. Bird population studies: relevance to conservation and management. Oxford University Press, New York.
Runkle, J.R. 1985. Disturbance regimes in temperate forests. Pp. 17-33 in S. T. A. Pickett, and P.S. White. The ecology of natural disturbance and patch dynamics. Academic Press, Orlando, FL. 472 pp.
Savidge, I.R., and D.E. Davis. 1974. Survival of some common passerines in a Pennsylvania woodlot. Bird-Banding 45: 152- 155.
Seymour, R.S., A.S. White, and P.G. deMaynadier. 2002. Natural disturbance regimes in northeastern North America--evaluating silvicultural systems using natural scales and frequencies. Forest Ecology and Management 155:357-367.
Slagsvold, T., and J.T. Lifjeld. 1989. Return rates of male Pied Flycatchers: an experimental study manipulating breeding success. Pp. 441 -452 in Population biology of Passerine birds (J. Blondell, A. Gosler, J.-D. Lebreton, and R. McCleery, Eds.). NATO AS1 Series G: Ecological Sciences, Vol. 24. Springer-Verlag, New Y ork.
Van Horn, M.A., and T.M. Donovan. 1994. Ovenbird (Seiurus aurocapillus). In The birds of North America, no. 88 (A. Poole and F. Gill, Eds.). The Academy of Natural Sciences, Philadelphia, Pennsylvania; The American Ornithologists' Union, Washington, D.C.
White, G.C., and K.P. Burnham. 1999. Program MARK: survival estimation from populations of marked animals. Bird Study 46(suppl.):S 120- 139.

Chapter 3
EFFECTS OF RED SQUIRREL (Tamiasciurus hudsonicus) POPULATION
FLUCTUATIONS ON BIRD POPULATIONS
INTRODUCTION
The pine or American red squirrel (Tamiasciurus hudsonicus) is abundant and
conspicuous in conifer and mixed-wood forest ecosystems across northern North
America, the Rocky Mountains, and the Appalachians (Steele 1998). Like many small
mammals, red squirrels experience strong fluctuations in their populations (Erlien and
Tester 1984, Danell et al. 1998, Stevens and Kennedy 1999), and may be somewhat
cyclic (Erlien and Tester 1984, Fryxell et al. 1998). For both the American and Eurasian
red squirrel (Sciurus vulgaris), annual population fluctuations are generally related to
seed supplies of conifer trees (Kemp and Keith 1970, Gurnell 1983, Andrkn and Lemnell
1992, Lurz et al. 2000).
Cone crops are highly variable, and extreme years (when cone crops fail or are
large) have dramatic effects on squirrel populations, causing rapid increases or decreases
in their numbers (Gurnell 1983). For many conifer species, cone crop failures are
proximally cued by weather conditions, and a physiological inability to have two large
crops in succession (Smith 1970, Koenig and Knops 2000). Thus, very large cone crop
(or "masting") years often are preceded and followed by relatively poor cone crops
(Koenig and Knops 2000), a pattern that results in frequent spikes and crashes in squirrel
populations, which occur on a time lag of one-year after food supply peaks or falls
(Danell et al. 1998). There is a great degree of spatial synchrony in cone production

(Kemp and Keith 1970, Sirois 2000, Koenig and Knops 2000), in part because cone
formation is strongly related to weather patterns of the previous year (Gurnell 1983),
which are spatially autocorrelated at a scale similar to that of tree masting (Koenig and
Knops 2000). In response to the spatial synchrony of cone crops, population fluctuations
of the American and Eurasian red squirrel are spatially autocorrelated over hundreds of
thousands of square kilometers (Kemp and Keith 1970, Ranta et al. 1997, Koenig and
Knops 1998). Thus, trophic interactions of red squirrels and other taxa may be
manifested at large geographic scales.
The red squirrel diet consists mostly of conifer seeds when cones are plentiful, but
they frequently consume vertebrate animals (Sullivan 1991, Callahan 1993). Red
squirrels have been reported to kill sparrow-sized birds (Nero 1987, 1993; Sullivan
1991), and to attack birds as large as pileated woodpeckers (Dryocopus pileatus; Rathcke
and Poole 1974) and sharp-shinned hawks (Accipiter striatus; Park 1987). Red squirrels
have long been known to prey on songbird eggs and nestlings (Thoms 1922, Hatt 1929);
Nelson (1918) reported that "each squirrel destroys 200 birds a season," including
practically all species of small songbirds.
Squirrels are frequently the single most important predator of bird nests. Studies
from Maine (Vander Haegen and DeGraaf 1996a), New Hampshire (Holmes et al. 1992,
Sloan et al. 1998), Arizona (Martin 1993), Montana (Tewksbury et al. 1998),
Saskatchewan (Bayne and Hobson 1997a, 1997b), Alberta (Boag et al. 1984), the Yukon,
and Alaska (Sieving and Willson 1998) have shown that more nests are predated by red
squirrels than by any other species. Red squirrels alone can account for >80% of all nest
predation (Martin 1993).

Yearly changes in bird abundance are largely a function of juvenile recruitment
into local breeding populations, and thus are highly correlated with breeding productivity
the previous year (Sherry and Holmes 1992). Therefore, it is logical to assume that red
squirrels exert a strong influence on avian population dynamics, where they are the most
important nest predator. Given the fluctuations typical of squirrel populations (Dane11 et
al. 1998), their influence on birds may be most noticeable during years when squirrel
populations spike or crash, and birds experience relatively high nest predation or nest
success, respectively. Based on the information above, I investigated whether patterns of
population change in birds and squirrels were consistent with the hypothesis that squirrel
populations can influence avian populations at a regional scale, at least in some years.
METHODS
Local Analysis for Maine, 1995-1997
As part of an ongoing research project, nine mature mixed-wood study sites of 10
ha each were selected at the Penobscot Experimental Forest (PEF) in Bradley, Maine and
marked with parallel transects (50 m apart). From 1995-1998, during ten mornings in
June, one of three observers spent approximately two hours walking along each transect
to map bird territories on all sites (Hartley, unpublished manuscript). Red squirrels seen
or heard during bird surveys also were recorded. As squirrel territories in 1995 were
extremely dense and difficult to map accurately, 1 assumed that any squirrels mapped
within 100 m of each other were the same individual, unless multiple individuals were
observed simultaneously. Then I calculated an index of squirrel abundance by summing
observations of individual squirrels during each site visit, which lasted approximately 2
hours. Red squirrel abundance for each site was calculated as the average of ten visits,

and all sites were averaged for an annual abundance index for the PEF. This index is
conservative and underestimates squirrel densities when they are high, at which time the
index is less than half of the number of observations. However, at low densities (e.g.,
during 1996 and 1997) the index likely approaches the true number of squirrels.
Based on high squirrel populations in 1995, and the subsequent crash in 1996,
bird populations were expected to decrease from 1995-1996, and increase from 1996-
1997. Changes in bird and squirrel abundance across all years were compared with a
Kruskal-Wallis test (Zar 1999). Comparisons from year to year were made by examining
overlap in 95% confidence intervals around annual means.
Regional Analysis, 1995-1997
To test whether the patterns seen in Maine were evident at a larger scale, I
examined bird and red squirrel data from across the northeastern U.S. and adjacent
Canadian provinces. I obtained red squirrel population data from as many sources and
years as possible, focusing on overlap among years across locations. I obtained red
squirrel data from five locations: Algonquin Provincial Park, Ontario (Fryxell et al.
1998, and R. Brooks unpublished data), Hubbard Brook, New Hampshire (R. Holmes
unpublished data), Huntington Wildlife Forest, New York (Adirondack Ecological Center
unpublished data), and two sites in Maine (M. Hartley unpublished data, and D. Harrison
unpublished data). Data spanned a 13-year period (1988-2000), though for two sites I
had only four years of data; thus the degree of temporal overlap differs among sites.
Squirrel data were obtained from a variety of survey methods. Track counts were used at
Huntington Wildlife Forest; call counts were used at Hubbard Brook and at the
Penobscot Experimental Forest in Maine (see above). Live trapping was used at

Algonquin Provincial Park (Fryxell et al. 1998) and around Baxter State Park in Maine
(D. Harrison unpublished data). All data were obtained from summer observations,
except for Huntington Forest, where data were obtained in winter (December of previous
year to March) of each year. Squirrel data for each area were examined for normality,
then agreement between locations was tested for all pairs of sites using Pearson or
Spearman correlation coefficients. It was problematic to compare directly data based on
different survey methods and with different units. Therefore, medians were calculated
for data from each location, and red squirrel abundances were expressed as a percentage
of the median value for that location and plotted separately.
To examine patterns of bird population change at a larger scale, and compare
across regions, I used Breeding Bird Survey (BBS) data. Year-to-year changes in
populations of individual bird species were calculated using trend-analysis software
available on the internet (http:llwww.mbr-~wrc.usns.nov/bbs/bbs.html) for BBS data
(Sauer et al. 1999). Initially, species included in this analysis were those found in the
PEF, to enable direct comparisons of bird population changes at a local (see above) and
regional scale. However, some bird species are more likely to be affected by red
squirrels than are others, based on the amount of overlap in typical habitat and
geographic range. Therefore, two groups of birds were constructed, based upon an a
priori determination of whether they were more or less likely to be affected by squirrel
population change. One group consisted of 21 species (see Appendix D) that I expected
to have a stronger relationship with squirrels, as these species are typical of mature
conifer forests (Erlich et al. 1988) and have geographic ranges that overlap strongly with
red squirrels. This group includes some boreal bird species that were rare or absent at the

PEF, which were added to make this group more reflective of a typical northeastern
North American conifer-forest bird community. The second group consisted of 20
species that were common in the PEF, but could be considered as an outgroup because all
species either: 1) are more typical of mature deciduous forests, or 2) have a geographic
range with relatively low overlap with red squirrels. The second criterion arose because
two species were difficult to group. The Northern Parula and Pine Warbler (see
Appendix E for scientific names) have a weak and strong preference for conifer forests,
respectively, but were placed in the outgroup because their continental geographic range
only partially overlaps with the range of red squirrels.
Based on high red squirrel populations observed in 1995, and the subsequent lows
of 1996 (Figures 3.1 and 3.2), I examined whether bird abundances: 1) decreased from
1995 to 1996, and 2) increased from 1996 to 1997. This pattern of change is expected if
high and low squirrel populations (in year n) affect avian recruitment (in year n+l) by
causing low and high avian productivity (in year n), respectively. My goal was to test
whether or not the direction (i.e., increase or decrease) of short-term population change
for the 41 focal species (see Appendix D) was consistent with this pattern, and to see
whether patterns *of change differed between the conifer- and deciduous-forest bird
groups. To do so, I calculated trend estimates (Sauer et al. 1999) for each focal species in
each of the two time periods, and for each of the following eight regions: Maine, New
Hampshire, and Vermont (combined); the Adirondack region of New York; Ontario;
Quebec; New Brunswick; Nova Scotia; BBS stratum 28; and BBS stratum 29. These
last two regions constitute large physiographic strata used by the BBS (Sauer et al. 1999).
Stratum 28 encompasses the "spruce-hardwoods" from Minnesota through the Great

Lakes, northern New England, New Brunswick and Nova Scotia. Stratum 29 comprises
the "closed boreal forest" which stretches from Labrador to Alaska, including much of
Quebec, Ontario, and northwestern Canada.
For each species, period, and region examined, a species' population change was
said to be consistent with the hypothesized pattern (hereafter "fit") if it decreased (from
19%- 1996) or increased (from 1996- 1997) by 25%. Five percent change (in the
direction predicted) was chosen as the threshold level because 295% of species examined
had trend values that were more extreme than this or were in the opposite direction. A
1995 1996 1997 1998
Year Figure 3.1. Abundance of birds and red squirrels in the PEF. Average number of avian territories (bars) and mean red squirrel abundance index (line) for nine sites (10 ha each) in the Penobscot Experimental Forest, Maine, 1995- 1998. Data are from territory mapping over ten visits in June.

Relative Abundance (% of median) A
Figure 3.2. Red squirrel abundance at five locations in northeastern North America. Values for each location are standardized as percentage of the median for that series. Survey methods differed across locations (see Methods). Breaks in lines indicate years with no available data.

species was said to fit a prediction even if its population trend was not statistically
significant, though significance levels of BBS trend analyses are presented for northern
New England (see Appendix D). I chose a small number (i.e., 5%) as the threshold for
change, and included non-significant trends because: 1) the analysis focused on the
number of species showing changes in the same direction (e.g., either positive or
negative), rather than the magnitude of annual change, and 2) relatively small changes
within species, when multiplied over many species, can amount to relatively large
changes in bird communities. High variances (see Appendix D) and a lack of
significance for individual trends in any one-year period were expected because some
species were observed on very few BBS routes, scattered across a large region. Even
globally-declining species can have areas with population declines interspersed by areas
with no change or with population increases (Villard and Maurer 1996).
I used Fisher's Exact Test (Zar 1999) to test whether the proportion of conifer
forest species fitting the hypothesized pattern of population change was greater than the
proportion of deciduous forest birds showing the pattern, testing each region separately
for each of the two periods: 1995-1996 and 1996-1997 (Table 3.2). For a given period,
if test results for group differences were not significant because both groups had >50% of
species showing the expected pattern of change, I used a Binomial Test (Zar 1999) to see
whether the overall proportion of species (for both groups combined) was significantly
greater than 50%. I used a Sign Test (Zar 1999) to meta-analyze data from the six
mutually-exclusive regions and both periods, to determine whether there was an overall
tendency for higher proportions of conifer- versus deciduous-forest species showing the
pattern expected.

Trend-analyses of BBS data are derived from stochastic modeling (Sauer et al.
1999), so values presented (Table 3.2) are not deterministic estimates of population
change. Each time a trend-analysis simulation is re-run with the same input parameters, a
slightly different trend estimate may be produced. However, differences between
multiple runs of simulations that produce trend estimates usually are slight. To examine
whether this variation could have affected my analyses, I selected twenty cases where the
trend in one year was close to the threshold value I used (i.e. 5%), and reran trend
estimate analyses five times. Averaged trend estimates differed from values based on
only one simulation in only 5% of cases. Further, because 95% of all trend estimates
were well above the threshold of 5% change or had an opposite sign (e.g., Table 3. l),
multiple runs of trend estimates were deemed unnecessary.
Local Analysis for Ontario, 1998-2000
During the summer of 1998-2000, birds were surveyed with 12 unlimited-distance
point counts in mature tolerant hardwood forest in the Wilderness Zone of Algonquin
Provincial Park, Ontario (A. Jobes unpublished data). All points were separated by at
least 500 m. Points were visited once per summer during the first two weeks of June; all
counts were completed by 0630 EST. Birds were recorded for ten minutes per point, and
abundance data for all species were pooled into a total count for each point. Abundances
for each year were calculated as the mean of the 12 point counts. Red squirrel data for
Algonquin Provincial Park were obtained from multiple live-trapping grids, with annual
effort averaging over 4,000 trap nights (Fryxell et al. 1998, R. Brooks unpublished data).
In 1999, red squirrel populations in Algonquin (Figures 3.2 and 3.3) were at a 40-year
peak (Fryxell et al. 1998). Therefore, bird populations were expected to decrease from

Table 3.1. Population trends for birds in northern New England. Trends (% change) are for the combined Maine, New Hampshire, and Vermont region, based on Breeding Bird Survey data. Due to red squirrel population changes, birds were expected to decrease from 1995-1996, and to increase from 1996-1997. Species in bold show both patterns. See Appendix D for p-values, number of routes, and variance of trend estimates.
1995-1996 1996-1997 CONIFEROUS SPECIES Trend Trend Olive-sided Flycatcher Yellow-bellied Flycatcher Blue-headed Vireo Gray Jay Boreal Chickadee Red-breasted Nuthatch Brown Creeper Winter Wren Golden-crowned Kinglet Ruby-crowned Kinglet Swainson's Thrush Hermit Thrush Magnolia Warbler Cape May Warbler Blackburnian Warbler Myrtle Warbler Black-throated Green Warbler Bay-breasted Warbler Dark-eyed Junco Purple Finch 38.78* -29.10
Group Median: -21.51 22.25
DECIDUOUS SPECIES Eastern Wood-Pewee Least Flycatcher Great-crested Flycatcher Red-eyed Vireo Warbling Vireo Blue Jay Black-capped Chickadee White-breasted Nuthatch Wood Thrush Veery Northern Parula Black-throated Blue Warbler Pine Warbler Black-and-white Warbler American Redstart Ovenbird Canada Warbler Scarlet Tanager Rose-breasted Grosbeak Brown-headed Cowbird
Group Median: 0.98 -0.604
* denotes 0.10 > p > 0.05; ** denotes 0.0% p > 0.01; *** denotes p-value c 0.01.

Table 3.2. Regional comparison of number of bird species fitting hypothesized patterns of population change. Predictions of population decrease and increase were based on hypothesized effect of red squirrels, and their observed population dynamics over these time periods. Bird population trends were obtained from Breeding Bird Survey data for 1995-97, and are summarized by two habitat groups and eight geographic regions of North America. Each set of values below summarizes a table of trends for 41 focal species (e.g., Table 3.1). Sample sizes were insufficient to estimate trends for some focal species in given regions and years, so totals are not always equal. See Appendix D for species comprising conifer and deciduous groups.
1995- 1996 (Decrease predicted)
# Species # Species Fisher Exact Exact Region Fitting Not Fitting p-value
ME-NH-VT Conifer 12 8 0.171 Deciduous 8 12
Adirondacks, NY Conifer 7 5 0.541 Deciduous 12 7
Quebec Conifer 10 10 0.500 Deciduous 9 11
Ontario Conifer 13 5 0.085 Deciduous 9 11
New Brunswick Conifer 9 7 0.47 1 Deciduous 9 5
Nova Scotia Conifer 10 9 0.500 Deciduous 6 7
1996- 1997 (Increase predicted)
# Species # Species Fisher
Fiains Not Fitting p-value
BBS Stratum 28 (spruce hardwoods) Conifer 10 11 0.308 11 10 0.069 Deciduous 7 13 5 15
BBS Stratum 29 (closed boreal forest) Conifer 11 8 0.085 14 7 0.099 Deciduous 2 7 3 6 .

1999-2000. Changes in bird and squirrel abundances across all years were compared
with a Kruskal-Wallis test (Zar 1999). Comparisons from year to year were made by
examining overlap in 95% confidence intervals around annual means.
Local Analysis for New Brunswick, 1950-1959
From 1947-1962 the "Green River Project" (Canada Agriculture unpublished
report) in New Brunswick sampled insects, birds, mammals, plants, and other taxa on a
series of long-term research plots (Morris et al. 1958). All raw data collected during the
project was tabulated each year in a series of unpublished, archived, annual reports
(Canada Agriculture unpublished report). Birds were surveyed annually by mapping
territories over 3-5 visits to each plot from 1947-1959. Long term bird data are available
for only three plots: G2 (1947-1954), G4 (1948-1962) and K1 (1953-1962). Plot sizes
were 8 ha, 8.8 ha, and 7.7 ha, respectively.
Red squirrel abundance data were collected during most years of the Green River
project, though data were based on different survey methods. The first method (hereafter
"squirrel survey 1") was a tally of all animals observed from a car or on foot (and total
distance traveled) during daily travel throughout the study area each month, and is
presented as the number of miles (1.6 km) traveled per animal (of each species) observed.
Data for squirrel survey 1 was available for 1948 to 1954, and surveys from a car versus
on foot were tallied separately. I took the inverse of the original values to get numbers of
animals observed per 1.6 km. Values from surveys on foot and by car were highly
correlated (r=0.96), but approximately 100 times more observations were collected by
observers on foot. Therefore, I considered only the data from surveys on foot.

Year Figure 3.3. Abundance of birds and red squirrels at Algonquin Provincial Park, Ontario, 1998-2000. Average bird (bars) abundance (A. Jobes unpublished data) based on 12 unlimited-distance point counts surveyed once each summer in a wilderness zone. Red squirrel abundance (line) based on live-trapping at multiple transects across the park (Fryxell et al. 1998, R. Brooks unpublished data).
The second method was to count squirrels observed during avian territory
mapping (hereafter "squirrel survey 2"). Squirrel survey 2 estimated squirrel populations
by a modified version of the 'King Method' (Canada Agriculture 1953, unpublished
report), as follows: P=AZ/XY, where: P = total population on area censused; A = total
area of tract; Z = number of squirrels observed; X = distance walked by observer; Y =
twice the average flushing distance, averaged over all years. During three years (1 95 1 -
1953) there is overlap between coverage by the two different squirrel survey methods, so
data can be directly compared between squirrel survey 1 and 2. The correlation for these
years was extremely high ( d . 9 9 4 ) and the magnitude of values was strikingly similar,
so I plotted data from both surveys on the same graph (Fig. 3.4) and axes.

Year
1.6 - 1.4-
t m 0 1.2- E a
Figure 3.4. Spruce budworm (A), bird (B), and red squirrel (C) population changes from 1949- 1959 in Green River, New Brunswick. Some data reproduced from Moms et al. (1 958).
Red squinel data 2
$ 1.0- - !! 0.8 - .- a 0- a 0.6 - u Q)
K 0.4 -
0.2 -
0.0 I I /
1950 1%2 1 954 1956 1958

Annual reports from Green River (Canada Agriculture unpublished data)
indicated only two years with abundant cone crops (1950 and 1956), both of which
triggered a spike (in 195 1 and 1957) and subsequent crash (in 1952 and 1958) in red
squirrel populations. Therefore, I examined bird population changes around these two
time periods. I expected a decrease in bird abundance from 195 1 - 1952, followed by an
increase from 1952- 1953. I also expected birds to decrease from 1957-1958, and
increase from 1958-1959. Changes in bird abundance across all years were compared
with a Kruskal-Wallis test (Zar 1999). Comparisons from year to year were made by
examining overlap in 95% confidence intervals around annual means. To determine
whether data from all years generally fit the pattern hypothesized, I used Fisher's Exact
Test (Zar 1999) to examine whether changes in bird populations were independent of
squirrel populations. The outcome of each change in bird populations (i.e., increase or
decrease) from year n to year n + l was tallied in a 2x2 contingency table according to
whether squirrel populations in the previous year (i.e., in year n) were high (i.e., above
mean and median level) or low. For this test, bird populations (which were never equal)
were said to increase or decrease regardless of whether changes were significant or of a
large magnitude.
RESULTS
Local Analysis for Maine, 1995-1997
At the Penobscot Experimental Forest (PEF), red squirrel abundance indices from
1995-1998 differed significantly among years (Kruskal-Wallis, p=0.0001), with each year
significantly different from all other years (Fig. 3.1). Squirrel populations in the PEF
were at a four-year high in 1995, reaching 300% of the site median. This mirrored a

spike in red squirrel populations seen in northern Maine, New Hampshire, and New
York, where populations reached 400-800% of median levels (Fig. 3.2). In 1996, red
squirrel populations crashed to near zero in the PEF (Fig. ). During 90 visits
(approximately 2 hours each) to nine 10-ha sites, red squirrels were observed on only 12
visits. This population crash was also apparent at other sites in northern New England
and in the Adirondacks (Fig. 3.2).
Bird abundance in the PEF (Fig. 3.1) differed significantly across all years, from
1995-1998 (Kruskal-Wallis, p = 0.0001). Examining overlap of 95% confidence
intervals around mean abundance values showed that 1996was significantly lower than
any other year, and 1997 was significantly higher. Averaged across all sites, bird
abundance decreased by 17% from 1995- 1996, and increased by 45% from 1996- 1997.
Despite significant year-to-year fluctuations, overall bird abundance was very similar in
1995 and 1998 (Fig. 3.1). Avian productivity data were not collected in this study, so I
could not relate avian population changes to changing rates of nest predation or
recruitment. However, in 1995, we repeatedly observed red squirrels attempting to prey
on songbirds caught in mist nets, and at least four birds were killed by squirrels. In each
case the bird's head was removed or the back of the bird7s neck was bitten. Squirrels
were not observed preying on birds in nets during any other year, despite increases in
effort (i.e., mist-net hours) every year after 1995.
Regional Analysis, 1995-1997
Red Squirrels
Most of the locations examined showed similar (and synchronous) fluctuations in
red squirrel populations (Fig. 3.2), despite the fact that data were obtained from a variety

of survey methods, forest types, plot sizes, and numbers of replicates. Data from
Hubbard Brook in New Hampshire and Huntington Wildlife Forest in New York were
significantly correlated across all years (Spearman Coefficient = 0.68, p = 0.02). Pair-
wise Pearson correlations between the PEF and Hubbard Brook (1=0.93), Huntington
Forest (F0.87), and Baxter (F0.91) were high, but were not statistically significant (0.07
< p < 0.13). For 1984- 1995, data from Huntington Wildlife Forest and Algonquin
Provincial Park in Ontario (Fryxell et al. 1998) are significantly correlated (Pearson
Coefficient = 0.8 1, p = 0.05), but when data for 1996-2000 were later added, the long-
term correlations were not significant.
In assessing spatial autocorrelation from distant sites, Koenig and Knops (1998)
stressed that similarities in absolute numbers of animals are less important than whether
relatively large and small populations occur at the same time. In this sense, there is
strong agreement among most of the data. From 1988 to 1998 all study areas but
Hubbard Brook reached their highest red squirrel populations during 1995 (Fig. 3.2). For
Hubbard Brook, the second highest population was recorded in 1995. Similarly, squirrel
populations were very low at four of five sites in 1996, remaining high only at Algonquin
Provincial Park (Fig. 3.2). Other important similarities among the data include the fact
that 1989 and 1999 had very high red squirrel abundances across most of the region,
whereas 1991 and 1994 had populations were well below medians at all sites.
Birds
For the combined region of Maine, New Hampshire, and Vermont, BBS data
showed that 60% of conifer forest species decreased from 1995- 1996, and 80% of species
increased from 1996- 1997 (Table 3.1). In comparison, only 40% of deciduous forest

species decreased and 30% increased during the same periods. Fisher's Exact Tests that
compared conifer and deciduous forest groups were significant only for 1996-1997,
however (Table 3.2). Notably, 12 of the conifer forest species fit predictions in both sets
of years examined, whereas only three deciduous forest birds fit predictions in both
periods (Table 3.l), a significant difference (Chi-squared test, p = 0.003).
The larger region that includes areas adjacent to northern New England showed
similar but somewhat weaker patterns (Table 3.2). Fisher's Exact Tests comparing
whether more conifer- versus deciduous-forest bird species fit the hypothesized pattern of
population change were only marginally significant, and only in a few regions (Table
3.2). A meta-analysis of all mutually-exclusive regions and both years examined showed
that, overall, a greater proportion of conifer-forest bird species fit the hypothesized
pattern compared to deciduous-forest species (Sign test, p = 0.0193). For these six
regions, an average of 58% of conifer forest species showed population change consistent
with the hypothesis, versus 46% of deciduous forest species. At the largest scale, the two
BBS strata (comprised in part by the regions above) averaged 56% of conifer forest birds
showing the expected pattern, compared to only 33% of deciduous forest birds. In only
one region (Adirondacks) did deciduous forest birds have a higher proportion of species
show the hypothesized pattern in both years (mean = 55% compared to 50% of conifer-
forest species).
In contrast to the analyses above that focused on how many species in each region
showed patterns of population change consistent with the hypothesis, I also examined
BBS trend data to see if some species showed similar patterns across several regions. I
tabulated the regions for which each species fit the hypothesized pattern of change in

both 1995- 1996 and 1996- 1997 (Table 3.3). Eleven conifer-forest species fit the
expected pattern in several (23) regions (Table 3.3), compared to only five deciduous-
forest species. Also, this subset of 11 species exhibited the pattern in more areas (mean =
4.9 regionslspecies) on average than did the five deciduous forest species (mean = 3.6
regionslspecies). The geopolitical regions examined in this analysis are dissimilar in size,
which complicates regional comparisons. Of the eleven conifer-forest species included in
Table 3.3, there was a tendency for more species to show the expected pattern of change
in larger regions, e.g., northern New England (9 species), Quebec (n = 9 spp.), Ontario (n
= 7 spp.), and stratum 29 (n = 9 spp.), as compared to smaller regions examined, e.g.,
New Brunswick (n = 5 spp.), Nova Scotia (n = 5 spp.), New York (n = 4 spp.).
Local Analysis for Ontario, 1998-2000
Red squirrel populations in Algonquin reached a peak in 1999 that was higher than in
any year of the previous four decades (Fig. 3.2). Though squirrel numbers in 1998 were
approximately 500% of the Algonquin median, they were only about half as large as in
1999. In 2000, squirrel populations had crashed to below the median. Bird abundance at
12 point counts in Algonquin Provincial Park (A. Jobes unpublished data) differed
significantly from 1998-2000 (p=0.032), though 95% confidence intervals for each year
did overlap (Fig. 3.3). Averaging across points, abundances increased by 30.4% from
1998- 1999 and decreased by 19.5% from 1999-2000. Therefore, bird abundances
changed significantly over time and were consistent with the hypothesis, but differences
between years were not significant.

Table 3.3. Bird species fitting hypothesized pattern of population changes. Species listed fit predictions during both periods of interest (i.e., 1995-96 and 1996-97), in three or more regions, based on analyses of Breeding Bird Survey data. Region abbreviations are as follows: NE = northern New England (Maine, New Hampshire and Vermont combined); QC = Quebec; ON = Ontario; NB = New Brunswick; NS = Nova Scotia; NY = Adirondack Region, New York (BBS physiographic stratum 26); 28 = BBS physiographic stratum 28 (transitional spruce hardwoods); 29 = BBS physiographic stratum 29 (closed boreal forest). See Appendix E for scientific names.
Conifer forest groupa (n=21 species)
Species Regions where predicted att terns fit Winter wren NE QC 28 29 Red-breasted nuthatch NE QC Hermit thrush NE QC Ruby-crowned kinglet NE QC Myrtle warbler Qc Golden-crowned kinglet NE QC Blue-headed vireo NE QC Cape May warbler NE QC Yellow-bellied flycatcher NE Dark-eyed junco NE Purple finch Qc
Deciduous forest groupb (n=20 species)
Species Regions where predicted patterns fit American redstart QC ON NB 28 29 veery NE NB NS NY Least flycatcher NE NB NS Eastern wood-pewee Qc NS NY Northern parula QC ON NS
aSpecies that are characteristic of conifer forests and have a geographic range that overlaps strongly with the range of the red squirrel b~pecies that are characteristic of deciduous forest, as well as two conifer-forest species placed in this group because their geographic range does not overlap strongly with the range of the red squirrel.

Local Analysis for New Brunswick, 1949-1959
The abundance of red squirrels and (Fig. 3.4) in Green River, New Brunswick
changed significantly (p=0.001) over the 11 years examined. Red squirrel populations
spiked in 195 1 and 1957 (Fig. 3.4), in response to cone masting in 1950 and 1956. One
year after each spike in squirrel numbers (i.e., in 1952 and 1958), bird abundance
decreased by an average of 27% and 5 1 %, respectively, though the 195 1- 1952 decrease
was not significant. One year after each population spike, red squirrel numbers crashed
to relatively low levels. Consistent with the hypothesized pattern in both cases, bird
abundance was significantly higher one year later, with average abundance increases of
53% in 1953 and 76% in 1959. In nine of the 10 annual periods examined (Fig. 3.4),
changes in bird abundance were consistent with the hypothesis, and were not independent
of squirrel populations (Fisher's Exact Test, p = 0.048). It should be noted that for some
years the observed changes in bird abundance were small, and only half of all year-to-
year changes were statistically significant. However, with a sample size of only two plots
in most years (n=3 plots for 2 of 11 years), and high variance between plots, statistical
power to detect differences was very low.
DISCUSSION
Koenig and Knops (2000) stated that "the geographical patterns of annual seed
production by forest trees have far-reaching effects on ecosystem function and
biodiversity that have only begun to be explored." This paper demonstrates that local
populations of red squirrels and birds at an experimental forest in Maine showed strong
patterns of change from 1995-1997 (Fig. 3.2), consistent with the hypothesis that a spike
and subsequent crash in squirrel populations caused a respective decrease and increase in

bird numbers the following year(s). An examination of BBS data and red squirrel data
showed the same patterns at a regional scale, for the combined states of Maine, New
Hampshire, and Vermont. This pattern weakened somewhat at increased distance from
northern New England. Other studies of spatial autocorrelation in ecological phenomena
have shown a similar dampening of effects with increased distance (Koenig 1999, Koenig
and Knops 2000).
In northern New England, most conifer-forest bird species examined fit the
hypothesized pattern of change in both 1995-1996 and 1996-1997, whereas most
deciduous forest species did not follow the same pattern. Averaging over both periods,
the same was true for 6 of 7 adjacent (or larger-scale) regions, especially for the largest
regions examined (e.g., Quebec and BBS stratum 29). However, some states and
provinces adjacent to northern New England showed weak, inconsistent, or contrasting
patterns in some years, and most of the tests for group differences were not significant
(Table 3.2). In a few regions and periods examined, a higher proportion of deciduous-
than conifer-forest birds fit the expected pattern; or both deciduous- and conifer-forest
groups had ~ 5 0 % of species showing the pattern.
At least two factors could act to diminish differences between conifer- and deciduous-
forest bird groups. During years when their populations are high, red squirrels may be
widespread across much of a region, including deciduous forest habitats (e.g. Rusch and
Reeder 1978). Indeed, much of the red squirrel data in Fig. 3.1 (i.e., from Algonquin,
Hubbard Brook, and Huntington Forest) was obtained from primarily deciduous,
"northern hardwood" forests. Avian productivity is affected by both nest predation and
food availability, so conifer masting could have positive and negative influences on birds

if it increases both food availability and nest-predator populations. Mast years obviously
provide a food surplus for seed-eating birds, but other species also may benefit. Selb
and Steel (1998) demonstrated that seed masting in trees was associated with an increase
in populations of herbivorous insects, because seed production comes at the expense of
plant chemical defenses. Thus, insect prey for both conifer- and deciduous-forest birds
may increase during mast years, and increased food availability should positively
influence avian productivity. The evidence I examined demonstrates that mast years
usually are followed by decreases in bird populations, indicating that high red squirrel
populations have stronger effects on short-term avian trends than does increased food
availability.
The correlation between squirrel and bird populations does not necessarily imply
causation. The simplest interpretation of the patterns above would be that the same
external factor (e.g., weather) that increased or decreased squirrel abundance in one year
also caused increases or decreases in bird abundance during the same year. However, the
data do not show consistently similar changes in bird and squirrel populations in the same
years. For example, Fig. 3.1 shows that bird abundances in Maine in 1995 and 1998 were
nearly the same, whereas squirrel numbers were very high in 1995 but were much lower
in 1998. Likewise, the data from New Brunswick (Fig. 3.4) show that when bird
numbers were at their highest, squirrel numbers could be high, intermediate, or low. The
possibility that the same external factors affect birds and squirrels similarly in the same
year also seems unlikely given what we know about squirrel population dynamics and the
time lags involved. Many studies (reviewed in Gurnell 1983) have shown that squirrel
abundance in one year ("t") is strongly linked to cone production the previous year (i.e.,

t-1). However, cone production in t-1 is influenced by weather patterns at least one year
before cone maturity (i.e., t-2), when cones are initiated (Sirois 2000, Koenig and Knops
2000). Thus, squirrel dynamics can be partially explained by weather patterns, but with a
two-year time lag. It is not clear how changes in bird populations could be a result of
weather patterns from two years earlier. Possibly, the same weather patterns that trigger
masting years also result in relatively low or high overwinter survival of resident species,
and their abundance affects the productivity of migrant species during the following
summer. If there is conifer/deciduous habitat segregation between resident and migrant
species, this could account for some of the differences these groups exhibit. The group of
conifer forest birds I examined did have more resident species than did the group of
deciduous forest birds; however migratory species comprised most (i.e., >70%) of both
groups. Given the strong evidence from across North America that red squirrels affect
avian nest predation rates (see below), I believe that the most likely explanation is that
squirrel population fluctuations affected bird populations.
Several studies have suggested or shown strong links between squirrel
populations and avian nest-success rates. McFarland et al. (unpublished manuscript),
working in alpine conifer forests in Vermont, found that red squirrel populations were
relatively high and low every other year because of a biannual pattern of cone production.
Nest success for Bicknell's thrush (Cathrus bicknelli) was inversely proportional to the
abundance of red squirrels, which are the primary nest-predators in the area (McFarland,
pers. comm.). Darveau et al. (1997), working in Quebec for four years, found that the
year with the highest red squirrel densities had the highest artificial nest predation rates.
Studying artificial nests in southeast Alaska and Canada, Sieving and Willson (1998) also

found a strong relationship between red squirrel populations and depredation rates. They
stated that "intraseasonal and especially supra-annual population peaks may amplify
small mammal attack rates to significant levels, with consequences for passerine
population ecology." They concluded that "red squirrels may largely define the
distribution of a process (i-e., nest predation) at the regional landscape scale" (Sieving
and Willson 1998).
I found only one published study that used an experimental approach to examine
the influence of red squirrels on nest-predation rates. Reitsma et al. (1990) found no
difference in artificial nest-predation rates between control plots and plots where squirrels
were removed. Unfortunately, data on red squirrel population levels (e.g., Fig. 3.1) were
not available for 1987, the year that field work was done by Reitsma et al. (1990).
Because of the dramatic fluctuations that are common for red squirrel populations, it
seems impractical to assess the role of squirrels as nest-predators in a one-year study,
with no context for relative squirrel population levels during that year. In fact, short-term
studies of avian productivity could often be misleading if temporal dynamics in
populations of nest predators are not taken into account. For example, Sloan et al.
(1998), working in the White Mountains of New Hampshire, found that red squirrels
accounted for 5 1 % of artificial nest-predators photographed during 1990, but only 9% in
199 1, when fishers (Martes pennanti) accounted for 74%.
Sloan et al. (1998) emphasized that "the intensity of depredation at birds' nests
varies both spatially and temporally, and the patterns of such variation must be known
both to understand their effects on bird populations and to devise appropriate
conservation and management plans." Constraints on time and finances mean that many

studies of avian nest-predation fail to account for temporal differences in predator
populations. The effects of fluctuating populations of nest predators probably vary
depending on habitat (Rusch and Reeder 1978), their abundance in a given season and
year (Fryxell et al. 1998, Stevens and Kennedy 1999), and the abundance of other nest-
predators (Darveau et al. 1997, King et al. 1998). Avian populations may be
disproportionately affected in years when squirrels are relatively abundant or relatively
rare. It is less obvious how squirrels would influence avian productivity during years
when their populations are at intermediate levels; during those years other factors (e-g.,
food supply) may be more important.
Changes in bird populations have long been noted by ornithologists and attributed
to many ecological factors (e.g., food and weather). Many studies have shown important
links between productivity and population fluctuations of birds, small mammals, and
larger nest predator species (Dunn 1977, King 1983, Bi3y et al. 2001). However, most of
this research has shown that avian productivity relates to small mammal populations
because of "prey switching" by larger predators (e.g., Mustelids or Canids), which prey
on birds more or less as small mammals cycle through low or high densities, respectively.
I believe that bird populations can relate directly to populations of small mammal nest-
predators, without the presence of intermediary species. The fact that small mammals
directly affect avian nest predation rates is not new (e.g., Haskell 1995), but previous
research has not demonstrated a link between population sizes of birds and their small
mammalian predators.
Likewise, researchers who originally collected and analyzed some of the data in
this paper (i.e., New Brunswick data in Fig. 3.4) did not consider the possibility that red

squirrel fluctuations affected birds. Morris et al. (1958) assumed that changes in bird
density were caused by a superabundance of food resulting from a spruce budworm
(Choristoneurafumiferana) outbreak occurring in the region. Morris et al. (1958) found
three bird species that experienced dramatic (e.g., 12-fold) increases in density during the
spruce budworm outbreak. However, an examination of Figure 4 shows that if all species
of birds observed in the research plots are considered, avian abundance seems to be
related more strongly to the abundance of red squirrels than to budworm larvae. Morris
et al. (1958) showed that spruce budworm abundance increased dramatically from 1949
to 195 1, then decreased steadily afterwards, approaching pre-outbreak levels by 1955
(reproduced on Fig. 3.4). Bird abundances are generally higher during the outbreak, but
yearly fluctuations are strong and not obviously linked to budworm density (Fig. 3.4).
For example, budworm density peaked in 195 1, but abundance of all bird species studied
decreased from 195 1 - 1952. I believe that this decrease was caused by high squirrel
densities in 195 1, which reduced avian productivity despite the abundance of budworm
larvae. Even bird species that showed the strongest response to spruce budworm
(MacArthur 1958, Morris 1958) decreased sharply from 1951 to 1952. I speculate that
the positive numeric response that Morris et al. (1958) observed in budworm-associated
birds was enabled or enhanced by the fact that red squirrel populations crashed in 1952
and remained at relatively low levels for two years.
This paper indicates that important patterns in red squirrel nest-predation occur at
greater temporal and spatial scales than previously realized. However, it is not clear how
much red squirrel distributions vary temporally or spatially within or between specific
regions or in deciduous forests nested within a largely conifer forest region. The data in

Fig. 3.1 indicate considerable spatial autocorrelation for red squirrel populations, but are
a relatively crude attempt to address this issue. A good understanding of the spatial and
temporal dynamics of red squirrel populations can only come from comprehensive
sampling that was designed to examine this issue over sufficient spatial and temporal
scales. Red squirrels are vocal and obvious animals, easily sampled by many techniques,
so monitoring their populations is not difficult. One possibility would be for volunteers
to collect red squirrel data in the same fashion that singing birds are counted during the
Breeding Bird Survey. In many regions, annual fluctuations in red squirrel populations
are predictable, as they correspond to changes in conifer cone production (Gurnell 1983).
Cone production is also easy to observe, so any sampling scheme for red squirrel
populations should also include at least an index of the cone crop. If data for red
squirrels and cone crops could be collected across a large geographic area and over many
years, they could be used in conjunction with BBS data to examine the extent to which
bird and squirrel populations are spatially and temporally related. These data could
provide a very strong test of the hypothesis I have outlined, and ultimately may be useful
in predicting and explaining changes in bird populations, even before they occur. In any
case, researchers studying avian breeding biology should try to monitor the abundance of
any potential nest predators (e.g. red squirrels), especially when this information can be
acquired with little additional effort or cost.

LITERATURE CITED
AndrCn, H., and P.-A. Lernnell. 1992. Population fluctuations and habitat selection in the Eurasian red squirrel Sciurus vulgaris. Ecography 15:303-307.
Bayne, E. M., and K. A. Hobson. 1997a. Comparing the effects of landscape fragmentation by forestry and agriculture on predation of artificial nests. Conservation Biology 1 1 : 141 8-1429.
Bayne, E. M., and K. A. Hobson. 1997b. Predation on artificial nests in relation to forest type: contrasting the use of quail and plasticine eggs. Ecography 20:233-239.
Bayne, E. M., and K. A. Hobson. 1998. The effects of habitat fragmentation by forestry and agriculture on the abundance of small mammals in the southern boreal mixedwood forest. Canadian Journal of Zoology 76:62-69.
B&y, J., G. Gauthier, J.-F. Giroux, and E. Korpimai. 200 1. Are goose nesting success and lemming cycles linked? Interplay between nest density and predators. Oikos 93:388-400.
Boag, D. A., S. G. Reebs, and M. A. Schroeder. 1984. Egg loss among spruce grouse inhabiting lodgepole pine forests. Canadian Journal of Zoology 62: 1034-1037.
Callahan, J. R. 1993. Squirrels as predators. Great Basin Naturalist 53: 137-1 44.
Canada Agriculture. 1948-1962. The Green River project annual report. Series of unpublished annual reports for project E. 30.07-6. Forest Biology Laboratory, Fredericton, New Brunswick.
Danell, K., T. Willebrand, and L. Baskin. 1998. Mammalian herbivores in the boreal forests: their numerical fluctuations and use by man. Conservation Ecology [online] 2(2):9
Darveau, M., L. BClanger, J. Huot, E. MClan~on, and S. DeBellefeuille. 1997. Forestry practices and the risk of bird nest predation in a boreal coniferous forest. Ecological Applications 7572-580.
Delin, A. E., and H. AndrCn. 1999. Effects of habitat fragmentation on Eurasian red squirrel (Sciurus vulgaris) in a forested landscape. Landscape Ecology 14:67-72.
Dunn, E. 1977. Predation by weasels (Mustela nivalis) on breeding tits (Parus spp.) in relation to the density of tits and rodents. J. Anim. Ecol. 46:633-652.
Ehrlich, P. R., D. S. Dobkin, and D. Wheye. 1988. The birder's handbook. Simon & Schuster Inc., New York. 785 pp.

Erlien, D. A., and J. R. Tester. 1984. Population ecology of Sciurids in Northwestern Minnesota. Canadian Field-Naturalist 98: 1-6.
Fryxell, J. R., J. B. Falls, E. A. Falls, and R. J. Brooks. 1998. Long-term dynamics of small-mammal populations in Ontario. Ecology 79:2 13-225.
Gurnell, J. 1983. Squirrel numbers and the abundance of tree seeds. Mammalogy Review 13: 133-148.
Hagan, J. M., W. M. Vander Haegen, and P. S. McKinley. 1996. The early development of forest fragmentation effects on birds. Conservation Biology 10: 188-202.
Haskell, D. G. 1995. A reevaluation of the effects of forest fragmentation on rates of bird-nest predation. Conservation Biology 9: 13 16-1 3 18.
Hatt, R. T. 1929. The red squirrel: its life history and habits, with special reference to the Adirondacks of New York and the Harvard Forest. Roosevelt Wild Life Annals 2:ll-145.
Holmes, R. T., T. W. Sherry, P. P. Marra, and K. E. Petit. 1992. Multiple brooding and productivity of a Neotropical migrant, the black-throated blue warbler (Dendroica caerulescens) in an unfragmented temperate forest. Auk 109:321-333.
Kemp, G. A., and L. B. Keith. 1970. Dynamics and regulation of red squirrel (Tamiasciurus hudsonicus) populations. Ecology 5 1:763-779.
King, C. M. 1983. The relationship between beech (Nothofagus sp.) seedfall and populations of mice (Mus musculus), and the demographic and dietary responses of stoats (Mustela eminea), in three New Zealand forests. Journal of Animal Ecology 52:141-166.
King, D. I., C. R. Griffin, and R. M. DeGraaf. 1998. Nest predator distribution among clearcut forest, forest edge and forest interior in an extensively forested landscape. Forest Ecology and Management 104: 15 1 - 156.
Koenig, W. D., and J. M. H. Knops. 1998. Testing for spatial autocorrelation in ecological studies. Ecography 2 1 :423-429.
Koenig, W. D., and J. M. H. Knops. 2000. Patterns of annual seed production by northern hemisphere trees: a global perspective. American Naturalist 15559-69.
Lurz, P. W. W., P. J. Garson, and L. A. Wauters. 2000. Effects of temporal and spatial variations in food supply on the space and habitat use of red squirrels (Sciurus vulgaris L.). Journal of Zoology 25 1 : 167- 178.
MacArthur, R. H. 1958. Population ecology of some warblers of northeastern coniferous forests. Ecology 39599-619.

Martin, T. E. 1987. Artificial nest experiments: effects on nest appearance and type of predator. Condor 89:925-928.
Martin, T. E. 1993. Nest predation and nest sites: New perspectives on old patterns. Bioscience 43523-532.
Millar, J. S. 1970. Variations in fecundity of the red squirrel, Tamiasciurus hudsonicus (Erxleben). Canadian Journal of Zoology 48: 1055- 1058.
Morris, R. F., W. F. Cheshire, C. A. Miller, and D. G. Mott. 1958. The numerical response of avian and mammalian predators during a gradation of the spruce budworm. Ecology 39:487-494.
Nelson, E. W. 19 1 8. Smaller mammals of North America. National Geographic Magazine 33(5):37 1-493.
Nero, R. W. 1987. House sparrow killed by red squirrel. Blue Jay 45: 180- 18 1.
Nero, R. W. 1993. Another red squirrel bird kill. Blue Jay 5 l:2l7-2 18.
Nour, N., E. Matthysen, and A. A. Dhondt. 1993. Artificial nest predation and habitat fragmentation: different trends in bird and mammal predators. Ecography 16: 1 1 1- 116.
Park, J. L. 1987. Red squirrel harasses sharp-shinned hawk. Alberta Naturalist 17: 16.
Ranta, E., V. Kaitala, J. Lindstrom, and E. Helle. 1997. The Moran effect and synchrony in population dynamics. Oikos 78: 1 36- 142.
Rathcke, B. J., and R. W. Poole. 1974. Red squirrel attacks a Pileated Woodpecker. Wilson Bulletin 86:465-466.
Reitsma, L. R., R. T. Holmes, and T. W. Sherry. 1990. Effects of removal of red squirrels, Tamiasciurus hudsonicus, and eastern chipmunks, Tamias striatus, on nest predation in a northern hardwood forest: an artificial nest experiment. Oikos 57:375-380.
Rusch, D. A., and W. G. Reeder. Population ecology of Alberta red squirrels. Ecology 59:400-420.
Sauer, J. R., J. E. Hines, I. Thomas, J. Fallon, and G. Gough. 1999. The North American breeding bird survey, results and analysis 1966-1998. Version 98.1, USGS Patuxent Wildlife Research Center, Laurel, Maryland.
Seitz, L. C., and D. A. Zegers. 1993. An experimental study of nest predation in adjacent deciduous, coniferous and successional habitats. Condor 95:297-304.

Selk, V. and C. Steel. 1998. Large brood sizes of pied flycatcher, sparrowhawk and goshawk in peak microtine years: support for the mast depression hypothesis. Oecologia 1 l6:449-455.
Sherry, T. W., and R. T. Holmes. 1992. Population fluctuations in a long-distance Neotropical migrant: Demographic evidence for the importance of breeding season events in the American Redstart. Pp. 43 1-442 in J. M. Hagan III, and D. W. Johnston, eds. Ecology and conservation of Neotropical migrant landbirds. Srnithsonian Institution Press, Washington, 609 pp.
Sieving, K. E., and M. F. Willson. 1998. Nest predation and avian species diversity in northwestern forest understory. Ecology 79:2391-2402(?).
Sirois, L. 2000. Spatiotemporal variation in black spruce cone and seed crops along a boreal forest - tree line transect. Canadian Journal of Forest Resources 30:900-909.
Sloan, S. S., R. T. Holmes, and T. W. Sherry. 1998. Depredation rates and predators at artificial bird nests in an unfragmented northern hardwoods forest. Journal of Wildlife Management 62529-539.
Smith, C. C. 1970. The coevolution of pine squirrels (Tamiasciurus) and conifers. Ecological Monographs 40:349-37 1.
Steele, M. A. 1998. Tamiasciurus hudsonicus. Mammalian Species No. 586, pp. 1-9. American Society of Mammalogists.
Sullivan, B. D. 199 1. Additional vertebrate prey items of the red squirrel, Tamiasciurus hudsonicus. Canadian Field-Naturalist 105:398-399.
Tewksbury, J. J., S. J. Hejl, and T. E. Martin. 1998. Breeding productivity does not decline with increasing fragmentation in a western landscape. Ecology 79:2890-?
Thoms, C. S. 1922. Are squirrels bird-enemies? Bird Lore 24:207.
Vander Haegen, W. M., and R. M. DeGraaf. 1996a. Predation on artificial nests in forested riparian buffer strips. Journal of Wildlife Management 60:542-550.
Vander Haegen, W. M., and R. M. DeGraaf. 1996b. Predation rates on artificial nests in an industrial forest landscape. Forest Ecology and Management 86: 17 1 - 179.
Zar, J. H. 1999. Biostatistical Analysis, 4' Edition. Prentice Hall, NJ. 929 pp.

BIBLIOGRAPHY
Anderson, D., and K. Burnham. 1999a. General strategies for the analysis of ringing data. Bird Study 46(suppl.):S26 1-270.
Anderson, D., and K. Burnham. 1999b. Understanding information criteria for selection among capture-recapture or ring recovery models. Bird Study 46(suppl.):S 14-21.
Andrh, H., and P.-A. Lemnell. 1992. Population fluctuations and habitat selection in the Eurasian red squirrel Sciurus vulgaris. Ecography 15:303-307.
Annand, E.M., and F.R. Thompson, III. 1997. Forest bird response to regeneration practices in central hardwood forests. Journal of Wildlife Management 61 : 159- 171.
Barrowclough, G.F. 1978. Sampling bias in dispersal studies based on finite area. Bird- Banding 49:333-341.
Bayne, E. M., and K. A. Hobson. 1997a. Comparing the effects of landscape fragmentation by forestry and agriculture on predation of artificial nests. Conservation Biology 1 1 : 14 1 8- 1429.
Bayne, E. M., and K. A. Hobson. 1997b. Predation on artificial nests in relation to forest type: contrasting the use of quail and plasticine eggs. Ecography 20:233-239.
Bayne, E. M., and K. A. Hobson. 1998. The effects of habitat fragmentation by forestry and agriculture on the abundance of small mammals in the southern boreal mixedwood forest. Canadian Journal of Zoology 76:62-69.
Beletsky, L.D., and G.H. Orians. 1987. Territoriality among male red-winged blackbirds. Behavioral Ecology and Sociobiology 20:21-34.
B&y, J., G. Gauthier, J.-F. Giroux, and E. Korpimiiki. 2001. Are goose nesting success and lemming cycles linked? Interplay between nest density and predators. Oikos 93:388-400.
Bird, D.M. 1999. The bird almanac. Key Porter Books Limited, Toronto. 460 pp.
Blake, J.G., J.M. Hanowski, G.J. Niemi, and P.T. Collins. 1994. Annual variation in bird populations of mixed conifer-northern hardwood forests. Condor 96:38 1 - 399.
Blondel, J., and R. Pradel. 1989. Is adult survival of the Blue Tit higher in a low fecundity insular population than in a high fecundity mainland one? Pp. 13 1 - 14.4 in Population biology of Passerine birds (J. Blondell, A. Gosler, J.-D. Lebreton, and R. McCleery, Eds.). NATO AS1 Series G: Ecological Sciences, Vol. 24. Springer-Verlag, New York.
Boag, D. A., S. G. Reebs, and M. A. Schroeder. 1984. Egg loss among spruce grouse inhabiting lodgepole pine forests. Canadian Journal of Zoology 62: 1034-1037.
Brown, D.R., P.C. Stouffer, and C.M. Strong. 2000. Movement and territoriality of wintering hermit thrushes in southeastern Louisiana. Wilson Bulletin 1 12:347- 353.
Buford, E.W., and D.E. Capen. 1999. Abundance and productivity of forest songbirds in a managed, unfragmented landscape in Vermont. Journal of Wildlife Management 63: 1 80- 1 88.
Callahan, J. R. 1993. Squirrels as predators. Great Basin Naturalist 53: 137- 144.
Canada Agriculture. 1948-1962. The Green River project annual report. Series of unpublished annual reports for project E. 30.07-6. Forest Biology Laboratory, Fredericton, New Brunswick.
Clobert, J., and J.-D. Lebreton. 1991. Estimation of demographic parameters in bird populations. Pp. 75- 104 in Bird population studies: relevance to conservation and management (C.M. Perrins, J.-D. Lebreton, and G.J.M. Hirons, Eds.). Oxford University Press, New York.
Danchin, E., and E. Cam. 2002. Can non-breeding be a cost of breeding dispersal? Behavioral Ecology and Sociobiology 5 1: 153-163.
Danell, K., T. Willebrand, and L. Baskin. 1998. Mammalian herbivores in the boreal forests: their numerical fluctuations and use by man. Conservation Ecology [online] 2(2):9
Darley, J.A., D.M. Scott, and K.M. Taylor. 1977. Effects of age, sex, and breeding success on site fidelity of Gray Catbirds. Bird-Banding 48: 145- 15 1.
Darveau, M., L. Btlanger, J. Huot, E. Mklan~on, and S. DeBellefeuille. 1997. Forestry practices and the risk of bird nest predation in a boreal coniferous forest. Ecological Applications 7572-580.
Delin, A. E., and H. Andrtn. 1999. Effects of habitat fragmentation on Eurasian red squirrel (Sciurus vulgaris) in a forested landscape. Landscape Ecology 14:67-72.
Derleth, E.L., D.G. McAuley, and T.J. Dwyer. 1989. Avian community response to small-scale habitat disturbance in Maine. Canadian Journal of Zoology 67:385- 390.
Dieckmann, U., B. O'Hara, and W. Weisser. 1999. The evolutionary ecology of dispersal. Trends in Evolution and Ecology 14:88-90.
Dunn, E. 1977. Predation by weasels (Mustela nivalis) on breeding tits (Parus spp.) in relation to the density of tits and rodents. J. h i m . Ecol. 46:633-652.
Ehrlich, P. R., D. S. Dobkin, and D. Wheye. 1988. The birder's handbook. Simon & Schuster Inc., New York. 785 pp.

Erlien, D. A., and J. R. Tester. 1984. Population ecology of Sciurids in Northwestern Minnesota. Canadian Field-Naturalist 98: 1-6.
Fryxell, J. R., J. B. Falls, E. A. Falls, and R. J. Brooks. 1998. Long-term dynamics of small-mammal populations in Ontario. Ecology 79:2 13-225.
Germaine, S. S., S.H. Vessey, and D.E. Capen. 1997. Effects of small forest openings on the breeding bird community in a Vermont hardwood forest. Condor 99:708- 718.
Gram, W.K., V.L. Sork, R.J. Marquis, R.B. Renken, R.L. Clawson, J. Faaborg, D.K. Fantz, J.Le Corff, J. Lill, and P.A. Porneluzi. 2001. Evaluating the effects of ecosystem management: a case study in a Missouri Ozark forest. Ecological Applications 1 1 : 1667- 1679.
Greenwood, P.J., and P.H. Harvey. 1977. Feeding strategies and dispersal of territorial Passerines: a comparative study of the Blackbird (Turdus merula) and the Greenfinch (Carduelis chloris). Ibis 1 19:528-53 1.
Greenwood, P.J., and P.H. Harvey. 1982. The natal and breeding dispersal of birds. Annual Review of Ecology and Systematics 13: 1-2 1.
Gurnell, J. 1983. Squirrel numbers and the abundance of tree seeds. Mammalogy Review 13: 133-148.
Hagan, J. M., W. M. Vander Haegen, and P. S. McKinley. 1996. The early development of forest fragmentation effects on birds. Conservation Biology 10: 188-202.
Hagan, J.M., P.S. McKinley, A.L. Meehan, and S.L. Grove. 1997. Diversity and abundance of landbirds in a northeastern industrial forest. Journal of Wildlife Management 61:718-735.
Haskell, D. G. 1995. A reevaluation of the effects of forest fragmentation on rates of bird-nest predation. Conservation Biology 9: 13 16- 13 18.
Hatt, R. T. 1929. The red squirrel: its life history and habits, with special reference to the Adirondacks of New York and the Harvard Forest. Roosevelt Wild Life Annals 2: 1 1 - 145.
Holmes, R.T., and T.W. Sherry. 1988. Assessing population trends of New Hampshire forest birds: local vs. regional patterns. Auk 105:756-768.
Holmes, R. T., T. W. Sherry, P. P. Mama, and K. E. Petit. 1992. Multiple brooding and productivity of a Neotropical migrant, the black-throated blue warbler (Dendroica caerulescens) in an unfragrnented temperate forest. Auk 1 OW2 1-333.
Hunter, M.L., Jr. 1990. Wildlife, forests, and forestry: principles of managing for biological diversity. Prentice-Hall, Inc. Englewood Cliffs, NJ. 370 pp.

I.B.C.C.(International Bird Census Committee) 1970. An international standard for a mapping method in bird census work recommended by the I.B.C.C. Audubon Field Notes 24:722-736.
Johnston, J.P., W.J. Peach, R.D. Gregory, and S.A. White. 1997. Survival rates of tropical and temperate Passerines: a Trinidadian perspective. American Naturalist 150:77 1-789.
Jones, P.W., and T.M. Donovan. 1996. Hermit thrush (Catharus guttatus). in The birds of North America, no. 261 (A. Poole and F. Gill, Eds.). The Academy of Natural Sciences, Philadelphia, Pennsylvania; The American Ornithologists' Union, Washington, D.C.
Kemp, G. A., and L. B. Keith. 1970. Dynamics and regulation of red squirrel (Tamiasciurus hudsonicus) populations. Ecology 5 1 :763-779.
King, C. M. 1983. The relationship between beech (Nothofagus sp.) seedfall and populations of mice (Mus musculus), and the demographic and dietary responses of stoats (Mustela ermines), in three New Zealand forests. Journal of Animal Ecology 52: 141-166.
King, D. I., C. R. Griffin, and R. M. DeGraaf. 1998. Nest predator distribution among clearcut forest, forest edge and forest interior in an extensively forested landscape. Forest Ecology and Management 104: 15 1 - 156.
Koenig, W. D., and J. M. H. Knops. 1998. Testing for spatial autocorrelation in ecological studies. Ecography 2 1 :423-429.
Koenig, W. D., and J. M. H. Knops. 2000. Patterns of annual seed production by northern hemisphere trees: a global perspective. American Naturalist 15559-69.
Koenig, W.D., D. Van Vuren, and P.N. Hooge. 1996. Detectability, philopatry, and the distribution of dispersal distances in vertebrates. Trends in Evolution and Ecology 12514-517.
Lebreton, J.D., K.P. Burnham, J. Clobert, and R. Anderson. 1992. Modeling survival and testing biological hypotheses using marked animals: a unified approach with case studies. Ecological Monographs 62:67- 1 18.
Lent, R.L., and D.E. Capen. 1995. Effects of small-scale habitat disturbance on the ecology of breeding birds in a Vermont (USA) hardwood forest. Ecography 18:97-108.
Lorimer, C.G. 1977. The presettlement forest and natural disturbance cycle of northeastern Maine. Ecology 58: 1 39- 148.
Lurz, P. W. W., P. J. Garson, and L. A. Wauters. 2000. Effects of temporal and spatial variations in food supply on the space and habitat use of red squirrels (Sciurus vulgaris L.). Journal of Zoology 25 1 : 167- 178.

Lynch, J.F., and D.F. Whigham. 1984. Effects of forest fragmentation on breeding bird communities in Maryland, USA. Biological Conservation 28:287-324.
MacArthur, R. H. 1958. Population ecology of some warblers of northeastern coniferous forests. Ecology 39599-6 19.
Martin, T. E. 1987. Artificial nest experiments: effects on nest appearance and type of predator. Condor 89:925-928.
Martin, T. E. 1993. Nest predation and nest sites: New perspectives on old patterns. Bioscience 43523-532.
Martin, T.E. and P. Li. 1992. Life history traits of open- vs. cavity-nesting birds. Ecology 73579-592.
Martin, T.E., J. Clobert, and D.R. Anderson. 1995. Return rates in studies of life history evolution: are biases large? Journal of Applied Statistics 22963-875.
McCune, B., and M.J. Mefford. 1997. Multivariate analysis of ecological data. Version 3.09. MjM Software, Gleneden Beach, OR.
Millar, J. S. 1970. Variations in fecundity of the red squirrel, Tamiasciurus hudsonicus (Erxleben). Canadian Journal of Zoology 48: 1055- 1058.
Morris, R. F., W. F. Cheshire, C. A. Miller, and D. G. Mott. 1958. The numerical response of avian and mammalian predators during a gradation of the spruce budworm. Ecology 39:487-494.
Nelson, E. W. 191 8. Smaller mammals of North America. National Geographic Magazine 33(5):37 1-493.
Nero, R. W. 1987. House sparrow killed by red squirrel. Blue Jay 45: 180- 18 1.
Nero, R. W. 1993. Another red squirrel bird kill. Blue Jay 5 l:217-218.
Norton, M.R., and S.J. Hannon. 1997. Songbird response to partial-cut logging in the boreal mixedwood forest of Alberta. Canadian Journal of Forest Research 27:44- 53.
Nour, N., E. Matthysen, and A. A. Dhondt. 1993. Artificial nest predation and habitat fragmentation: different trends in bird and mammal predators. Ecography 16:lll-116.
O'Connor, R.J. 198 1. The influence of observer and analyst efficiency in mapping method censuses. Studies in Avian Biology 6:372-376.
Opdam, P., G. Rijsdijk, and F. Hustings. 1985. Bird communities in small woods in an agricultural landscape: effects of area and isolation. Biological Conservation 34:333-352.
Park, J. L. 1987. Red squirrel harasses sharp-shinned hawk. Alberta Naturalist 17: 16.

Ranta, E., V. Kaitala, J. Lindstrom, and E. Helle. 1997. The Moran effect and synchrony in population dynamics. Oikos 78: 136-142.
Rathcke, B. J., and R. W. Poole. 1974. Red squirrel attacks a Pileated Woodpecker. Wilson Bulletin 86:465-466.
Reitsma, L. R., R. T. Holmes, and T. W. Sherry. 1990. Effects of removal of red squirrels, Tarniasciurus hudsonicus, and eastern chipmunks, Tamias striatus, on nest predation in a northern hardwood forest: an artificial nest experiment. Oikos 57:375-380.
Rowley, I., and E. Russell. 1991. Demography of Passerines in the temperate southern hemisphere. Pp. 22-44 in Bird population studies: relevance to conservation and management (C.M. Perrins, J.-D. Lebreton, and G.J.M. Hirons, Eds.). Oxford University Press, New York.
Rudnicky, T., and M.L. Hunter, Jr. 1993. Reversing the fragmentation perspective: effects of clearcut size on bird species richness in Maine. Ecological Applications 3:357-366.
Runkle, J.R. 1985. Disturbance regimes in temperate forests. Pp. 17-33 in The ecology of natural disturbance and patch dynamics (S. T. A. Pickett, and P.S. White, Eds.). Academic Press, Orlando, FL. 472 pp.
Rusch, D. A., and W. G. Reeder. Population ecology of Alberta red squirrels. Ecology 59:400-420.
Sallabanks, R., and J.M. Manluff. 2000. Forest management and bird populations: an introduction. Wildlife Society Bulletin 28: 1086- 1087.
Sallabanks, R., E.B. Arnett, and J.M. Manluff. 2000. An evaluation of research on the effects of timber harvest on bird populations. Wildlife Society Bulletin 28: 1144- 1 155.
SAS Institute. 1990. SASISTAT user's guide, version 6. SAS Institute, Cary, NC.
Sauer, J. R., J. E. Hines, I. Thomas, J. Fallon, and G. Gough. 1999. The North American breeding bird survey, results and analysis 1966-1998. Version 98.1, USGS Patuxent Wildlife Research Center, Laurel, Maryland.
Seitz, L. C., and D. A. Zegers. 1993. An experimental study of nest predation in adjacent deciduous, coniferous and successional habitats. Condor 95:297-304.
Selk, V., and C. Steel. 1998. Large brood sizes of pied flycatcher, sparrowhawk and goshawk in peak microtine years: support for the mast depression hypothesis. Oecologia 1 16:449-455.
Seymour, R.S., A.S. White, and P.G. deMaynadier. 2002. Natural disturbance regimes in northeastern North America--evaluating silvicultural systems using natural scales and frequencies. Forest Ecology and Management 155:357-367.

Sherry, T. W., and R. T. Holmes. 1992. Population fluctuations in a long-distance Neotropical migrant: Demographic evidence for the importance of breeding season events in the American Redstart. Pp. 431-442 in Ecology and conservation of Neotropical migrant landbirds (J. M. Hagan III, and D. W. Johnston, Eds). Smithsonian Institution Press, Washington, 609 pp.
Sieving, K. E., and M. F. Willson. 1998. Nest predation and avian species diversity in northwestern forest understory. Ecology 79:239 1-2402.
Sirois, L. 2000. Spatiotemporal variation in black spruce cone and seed crops along a boreal forest - tree line transect. Canadian Journal of Forest Resources 30:900- 909.
Slagsvold, T., and J.T. Lifjeld. 1989. Return rates of male Pied Flycatchers: an experimental study manipulating breeding success. Pp. 441-452 in Population biology of Passerine birds (J. Blondell, A. Gosler, J.-D. Lebreton, and R. McCleery, Eds.). NATO AS1 Series G: Ecological Sciences, Vol. 24. Springer- Verlag, New York.
Sloan, S. S., R. T. Holmes, and T. W. Sherry. 1998. Depredation rates and predators at artificial bird nests in an unfragmented northern hardwoods forest. Journal of Wildlife Management 62529-539.
Smith, C. C. 1970. The coevolution of pine squirrels (Tamiasciurus) and conifers. Ecological Monographs 40:349-37 1.
Smith, T.M., and H.H. Shugart. 1987. Territory size variation in the Ovenbird: the role of habitat structure. Ecology 68:695-704.
Sokal, R.R., and F.J. Rohlf. 2000. Biometry. W.H. Freeman and Company, New York. 887 pp.
Steele, M. A. 1998. Tarniasciurus hudsonicus. Mammalian Species No. 586, pp. 1-9. American Society of Mammalogists.
Sullivan, B. D. 1991. Additional vertebrate prey items of the red squirrel, Tamiasciurus hudsonicus. Canadian Field-Naturalist 105398-399.
Tewksbury, J. J., S. J. Hejl, and T. E. Martin. 1998. Breeding productivity does not decline with increasing fragmentation in a western landscape. Ecology 79:2890- 2903.
Thompson, F.R. III, J. D. Brawn, S. Robinson, J. Faaborg, and R.L. Clawson. Approaches to investigate effects of forest management on birds in eastern deciduous forests: How reliable is our knowledge? Wildlife Society Bulletin 28:llll-l122.
Thoms, C. S. 1922. Are squirrels bird-enemies? Bird Lore 24:207

Tittler, R., and S.J. Hannon. 2000. Nest predation in and adjacent to cutblocks with variable tree retention. Forest Ecology and Management 136: 147-157.
Van Horn, M.A., and T.M. Donovan. 1994. Ovenbird (Seiurus aurocapillus). In The birds of North America, no. 88 (A. Poole and F. Gill, Eds.). The Academy of Natural Sciences, Philadelphia, Pennsylvania; The American Ornithologists' Union, Washington, D.C.
Vander Haegen, W. M., and R. M. DeGraaf. 1996a. Predation on artificial nests in forested riparian buffer strips. Journal of Wildlife Management 60542-550.
Vander Haegen, W. M., and R. M. DeGraaf. 1996b. Predation rates on artificial nests in an industrial forest landscape. Forest Ecology and Management 86: 17 1 - 179.
Verner, J., and K.A. Milne. 1990. Analyst and observer variability in density estimates from spot mapping. Condor 92:3 13-325.
Webb, W.L., D.F. Behrend, and B. Saisorn. 1977. Effect of logging on songbird populations in a northern hardwood forest. Wildlife Monographs No. 55. 35 pp.
Welsh, C.J.E., and W.M. Healy. 1993. Effect of even-aged timber management on bird species diversity and composition in northern hardwoods of New Hampshire. Wildlife Society Bulletin 21 : 143- 154.
White, G.C., and K.P. Burnharn. 1999. Program MARK: survival estimation from populations of marked animals. Bird Study 46(suppl.):S 120-1 39.
Zar, J. H. 1999. Biostatistical Analysis, 4th Edition. Prentice Hall, NJ. 929 pp.

APPENDICES

APPENDIX A. Data and Analyses Related to Chapter 1

Table A.1. Abundance of bird territories in 1995. Includes nine (10 ha) research areas (RA) in the Penobscot Experimental Forest, Bradley, Maine. For this year only one research area (i.e., RA 8) was not sampled, so data are not available (na). For scientific nomenclature, see Appendix E.
Common Name
Black-and-white Warbler Blackburnian Warbler B lack-capped Chickadee Black-throated Blue Warbler Black-throated Green Warbler Blue Jay Brown Creeper Brown-headed Cowbird Canada Warbler Eastern Wood Pewee Golden-crowned Kinglet Great-crested Flycatcher Hairy Woodpecker Hennit Thrush Magnolia Warbler Northern Parula Ovenbird Pine Warbler Purple Finch Red-breasted Nuthatch Red-eyed Vireo Ruffed Grouse Scarlet Tanager Blue-headed Vireo Veery Winter Wren Yellow-bellied Sapsucker Yellow-rumped Warbler American Robin Barred Owl Cedar Waxwing Common Yellowthroat Downy Woodpecker Evening Grosbeak Least Flycatcher Mourning Dove Nashville Warbler Northern Flicker Northern Goshawk Northern Waterthrush Pileasted Woodpecker Pine Siskin Ruby-throated Hummingbirds Swainson's Thrush Tennessee Warbler White-throated Sparrow Wood Thrush Species Richness
R A R A R A R A R A R A R A R A R A
6 6 7 . 5 4 6 3 3 n a 3 2.5 2.5 2 2 2 3 3 n a 2 1.5 2 2 2 0 2 2 n a 4
7 6 6 2 4 3 . 5 1 . 5 n a 3 2 2 2 1 2 1 1 n a 1 1 1 2 2 2 1 1 n a 2 O O O O O O l n a 0 O O O O 2 O O n a 5 0 2 2 1 O O O n a 0 2 0 2 2 . 5 4 1 3 n a 1 O O O O O l O n a 0
0.5 0 1 0 0 0 1 n a 0 4 4 3 3 4 3.5 3.5 na 3.5 O O O O l l O n a 3 3 6 5 5 5 6 . 5 6 n a 2
4.5 6.5 4 7 6 5.5 7 na 5 0 0.5 1 0 0 0 1 n a 0 2 O O O O O O n a 0 2 2 3 2 2 2 . 5 1 n a 1 2 7 2 5 1 3 2 . 5 n a 1 O O O O O O O n a 0 1 2 2 1 2 1 2 n a 0 3 2 3 . 5 2 2 3 3 n a 2 O O O 2 O O l n a 1 2 2 2 3 2 1 1 n a 1 1 1 1 0 1 0 1 n a 1 0 0.5 1 1 1 1 2 n a 1 1 O O l O O O n a 0 O O O O O O O n a 0 O O O O O l O n a 0 O O O O O O O n a 1 O O O O O O O n a 0 O O O O O O O n a 0 0 0 0 . 5 0 0 0 O n a 0 O O O O O O O n a 0 O O O O l O O n a 0 O O O O O O O n a 0 O O O O O O O n a 0 O O O 3 O O O n a 0 O O O l l O O n a 0 O O O O O O O n a 0 O O O O O O O n a 0 O O O O O O O n a 0 O O O O l O O n a 0 O O O O O O O n a 0 O O O O O O O n a 0
20 19 21 22 21 20 22 na 21 Total Abundance 48.5 56 54.5 53.5 52 46.5 50.5 na 44.5

Table A.2. Abundance of bird territories in 1996. Includes nine (10 ha) research areas (RA) in the Penobscot Experimental Forest, Bradley, Maine. For scientific nomenclature, see ~ ~ ~ e n d i x E.
Common Name Species RA RA RA RA RA RA RA RA RA Code 1 2 3 4 5 6 7 8 9
Black-and-white Warbler 2 1 1 1 1 2 1 1 1 Blackburnian Warbler Black-capped Chickadee Black-throated Blue Warbler Black-throated Green Warbler Blue Jay Brown Creeper Brown-headed Cowbird Canada Warbler Eastern Wood Pewee Golden-crowned Kinglet Great-crested Flycatcher Hairy Woodpecker Hermit Thrush Magnolia Warbler Northern Parula Ovenbird Pine Warbler Purple Finch Red-breasted Nuthatch Red-eyed Vireo Ruffed Grouse Scarlet Tanager Blue-headed Vireo veery Winter Wren Yellow-bellied Sapsucker Yellow-rumped Warbler American Robin Barred Owl Cedar Waxwing Common Yellowthroat Downy Woodpecker Evening Grosbeak Least Flycatcher Mourning Dove Nashville Warbler Northern Flicker Northern Goshawk Northern Waterthrush Pileasted Woodpecker Pine Siskin Ruby-throated Hummingbirds Swainson's Thrush Tennessee Warbler White-throated Sparrow Wood Thrush Species Richness
IWO
OTH
Total Abundance I 48.5 44.5 39.5 44 41.5 36 36 39.5 45

Table A.3. Abundance of bird territories in 1997. Includes nine (10 ha) research areas (RA) in the Penobscot Experimental Forest, Bradley, Maine. For scientific nomenclature, see ~ ~ ~ e n d i x E. Common Name
Black-and-white Warbler Blackburnian Warbler Black-capped Chickadee Black-throated Blue Warbler Black-throated Green Warbler Blue Jay Brown Creeper Brown-headed Cowbird Canada Warbler Eastern Wood Pewee Golden-crowned Kinglet Great-crested Flycatcher Hairy Woodpecker Hermit Thrush Magnolia Warbler Northern Parula Ovenbird Pine Warbler Purple Finch Red-breasted Nuthatch Red-eyed Vireo Ruffed Grouse Scarlet Tanager Blue-headed Vireo Veery Winter Wren Yellow-bellied Sapsucker Yellow-rumped Warbler American Robin Barred Owl Cedar Waxwing Common Yellowthroat Downy Woodpecker Evening Grosbeak Least Flycatcher Mourning Dove Nashville Warbler Northern Flicker Northern Goshawk Northern Waterthrush Pileasted Woodpecker Pine Siskin Ruby-throated Hummingbirds Swainson's Thrush Tennessee Warbler White-throated Sparrow Wood Thrush Species Richness
R A R A R A R A R A R A R A R A R A 1 2 3 4 5 6 7 8 9
1 2 1 3 2 2 . 5 2 3 2 6 6 6 4 5 6 4 2 7 4 4 3 4 6 4 3 . 5 3 2 . 5 2 3 3 4 2 2 2 2 . 5 3
7.5 7 7 3 2 3 2.5 3 4 1 2 1 1 2 1 1 1 1 3 3 3 2 2 2 3 1 2 0 0 1 1 0 0 1 2 0 0 0 0 . 5 1 2 1 1 0 1 . 5 1 2 1 1 0 0 1 2 1 2 2 2 1 3 2 2 1 2 0 0 0 2 2 1 0 0 0 0 1 0 . 5 2 1 2 0 1.5 1 2 3 3 2 3 2.5 3 2 2.5 0 0 0 0 2 2 0 0 2 3 6 4 6 6 4 5 8 4 . 5 4 6 5.5 5.5 2.5 4 6 4 7 0 0 . 5 0 0 1 1 1 0 1 1 1 1 0 1 1 1 0 1 3 2 4 . 5 2 4 4 3 3 4 4 5 4 4 4 3 3 5 . 5 2 0 0 0 1 1 0 0 1 1 1 1 0 1 0 0 1 1 0 2 2 3 2 2 2 2 2 2 0 0 1 2 1 1 0 2 1 . 5 2 0 1 1 2 1 0 0 0 2 1 1 2 2 1 2 1 2 1 1 2 . 5 1 3 1 1 2 2 1 1 1 0 0 0 0 2 0 0 0 0 0 0 0 0 0 0 0 0 0 0 0 0 0 0 0 0 0 0 0 0 0 0 0 0 0 0 0 0 0 0 0 0 0 0 0 0 1 1 0 0 0 0 0 0 0 0 0 0 0 5 0 . 5 0 0 0 0 1 0 0 0 1 0 0 . 5 0 0 1 1 0 0 0 0 0 0 0 0 0 0 0 0 0 0 0 0 0 0 0 0 0 0 0 0 0 1 0 0 0 0 0 0 0 . 5 1 0 0 0 0 1 0 0 0 0 0 0 0 0 0 0 0 0 0 0 0 0 0 0 0 0 0 0 0 0 1 0 0 0 0 0 0 1 0 0 0 0 1 0 0 0 0 1 0 0 0 0 0 0 0 0 0 0 1 0
22 23 25 27 30 26 23 25 27 Total Abundance I 54.5 62 61 60.5 68.5 56 5261 .5 62
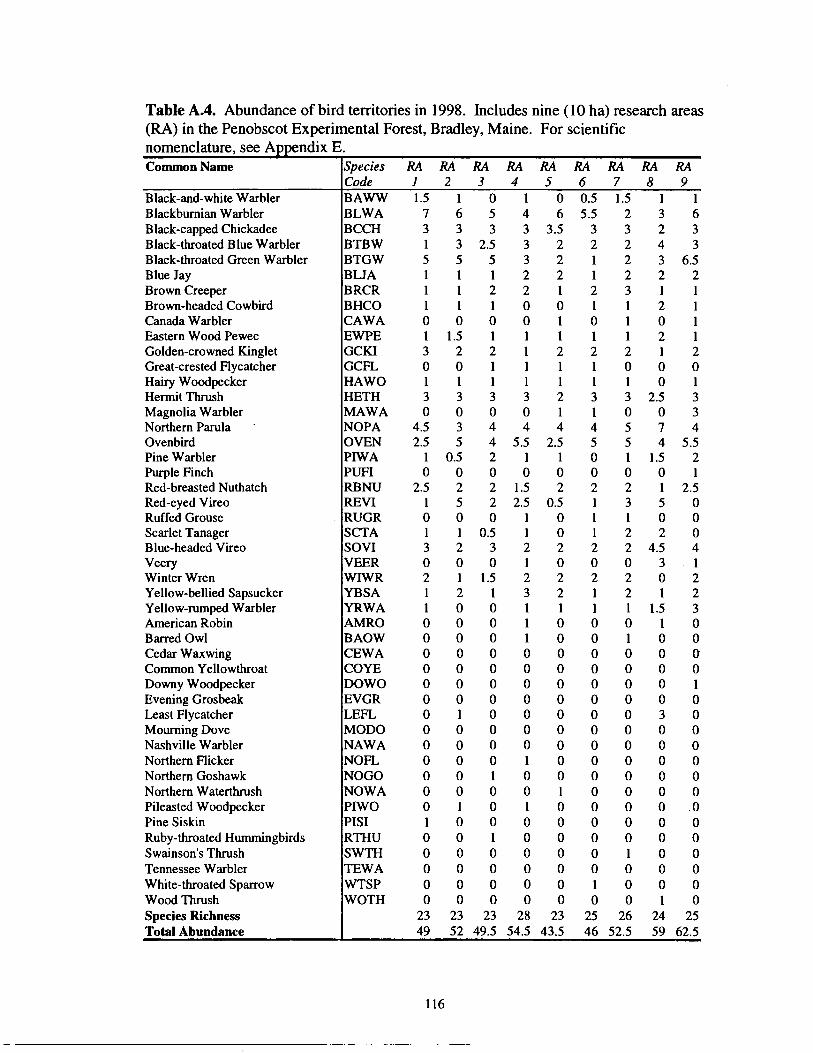
Table A.4. Abundance of bird territories in 1998. Includes nine (10 ha) research areas (RA) in the Penobscot Experimental Forest, Bradley, Maine. For scientific
Black-and-white Warbler Blackburnian Warbler Black-capped Chickadee Black-throated Blue Warbler Black-throated Green Warbler Blue Jay Brown Creeper Brown-headed Cowbird Canada Warbler Eastern Wood Pewee Golden-crowned Kinglet Great-crested Flycatcher Hairy Woodpecker Hermit Thrush Magnolia Warbler Northern Parula '
Ovenbird Pine Warbler Purple Finch Red-breasted Nuthatch Red-eyed Vireo Ruffed Grouse Scarlet Tanager Blue-headed Vireo veery Winter Wren Yellow-bellied Sapsucker Yellow-rumped Warbler American Robin Barred Owl Cedar Waxwing Common Yellowthroat Downy Woodpecker Evening Grosbeak Least Flycatcher Mourning Dove Nashville Warbler Northern Flicker Northern Goshawk Northern Waterthrush Pileasted Woodpecker Pine Siskin Ruby-throated Hummingbirds Swainson's Thrush Tennessee Warbler White-throated Sparrow Wood Thrush Species Richness
nomenclature, see ~ ~ ~ e n d i x E.
BAWW BLWA BCCH BTBW BTGW BWA BRCR BHCO CAWA EWPE GCKI GCFL HAW0 HETH MAWA NOPA OVEN PIWA PUFI RBNU REV1 RUGR SCTA SOVI VEER WIWR YBSA YRWA AMRO BAOW CEWA COYE DOWO EVGR LEFL MOD0 NAWA NOFL NOGO NOWA PIWO PIS1 RTHU SWTH TEWA WTSP WOTH
Common Name R A R A R A R A R A R A R A R A R A Species Code
Total Abundance I 49 52 49.5 54.5 43.5 46 52.5 59 62.5

Table AS. Mean abundance of bird territories over all years (1 995- 1998). Includes nine (10 ha) research areas (RA) at the Penobscot Experimental Forest. For scientific nomenclature. see A D D ~ ~ I Common Name
Black-and-white Warbler Blackburnian Warbler Black-capped Chickadee Black-throated Blue Warbler Black-throated Green Warbler Blue Jay Brown Creeper Brown-headed Cowbird Canada Warbler Eastern Wood Pewee Golden-crowned Kinglet Great-crested Flycatcher Hairy Woodpecker Hennit Thrush Magnolia Warbler Northern Parula Ovenbird Pine Warbler Purple Finch Red-breasted Nuthatch Red-eyed Vireo Ruffed Grouse Scarlet Tanager Blue-headed Vueo Veery Winter Wren Yellow-bellied Sapsucker Yellow-rumped Warbler American Robin Barred Owl Cedar Waxwing Common Yellowthroat Downy Woodpecker Evening Grosbeak Least Flycatcher Mourning Dove Nashville Warbler Northern Flicker Northern Goshawk Northern Waterthrush Pileasted Woodpecker Pine Siskin Ruby-throated Hummingbirds Swainson's Thrush Tennessee Warbler White-throated Sparrow Wood Thrush
dix E. I R A RA RA RA RA Grand
7 8 9 mean 1.875 1.667 1.250 1.310

Table A.6. Kruskal-Wallis tests of differences among treatment groups. Univariate tests on mean numbers of territories per 10 ha site and significance (p-value), for each species of bird found on four or more research areas (n=9) in the Penobscot Experimental Forest. The nine stands were put into three groups based on their eventual treatment, even though no treatments had been applied in 1995. In 1996 and 1997, one and two (respectively) groups of three stands had been treated, though 1996 results below are based on the eventual (i.e., "fixed" for all years) treatments. For 1997, results are presented for tests where the treatment groups are fixed (Trt Fix) for all years, and for tests of treatment differences that compare stands that have actually been treated (Trt Act.) with the controls and yet-untreated stands. Means in bold are significantly different (p 5 0.10).

Table A.6 (Continued). Kruskal-Wallis tests of differences among treatment groups. Univariate tests on mean numbers of territories per 10 ha site and significance (p-value), for each species of bird found on four or more research areas (n=9) in the Penobscot Experimental Forest. Research areas are divided into three groups based on their eventual treatment. For 1997, results are presented for tests where the treatment groups are fixed (Trt Fix) for all years, and for tests of treatment differences that compare stands that have actually been treated (Trt Act.) with the controls and yet-untreated stands.

Table A.6 (Continued). Kruskal-Wallis tests of differences among treatment groups. Univariate tests on mean numbers of territories per 10 ha site and significance (p-value), for each species of bird found on four or more research areas (n=9) in the Penobscot Experimental Forest. Research areas are divided into three groups based on their eventual treatment. For 1997, results are presented for tests where the treatment groups are fixed (Trt Fix) for all years, and for tests of treatment differences that compare stands that have actually been treated (Trt Act.) with the controls and yet-untreated stands.
Woodpecker 10-30 0.33 0 0.00 0.00 0.33 Control 0.50 0 0.50 0.50 0.33

Table A.7. Analysis of variance (ANOVA) for richness and abundance. Avian species richness is the total number of species; abundance is number of bird territories, pooling all species. Both are per 10 ha research area. Data are from nine (10 ha) research areas censused from 1995-1998 at the Penobscot Experimental Forest, Maine. Type I Sum of Squares (SS) only are presented, whenever Type III SS are exactly the same. Because the overall ANOVA model for abundance (A.) was not significant but had a marginally significant year-term, a second one-way ANOVA was run (B.) with only a year-term.
ANOVA (with year, treatment, and interaction terms) for species richness Sum of
Source DF Sauares Mean Sauare F Value Pr > F Model 5 98.884 19.777 3.05 0.0248 Error 29 188.087 6.486 Corrected Total 34 286.971
R-Square Coeff Var Root MSE Mean 0.345 11.0589 2.5467 23.029
Source DF Type I SS Mean Square F Value P r > F Year 1 97.3328 97.3328 15.01 0.0006 FixTreat 2 1.3052 0.6526 0.10 0.9046 Year*FixTreat 2 0.246 0.1232 0.02 0.98 12
Source DF Type I11 SS Mean Square F Value Pr > F Year 1 95.6028 95.6028 14.74 0.0006 FixTreat 2 0.2459 0.12297 0.02 0.98 12 Year*FixTreat 2 0.246 0.1232 0.02 0.9812
A. ANOVA (with year, treatment, and interaction terms) for avian abundance Sum of
Source DF Sauares Mean Sauare F Value P r > F Model 5 299.320 59.864 0.90 0.497 1 Error 29 1938.565 66.847 Corrected Total 34 2237.886
R-Square Coeff Var Root MSE Mean 0.1337 16.0134 8.1760 5 1.057
Source DF Type I SS Mean Square F Value P r > F Year 1 229.21 10 229.21 10 3.43 0.0740 FixTreat 2 28.4375 14.2188 0.2 1 0.8096 Year*FixTreat 2 4 1.6720 20.8360 0.3 1 0.7346
Source DF Type III SS Mean Square F Value P r > F Year 1 223.1940 223.1940 3.34 0.0780 FixTreat 2 4 1.6799 20.8399 0.3 1 0.7346 Year*FixTreat 2 41.6720 20.8360 0.3 1 0.7346
B. ANOVA (with year term) for avian abundance Sum of
Source DF Sauares Mean Sauare F Value P r > F Model 1 229.21 1 229.21 1 3.77 0.0609 Error 33 2008.675 60.869 Corrected Total 34 2237.886
R-Square Coeff Var Root MSE Mean 0.1024 15.281 7.802 5 1.057
Source DF Type1 SS Mean Square F Value P r > F Year 1 229.2 1 1 229.2 11 3.77 0.0609

Table A.8. Results of iterative analysis-of-variance (ANOVA) tests. Tests are for total avian abundance (number of bird territories, pooling all species) and avian species richness per 10 ha research area. These two dependent variables were tested by one-way ANOVAs with "treatment" as the group variable. This series of analyses were done with some values artificially manipulated (reduced) to reflect uniform effect sizes for each treatment group. These analyses were done incrementally to determine statistical power under various hypothetical scenarios. For 1997 data, only stands that had actually been harvested were considered in the 20-10 (n=2) and 10-30 (n=2) treatment groups.
Variable: Abundance Year: 1997
pariable Manipulation: I Control I 10% Harvest I 20% Harvest I P-value
Variable Manipulation:, - None (original data): Reduced by: Reduced by: Reduced by: Reduced by: Reduced by: Reduced by: Reduced by:
Variable: Abundance Year: 1998
I TREATMENT LEVELS I I
None (original data): Reduced by: Reduced bv:
P-value 0.1072 0.0039 0.0080 0.0076 0.0019 0.0034 0.0027 0.0018
TREATMENT LEVELS
Reduced by: Reduced bv:
I Reduced by: 15% 30% I 0.0145 J
Control
10%
Reduced by: Reduced by:
Variable: Species Richness Year: 1998
20%
I I TREATMENT LEVELS I I
10% Harvest
10% 20%
10% 25% 15%
20% 20%
10% 25%
20% Harvest
20% 20% 20% 25% 25% 25% 30%
0.6523 0.0962 0.0739
20% 25 %
0.032 1 0.041 1
25% 25%
L Variable Manipulation: None (original data):
0.0369 0.0126
Reduced by: Reduced bv: Reduced by: Reduced bv:
P-value 0.8 1 94
- - - -
10%
Control --
10%
10% 10%
10% Harvest
0.21 17 0.1229
20% 20%
20% Harvest
0.0254 0.0285

APPENDIX B. Power Analyses Related to Chapter 1
This appendix contains analyses of statistical power for conducting ANOVA (i.e.,
F-Test) tests on avian abundance data. Power is the probability of a test to reject a null
hypothesis of equal means (among treatment groups), given that the null is false.
Following are figures demonstrating how statistical power relates to alpha-levels and
within-group variance for a given effect size, assuming an experimental design identical
to mine, and based on the actual variances I observed for treatment groups. Because I
observed different within-group variances in 1997 (when two of three blocks had been
treated) and 1998 there are two series of figures, based on data from each year.
For each of the two years, three different "effect size" scenarios are modeled,
which assume that one or both experimental treatment means differ from the control
mean by lo%, 20%, or 30% (Scenario's 1-3, respectively). For each scenario, separate
power curves are plotted for each of two alpha-levels (i.e., the Type I error rate).
Effect sizes are characterized by the standard deviation of the group means (Sm).
For each figure, "S" denotes the standard deviation of values within each group, " k is
the number of treatment groups, and "n" is the sample size of units (i-e., 10 ha study
sites) within each group. For each year examined, I have listed the standard deviations
for each treatment group as a point of reference. All analyses based on PASS software
(Hintze, J. 2001. NCSS and PASS. Number Cruncher Statistical Systems. Kaysville,
Utah. WWW.NCSS .COM).

1998 Data
Treatment group: Control 20- 10 10-30 Standard deviation (S): 4.75 8.79 5.06 Mean (for all treatment groups) standard deviation (S): 6.22
Power vs S by Alpha with Sm=2.55 k=3 n=3.00 F Test
Figure B.1. Scenario 1 , 1998 Data. One or both treatments group means differ from control by 10%.

Power vs S by Alpha with Sm=5.14 k=3 n=3.00 F Test
Figure B.2. Scenario 2, 1998 Data. One or both treatments group means differ from control by 20%.
Power vs S by Alpha with Sm=7.68 k=3 n=3.00 F Test
Figure B.3. Scenario 3, 1998 Data. One or both treatments group means differ from control by 30%.

1997 Data
Treatment group: Control 20- 10 10-30 Standard deviation (S): 0.05 3.97 8.3 1 Mean (for all treatment groups) standard deviation (S): 4.26
Power vs S by Alpha with Sm=2.88 k=3 n=3.00 F Test
Figure B.4. Scenario 1, 1997 Data. One or both treatments group means differ from control by 10%.
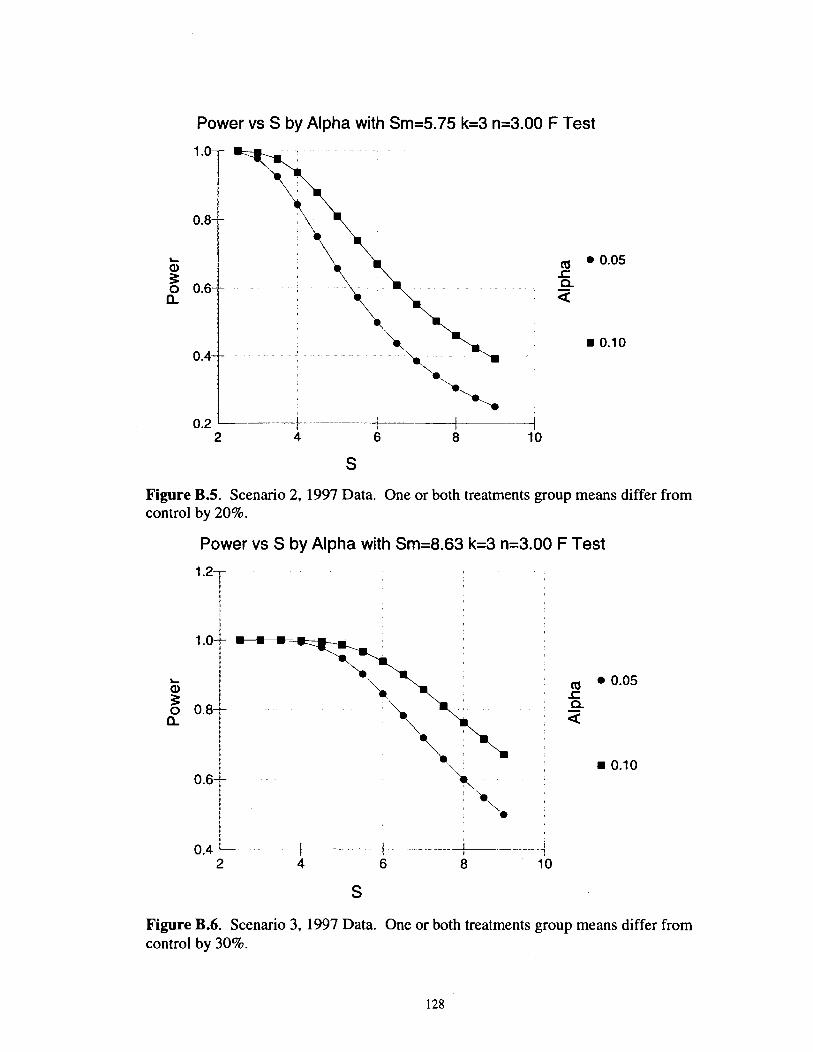
Power vs S by Alpha with Sm=5.75 k=3 n=3.00 F Test
Figure B.5. Scenario 2, 1997 Data. One or both treatments group means differ from control by 20%.
Power vs S by Alpha with Sm=8.63 k=3 n=3.00 F Test
Figure B.6. Scenario 3, 1997 Data. One or both treatments group means differ from control by 30%.

APPENDIX C. Data and Analyses Related to Chapter 2

Table C.1. Differences in site-attachment distances by year. Detailed statistical test results, for males only; Hermit Thrushes and Ovenbirds were analyzed separately. These tests were restricted to birds captured on the same site in two consecutive years.
Hermit Thrush
Test Kruskal-Wallis ANOVA
Distance by year - n Rank sum Mean rank 1995-1 996 15 296 19.73 1996-1 997 9 136 15.11 1997-1 998 11 198 18
Kruskal-Wallis statistic 1.1 4 P= 0.5642 (chisqr approximation)
Ovenbird
Test Kruskal-Wallis ANOVA
Distance by year - n Ranksum Mean rank 1995-1 996 3 22 7.33 1 996-1 997 5 34 6.8 1 997-1 998 5 35 7
Kruskal-Wallis statistic 0.04 P= 0.9826 (chisqr approximation)

Table C.2. Differences in site-attachment distances by treatment. Detailed statistical test results, for males only; Hermit Thrushes and Ovenbirds were analyzed separately. These tests were restricted to birds captured on the same site in two consecutive years. These tests compared distances across treatment groups, based on whether the capture site was a control in both years, treated in both years, or was a control in year "t," but treated in year "t+lW. For Ovenbirds there was one group that included only one observation; therefore, two tests are presented: a Kruskal-Wallis Test with all three treatment groups, and a Mann-Whitney Test with one group (with n=l observation) excluded.
Hermit Thrush Test Kruskal-Wallis ANOVA
n=35 Distance by year - N Rank sum Mean rank Con-Con 18 339 18.83 Con-Trt 8 175 21.88 Trt-Trt 9 116 12.89 Kruskal-Wallis statistic 3.5 P= 0.1736 (chisqr approximation)
Ovenbird (With all three treatment groups) Test Mann-Whitney test
n = 1 4 Distance by year - n Rank sum Mean rank Con-Con 6 53 8.83 Con-Trt 6 34 5.67 Trt-Trt 1 4 4 Kruskal-Wallis statistic 2.63 P= 0.269 (chisqr approximation)
(With only two treatment groups) Test Mann-Whitney test
n = 1 3 Distance by year - N Rank sum Mean rank U Con-Con 6 47 7.83 10 Con-Trt 6 3 1 5.17 26
Difference between medians 24.43 96.5% CI -100.317 to 89.456 (exact) Mann-Whitney U statistic 10 2-tailed p 0.2403 (exact)

Table C.3. Differences in site-attachment distances by dispersal status. Detailed statistical test results, for males only; Hermit Thrushes and Ovenbirds were analyzed separately. These tests compared distances for birds found on the same site in two consecutive years versus birds that dispersed to a new site the second year. Data were pooled across all years 19%- 1998.
Hermit Thrush Test Mann-Whitney test n = 39 39 Distance by Return status - n Rank sum Mean rank - U Different 4 120 30 30 Same 35 660 18.86 110
Difference between medians 74.692 95.3% CI -9.838 to 139.1 16 (normal approximation)
Mann-W hitney U statistic 30 2-tailed p 0.0641 (normal approximation)
Ovenbird Test n=17
Mann-Whitney test
Distance by Return status n Rank sum Mean ranku Different 3 36 12 9 Same 13 100 7.69 30
Difference between medians 40.845 95.3% CI -33.286 to 92.1 13 (exact)
Mann-W hitney U statistic 9 2-tailed p 0.1 893 (exact)

Table C.4. Differences in site-attachment distances by treatment status. Data are for males only; Hermit Thrushes and Ovenbirds are analyzed separately. These tests compared distances for birds captured (in year "t") on control versus treated sites, regardless of capture location in year "t+l." Data were pooled across all years 1995- 1998.
Hermit Thrush Test Mann-W hitney test n = 39 39 Distance by Year1 - n Ranksum Meanrank - U Control 27 570 21.1 1 132 Treatment 12 210 17.5 192
Difference between medians 21.26 95.2% CI -37.405 to 76.81 8 (normal approximation)
Mann-Whitney U statistic 132 2-tailed p 0.3613 (normal approximation)
Ovenbird Test Mann-Whitney test n = 1 7 Distance by Year1 - n Rank sum Mean ranklJ Control 13 110 8.46 20 Treatment 3 26 8.67 19
Difference between medians -1.822 95.3% CI -78.297 to 77.030 (exact)
Mann-Whitney U statistic 20 2-tailed p 1 (exact)
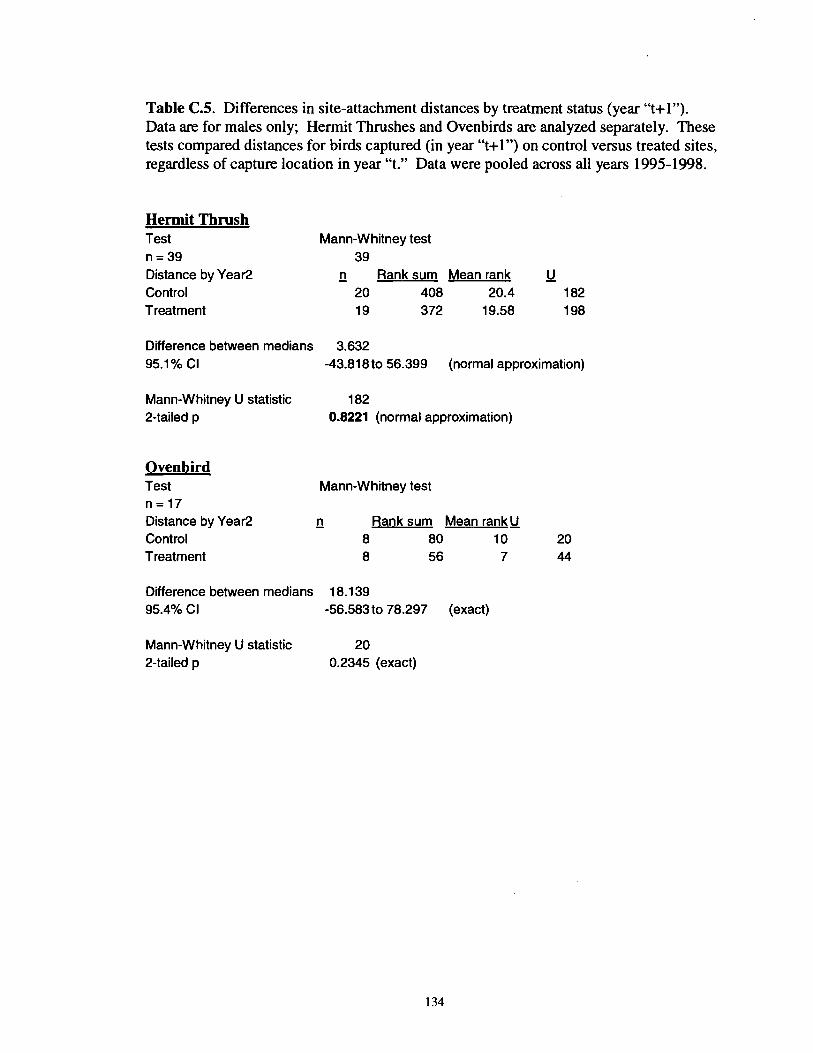
Table C.5. Differences in site-attachment distances by treatment status (year "t+lW). Data are for males only; Hermit Thrushes and Ovenbirds are analyzed separately. These tests compared distances for birds captured (in year "t+l") on control versus treated sites, regardless of capture location in year "t." Data were pooled across all years 1995-1998.
Hermit Thrush Test Mann-Whitney test n = 39 39 Distance by Year2 - n Rank sum Mean rank - U Control 20 408 20.4 182 Treatment 19 372 19.58 1 98
Difference between medians 3.632
Mann-Whitney U statistic 2-tailed p
Ovenbird Test n = 1 7 Distance by Year2 Control Treatment
-43.81 8 to 56.399 (normal approximation)
182 0.8221 (normal approximation)
Mann-Whitney test
n - Rank sum Mean ranku 8 80 10 20 8 56 7 44
Difference between medians 18.1 39 95.4% CI -56.583 to 78.297 (exact)
Mann-Whitney U statistic 20 2-tailed p 0.2345 (exact)

Table C.6. Results of competing Cormack-Jolly Seber models for mark-recapture data analyzed with Program MARK. Hermit Thrush and Ovenbird data are modeled separately. For each species, only data for males were analyzed. Annual survival rate denoted by "$" and recapture rate by "p," with parentheses indicating whether parameters vary over time (t) or are constant (.) for all return intervals. Model selection was based on modified Aikeike's Information Criterion (AICc). Delta AICc denotes difference between candidate model and best overall model. Number of parameters in model abbreviated "#Par."
Hermit Thrush (males only) ..................................................................................................
Delta AICc Model Model AICc AICc Weight Likelihood #pa# Deviance ~'(I)P(.) 1 82.40 0.00 0.5482 1 .000 4.0 12.922 4'coPtt) 184.42 2.02 0.2001 0.365 5.0 12.745 4'(.)~(.) 184.98 2.58 0.1513 0.276 2.0 19.760 4'(.)p(o 185.80 3.39 0.1004 0.183 4.0 16.316
Ovenbird (males only) ---------------------------------------------------------------------------------------------------
Delta AICc Model Model AICc AICc Weight Likelihood #pa# Deviance
~ P L ) 125.20 0.00 0.7399 1.000 2.0 6.674 ~ P ( J 129.18 3.99 0.1008 0.136 4.0 6.297 ~ P W 129.35 4.15 0.0930 0.126 4.0 6.459 ' ~ P W 130.02 4.83 0.0663 0.090 5.0 4.87 1

APPENDIX D. Data and Analyses Related to Chapter 3.

Table D.1. Bird population trends for combined region. Table includes population trend, statistical significance, number of routes trend is based on (n), and variance, for combined region of Maine, New Hampshire, and Vermont, for the periods: 1995 to 1996, and 1996 to 1997. Values based on Breeding Bird Survey data (Sauer 1999).
1995 to 1996 1996 to 1997 Trend D-value n Variance Trend D-value n Variance
CONIFEROUS FOREST SPECIES Olive-sided Flycatcher
Yellow-bellied Flycatcher
Blue-headed Vireo
Gray Jay
Boreal Chickadee
Red-breasted Nuthatch
Brown Creeper
Winter Wren
Golden-crowned Kinglet
Ruby-crowned Kinglet
Swainson's Thrush
Hermit Thrush
Magnolia Warbler
Cape May Warbler
Blackburnian Warbler
Myrtle Warbler
Black-throated Green Warbler
Bay-breasted Warbler
Blackpoll Warbler
Dark-eyed Junco
Purple Finch
DECIDUOUS FOREST SPECIES
Eastern Wood-Pewee
Least Flycatcher
Great-crested Flycatcher
Red-eyed Vireo
Warbling Vireo
Blue Jay
Black-capped Chickadee
White-breasted Nuthatch
Wood Thrush
veery

Table D.l (Continued). Bird population trends for combined region.
1995 to 1996 1996 to 1997 Trend p-value n Variance Trend rwalue n Variance
Northern Parula 28.91 0.020 39 140.96 -13.29 0.198 36 102.10
Black-throated Blue Warbler 24.73 0.266 38 476.32 -13.75 0.074 43 55.99
Pine Warbler 0.15 0.990 3 154.77 2.72 0.829 22 152.63
Black-and-white Warbler -8.62 0.463 64 135.93 -14.68 0.065 64 60.76
American Redstart 3.38 0.752 60 112.81 0.60 0.936 63 55.64
Ovenbird 7.68 0.096 74 20.66 -1.64 0.689 72 16.66
Canada Warbler 4.58 0.794 26 298.22 12.52 0.507 23 342.12
Scarlet Tanager -7.78 0.626 41 250.37 -3.42 0.804 44 187.59
Rose-breasted Grosbeak -28.85 0.006 51 99.54 6.85 0.443 45 78.17
Brown-headed Cowbird -0.85 0.928 52 89.28 -7.81 0.550 52 169.66

APPENDIX E. Scientific Names of Birds.

Table E.1. Scientific names of birds.
Common Name
Olive-sided Flycatcher Yellow-bellied Flycatcher Blue-headed Vireo Gray Jay Boreal Chickadee Red-breasted Nuthatch Brown Creeper Winter Wren Golden-crowned Kinglet Ruby-crowned Kinglet Swainson's Thrush Hermit Thrush Magnolia Warbler Cape May Warbler Blackburnian Warbler Myrtle Warbler Black-throated Green Warbler Bay-breasted Warbler Blackpoll Warbler Dark-eyed Junco Purple Finch Eastern Wood-Pewee Least Flycatcher Great-crested Flycatcher Red-eyed Vireo Warbling Vireo Blue Jay B lack-capped Chickadee White-breasted Nuthatch Wood Thrush veery Northern Parula Black-throated Blue Warbler Pine Warbler Black-and-white Warbler American Redstart Ovenbird Canada Warbler Scarlet Tanager Rose-breasted Grosbeak Brown-headed Cowbird
Scientific Name
Contopus cooperi Empidonaxjlaviventris Vireo solitarius Perisoreus canadensis Poecile hudsonica Sitta canadensis Certhia americana Troglodytes troglodytes Regulus satrapa Regulus calendula Catharus ustulatus Catharus guttatus Dendroica magnolia Dendroica tigrina Dendroica fisca Dendroica coronata Dendroica virens Dendroica castanea Dendroica striata Junco hyemalis Carpodacus purpureus Contopus virens Empidonax minimus Myiarchus crinitus Vireo olivaceus Vireo gilvus Cyanocitta cristata Poecile atricapilla Sitta carolinensis Hylocichla mutelina Catharus fuscescens Parula americana Dendroica caerulescens Dendroica pinus Mniotilta varia Setophaga ruticilla Seiurus aurocapillus Wilsonia canadensis Piranga olivacea Pheucticus ludovicianus Molothrus ater

BIOGRAPHY OF THE AUTHOR
Mitschka Hartley was born in Lewiston, Maine on June 17, 1970. He was raised
in Turner, Maine and graduated from Leavitt Area High School in 1988. He attended
Cornell University and graduated with Honors in 1992 with a B.S. in Natural Resources.
During his college years, Mitch spent two summers working for the National Audubon
Society's Project Puffin, and worked as an office assistant at the Cornell Laboratory of
Ornithology from 1988-1992. He also spent a semester studying Spanish and ecology in
Costa Rica. He received his M.S. in Wildlife Science from Louisiana State University in
1994, after spending two summers studying waterfowl and songbirds on the prairies of
Manitoba and Saskatchewan.
After receiving his degree, Mitschka will resume his position as Forest Ecologist
with Audubon New York, studying the effects of timber harvesting on wildlife
communities in northern hardwood forests. Mitschka is a candidate for the Doctor of
Philosophy degree in Wildlife Ecology from The University of Maine in May, 2003.