effects of simulated hail on processing tomatoes u,c
TRANSCRIPT

~t HORTICULTURE SERIES 599 MARCH 1989
EFFECTS OF SIMULATED HAIL ON PROCESSING TOMATOES
. DALE KRETCHMAN, MARK JAMESON, AND CHARLES WILLER
DEPARTMENT OF HORTICULTURE 5 2_ THE OHIO STATE UNIVERSITY
u ,c .
OHIO AGRICULTURAL RESEARCH AND DEVELOPMENT CENTER
1 , WOOSTER, OHIO 44691 - J

TABLE OF CONTENTS
Introduction and Objectives Description of Experiments Results
Plant Staging Hail Effects on Young Transplants Influence of Stand on Yield Hail Effects on Transplant Tomatoes Hail Effects on Direct Seeded tomatoes
Processor Concerns Summary
Page
1
2
3 3-5 5-14
14-16 14-42 43-49
50
51
All publications of the Ohio Agricultural Research and Development Center are available to all potential clientele on a nondiscriminatory basis without regard to race, color, creed, religion, sexual orientation, national origin, sex, age, handicap, or Vietnam-era veteran status .
3/89-H-464/100

THE EFFECTS OF SIMULATED HAIL ON PROCESSING TOMATOES - 1988*
Dale w. Kretchman, Mark A. Jameson, and Charles C. Willer Department of Horticulture
The Ohio State University/OARDC Wooster, Ohio 44691
The year·1988 was the third and final year of a study to determine:
1. A plant development classification {staging) for transplanted and field-seeded processing tomatoes.
2. The influence of a range in severity of simulated hail injury at several stages of plant development of transplanted and field-seeded processing tomatoes on maturity and yield.
3. The influence of early stand loss on maturity and yield of transplanted processing tomatoes.
4. Tables or graphs for establishing yield losses from hail injury at various stages of plant development of processing tomatoes.
Field plots were established at the OSU/OARDC Vegetable Crops Branch near Fremont, Ohio, starting in 1986 and continuing in 1987 and 1988. This location is in the primary area for the production of processing tomatoes in Ohio and results should be applicable to the midwest production areas of Ohio, Michigan, Indiana, Illinois, Iowa and perhaps New York and Pennsylvania. Certain studies were also conducted on the OSU/OARDC main campus near Wooster.
The field plots were established following standard commercial practice and the cultural care was as similar as possible to that used by growers in the midwest. Transplants and seed were obtained from Heinz, USA and were parts of shipments used by commercial growers. A special note should be made that no additional or special sprays for disease control were made following simulated hail injury treatfuents; the regular pest control program was used. The plots were treated with Ethrel at the appropriate times and the fruits were harvested using a modified commercial mechanical harvester.
The equipment for injuring the plants was designed to blow crushed ice at a high velocity through a flexible 4-inch i.d. hose that could be directed at the plants to be treated. This piece of equipment was supplied by the National Crop Insurance Association. The type of injury obtained appeared quite similar to that observed from actual hail usually associated with severe thunderstorms. A "weed wacker 11 was used in initial studies in 1986 and it was effective in injuring the plants {defoliation and cutting-off plant parts) but the injury did not resemble hail injury. The "weed wacker" was not used in 1987 and 1988.
The plot designs and methods for collecting data were done to facilitate proper data analyses by the OSU/OARDC Statistics Laboratory.
*This study was supported in part by a gift from the National Crop Insurance Association.
1

The studies were designed to be conducted over a 3-year period to improve the reliability of the results during different seasons with different environmental conditions. The weather conditions were different, indeed! The 1986 season was more nearly "normal" than 1987 and 1988, although a period of excessive rainfall occurred in July. No apparent plant injury resulted, however. In 1987, May was warmer and drier than "normal", June and July were warmer and wetter than normal and. August and September were about normal. Conditions in 1988 were much different. May, June and early July had temperatures much above normal with less than one-fourth of normal rainfall. In addition, the relative humidity was very low and thus, plants were subject to severe stress. The experimental plots were irrigated with overhead sprinklers with about 4.5 acre inches of water, which helped immensely, but did not eliminate completely the water stress. Sprinkler irrigation does not provide water uniformly over a field even under the best of conditions; thus, plant growth and development ·was less uniform in 1988 than previous years. Also, the third planting of transplants was made during severe heat stress and, although there was adequate soil moisture from irrigation prior to planting, plant survival was less than desirable. Undoubtedly there was considerable variation within and between the plots which did influence the reliability of the data in 1988.
DESCRIPTION OF EXPERIMENTS
A. Early Hail Injury and Stand Loss
This study was established with cv. Heinz 1810 transplanted on May 21 in 1987 and on May 19, 1988. Single row populations were near ~,000 plants per acre and twin rows were near 12,000 plants per acre. Plant stands for the plantings were greater than 95% which were considered controls. Two dates of simulated hail and stand reduction were used each year: June 1 and 10, 1987 and June 2 and 9, 1988 for hail and May 29 and June 10, 1987 and June 2 and 9, 1988 for stand reduction treatments. Hail treatments were none (0 defoliation), slight (25-35% defoliation), moderate (50-60% defoliation), and several (80-95% defoliation) and stand reduction treatments were 15 and 30% hand pulled. Data were analyzed based upon actual defoliation as determined by experienced adjusters and/or project leaders·and technicians. Fruits from the plots were machine harvested on September 3 and 5, 1987 and August 25 and 26, 1988.
B. Hail Transplants
Transplants of cv. Heinz 1810 were planted on 5-ft. beds, 30-ft. long on May 9 and 26 and June 4 in 1986; May 21, June 1 and 10, 1987 and May 5 and 18 and June 1, 1988. Only single rows were planted in 1986, but both single (about 9,000 plants/acre) and twin (about 12,000 plants/acre) rows were planted in 1987 and 1988. Hail treatments were similar to the previous study, but frequently the severe hail treatments did not reach the desired 80% plus defoliation. Hail treatments were done on June 24 and July 21, 1986; June 29 and July 23, 1987; and June 28 and July 19, 1988. Again, several hail adjusters and/or project leaders and technicians estimated the amount of defoliation upon which to base data analyses. The plots were machine harvested, the timing of which was based on the optimum harvest time for the non-treated control treatment, on August 18 (planting 1), September 9 (planting 2), September 24 (planting 3) in 1986; September 1 (planting 1), September 14 (planting 2), September 14 and 21 (planting 3) in 1987; and August 22 (planting 1), August 25 (planting 2}, and September 20 (planting 3-a split set occurred in this planting) in 1988. In 1986 and 1987, the fourth replications were not harvested with the regular harvests so
2
that an estimate of the treatment effects on fruit maturity could be made.
C. Hail-Field Seeded
Seed of cv. Heinz 1810 were planted on May 8, 1986; May 7, 1987; and May 10, 1988, using a John Deere vegetable seeder which dropped 3 to 5 seeds spaced 9 inches apart. Vermiculite was placed in the seed furrow as an anti-crustant. Hail treatments were made on June 26 and July 28 in 1986; July 10 and August 13, 1987 (a mid-June treatment was scheduled, but wet soil conditions precluded making this treatment); June 21, July 19 and August 17 in 1988. Hail treatments and evaluations were similar to previous treatments. However, it was extremely difficult to obtain severe levels of defoliation because seeded plants are very tall and tend to move with the flow of air from the ice blower and the ice did not cut the leaves off very effectively.
The plots were machine harvested on September 24 in 1986; September 21 in 1987; and September 20 in 1988.
D. Plant Development Classification
The initial and primary study for plant development classification was done in 1986 on the Main Campus, Wooster, then verified the following two seasons. Transplants of varieties cv. Ohio 832, Heinz 1810, Heinz Hybrid 7151, Easy Winner and Early Harvest. Detailed data on plant growth were collected and analyzed. An initial classification based upon that used by hail insurance adjusters was used. Observations during 1987 and 1988 suggested a simplification and reduction in the number of stages of development. The previous staging groupings were based upon use of indeterminant varieties, whereas presently used varieties are determinant in growth habit.
RESULTS
A. General
Results of most importance to the evaluation of hail injury will be presented in the text of this section. Detailed data and other information will be in an Appendix so that all the data can be examined if necessary. Some data from previous reports (Horticulture Series No. 570, 1987 and No. 856, 1988) are not included, but the appropriate data are included.
Most of the data were analyzed using 2 or 3 years data. An examination of some of the data where only 1987 and 1988 results were available; e.g., twin rows of transplants, revealed some serious variability which causes problems of interpretation. Apparently the extremely hot, dry early season and the usual unevenness of sprinkler irrigation resulted in greater variability within plots than that due to treatment. Every effort will be made to interpret the results accurately.
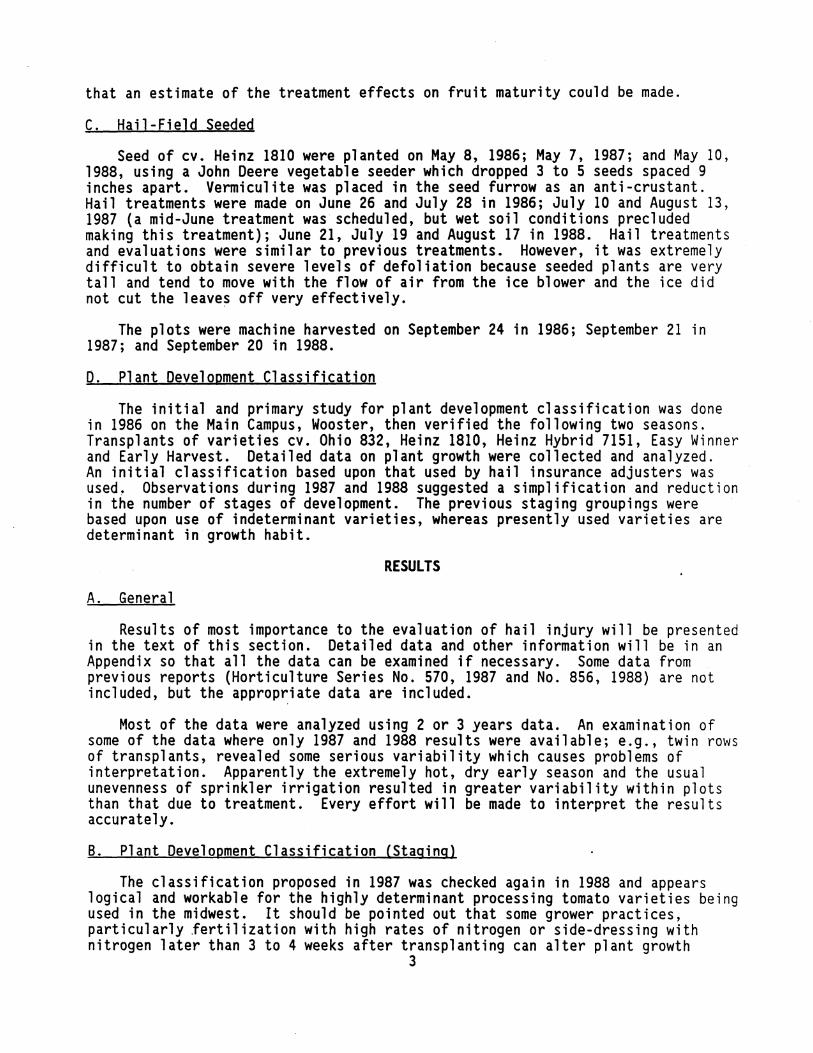
B. Plant Development Classification (Staging}
The classification proposed in 1987 was checked again in 1988 and appears logical and workable for the highly determinant processing tomato varieties being used in the midwest. It should be pointed out that some grower practices, particularly .fertilization with high rates of nitrogen or side-dressing with nitrogen later than 3 to 4 weeks after transplanting can alter plant growth
3

somewhat and the blossoming period may be delayed and/or extended, both of which may influence maturity, uniformity of ripening and yield.
PROPOSED CLASSIFICATION FOR TRANSPLANTS
Stage Plant Develooment
I. Plant recovery stage. Axillary shoots less than 2 inches long.
2. Early Vegetative. Primary stem has nearly 6 inches of new growth, first cluster in bloom, second cluster showing. Axillary shoots about 4 inches long and first flower buds visible.
3. Late Vegetative. Primary stem has terminated in flower cluster and may be I2 to I9 inches long and may have 2-4 flower clusters. First cluster fruits may be about I/4 final size; 4-5 weeks after transplanting. Axillary shoots are up to I2 inches long and have I flower cluster in bloom with 2 or 3 flower clusters visible.
4. Maximum flowering for setting of major crop of fruits. Fruits are easily visible on first and second clusters of main stem, first cluster fruits may be 3/4 of final size and second cluster fruits are up to half of final size; third and fourth cluster flowers in full bloom. First 2 clusters on axillary shoots are in full bloom, but terminal flower clusters not open. (Usually this period is 5 to 7 weeks after planting, but may be up to 8 weeks.)
5. Snow-ball bloom. All terminal flowers in bloom so plants appear yellow from maximum bloom. However, most previous flowers have set fruits and the terminal flowers usually abscise. Fruits on first cluster of main stem are near full size and second cluster fruits are about I/2 to 3/4 final size. Other fruits are about pea size or slightly larger. This usually is 7 or 8 weeks after planting.
6. Early post-bloom and maximum fruit growth. Shortly after stage 5, fruits will be growing very rapidly after fruit set and this usually lasts around 3 weeks; this stage tends to overlap with stage 7.
7. Fruit sizing and early ripening. During this stage the weight of the fruits cause the shoots to bend to the ground; thus causing the plants to open up and expose the stems and fruits. Hail at this time and later could result in the most serious fruit losses from scarring and subsequent rotting.
8. Fruit ripening. Ripe fruits are accumulating prior to harvest (the first cluster fruits on the main stem are likely overripe and completely decayed). This stage usually lasts up to 3 weeks. May be less if Ethrel is used to promote fruit ripening--may be only 2 weeks.
4
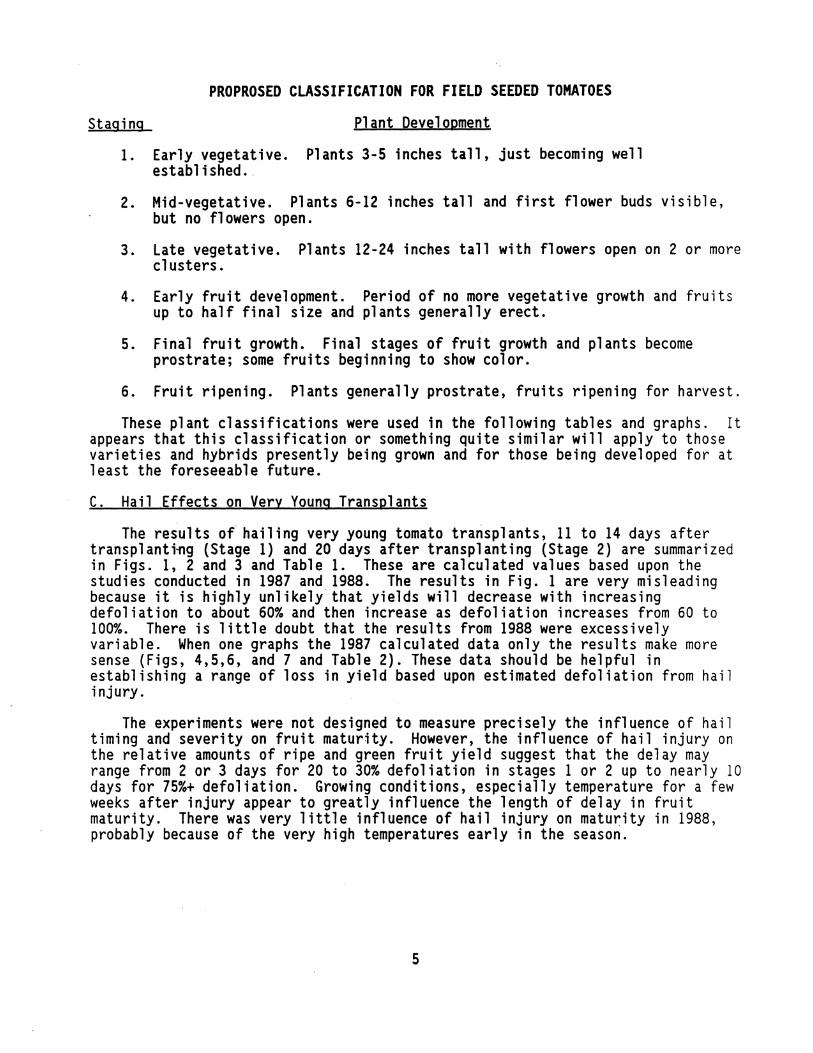
PROPROSED CLASSIFICATION FOR FIELD SEEDED TOMATOES
Staging Plant Development
1. Early vegetative. Plants 3-5 inches tall, just becoming well established ..
2. Mid-vegetative. Plants 6-12 inches tall and first flower buds visible, but no flowers open.
3. Late vegetative. Plants 12-24 inches tall with flowers open on 2 or more clusters.
4. Early fruit development. Period of no more vegetative growth and fruits up to half final size and plants generally erect.
5. Final fruit growth. Final stages of fruit growth and plants become prostrate; some fruits beginning to show color.
6. Fruit ripening. Plants generally prostrate, fruits ripening for harvest.
These plant classifications were used in the following tables and graphs. It appears that this classification or something quite similar will apply to those varieties and hybrids presently being grown and for those being developed for at least the foreseeable future.
C. Hail Effects on Very Young Transplants
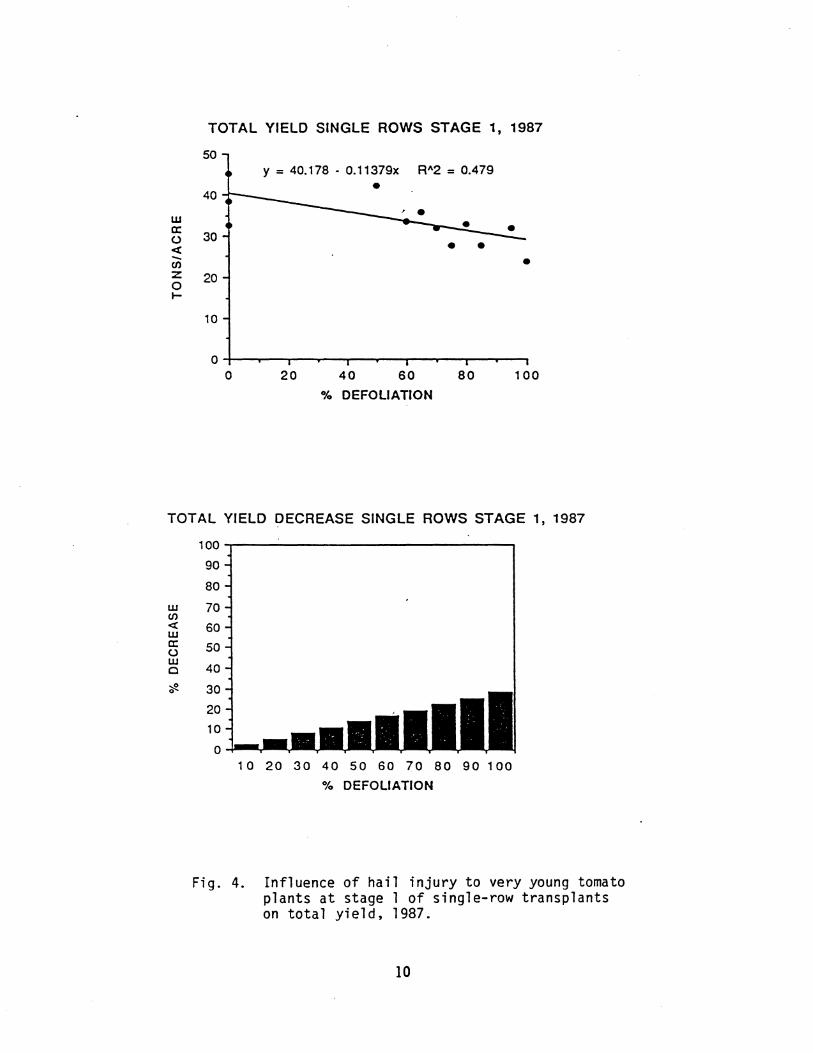
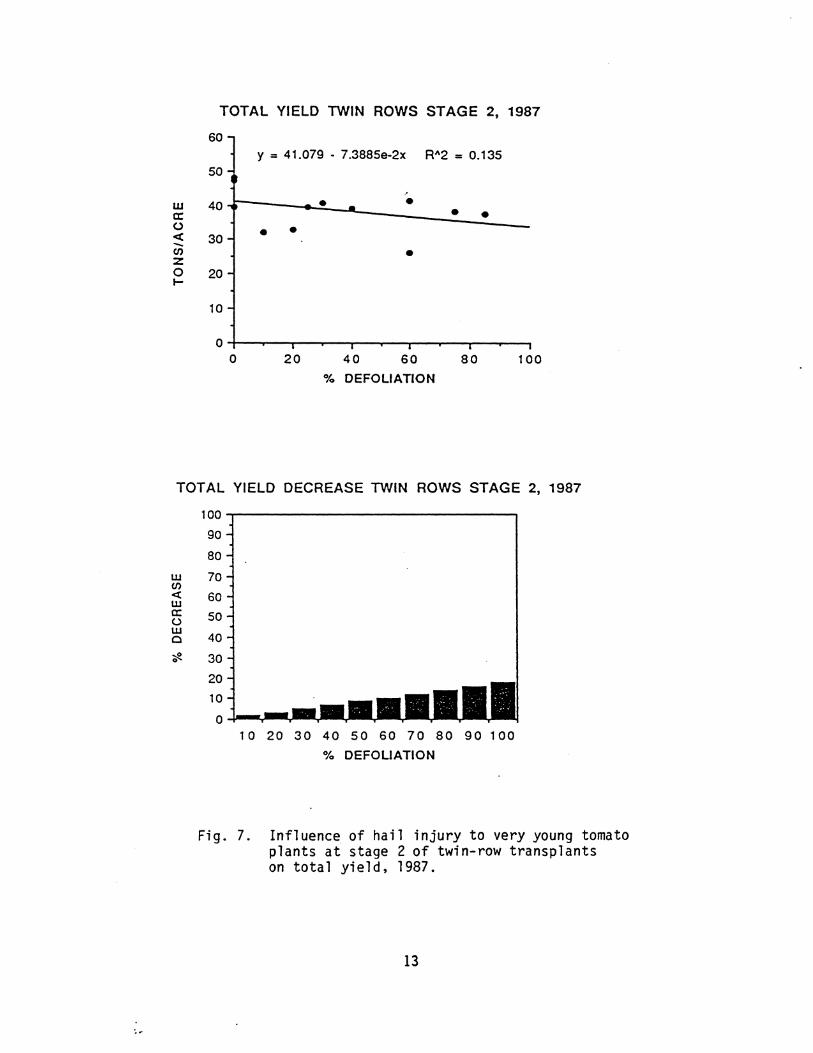
The results of hailing very young tomato transplants, 11 to 14 days after transplanti~g (Stage 1) and 20 days after transplanting (Stage 2) are summarized in Figs. 1, 2 and 3 and Table 1. These are calculated values based upon the studies conducted in 1987 and 1988. The results in Fig. 1 are very misleading because it is highly unlikely that yields will decrease with increasing defoliation to about 60% and then increase as defoliation increases from 60 to 100%. There is little doubt that the results from 1988 were excessively variable. When one graphs the 1987 calculated data only the results make more sense (Figs, 4,5,6, and 7 and Table 2). These data should be helpful in establishing a range of loss in yield based upon estimated defoliation from hail injury.
The experiments were not designed to measure precisely the influence of hail timing and severity on fruit maturity. However, the influence of hail injury on the relative amounts of ripe and green fruit yield suggest that the delay may range from 2 or 3 days for 20 to 30% defoliation in stages 1 or 2 up to nearly 10 days for 75%+ defoliation. Growing conditions, especially temperature for a few weeks after injury appear to greatly influence the length of delay in fruit maturity. There was very little influence of hail injury on maturity in 1988, probably because of the very high temperatures early in the season.
5

w a: (.) <( --C/)
z 0 1-
50
40
30
20
10
0
w a: (.) <( --C/)
z 0 1-
TOTAL YIELD SINGLE ROWS 1987-88
0
50
40
30
20
10
0 0
20 40
YLD. STG.1 YLD. STG. 2
60 80
o/o DEFOLIATION
100
TOTAL YIELD TWIN ROWS 1987-88
-a- . STAGE 1T
--.- STAGE2T
20 40 60 80 100
% DEFOLIATION
Fig. 1. Influence of ha i1 injury on tota 1 yi e 1 d of very young tomato transplants, single and twin rows 1987 and 1988.
6

TOTAL YIELD DECREASE SINGLE ROWS STAGE 1, 1987-88
w en oc( w a: u w c ::.e 0
100
90
80
70
60
50
40
30
20
10
0 10 20 30 40 50 60 70 80 90 100
o/o DEFOLIATION
TOTAL YIELD DECREASE SINGLE ROWS STAGE 2, 1987-88
w en oc( w a: u w c ::.e 0
100
90
80
70
60
50
40
30
20
10
0 10 20 30 40 50 60 70 80 90 100
% DEFOLIATION
Fig. 2. Influence of hail injury on total yield decrease of very young tomato transplants, single rows, 1987 and 1988.
7

TOTAL YIELD DECREASE TWIN ROWS STAGE 1, 1987-88
w en < w a: 0 w c "I!
100
90
80
70
60
50
40
30
20
10
0 1 0 20 30 40 50 60 70 80 90 100
% DEFOUATION
. TOTAL YIELD DECREASE TWIN ROWS STAGE 2, 1987-88
w en < w a: 0 w c ~ 0
100
90
80
70
60
50
40
30
20
10
0 1 0 20 30 40 50 60 70 80 90 100
% DEFOLIATION
Fig. 3. Influence of hail injury on total yield decrease of very young tomato transplants, twin rows, 1987 and 1988.
8

Table 1. Influence of hail injury during early plant development on total yield of transplanted tomatoes, 1987 and 1988*.
Single Rows Single Rows Twin Rows Twin Rows Stage 1 Stage 2 Stage 1 Stage 2
Defol. Tons/ Dec. Tons/ Dec. Tons/ Dec. Tons/ Dec. % A (%) A (%) A (%) A (%)
1 29.6 34.2 41.6 37.8 10 29.2 1.5 31.6 7.5 39.2 5.8 35.9 5.0 20 28.7 3.1 29.1 14.7 37.0 11.2 34.2 9.6 30 28.2 4.8 27.1 20.7 35.2 15.4 32.8 13.2 40 27.7 6.5 25.4 25.5 33.9 18.6 31.8 15.8 so 27.2 8.3 24.2 29.1 33.0 20.6 31.2 17.4 60 26.6 10.0 23.4 31.5 32.6 21.5 31.0 18.0 70 26.1 11.7 23.0 32.7 32.7 21.3 31.1 17.6 80 25.6 13.5 23.0 32.7 33.3 19.9 31.6 16.2 90 25.1 15.3 23.4 31.5 34.3 17.5 32.5 13.8
100 24.5 17.1 24.2 29.1 35.8 13.9 33.8 10.5
*Data generated from regression analyses of original results.
9
TOTAL YIELD DECREASE SINGLE ROWS STAGE 1, 1987
w en < w a: 0 w c ~ 0
100
90
80
70
60
50
40
30
20
10
0 10 20 30 40 50 60 70 80 90 100
% DEFOLIATION
Fig. 4. Influence of hail injury to very young tomato plants at stage 1 of single-row transplants on total yield, 1987.
10

TOTAL YIELD SINGLE ROWS STAGE 2, 1987
50
y = 41.957 - 0.17292x RA2 = 0.673
40 • w • • a:
30 0 < -CJ) • :z: 20 • 0 1-
10
0 0 20 40 60 80 100
% DEFOLIATION
TOTAL YIELD DECREASE SINGLE ROWS STAGE 2, 1987
w en <X: w a: (.) w c ~ 0
100
90
80
70
60
50
40
30
20
10
0 10 20 30 40 50 60 70 80 90 100
% DEFOLIATION
Fig. 5. Influence of hail injury to very young tomato plants at stage 2 of single-row transplants on total yield, 1987.
11

TOTAL YIELD TWIN ROWS STAGE 1, 1987
60 y = 48.S69 .: 0.14782x R"2 = 0.497
so
• w 40 a: 0 < 30 - • rn z 0 20 t-
10
0 0 20 40 60 80 100
% DEFOLIATION
TOTAL YIELD DECREASE ·TWIN ROWS STAGE 1, 1987
w rn < w a: 0 w c fl.
100
90
80
70
60
so 40
30
20
10
0 1 0 20 30 40 so 60 70 80 90 100
% DEFOLIATION
Fig. 6. Influence of hail injury to very young tomato plants at stage 1 of twin-row transplants on total yield, 1987.
12
TOTAL YIELD TWIN ROWS STAGE 2, 1987
60 y = 41.079 · 7 .3885e-2x RA2 = 0.135
50
.•
• • w 40 a: • • 0 < 30 - • • en • z 0 I-
20
10
0 0 20 40 60 so 100
% DEFOLIATION
TOTAL YIELD DECREASE TWIN ROWS STAGE 2, 1987
w en < w a: 0 w Q
~
100
90
80
70
60
so 40
30
20
10
0 10 20 30 40 50 60 70 80 90 100
% DEFOLIATION
Fig. 7. Influence of hail injury to very young tomato plants at stage 2 of twin-row transplants on total yield, 1987.
13

Table 2. Influence of hail injury during early plant development on total yield of transplanted tomatoes, 1987*.
Single Rows Single Rows Twin Rows Twin Rows Stage 1 ~tage 2 Stage 1 Stage 2
Defol. Tons/ Dec. Tons/ Dec. Tons/ Dec. Tons/ Dec. % A (%) A (%) A (%) A (%)
I 40.0 41.7 48.4 41.0 IO 39.0 2.5 40.2 3.7 47.I 2.7 40.3 1.6 20 37.9 5.3 38.4 7.8 45.6 5.8 39.6 3.4 30 36.7 8.2 36.7 I2.0 44.I 8.8 38.8 5.2 40 35.6 11.0 35.0 I6.1 42.6 11.9 38.I 7.0 50 34.4 I3.9 33.3 20.2 41.2 I4.9 37.3 8.8 60 33.3 I6.7 31.5 24.4 39.7 I8.0 36.6 I0.6 70 32.2 19.5 29.8 28.5 38.2 21.0 35.9 I2.4 80 31.0 22.4 28.I 32.7 36.7 24.I 34.4 I4.2 90 29.9 25.2 26.3 36.8 35.2 27.I 33.6 I7.8
IOO 28.7 28.I 24.6 40.9 33.8 30.2 33.6 I7.8
*Data generated from regression analyses of original results.
D. Influence of Stand of Transglants on Yield
Results of plant removal at the same time as the early hail injury in "C" above are summarized in Fig. 8 and Table 3. There is little double that a loss in stand does reduce potential total yield. Obviously, twin rows had higher yields than single row culture, but yield reductions are similar. Stage at plant removal had no significant influence on total yield. Twin row yields averaged II.3% higher than single rows in I987 and 28.5% in I988.
Results from the I987 study suggest the possibility of maturity delay due to stand loss. However, the potential appears low and probably is not a factor to be considered in evaluating the influence of stand loss on fruit development and maturity. Maturity was not affected by treatment in I988.
E. Hail Effects on Transglants
The most' extensive study was with the effects of hail at various stages of development of transplants. It involved 3 planting dates and 2 times of treatment with simulated hail. In theory, this is a logical approach for treating plants at various stages of development. However, in practice, date of planting itself can and usually does infl_uence the rate of plant development and total yield and this does complicate interpretation and comparison of certain results. An additional confounding factor is that larger plants are more difficult to defoliate because of the protection of the lower foliage by the top leaves, stems and fruits. More crushed ice is required, but it was still not possible to achieve more than about 65% defoliation from Stage 5 and later in 1987 and I988. Thus, during the development of the relationships between defoliation and yield be regression analyses, the missing data of the higher levels of defoliation appear to give misleading results.
The results from single row treatments appear to be the most reliable (Figs. 9, 10, II and Table 4). Single row culture was present all 3 seasons and
I4
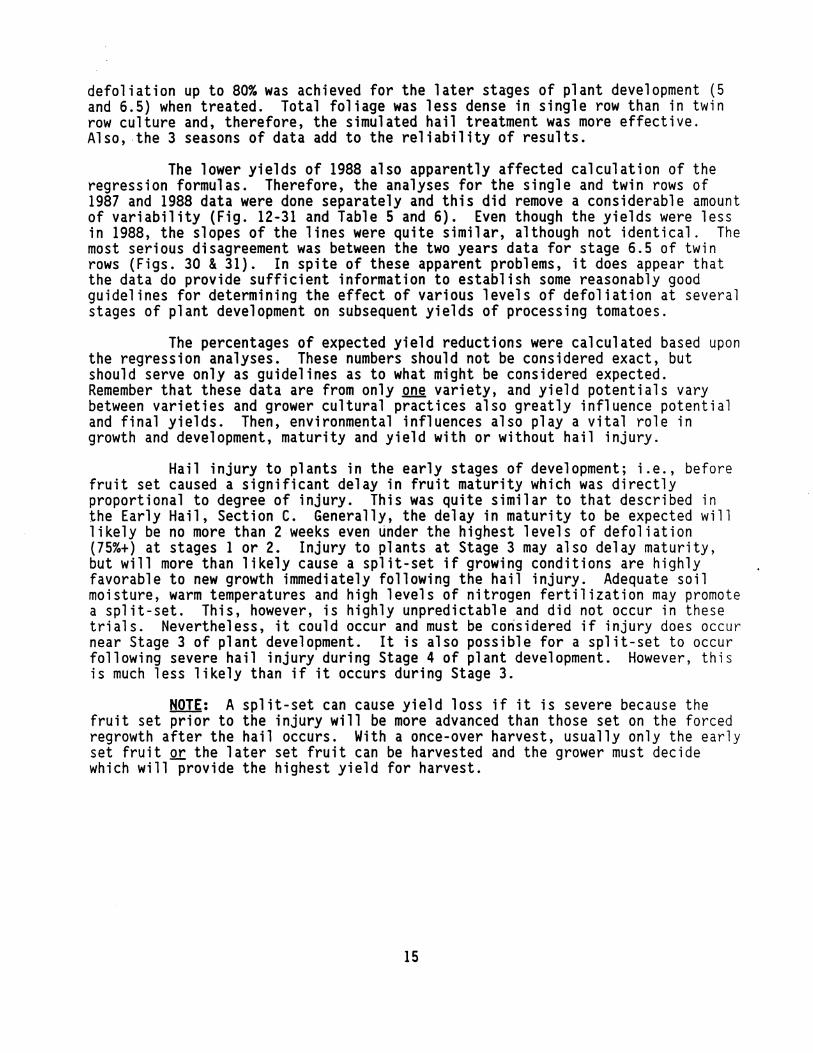
defoliation up to 80% was achieved for the later stages of plant development (5 and 6.5) when treated. Total foliage was less dense in single row than in twin row culture and, therefore, the simulated hail treatment was more effective. Also, the 3 seasons of data add to the reliability of results.
The lower yields of 1988 also apparently affected calculation of the regression formulas. Therefore, the analyses for the single and twin rows of 1987 and 1988 data were done separately and this did remove a considerable amount of variability (Fig. 12-31 and Table 5 and 6). Even though the yields were less in 1988, the slopes of the lines were quite similar, although not identical. The most serious disagreement was between the two years data for stage 6.5 of twin rows (Figs. 30 & 31). In spite of these apparent problems, it does appear that the data do provide sufficient information to establish some reasonably good guidelines for determining the effect of various levels of defoliation at several stages of plant development on subsequent yields of processing tomatoes.
The percentages of expected yield reductions were calculated based upon the regression analyses. These numbers should not be considered exact, but should serve only as guidelines as to what might be considered expected. Remember that these data are from only QOg variety, and yield potentials vary between varieties and grower cultural practices also greatly influence potential and final yields. Then, environmental influences also play a vital role in growth and development, maturity and yield with or without hail injury.
Hail injury to plants in the early stages of development; i.e., before fruit set caused a significant delay in fruit maturity which was directly proportional to degree of injury. This was quite similar to that described in the Early Hail, Section C. Generally, the delay in maturity to be expected will likely be no more than 2 weeks even ~nder the highest levels of defoliation (75%+) at stages 1 or 2. Injury to plants at Stage 3 may also delay maturity, but will more than likely cause a split-set if growing conditions are highly favorable to new growth immediately following the hail injury. Adequate soil moisture, warm temperatures and high levels of nitrogen fertilization may promote a split-set. This, however, is highly unpredictable and did not occur in these trials. Nevertheless, it could occur and must be corisidered if injury does occur near Stage 3 of plant development. It is also possible for a split-set to occur following severe hail injury during Stage 4 of plant development. However, this is much less likely than if it occurs during Stage 3.
NOTE: A split-set can cause yield loss if it is severe because the fruit set prior to the injury will be more advanced than those set on the forced regrowth after the hail occurs. With a once-over harvest, usually only the early set fruit or the later set fruit can be harvested and the grower must decide which will provide the highest yield for harvest.
15

50
40
w a: 30 (.) <( -(/)
20 z 0 1-
10
0
Fig. 8.
STAND EFFECTS ON TOTAL YIELD
f'2 95+%
IEl 85%
B 70%
J
1987 1988 1987 1988
SINGLE ROWS TWIN ROWS
Effects of stand on total yield of tomato transplants. Plants were removed randomly to give the desired stands and at the same plant stages as in the early hail treatments. Plant stage had no influence on total yield or maturity; therefore, data are means of the two stages, 1987 and 1988.
Table 3. Effect of stand on total yield and yield reduction of tomato transplants. Plants removed at Stages 1 and 2 of plant development, 1987-1988.
Single Rows Twin Rows Stand TonsL:A TonsL:A % 1987 1988 1987 1988
95+ 41.0 24.7 46.3 33.9 85 38.6 22.5 41.5 32.1 70 35.1 19.0 41.6 26.6
Decrease (%)* Decrease (%}* 85 5.9 8.9 10.4 5.6 70 14.4 23.1 10.2 21.5
*Compared to controls at 95+% stand.
16

TOTAL YIELD SINGLE ROWS 1986-87-88
e
w 30 a: a 0 <( -(/) 20 • :z 0 ....
10
0 20 40 60 80 100
% DEFOLIATION
TOTAL YIELD DECREASE SINGLE ROWS STAGE 2, 1986-88
w en <( w a: 0 w 0
<fl.
100
90
80
70
60
50
40
30
20
10
0 10 20 30 40 50 60 70 80 90 100
%DEFOLIATION
Fig. 9. Influence of hail injury on total yield of single-row transplants for 3 season, 1986, 1987 and 1988.
17
STAGE2
STAGE3
STAGE4
STAGES
STAGE6.5

TOTAL YIELD DECREASE SINGLE ROWS STAGE 3, 1986-88
w (f)
< w a: (.) w c ~ 0
100
90
80
70
60
so 40
30
20
10
0 10 20 30 40 50 60 70 80 90 100
%DEFOLIATION
TOTAL YIELD DECREASE SINGLE ROWS STAGE 4, 1986-88
w (f)
< w a: (.) w c ~ 0
100
90
80
70
60
50
40
30
20
10
0 10 20 30 40 so 60 70 80 90 100
%DEFOLIATION
Fig. 10. Effects of hail injury on percent yield reduction of single-row transplants for 3 season, 1986, 1987 and 1988.
18

TOTAL YIELD DECREASE SINGLE ROWS STAGE 5, 1986-88
w (/)
<C w a: u w c ::::e 0
100
90
80
70
60
so 40
30
20
10
0
10 20 30 40 so 60 70 80 90 100
%DEFOLIATION
TOTAL YIELD DECREASE SINGLE ROWS STAGE 6.5, 1986-88
w (/)
<C w a: u w c ::::e 0
100
90
80
70
60
50
40
30
20
10
0 1 0 20 30 40 50 60 70 80 90 100
%DEFOLIATION
Fig. 11. Effects of hail injury on percent yield reduction of single-row transplants for 3 seasons, 1986, 1987 and 1988.
19

Table 4. Influence of hail injury to total yield of transplanted tomatoes in single row culture, 1986, 1987 and 1988*.
Stage 2 Stage 3 Stage 4 Stage 5 Stage 6.5 De f. Tons/ Dec. Tons/ Dec. Tons/ Dec. Tons/ Dec. Tons/ Dec. (%) A (%) A (%) A (%) A (%) A (%)
1 34.2 33.8 31.3 34.9 29.3 10 34.8 - 1.6 32.8 2.9 30.4 2.9 32.9 5.4 28.9 1.4 20 35.1 - 2 .·4 31.8 5.7 29.1 7.0 30.7 11.8 28.2 3.9 30 35.0 - 2.4 31.0 8.1 27.6 11.8 28.4 18.3 27.1 7.5 40 34.7 - 1.3 30.4 9.9 25.9 17.3 26.0 25.2 25.8 12. 1 50 34.0 0.5 30.0 11.2 23.9 23.6 23.6 32.3 24.1 17.7 60 33.0 3.5 29.7 11.9 21.7 30.7 21.0 39.6 22.2 24.4 70 31.7 7.3 29.6 12.2 19.2 38.5 18.3 47.2 19.9 32.0 80 30.0 12.2 29.7 12.0 16.5 47.1 15.6 55.1 17.4 40.7 90 28.0 18.0 29.9 11.3 13.6 56.4 12.8 63.2 14.5 50.4
. 100 25.7 24.7 30.4 10.0 10.4 66.5 9.8 71.6 11.4 61.1
*Data generated from regression analyses of original re-sults.
20

TOTAL YIELD SINGLE ROWS STAGE 2, 1987
50 y = 30.427 + 3.2587e-2x R"2 = 0.107
40
• • UJ • • . a: 30 • • (..) • c( -en 20 z 0 1-
10
0 0 20 40 60 80 100
% DEFOLIATION
TOTAL YIELD DECREASE SINGLE ROWS STAGE 2, 1987
w rn < w a: 0 w c
100~-----------------------------,
90
80
70-
60
50
40
30
20-
10-
o-+---..--....... ---.--....... ---...---,------.-----t 10 20 30 40 50 60 70 80 90100
% DEFOLIATION
Fig. 12. Influence of hail injury at stage 2 on total yield and yield decrease of single rows, 1987.
21

TOTAL YIELD SINGLE ROWS STAGE 2, 1988
50
y = 25.912 - 5.8325e-2x R112 = 0.268
40
w a: 30 0 oct -en
• I • • • z 20 0 ~
• • 10
0 0 20 40 60 80 1 00
% DEFOLIATION
TOTAL YIELD DECREASE SINGLE ROWS STAGE 2, 1988
w en oct w a: 0 w 0
~ 0
100
90
80
70
60
50
40
30
20
10
0 10 20 30 40 50 60 70 80 90 100
% DEFOLIATION
Fig. 13. Influence of hail injury at stage 2 on total yield and yield decrease of single rows. 1988.
22
w a: 0 < -en z 0 .....
TOTAL ROWS SINGLE ROWS STAGE 3, 1987
50 y = 39.810 - 9.7532e-2x R"2 = 0.367
40 • • •
30 • •
20
10
0 0 20 40 60 80 1 00
% DEFOLIATION
TOTAL YIELD DECREASE SINGLE ROWS STAGE 3, 1987
w en < w a: 0 w 0
:::!? 0
100
90
80
70
60
50
40
30
20
10
0 10 20 30 40 50 60 70 80 90 100
o/o DEFOLIATION
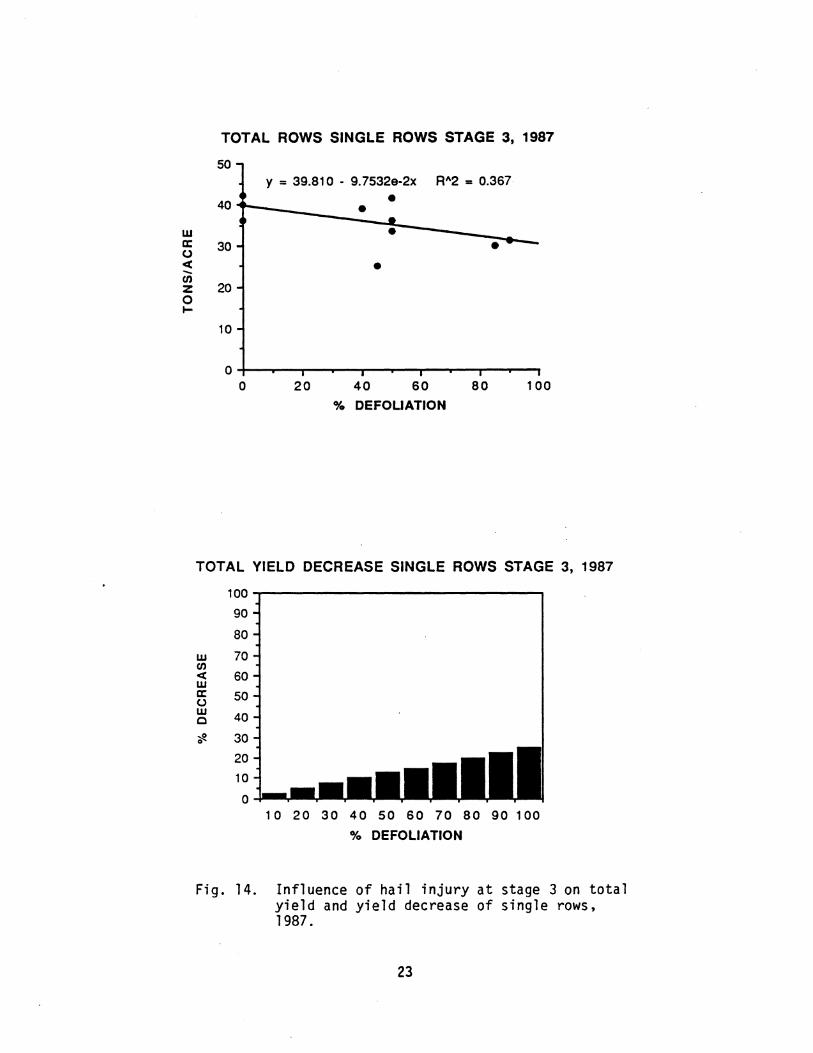
Fig. 14. Influence of hail injury at stage 3 on total yield and yield decrease of single rows, 1987.
23

TOTAL YIELD SINGLE ROWS STAGE 3, 1988
50
y = 23.022 - 8.8374e-2x R-'2 = 0.572
40
w a:
30 0 ~ - • 0 • z 20 • 0 • • • 1-
• 10
0 0 20 40 60 80 100
% DEFOLIATION
TOTAL YIELD DECREASE SINGLE ROWS STAGE 3, 1988
w 0 ~ w a: 0 w 0
~ 0
100
90
80
70
60
50
40
30
20
10
0 10 20 30 40 50 60 70 80 90 100
% DEFOLIATION
Fig. 15. Influence of hail injury at stage 3 on total yield and yield decrease of single rows, 1988.
24

TOTAL YIELD SINGLE ROWS STAGE 4, 1987
50 y = 36.772 - 0. 19467x R"2 = 0.888
40
w a:
30 0 ct -en z 20 0 1-
10
0 0 20 40 60 80 100
% DEFOLIATION
TOTAL YIELD DECREASE SINGLE ROWS STAGE 4, 1987
w en ct w a: 0 w 0
~ 0
100
90
80
70
60
50
40
30
20
10
0 1 0 20 30 40 50 60 70 80 90 100
% DEFOLIATION
Fig. 16. Influence of hail injury at stage 4 on total yield and yield decrease of single rows, 1987.
25

w a: u c( ..... tJ)
z 0 1-
TOTAL YIELD SINGLE ROWS STAGE 4, 1988
50 y = 26.474 - 0.14302x R112 = 0.567
40
30
20
10
0 0 20 40 60 80 100
o/o DEFOLIATION
TOTAL YIELD DECREASE SINGLE ROWS STAGE 4, 1988
w tJ) c( w a: u w 0
~ 0
100
90
80
70
60
50
40
30
20
10
0 10 20 30 40 50 60 70 80 90 100
o/o DEFOLIATION
Fig. 17. Influence of hail injury at stage 4 on total yield and yield decrease of single rows, 1988. 26

w a: (.) <C -en z 0 ~
TOTAL YIELD SINGLE ROWS STAGE 5, 1987
50
y = 38.243 - 0.17761 X RA2 = 0.438
40 • 30
20
10
0 0 20 40 60 80 100
% DEFOLIATION
TOTAL YIELD DECREASE SINGLE ROWS STAGE 5, 1987
w en <C w a: (.) w 0
~ 0
100
90
80
70
60
50
40
30
20
10
0 10 20 30 40 50 60 70 80 90 100
% DEFOLIATION
Fig. 18. Influence of hail injury at stage 5 on total yield and yield decrease of single rows, 1987.
27

TOTAL YIELD SINGLE ROWS STAGE 5, 1988
50
y = 22.636 - 0.1 0740x R"2 = 0.438
40
w a: 30 (.)
< .... en z 0
20 • • .... •
10
0 0 20 40 60 80 100
% DEFOLIATION
TOTAL YIELD DECREASE SINGLE ROWS STAGE 5, 1988
w en < w a: (.) w 0
~ 0
100
90
80
70
60
50
40
30
20
10
0 10. 20 30 40 50 60 70 80 90 100
% DEFOLIATION
Fig. 19. Influence of hail injury at stage 5 on total yield and yield decrease of single rows, 1988.
28

TOTAL YIELD SINGLE ROWS STAGE 6.5, 1987
50 y = 35.289 - 0.19677x A"2 = 0.677
40
w a:
30 ()
< -tJ)
z 20 0 .... 10
0 0 20 40 60 80 100
% DEFOLIATION
TOTAL YIELD DECREASE SINGLE ROWS STAGE 6.5, 1987
w tJ)
< w a: () w 0
~ 0
100
90
80
70
60
50
40
30
20
10
0 10 20 30 40 50 60 70 80 90100
% DEFOLIATION
Fig. 20. Influence of hail injury at stage 6.5 on total yield and yield decrease of single rows, 1987.
29

TOTAL YIELD SINGLE ROWS STAGE 6.5, 1988
50 y = 24.133 - 0.11 058x R"2 = 0.264
40
w a: 0 30 c:t • --en • z
20 0 1- • •
10
0 0 20 40 60 80 100
% DEFOLIATION
TOTAL YIELD DECREASE SINGLE ROWS STAGE 6.5, 1988
w rn c:t w a: (.) w 0
::e 0
100
90
80
70
60
50
40
30
20
10
0 10 20 30 40 50 60 70 80 90 100
% DEFOLIATION
Fig. 21. Influence of hail injury at stage 6.5 on total yield and yield decrease of single rows, 1988.
30

TOTAL YIELD TWIN ROWS STAGE 2, 1987
50 y. = 29.956 - 1.7503e-2x R"2 = 0.015
40
• •• w cc
30 • 0 < • - • C/) • • z 20 0 ....
10
0 0 20 40 60 80 100
% DEFOLIATION
TOTAL YIELD DECREASE TWIN ROWS STAGE 2, 1987
w C/)
< w a: 0 w 0
~ 0
100
90
80
70
60
50
40
30
20
10
0 10 20 30 40 50 60 70 80 90100
% DEFOLIATION
Fig. 22. Influence of hail injury at stage 2 on total yield and yield decrease of twin rows, 1987.
31

w a: 0 c(
(i)
TOTAL YIELD TWIN ROWS STAGE 2, 1988
50
y = 33.907 - 0.13986x R-"2 = 0.466
40
30 • • • •
z 20 0 .... • •
10
o~~~~--~~--~~~~--~~--~
0 20 40 60 80 100
o/o DEFOLIATION
TOTAL YIELD DECREASE TWIN ROWS STAGE 2, 1988
w en <( w a: (.) w 0
~ 0
100
90
80
70
60
50
40
30
20
10
0 10 20 30 40 50 60 70 80 90 100
o/o DEFOLIATION
Fig. 23. Influence of hail injury at stage 2 on total yield and yield decrease of twin rows, 1988.
32

TOTAL YIELD DECREASE TWIN ROWS. STAGE 3, 1987
w en ct w a: u w 0
~ 0
100
90
80
70
60
50
40
30
20
10
0 1 0 20 30 40 50 60 70 80 90 100
% DEFOLIATION
Fig. 24. Influence of hail injury at stage 3 on total yield and yield decrease of twin rows, 1987.
33

w a: 0 ct --en z 0 1-
TOTAL YIELD TWIN ROWS STAGE 3, 1988
50 y = 33.479 • 0.1 0522x RA2 = 0.774
40
30
20
10
o~~~~--~~--~~--~--~~~
0 20 40 60 80 100
% DEFOLIATION
TOTAL YIELD DECREASE TWIN ROWS STAGE 3, 1988
w en ct w a: 0 w 0
~ 0
100
90
80
70
60
50
40
30
20
10
0 10 20 30 40 50 60 70 80 90100
% DEFOLIATION
Fig. 25. Influence of hail injury at stage 3 on total yield and yield decrease of twin rows, 1988.
34

w a: (.)
< u; z 0 ....
TOTAL YIELD TWIN ROWS STAGE 4, 1987
50 y = 34.553 - 0.18971 X RA2 .. 0.569
40
30
20
10;-~~-r--~~--~~~~--~~--~
0 20 40 60 80 100
% DEFOLIATION
TOTAL YIELD DECREASE TWIN ROWS STAGE 4, 1987
w (/)
< w a: (.) w 0
~ 0
100
90
80
70
60
50
40
30
20
10
0 10 20 30 40 50 60 70 80 90100
% DEFOLIATION
Fig. 26. Influence of hail injury at stage 4 on total yield and yield decrease of twin rows, 1987.
35

TOTAL YIELD TWIN ROWS STAGE 4, 1988
50
40
w ~ 30 ct c;; z 20 0 1-
10
0
y = 31.848 - 0.18744x RA2 = 0.358
•
I
20 40 60 80 100
o/o DEFOLIATION
TOTAL YIELD DECREASE TWIN ROWS STAGE 4, 1988
w en ct w a: 0 w 0
"#.
100
90
80
70
60
50
40
30
20
10
0 1 0 20 30 40 50 60 70 80 90 100
% DEFOLIATION
Fig. 27. Influence of hail injury at stage 4 on total yield and yield decrease of twin rows, 1988.
36

TOTAL YIELD TWIN ROWS STAGE 5, 1987
so y = 39.611 - 0.28312x R"2 = 0.465
40
w a: 30 (.)
< c;; z 20 0 ....
10
0 20 40 60 80 100
% DEFOLIATION
TOTAL YIELD DECREASE TWIN ROWS STAGE 5, 1987
w UJ < w a: (.) w 0
~ 0
100
90
80
70
60
so 40
30
20
10
0 1 0 20 30 40 so 60 70 80 90 100
% DEFOLIATION
Fig. 28. Influence of hail injury at stage 5 on total yield and yield decrease of twin rows, 1987.
37
w a: (.) c( -en z 0 1-
TOTAL YIELD TWIN ROWS STAGE 5, 1988
50
y = 33.009 - 0.11148x RA2 = 0.548
40
30
20
10
0 20 40 60 80 100
o/o DEFOLIATION
TOTAL YIELD DECREASE TWIN ROWS STAGE 5, 1988
w en <t w a: (.) w 0
~ 0
100
90
80
70
60
50
40
30
20
10
0 1 0 20 30 40 50 60 70 80 90 100
o/o DEFOLIATION
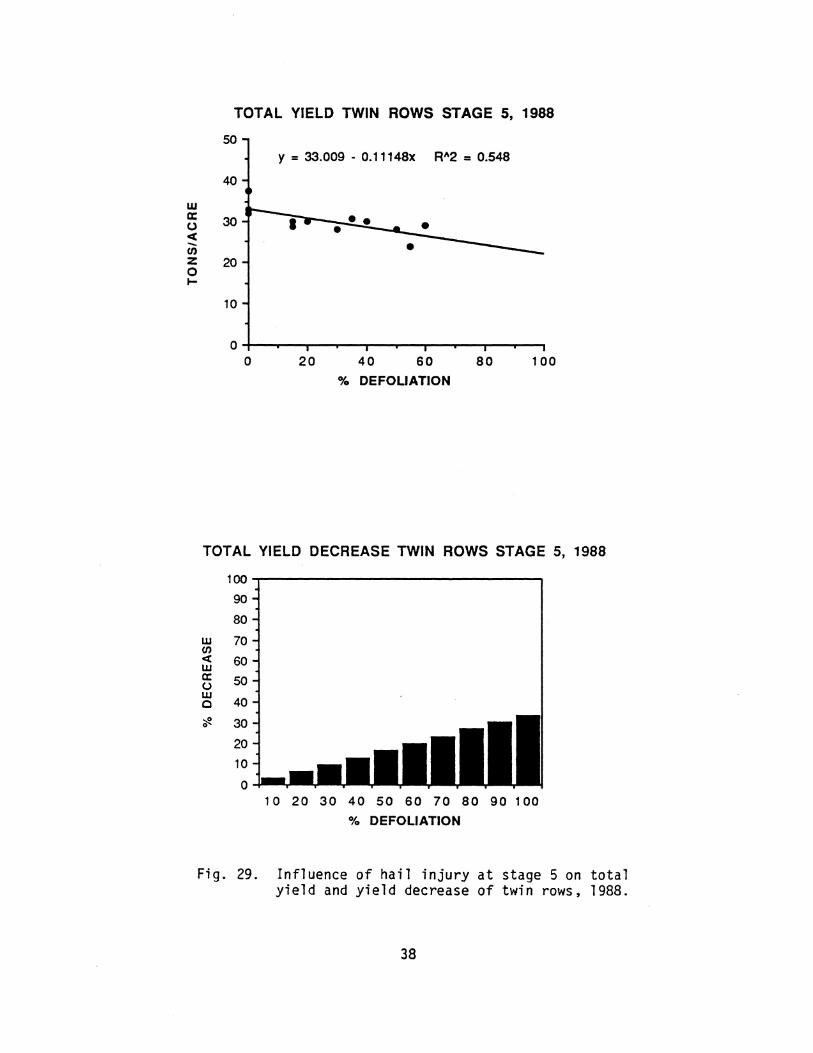
Fig. 29. Influence of hail injury at stage 5 on total yield and yield decrease of twin rows, 1988.
38

TOTAL YIELD TWIN ROWS STAGE 6.5, 1987
50 y == 34.447 - 0.24723x R112 == 0.782
40
w a: 30 0 ~ -en z 20 0 1-
10
0 0 20 40 60 80 100
% DEFOLIATION
TOTAL YIELD DECREASE TWIN ROWS STAGE 6.5, 1987
w (/) ~ w a: 0 w c ~ 0
100
90
80
70
60
50
40
30
20
10
0 10 20 30 40 50 60 70 80 90100
% DEFOLIATION
Fig. 30. Influence of hail injury at stage 6.5 on total yield and yield decrease of twin rows, 1987.
39

TOTAL YIELD TWIN ROWS STAGE 6.5, 1988
50 y = 25.614 + 1.1452e-4x R"2 = 0.000
40
w a:
30 (.) • • • <t • .._ • en z 20 • 0 • ....
10
0 0 20 40 60 80 100
% DEFOLIATION
TOTAL YIELD DECREASE TWIN ROWS STAGE 6.5, 1988
w en <t w a: (.) w c ~ 0
100
90-
80-
70-
60-
50-
40-
30-
20-
10-
0 1 0 2 0 3 0 4 0 50 6 0 7 0 8 0 9 0 1 00
o/o DEFOLIATION
Fig. 31. Influence of hail injury at stage 6.5 on total yield and yield decrease of twin rows, 1988. 40

Table 5. Influence of hail injury on total yield of transplanted tomatoes grown in single row culture, 1987 & 1988*.
~tage 2 Stage ·3 Stage 4 Stage 5 Stage 6.5 Def. Tons/ Dec. Tons/ Dec. Tons/ Dec. Tons/ Dec. Tons/ Dec. {%} A {%} A {%} A {%} A {%} A (%}
1987
1 30.4 39.7 36.5 38.0 35.0 10 30;7 - 0.9 38.8 2.8 34.8 4.7 36.4 4.2 33.3 5.0 20 31.7 - 2.0 37.8 5.3 32.8 10.1 34.7 8.8 31.3 10.6 30 31.4 - 3.1 36.8 7.7 30.9 15.4 32.9 13.5 29.3 16.2 40 31.7 - 4.1 35.9 10.2 28.9 20.7 31.1 18.2 27.4 21.8 50 32.0 - 5.2 34.9 12.6 27.0 26.0 29.3 22.8 25.4 27.4 60 32.3 - 6.3 33.9 15.1 25.1 31.4 27.5 27.5 23.4 33.0 70 32.7 - 7.3 32.9 17.6 23.1 36.7 25.8 32.2 21.5 38.6 80 33.0 - 8.4 32.0 20.0 21.2 42.0 24.0 36.8 19.5 44.3 90 33.3 - 9.5 31.0 22.5 19.2 47.3 22.2 41.5 17.5 49.9
100 33.6 -10.5 30.0 24.9 17.3 52.6 20.4 46.2 15.6 55.5
1988
1 25.8 22.9 26.3 22.5 24.0 10 25.3 2.0 22.1 3.4 25.0 4.8 21.5 4.2 23.0 4.1 20 24.7 4.2 21.2 7.3 23.6 10.3 20.4 9.0 21.9 8.7 30 24.1 6.5 20.3 11.1 22.1 15.7 19.4 13.8 20.8 13.3 40 23.5 8.7 19.4 15.0 20.7 21.1 18.3 18.5 19.7 17.9 50 22.9 11.0 18.6 18.8 19.3 26.6 17.2 23.3 18.6 22.5 60 22.4 13.3 17.7 22.7 17.8 32.0 16.1 28.1 17.4 27.1 70 21.8 15.5 16.8 26.5 16.4 37.4 15.1 32.8 16.3 31.7 80 21.2 17.8 15.9 30.4 15.0 42.9 14.0 37.6 15.2 36.3 90 20.6 20.0 15.0 34.3 13.6 48.3 12.9 42.4 14.1 40.9
100 20.0 22.3 14.1 38.1 12.2 53.7 11.8 47.1 13.0 45.5
*Data generated from regression analyses of original results.
41

Table 6. Influence of hail injury on total yield of transplanted tomatoes grown in twin row culture, 1987 & 1988*.
Stage 2 Stage 3 Stage 4 Stage 5 Stage 6.5 Def. Tons/ Dec. Tons/ Dec. Tons/ Dec. Tons/ Dec. Tons/ Dec. {%} A {%} A {%} A '%} A {%} A {%}
1987
1 29.9 36.3 34.3 39.2 34.2 10 29.7 0.5 35.8 1.3 32.6 4.9 36.7 6.4 31.9 6.5 20 29.6 1.1 35.3 2.7 30.7 10.4 33.9 13.6 29.5 13.7 30 29.4 1.6 34.7 4.2 28.8 16.0 31.1 20.8 27.0 20.9 40 29.2 2.2 34.2 5.6 26.9 21.5 28.2 28.0 24.5 28.1 50 29.0 2.8 33.7 7.1 25.0 27.0 25.4 35.2 22.0 35.4 60 28.9 3.4 33.2 8.5 23.1 32.5 22.6 42.4 19.6 42.6 70 28.7 4.0 32.6 10.0 21.2 38.0 19.7 49.6 17.1 49.8 80 28.5 4.6 32.1 11.4 19.3 43.6 16.9 56.8 14.6 57.1 90 28.3 5.2 31.6 12.9 17.4 49.1 14.1 64.0 12.1 64.3
100 28.2 5.7 31.0 14.3 15.5 54.6 11.3 71.2 9.7 71.5
1988
1 33.7 33.3 31.6 32.8 25.6 10 32·.5 3.7 32.4 2.8 29.9 5.3 31.8 3.0 25.7 - 0.4 20 31'.1 7.8 31.3 5.9 28.1 11.2 30.7 6.4 25.8 - 0.8 30 29.7 12.0 30.3 9.1 26.2 17.1 29.6 9.8 25.9 - 1. 2 40 28.3 16.1 29.2 12.2 24.3 23.0 28.5 13.2 26.0 - 1. 7 50 26.9 20.3 28.2 15.4 22.4 29.0 27.4 16.6 26.1 - 2. 1 60 25.5 24.4 27.1 18.5 20.6 34.9 26.3 19.9 26.2 - 2.6 70 24.1 28.5 26.1 21.7 18.7 40.8 25.2 23.3 26.4 - 3.0 80 22.7 32.7 25.0 24.9 16.8 46.7 24.0 26.7 26.5 - 3.5 90 21.3 36.8 24.0 28.0 14.9 52.6 22.9 30.1 26.6 - 3.9
100 19.9 41.0 22.9 31.2 13.1 58.5 21.8 33.5 26.7 - 4.4
*Data are generated from regression analyses of original results.
42

F. Hail Effects on Direct Seeded Tomatoes
This part of the study was the least extensive, but the results were somewhat surprising. The first observation was that the seeded plants were very difficult to defoliate because of the limber, whippy nature of the plants regardless of the stage of plant development. The plants also had generally denser foliage than transplants and this prevented high levels of defoliation at later stages of development. However, yields were reduced at stages where flowers were setting and during fruit development. Injury during the early stages generally resulted in delayed maturity, but no reductions in total yield. This can be serious however, because seeded tomatoes are naturally later maturing than transplanted crops and a significant delay in maturity can result in crop loss because of freeze or chilling temperature injury or early fall rains precluding harvest.
Precise times of delay from hail injury were not determined, but observations suggest that the potential delay could be up to 3 weeks from severe injury (75%+ defoliation) during Stages 1 and 2. This i's because of the general late maturity during the cooler late season which naturally requires more days for ripening than warmer temperatures earlier in the season.
Yield data and predicted yield reduction data (Fig. 32-37 and Table 7) should provide guidelines for establishing relationships between severity of defoliation from hail at various stages of plant development and potential total yield for field seeded processing tomatoes.
43

w a: 0 < -en z 0 t-
w a: 0 < -en z 0 t-
TOTAL YIELD SEEDED 1987
60
-e-- STAGE3 50
--+- STAGES
40
30
20
10
0 0 20 40 60 80 100
% DEFOLIATION
TOTAL YIELD SEEDED 1988
60
50 ---o-- STAGE 1
--+- STAGE3
40 -D-- STAGES
30
20
10
0 0 20 40 60 80 100
% DEFOLIATION
Fig. 32. Influence of hail injury on total yield of field-seeded processing tomatoes, 1987 and 1988.
44

w a: (.)
<: -(/) z 0 .....
w (/)
<: w a: (.) w a ~ 0
60
50
40
30
20
10
0
100
90
80
70
60
so 40
30
20
10
0
TOTAL YIELD SEEDED STAGE 3, 1987
y = 42.662 - 5.7787e-2x RA2 = 0.069 •
• • • •
•
0 20 40 60 80 100
% DEFOLIATION
TOTAL YIELD SEEDED STAGE 3, 1987
10 20 30 40 50 60 70 80 90 100
% DEFOLIATION
Fig. 33. Influence of hail injury at stage 3 on total yield of field seeded tomatoes, 1987.
45

w ·a: (..)
<t -en z 0 1-
w en <t w 0: (..) w 0
~ 0
60
100
90
80
70
60
50
40
30
20
10
0
TOTAL YIELD SEEDED STAGE 5, 1987
y = 45.254 - 0.41776x Rl\2 = 0. 71 o
0 1 0 20 30 40 so 60 70 80 90 100
% DEFOLIATION
TOTAL YIELD SEEDED STAGE 5, 1987
10 20 ·30 40 50 60 70 80 90 100
% DEFOLIATION
Fig. 34. Influence of hail injury at stage 5 on total yield of field seeded tomatoes, 1987.
46

w a: 0 ~ -(/) z 0 1-
w (/) ~ w a: 0 w 0
~ 0
60
50
40
30
20
10
0
100
90
80
70
60
50
40
30
20
10
0
TOTAL YIELD SEEDED STAGE 1, 1988
0
y = 36.963 - 1.0995e-2x R"2 = 0.017
• • • • •• • •
20 40 60 80 100
% DEFOLIATION
TOTAL YIELD SEEDED STAGE 1, 1988
10 20 30 40 50 60 70 80 90100
% DEFOLIATION
Fig. 35. Influence of hail injury at stage 1 on total yield of field seeded tomatoes, 1988.
47
w a: (.) <( -(/) z 0 1-
UJ (/) <( UJ a: (.) w a ~ 0
TOTAL YIELD SEEDED STAGE 3, 1988
60
y = 36.578 - 0.17472x Rl\2 = 0.509
50
40
30
20
10
0~--~~--~--r--T--~~~-r--~~
100
90
80
70
60
50
40
30
20
10
0
0 20 40 60 80 100
% DEFOLIATION
TOTAL YIELD SEEDED STAGE 3, 1988
1 0 20 30 40 50 60 70 80 90 100
% DEFOLIATION
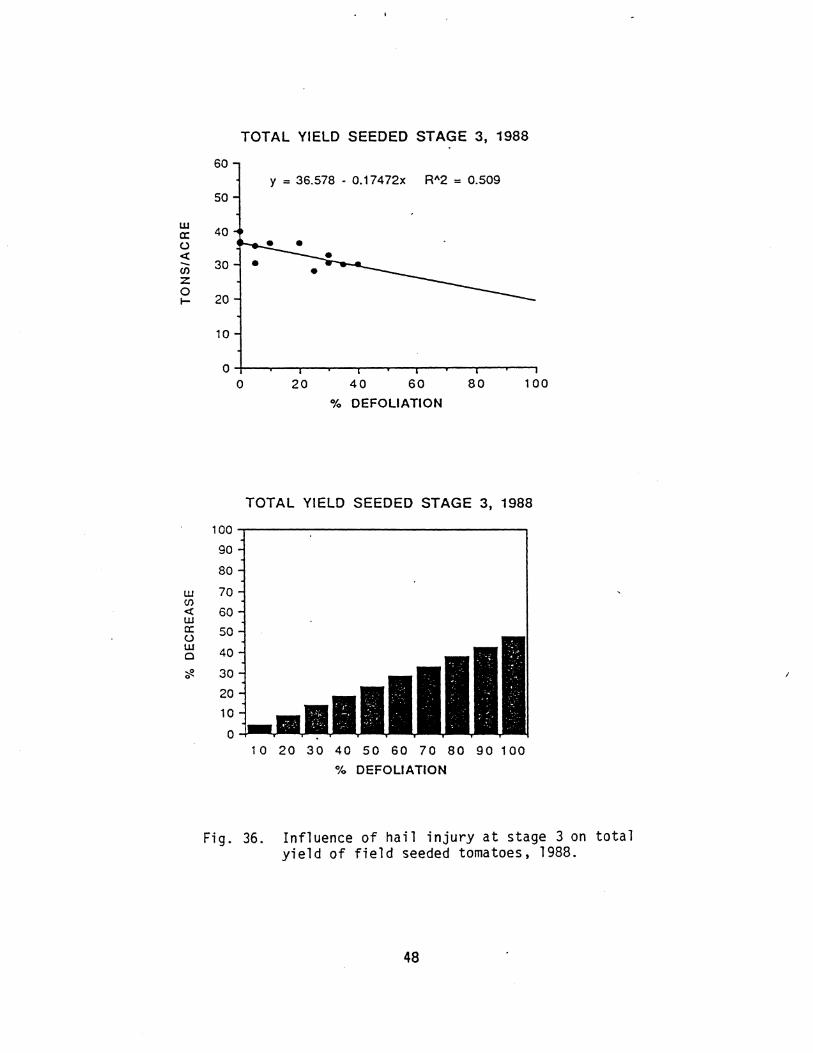
Fig. 36. Influence of hail injury at stage 3 on total yield of field seeded tomatoes, 1988.
48

w a: 0 <C -en z 0 ....
w en <C w a: 0 w 0
~ 0
60
50
40
30
20
10
0
100
90
80
70
60
50
40
30
20
10
0
TOTAL YIELD SEEDED STAGE 5, 1988
0
y = 36.665 - 0.14553x Rl\2 = 0.610
•
20 40 60 80 100
% DEFOLIATION
TOTAL YIELD SEEDED STAGE 5, 1988
10 20 30 40 50 60 70 80 90 100
% DEFOLIATION
Fig. 37. Influence of hail injury at stage 5 on total yield of field seeded tomatoes, 1988.
49

G. Processor In-put to Hail Injury of Fruits
Hail damage is always of concern to tomato processors because it can lead to direct losses in yield and to scheduling problems from effects on maturity. However, more serious is the effect of fruit injury on development of fruit rots and surface molds which can prevent the fruit from being processed even though the injury is relatively slight. Therefore, hail injury after fruits are set and especially during the late ripening stages 7 and 8 of transplant and stage 6 of seeded crops must be considered serious and may results in total losses especially if conditions following injury favor mold and fruit disease development--usually warm and wet weather. Processor agricultural departments can assist in determining losses under these conditions.
Def. (%)
1 10 20 30 40 50 60 70 80 90
100
1 10 20 30 40 50 60 70 80 90
100
Table 7. Influence of hail injury on total yield of field seeded tomatoes grown in single row culture. 1987 and 1988*.
Stage 1 Tons/ Dec. A (%)
36.9 36.8 36.7 36.6 36.5 36.4 36.3 36.1 36.0 35.9 35.8
0.2 0.5 0.8 1.1 1.4 1.7 2.0 2.3 2.6 2.9
Stage 3 Tons/ Dec. A (%)
42.6 42.0 41.5 40.9 40.3 39.7 39.1 38.6 38.0 37.4 36.8
36.4 34.8 33.0 31.3 29.5 27.8 26.0 24.3 22.6 20.8 19.1
1.2 2.5 3.9 5.2 6.6 8.0 9.3
10.7 12.0 13.4
4.3 9 .1
13.9 18.7 23.5 28.3 33.1 37.9 42.7 47.5
Stage 5 Tons/ Dec. A (%)
44.8 41.0 36.8 32.7 28.5 24.3 20.1 16.1 11.8 7.6 3.4
36.5 35.1 35.2 32.3 30.8 29.3 27.9 26.4 25.0 23.5 22.1
8.3 17.7 27.0 36.3 45.6 54.9 64.2 73.6 82.9 92.2
3.5 7.5
11.5 15.5 19.5 23.5 27.4 31.4 35.4 39.4
*Data generated from regression analyses of original results.
50

H. Summary
A study to determine the effects of simulated hail injury as measured by plant defoliation on processing tomato plant development, fruit maturity and yield was conducted in 1986, 1987 and 1988. Most of the work was done at the OSU/OARDC Vegetable Crops Branch near Fremont, Ohio, which is in a major production area. The simulated hail injury was accomplished by blowing crushed ice at the plants. It was quite effective and did indeed resemble actual hail injury.
The 3 different planting dates and the 2 dates of applying the hail treatments each of the 3 seasons provided the opportunity to treat the plants at several stages of plant development. Results were confounded by this somewhat because planting date does itself influence yield and fruit maturity.
Results are presented as effects of hail (percent estimated defoliation) on total yield and not on ripe, green or rotted fruit yield. The time of harvest has a great influence on these yield factors and it was not possible to harvest each season at precisely the same time in the fruit ripening stage. These additional data are included in a separate publication as an Appendix to this report.
The results reveal generally that hail injury occurring during the early plant development stages has little influence on total fruit yield, but many delay fruit maturity for up to about 2 weeks depending upon growing conditions following the injury. Hail injury that occurs during the fruit setting, fruit accumulation and ripening stages usually results in yield reductions in direct proportion to severity of defoliation (injury). It should be noted here that hail injury during the fruit ripening period may result in total rejection by the processor because of mold invasion of the fruits to unacceptable levels.
51

This page intentionally blank.

This page intentionally blank.