effects of replacing animal protein with plant protein … · dash – dietary approaches to stop...
TRANSCRIPT

Effects of Replacing Animal Protein with Plant Protein on Glycemic Control in Individuals with
Diabetes
By
Effie Viguiliouk
A thesis submitted in conformity with the requirements
for the degree of Master of Science
Graduate Department of Nutritional Sciences
University of Toronto
© Copyright by Effie Viguiliouk (2015)
ii
Effects of Replacing Animal Protein with Plant Protein on Glycemic Control in Individuals with
Diabetes
Effie Viguiliouk
Master of Science
Department of Nutritional Sciences
University of Toronto
2015
ABSTRACT
The objective was to conduct a systematic review and meta-analysis (SRMA) of randomized
controlled trials (RCTs) to assess the effect of replacing animal with plant protein on glycemic control in
diabetes and to perform a cross-sectional study using baseline data from 5 RCTs to assess the
relationship between replacing animal with plant protein on HbA1c in type 2 diabetes. The SRMA of 12
trials (n=240) showed diets emphasizing replacement of animal with major plant protein sources
significantly lowered HbA1c, fasting glucose and fasting insulin compared with control diets. Our cross-
sectional study (n=627) showed substitution of animal with plant protein was not associated with HbA1c
change. Overall, the results suggest that replacement of animal with plant protein leads to modest
improvements in glycemic control in diabetes, however research is needed to address the limitations of
our SRMA and lack of agreement with the associations seen in our cross-sectional study.
Abstract word count: 148

iii
ACKNOWLEDGMENTS
First and foremost I would like to thank my family for their unconditional love and support, and for
believing in me more than I believe in myself. Without them I do not know where I would be. They have
taught me the value of hard work, perseverance and the courage to take chances. I would also like to
take this opportunity to thank the friends who have always been there and for the new ones I have
made for keeping me grounded and teaching me to appreciate the little things in life.
Second, I would like thank and express my appreciation for my committee members Dr. Anthony
Hanley, Dr. Richard Bazinet and Dr. Russell de Souza for taking the time to guide and support me
throughout the course of my MSc. I would like to also thank Christopher Ireland for spending endless
hours helping me with the logistics of my second project and for teaching me how to use SAS.
Third, I would like to thank my lab members Vivian Choo, Jay Jayalath, Vanessa Ha, Sarah Stewart,
Stephanie Nishi, Laura Chiavaroli, Sonia Blanco Mejia, Arash Mirrahimi, Adrian Cozma, Christine Tsilas,
Shana Kim and Shari Li for all the memories, laughter and for keeping me sane throughout this entire
process. Each and every one of you has touched me in some way and I am extremely grateful for having
you in my life.
Last but not least, I would like to express my gratitude and upmost appreciation for my supervisors Dr.
David Jenkins and Dr. John Sievenpiper for providing me with the opportunity to work with them. Dr.
Jenkins, I thank you for your mentorship and for teaching me the importance of considering how our
dietary habits impact our environment, which is something that has changed my life in many ways. And
John, thank you for believing in my capabilities and changing the trajectory of my life. You have provided
me with many opportunities for growth and development and I feel extremely grateful for your
unconditional support, mentorship, and inspiration.

iv
TABLE OF CONTENTS
ABSTRACT .............................................................................................................................. ii
ACKNOWLEDGMENTS ........................................................................................................... iii
TABLE OF CONTENTS ............................................................................................................. iv
LIST OF ABBREVIATIONS ....................................................................................................... vi
LIST OF FIGURES .................................................................................................................... ix
LIST OF TABLES ...................................................................................................................... x
CHAPTER I – INTRODUCTION .................................................................................................. 1
CHAPTER II – LITERATURE REVIEW ......................................................................................... 4
2.1 DIABETES .............................................................................................................................................5
2.1.1 PREVALENCE OF DIABETES ...........................................................................................................5
2.1.2 PATHOPHYSIOLOGY OF DIABETES ................................................................................................5
2.1.3 DIABETES COMPLICATIONS AND MORTALITY ..............................................................................6
2.1.4 DIABETES RISK FACTORS ...............................................................................................................6
2.1.5 DIAGNOSIS OF DIABETES ..............................................................................................................7
2.1.6 MEASURES OF GLYCEMIC CONTROL ............................................................................................7
2.1.7 PREVENTION AND MANAGEMENT OF DIABETES .........................................................................8
2.2 PLANT AND ANIMAL PROTEIN AND DIABETES ....................................................................................9
2.2.1 SOURCES OF PLANT AND ANIMAL PROTEIN IN THE DIET ............................................................9
2.2.2 POPULATION LEVELS OF PLANT AND ANIMAL PROTEIN INTAKE IN THE U.S., CANADA AND
EUROPE ............................................................................................................................................... 10
2.2.3 GUIDELINES FOR PLANT AND ANIMAL PROTEIN CONSUMPTION ............................................. 11
2.2.4 PLANT-BASED DIETARY PATTERNS AND DIABETES ................................................................... 12
2.2.4.1 Plant-Based Dietary Patterns and Diabetes Risk in Prospective Cohort Studies ................................ 13
2.2.4.2 Plant-Based Dietary Patterns and Glycemic Control in Controlled Dietary Trials .............................. 13
2.2.5 PLANT PROTEIN AND DIABETES ................................................................................................ 14
2.2.5.1 Plant Protein And Diabetes Risk in Prospective Cohort Studies ......................................................... 14
2.2.5.2 Plant Protein and Glycemic Control in Controlled Dietary Trials ....................................................... 15
2.2.5.3 Plant Protein and Other Cardiometabolic Risk Factors in Controlled Dietary Trials .......................... 16
2.2.6 ANIMAL PROTEIN AND DIABETES .............................................................................................. 17
2.2.6.1 Animal Protein and Diabetes Risk in Prospective Cohort Studies ...................................................... 17
2.2.6.2 Animal Protein and Glycemic Control in Controlled Dietary Trials .................................................... 19
2.2.6.3 Animal Protein and Other Cardiometabolic Risk Factors in Controlled Dietary Trials ....................... 20
2.2.7 REPLACING ANIMAL PROTEIN WITH PLANT PROTEIN AND DIABETES ...................................... 21
2.2.7.1 Replacing Animal Protein with Plant Protein and Diabetes Risk in Prospective Cohort Studies ........ 21
v
2.2.7.2 Replacing Animal Protein with Plant Protein and Glycemic Control in Controlled Dietary Trials ...... 22
2.2.7.3 Replacing Animal Protein with Plant Protein and Other Cardiometabolic Risk Factors in Controlled
Dietary Trials .................................................................................................................................................. 22
CHAPTER III – RATIONALE AND OBJECTIVES .......................................................................... 24
3.1 RATIONALE ....................................................................................................................................... 25
3.2 OBJECTIVES ....................................................................................................................................... 25
CHAPTER IV – EFFECT OF REPLACING ANIMAL PROTEIN WITH PLANT PROTEIN ON GLYCEMIC
CONTROL IN DIABETES: A SYSTEMATIC REVIEW AND META-ANALYSIS OF RANDOMIZED
CONTROLLED TRIALS ............................................................................................................ 27
CHAPTER V –ASSOCIATION BETWEEN SUBSTITUTING ANIMAL PROTEIN WITH PLANT PROTEIN
AND HEMOGLOBIN A1C IN TYPE 2 DIABETES: A CROSS-SECTIONAL STUDY ............................ 74
CHAPTER VI – OVERALL DISCUSSION AND LIMITATIONS ....................................................... 89
6.1 OVERALL DISCUSSION ....................................................................................................................... 90
6.2 LIMITATIONS ..................................................................................................................................... 91
6.2.1 SYSTEMATIC REVIEW AND META-ANALYSIS.............................................................................. 91
6.2.2 CROSS-SECTIONAL STUDY ......................................................................................................... 91
6.3 MECHANISMS OF ACTION ................................................................................................................ 92
6.4 CLINICAL IMPLICATIONS ................................................................................................................... 96
6.5 FUTURE DIRECTIONS ........................................................................................................................ 96
CHAPTER VII – CONCLUSIONS ............................................................................................... 98
CHAPTER VIII – REFERENCES ............................................................................................... 100

vi
LIST OF ABBREVIATIONS
% E – Percent energy
%/d – Percent per day
2h-PG – 2-hour plasma glucose value
ADA – American Diabetes Association
AHS-2 - Adventist Health Study 2
AP – Animal protein
Apo-A1 – Apolipoprotein A1
Apo-B – Apolipoprotein B
BMI – Body mass index
C – Crossover
CAD – Coronary artery disease
CAN – Canada
CCHS - Canadian Community Health Survey
CDA – Canadian Diabetes Association
CHD – Coronary heart disease
CI – Confidence interval
CKD – Chronic kidney disease
CRP – C-reactive protein
CVD – Cardiovascular disease
DA – Dietary advice
DASH – Dietary Approaches to Stop Hypertension
DGAC – Dietary Guidelines Advisory Committee
DNK – Denmark
E3N study – Etude Epidémiologique auprès des femmes de la Mutuelle Générale de l'Education
Nationale
EASD – European Association for the Study of Diabetes
EPIC study – European Prospective Investigation into Cancer and Nutrition
FAO - Food and Agriculture Organization
FPG – Fasting plasma glucose
g – grams
g/d – grams per day
GHF – Glomerular hyperfiltration
vii
GI – Glycemic index
GFR – Glomerular filtration rate
GRC – Greece
HbA1c – Glycated hemoglobin
HDL-C – High-density lipoprotein cholesterol
HPLC – High-performance liquid chromatography
HR – Hazard ratio
Hs-CRP – high-sensitivity C-reactive protein
HOMA-IR – Homeostasis model assessment- estimated insulin resistance
HT – Hypertension
IDF – International Diabetes Federation
IHD – Ischemic heart disease
IRN – Iran
kg – kilograms
LDL-C – Low-density lipoprotein cholesterol
MD – Mean difference
M – Men
Met – Metabolic feeding control
MetS – Metabolic syndrome
MQS – Heyland Methodological Quality Score
N – Nephropathy
NA – Data not available
NCEP – National Cholesterol Education Program
NHANES – National Health and Nutrition Examination Survey
NO/cGMP – Nitric oxide/cyclic-guanosine-3′,5′-cyclic monophosphate
PREDIMED study – Prevención con Dieta Mediterránea
O – Overweight and/or obese
OGTT - Oral glucose tolerance test
OR – Odds ratio
P – Parallel
PDCAAS – Protein digestibility corrected amino acid score
PER – Protein efficiency ratio
PP – Plant protein

viii
R – Retinopathy
RCT – Randomized controlled trial
RDA - Recommended dietary allowance
RR – Relative risk
SD – Standard deviation
SE – Standard error
SMD – Standardized mean difference
Supp – Supplemental feeding control
T1D – Type 1 diabetes
T2D – Type 2 diabetes
TC – Total cholesterol
UNU – United Nations University
USA – United States of America
USDA – U.S. Department of Agriculture
U.S. – United States
W – Women
WHO – World Health Organization
wk – weeks
y – years

ix
LIST OF FIGURES
CHAPTER IV
Figure 4.1 – Flow diagram depicting the literature search and selection process
Figure 4.2A – Forest plot of RCTs investigating the effect of replacing sources of animal with plant
protein in individuals with diabetes on HbA1c
Figure 4.2B – Forest plot of RCTs investigating the effect of replacing sources of animal with plant
protein in individuals with diabetes on fasting glucose
Figure 4.2C – Forest plot of RCTs investigating the effect of replacing sources of animal with plant
protein in individuals with diabetes on fasting insulin
Figure 4.3A – Publication bias funnel plot for HbA1c
Figure 4.3B – Publication bias funnel plot for fasting glucose
Figure 4.3C – Publication bias funnel plot for fasting insulin
Supplemental Figure 4.1 – Cochrane Risk of Bias Graph
Supplemental Figure 4.2A - Categorical a priori subgroup analyses for HbA1c
Supplemental Figure 4.2B - Categorical risk of bias subgroup analyses for HbA1c
Supplemental Figure 4.3A – Categorical a priori subgroup analyses for fasting glucose
Supplemental Figure 4.3B – Categorical risk of bias subgroup analyses for fasting glucose
Supplemental Figure 4.4A – Categorical a priori subgroup analyses for fasting insulin
Supplemental Figure 4.4B – Categorical risk of bias subgroup analyses for fasting insulin
Supplemental Figures 4.5A – Funnel plot for trim-and-fill analysis of HbA1c
Supplemental Figures 4.5B – Funnel plot for trim-and-fill analysis of fasting glucose
Supplemental Figures 4.5C – Funnel plot for trim-and-fill analysis of fasting insulin
CHAPTER V
Figure 5.1 – Correlation between Total Protein Intake and Urea Output
CHAPTER VI
Figure 6.1A – Amino Acid Profiles of Different Plant Protein Sources
Figure 6.1B – Amino Acid Profiles of Different Animal Protein Sources
Figure 6.2 – Model for the regulation of insulin secretion in the β-cell stimulated by glucose and amino
acids

x
LIST OF TABLES
CHAPTER II
Table 2.1 – Advantages and disadvantages of diagnostic tests for diabetes
Table 2.2 - List of essential and non-essential amino acids
CHAPTER IV
Table 4.1 - Characteristics of included randomized controlled trials
Supplemental Table 4.1 – Search strategy
Supplemental Table 4.2 – Study quality assessment using the Heyland Methodological Quality Score
(MQS)
Supplemental Table 4.3 – Continuous a priori & post-hoc subgroup analyses for HbA1c
Supplemental Table 4.4 – Continuous a priori & post-hoc subgroup analyses for fasting glucose
Supplemental Table 4.5 – Continuous a priori & post-hoc subgroup analyses for fasting insulin
Supplemental Tables 4.6A-D – Post-hoc piecewise linear meta-regression analyses for the continuous
subgroup looking at percent animal protein replaced with plant protein from total protein on fasting
glucose
CHAPTER V
Table 5.1 – Participant Characteristics
Table 5.2 – Nutritional Profile of Participants
Table 5.3 – Estimates for change in HbA1c associated with a 1% energy increase derived from
substituting animal protein with total plant protein

INTRODUCTION
1
CHAPTER I – INTRODUCTION

INTRODUCTION
2
CHAPTER I – INTRODUCTION
Type 2 diabetes (T2D) is a global health epidemic. According to the International Diabetes
Federation (IDF), there were approximately 387 million adults (8.3%) living with diabetes in 2014, which
is projected to increase by 53% by the year 20351. This increasing prevalence, which is exacerbated by
increasing urbanization, sedentary lifestyles, and changes in the food environment, is alongside the
increasing prevalence in obesity and is a leading cause of blindness, lower limb amputation, kidney
failure, and cardiovascular disease1. In addition, diabetes is also a major economic burden, where it
accounts for 5-10% of the total health care budget in many countries2 3. Many epidemiological studies
and randomized controlled trials (RCTs) have shown that T2D is largely preventable through diet and
lifestyle modification, which has shown to be significantly more effective than the use of
pharmacological agents4. Following a plant-based diet, which encourages the intake of whole plant-
based foods and discourages the intake of sources of animal protein and refined/processed foods5, is
one such modification that has shown to be beneficial for diabetes prevention and management.
More specifically, following a vegetarian or vegan diet, which is characterized as being high in
major plant protein sources (i.e. soy, soy-derived foods, pulses and nuts) and deficient in animal protein,
has been shown to be protective against the development of T2D6-8 and improve glycemic control in
individuals with T2D9. Studies looking at higher intakes of specific plant protein sources alone have also
shown similar benefits10-14. Diets high in animal protein, on the other hand, especially sources of red
meat, are associated with an increased diabetes risk15-17, do not show any glycemic control benefit18-21,
and have even been suggested to be considered as a risk factor for T2D22. Furthermore, high intakes of
animal protein have been shown to have negative impacts on our environment, which is a current
growing global concern23.
Despite this evidence, diabetes association guidelines (i.e. ADA and EASD) have not made any
specific recommendations for replacing animal protein with plant protein or the intake of major plant
protein sources for diabetes management24-26. One exception to this is dietary pulses (e.g. beans, peas,
chick peas, lentils), which have recently been recommended by the CDA in their most recent clinical
practice guidelines for improving glycemic control in individuals with T2D24. The evidence from RCTs
looking at the effect of replacing animal with plant protein on glycemic control in individuals with
diabetes remains inconsistent, where some have shown significant improvements in glycemic control27,
28, whereas others show no effect29, 30. In order to address this gap in knowledge and better understand
the relationship between replacing animal with plant protein on glycemic control, this thesis work will
present 1) the results of a systematic review and meta-analysis of RCTs on the effect of replacing
sources of animal protein with major sources of plant protein on glycemic control in individuals with

INTRODUCTION
3
diabetes (Chapter IV) and 2) the results of a cross-sectional study of baseline data from 5 RCTs on the
association between replacing animal protein with plant protein on HbA1c in individuals with T2D
(Chapter V).

LITERATURE REVIEW
4
CHAPTER II – LITERATURE REVIEW

LITERATURE REVIEW
5
CHAPTER II – LITERATURE REVIEW
2.1 DIABETES
Diabetes is a group of metabolic diseases characterized by the presence of hyperglycemia due to
the body not being able to produce enough insulin, not being able to effectively respond to the action of
insulin, or both24. Several classifications of diabetes exist, however, the majority fall into two broad
categories: type 1 diabetes and type 2 diabetes31. Type 1 diabetes (T1D), previously referred to as
insulin-dependent, juvenile or child-onset diabetes32, accounts for 5-10% of those with diabetes and is
primarily a result of pancreatic β-cell destruction that usually leads to the body no longer being able to
produce insulin24, 31, 32. Type 2 diabetes (T2D), previously referred to as non-insulin-dependent or adult-
onset diabetes32, accounts for 90-95% of those with diabetes and is a heterogeneous disorder, with its
main features consisting of reduced insulin sensitivity in various tissues and organs and a progressive
decline in pancreatic β-cell function24, 31, 33. Both forms of diabetes have been increasing worldwide34,
especially T2D, which has continued to increase in parallel with the dramatic rise in obesity35. This
disease, which mostly affected adults, is now emerging in children and adolescents35 and has also
become a major economic burden, with 5-10% of the total health care budget being used for T2D in
many countries2.
2.1.1 PREVALENCE OF DIABETES
According to the International Diabetes Federation (IDF) in the year 2014 the global prevalence
of diabetes was 8.3%, which is equivalent to approximately 387 million people living with diabetes.
Among these individuals, the highest prevalence rates were reported in North America and the
Caribbean (11.4% or approximately 39 million)36. In Canada, the most recent estimates from Statistics
Canada report that 6.6% of the population living with diabetes, which is equivalent to approximately 2
million people37, 38. Similar estimates have been reported for the U.S. (9.3% or approximately 29.1
million people)39. The IDF projects that there will be a 53% increase in the number of people living with
diabetes by the year 203536.
2.1.2 PATHOPHYSIOLOGY OF DIABETES
Since T1D and T2D lead to hyperglycemia, individuals with either form can present with the
following signs and symptoms: frequent urination (polyuria), excessive thirst (polydipsia), increased
hunger (polyphagia), blurred vision, weight loss, lack of energy, frequent infections, slow-healing
wounds, and tingling sensation or numbness in the hands or feet1, 2, 31.

LITERATURE REVIEW
6
T1D is defined as an auto-immune disease that is characterized by cellular-mediated destruction
of the pancreatic β-cells, which usually leads to an absolute deficiency in insulin secretion31, 40. The cause
of T1D is not fully understood and continues to be debated, but is said to be multifactorial with both
genetics and environment playing a role40.
T2D on the other hand results from impaired insulin action and/or impaired insulin secretion2, 31.
The disease is also multifactorial and involves several organs and tissues, including the pancreas, liver,
skeletal muscle, adipose tissue, the kidneys, the gastrointestinal tract and the brain33. Although the
precise mechanisms underlying the pathogenesis of T2D are not fully understood, there are several
prevailing theories, some of which include: dysfunctional pancreatic β-cells, excessive accumulation of
lipids, impaired fatty acid oxidation, a defect in insulin-mediated glucose uptake in skeletal muscle, and
impaired sensing and response to hyperglycemia in the central nervous system due to genetic
predisposition, physical inactivity, and obesity2, 33.
2.1.3 DIABETES COMPLICATIONS AND MORTALITY
A consistent high level of circulating blood glucose over time in diabetes is associated with
microvascular complications that affect the eyes (retinopathy), nerves (neuropathy), blood vessels
(arterial stiffness), heart (CVD) and kidneys (nephropathy) 1, 31. In most high-income countries, diabetes
is a leading cause of blindness, lower limb amputation, CVD, and kidney failure1.
In terms of mortality, it was estimated that approximately 4.9 million people died globally from
diabetes in the year 2014. Since estimating the number of deaths from diabetes can be somewhat
challenging due to lack of data and underestimates made by existing health statistics, this number
should be interpreted with caution1. In Canada, only 3.1% of all deaths were attributed to diabetes in
2007, whereas 29.9% of individuals who died in 2008/09 had diabetes41. This is because diabetes on its
own does not usually lead to death directly, but the complications associated with diabetes do41.
Cardiovascular disease in particular is the leading cause of death in individuals with diabetes1.
2.1.4 DIABETES RISK FACTORS
There are several risk factors associated with the development of T2D, which include: family
history of diabetes (first-degree relative), increasing age (≥40 years), ethnicity (e.g. Aboriginal, African,
Asian, Hispanic or South Asian descent), being overweight, having abdominal obesity, hypertension, low
HDL cholesterol levels ( <1.0 mmol/L in males and <1.3 mmol/L in females), elevated triglyceride levels
(≥1.7 mmol/L), unhealthy diet, physical inactivity, or a history of gestational diabetes1, 31. Having
prediabetes, a term referring to impaired fasting glucose (fasting plasma glucose values between 5.6-6.9

LITERATURE REVIEW
7
mmol/L31), impaired glucose tolerance (2-hour plasma glucose values from an OGTT between 7.8-11
mmol/L31) or having an HbA1c value between 6.0% to 6.4%, also places individuals at high risk of
developing T2D24, 31.
In terms of T1D, the risk factors are currently still being researched, but having a family member
with T1D, environmental factors and exposure to some viral infections have been linked to an increased
risk 1, 42.
2.1.5 DIAGNOSIS OF DIABETES
There are multiple tests that can be used to diagnose diabetes. According to the CDA 2013
Clinical Practice Guidelines, in order to be diagnosed with diabetes an individual must have a fasting
plasma glucose (FPG) value ≥7.0 mmol/L, HbA1c value ≥6.5% (in adults), 2-hour plasma glucose value (2h-
PG) from a 75 g oral glucose tolerance test (OGTT) ≥11.1 mmol/L, or a random (any time of day) plasma
glucose value ≥11.1 mmol/L24.
At the time of diagnosis, it may be difficult to distinguish between T1D and T2D in certain
situations. As a result, it may be useful to use physical signs of insulin resistance and autoimmune
markers, such as anti-glutamic acid decarboxylase (GAD) or anti-islet cell antibody (ICA) antibodies,
however, these have not been adequately studied as diagnostic tests24.
2.1.6 MEASURES OF GLYCEMIC CONTROL
There are a number of advantages and disadvantages for each test used in the diagnosis of
diabetes, which are summarized in Table 2.1. FPG, HbA1c, and 2h-PG from a 75 g OGTT each predict the
development of retinopathy24, whereas HbA1c is also a CVD risk factor and a better predictor of
macrovascular events24, 43, 44. In addition, FPG and 2h-PG from a 75 g OGTT have high day-to-day
variability and FPG reflects glucose homeostasis at a single point in time. HbA1c, on the other hand, has
low day-to-day variability, reflects long-term glucose concentration24, and is considered the gold
standard for assessing glycemic control45, however it is poor for detecting pre-diabetes.

LITERATURE REVIEW
8
Table 2.1 – Advantages and disadvantages of diagnostic tests for diabetes (adapted from 2013 CDA
clinical practice guidelines24)
Diagnostic test Advantages Disadvantages
FPG Established standard
Single sample
Fast, easy
Predicts microvascular
complications
High day-to-day variability
Sample not stable
Inconvenient (no caloric intake for at
least 8 hours)
Reflects glucose homeostasis at a single
point in time
HbA1c Convenient
Single sample
Does not require fasting
Low day-to-day variability
Reflects long-term glucose
concentration
Predicts microvascular
complications
Better predictor of
macrovascular disease than
FPG or 2h-PG from a 75 g OGTT
Expensive
Standardized, validated assay required
Altered by ethnicity and aging
Not for diagnostic use in children,
adolescents, pregnant women or those
with suspect T1D
Misleading in various medical conditions
(e.g. hemoglobinopathies, iron
deficiency, hemolyctic anaemia, severe
hepatic or renal disease)
2h-PG from
a 75 g OGTT
Established standard
Predicts microvascular
complications
Expensive
High day-to-day variability
Sample not stable
Inconvenient (requires continuous
monitoring over 2-3 hours)
FPG=fasting plasma glucose; OGTT=oral glucose tolerance test; 2h-PG= 2-hour plasma glucose
2.1.7 PREVENTION AND MANAGEMENT OF DIABETES
Although there is currently no evidence of any interventions that can prevent or delay the
development of T1D42, prevention of T2D can largely be achieved by lifestyle modification through diet,
physical activity and weight loss40, which has shown to be more effective than pharmacological agents4.
For individuals living with diabetes, achieving optimal glycemic control is an integral component
in management of the disease. The CDA recommends a range of targets depending on an individual’s
age, diabetes duration, risk of severe hypoglycemia, presence or absence of CVD, as well as expectancy
of life46. For most people with T1D and T2D, it is recommended that they target an HbA1c level of ≤7.0%,
which is consistent with those recommended by the ADA and EASD (general HbA1c target level of <7%)33,
47, 48. Achieving such a target level can help reduce ones risk of microvascular complications, as well as
macrovascular complications if implemented early in the disease46.One such method that can help in
achieving optimal glycemic control is nutrition therapy, which has been shown to lead to a 1-2%
reduction in HbA1c49 and reduce the use of diabetes medications50, 51

LITERATURE REVIEW
9
2.2 PLANT AND ANIMAL PROTEIN AND DIABETES
2.2.1 SOURCES OF PLANT AND ANIMAL PROTEIN IN THE DIET
Several sources of protein fall under the ‘Meat and Alternatives’ category of Health Canada’s
Food Guide and the ‘Protein Food Group’ category of the USDA’s MyPlate. The major sources of plant
protein under these categories consist of cooked legumes (i.e. pulses such as chickpeas and lentils;
peanuts and soybeans)52, soy products (e.g. tofu, tempeh, texturized vegetable protein [TVP]), as well as
nuts and seeds53, 54. Animal protein sources listed under these categories comprise of seafood (i.e. fish
and shellfish), poultry (e.g. chicken and turkey), lean meat (e.g. beef, lamb and pork) and eggs. Although
dairy products, such as milk, cheese, yogurt, and soymilk (a plant source) are not listed under the
protein food group category, they are often consumed as a source of protein in some vegetarian diets
(i.e. lacto-ovo vegetarian diet)55, 56.
When comparing animal protein with plant protein sources most plant protein sources are
lower in saturated fat and cholesterol, higher in fibre, free of heme iron, and are good sources of
antioxidants and phytochemicals56. Plant and animal protein also appear to differ in protein quality.
Currently there are several different methods that can be used to evaluate protein quality, with each
method consisting of its own limitations. In the U.S. and many other countries the protein digestibility
corrected amino acid (PDCAAS) method has been used for over 20 years as the official method for
determining protein quality57, 58, whereas in Canada the official method consists of a protein rating,
which is based on the Protein Efficiency Ratio (PER)59. Since foods are frequently consumed in
complement with one another, questions have been raised around the significance of using methods
like the PDCAAS to assess the protein quality of single protein sources58. Regardless of which score is
used, however, meat, poultry, fish, eggs, dairy foods and soy protein are considered to be sources of
high quality protein since they provide all 9 essential amino acids (referred to as complete protein
sources)60-63, whereas protein found in legumes (other than soy), grains, nuts, seeds and vegetables can
be deficient in one or more essential amino acids and are considered to be lower quality sources of
protein61, 62 (see Table 2.2 for a list of essential and non-essential amino acids). According to the
American Dietetic Association and the Dietitians of Canada, however, consuming an assortment of plant
foods over the course of a day can provide all the essential amino acids and when well planned, the
typical protein intakes of lacto-ovo vegetarians and vegans appear to meet and exceed requirements55,
58, 64. In addition, some plant protein sources have recognized health benefits, where both nuts and soy
protein have been issued a health claim from the FDA and Health Canada, respectively, for their
cholesterol lowering benefit65-67.

LITERATURE REVIEW
10
There has been an increasing awareness and interest in plant-based diets over the last decade,
which is evident by the many fast-food restaurants and university foodservice facilities that now offer a
variety of meat free options55, 68 and by the significant growth in the U.S. market for meatless foods (e.g.
meat analogs, vegetarian burgers, soymilk)55, 69. This increased interest in eliminating animal protein
from the diet is fueled by a number of reasons, where the most common ones include: health
considerations, concern for the environment, economical reasons, ethical considerations/animal welfare
factors and religious beliefs55.
TABLE 2.2 – List of essential and non-essential amino acids
Essential amino acidsa Nonessential amino acidsb Conditional amino acidsc
Histidine Alanine Arginine
Isoleucine Asparagine Cysteine
Leucine Aspartic Acid Glutamine
Lysine Glutamic Acid Tyrosine
Methionine Glycine
Phenylalanine Ornithine
Threonine Proline
Tryptophan Serine
Valine
aAmino acids that cannot be produced by the body and must come from food intake
70 (also
referred to as indispensable amino acids)
bAmino acids that can be produced by the body without food intake
70 (also referred to as
dispensable amino acids)
cAmino acids that are usually not essential, but can be in times of illness and stress
70
2.2.2 POPULATION LEVELS OF PLANT AND ANIMAL PROTEIN INTAKE IN THE U.S., CANADA AND
EUROPE
Based on analysis of data collected from across North America and Europe it appears that the
major contributor to total protein intake is animal protein. Among plant protein intake, grain sources
appear to be the greatest contributor, whereas intake of major plant protein sources, such as soy, pulses
and nuts is low. According to data analyzed from NHANES 2007-2010, animal protein sources were the
main contributors to total protein intake in the U.S. population, where poultry, meats and mixed dishes
(consisting of meat, poultry and fish) were the top 3 contributors, contributing to 10%, 9.5% and 7.5% of
total protein intake, respectively62. Grain sources such as breads, rolls, and tortillas were the 4th largest

LITERATURE REVIEW
11
contributors, contributing 6.4% of total protein intake, whereas other plant protein sources were one of
the lowest contributors, contributing to 3.2% of total protein intake62. Overall, this data is consistent
with previous data analyzed from NHANES 2003-2006 and 1988-199171-73. It is important to note that
although poultry and meats were the top 2 contributors to total protein intake, they contributed <4% to
total daily energy intake, whereas breads, rolls, and tortillas were the most significant contributors to
total daily energy intake, contributing 7%62. Similar patterns of protein intake were reported from 27
centers across 10 countries in Europe participating in the European Prospective Investigation into
Cancer and Nutrition (EPIC) study, which showed that animal protein was the greatest contributor to
total protein intake across majority of the centers, contributing 55-73% of total protein, whereas plant
protein accounted for 24-39%. Across all centers, cereals were the greatest contributors to plant
protein74. Although data on total plant and animal protein intake in Canada is limited, data analyzed
from the 2004 Canadian Community Health Survey (CCHS) have reported intakes of specific plant
protein sources, such as pulses and soy. In terms of pulses, it has been reported that only 13% of
Canadians consume pulses on any given day, where daily intakes among consumers ranged from 13 g/d
in the lowest quartile to 294 g/d in the highest quartile (less than 2 cups)75. Soy consumption has been
reported to be even lower, where only 3.3% of Canadians consumed soy foods on any given day, with
daily intakes ranging from 1.5 g/d among low consumers to 16.5 g/d among high consumers (1 serving
tofu=150g= ¾ cup)76. Overall, these data appear to be consistent with the overall trends in protein
intake within the U.S. and Europe.
2.2.3 GUIDELINES FOR PLANT AND ANIMAL PROTEIN CONSUMPTION
In terms of recommendations for total protein intake in individuals with diabetes, the 2013 CDA
clinical practice guidelines state that there is no evidence to support that individuals with diabetes
should alter their usual protein intake, which represents 15-20% of their total energy intake (1 to 1.5 g
per kg per body weight per day) 49, 77. Similarly, the ADA states that the evidence on which to
recommend an ideal amount of protein intake for optimizing glycemic control or improving one or more
CVD risk measures are not conclusive26. For individuals with diabetes and chronic kidney disease (CKD)
the recommendations for total protein intake are inconsistent. The CDA states that it is important to
consider targeting a level of intake that does not exceed the recommended dietary allowance (RDA) of
0.8 g per kg body weight per day and that the quality of protein intake must also be optimized in order
to meet the essential amino acids requirements49. The EASD, however, states that there is insufficient
evidence on which to recommend protein restriction and protein type for individuals with diabetes and
CKD25. Similarly, the ADA does not recommend individuals with diabetes and CKD to reduce their protein

LITERATURE REVIEW
12
intake below usual intakes since it does not appear to alter glycemic and cardiovascular measures or a
decline in glomerular filtration rate (GFR)26.
In terms of recommendations for specific sources of protein, public health guidelines in the U.S.
and Canada, as well as international dietary guidelines issued by the World Health Organization (WHO)
recommend daily intakes of major sources of plant protein, such as soy, soy-derived foods (e.g. tofu),
pulses and nuts. Health Canada’s Food Guide recommends the intake of 2-3 servings of meat
alternatives per day, such as beans, lentils, tofu, nuts and seeds. This is equivalent to 1½ -2¼ cups of
beans or tofu per day and ½-¾ cup of nuts or seeds per day53, which are similar to recommendations
made by the USDA’s MyPlate78. In a report of a joint WHO/FAO expert consultation, a minimum intake
of 20 g/d of legumes (< 1 serving) was recommended in order to achieve adequate intakes of non-starch
polysaccharides and to reduce overweight and obesity, CVD, and T2D risk79. Diabetes association
guidelines (i.e. CDA, ADA, and EASD), however, have not made any specific recommendations for
replacing animal protein with plant protein or the intake of major sources of plant protein for achieving
optimal glycemic control25, 26, 49. One exception to this is dietary pulses (e.g. beans, peas, chick peas,
lentils), which have recently been recommended by the CDA in their most recent clinical practice
guidelines for improving glycemic control in individuals with T2D (based on Grade B, Level 2 evidence)49
and by the EASD which recommend at least 4 servings of legumes per week in order to help meet
minimum requirements for fibre intake (Grade A evidence) 25. Although the ADA acknowledges the
option of adopting a diet high in plant protein sources, such as a vegetarian or vegan diet, as an
acceptable dietary pattern for diabetes management (Grade E evidence), they make no specific
recommendations for the intake of major plant protein sources26. Overall, the evidence on which most
of these recommendations were made on has been assigned a low grade or is out dated. Therefore, the
lack of data to support certain dietary recommendations, as well as the low-grade evidence that forms
the basis of current recommendations in diabetes association guidelines calls for stronger evidence in
this area.
2.2.4 PLANT-BASED DIETARY PATTERNS AND DIABETES
Over the past few decades’ evidence from prospective cohort studies and RCTs have both
highlighted the importance of lifestyle modification in the prevention and management of diabetes.
Changes in lifestyle consisting of increased physical activity, healthy eating and weight loss have been
shown to prevent 58% of T2D cases, which is a greater reduction than that shown for pharmacologic
agents (i.e. metformin)4. Currently there are several well-known plant-based dietary patterns, such as
Mediterranean , vegetarian or vegan, Portfolio and DASH, all of which encourage (to some degree)
LITERATURE REVIEW
13
higher intakes of whole plant-based foods when compared to a Western diet and discourage intakes of
animal protein, as well as refined and processed foods5. Many studies have shown that these plant-
based dietary patterns are associated with a lower risk for various chronic diseases, such as metabolic
syndrome (MetS)80, 81, CVD13, 82-86, cancer87, 88, and all-cause mortality83, 89-92. There have also been a
number of studies looking at the relationship between plant-based dietary patterns, diabetes risk and
glycemic control, which are summarized and discussed in the following two sections.
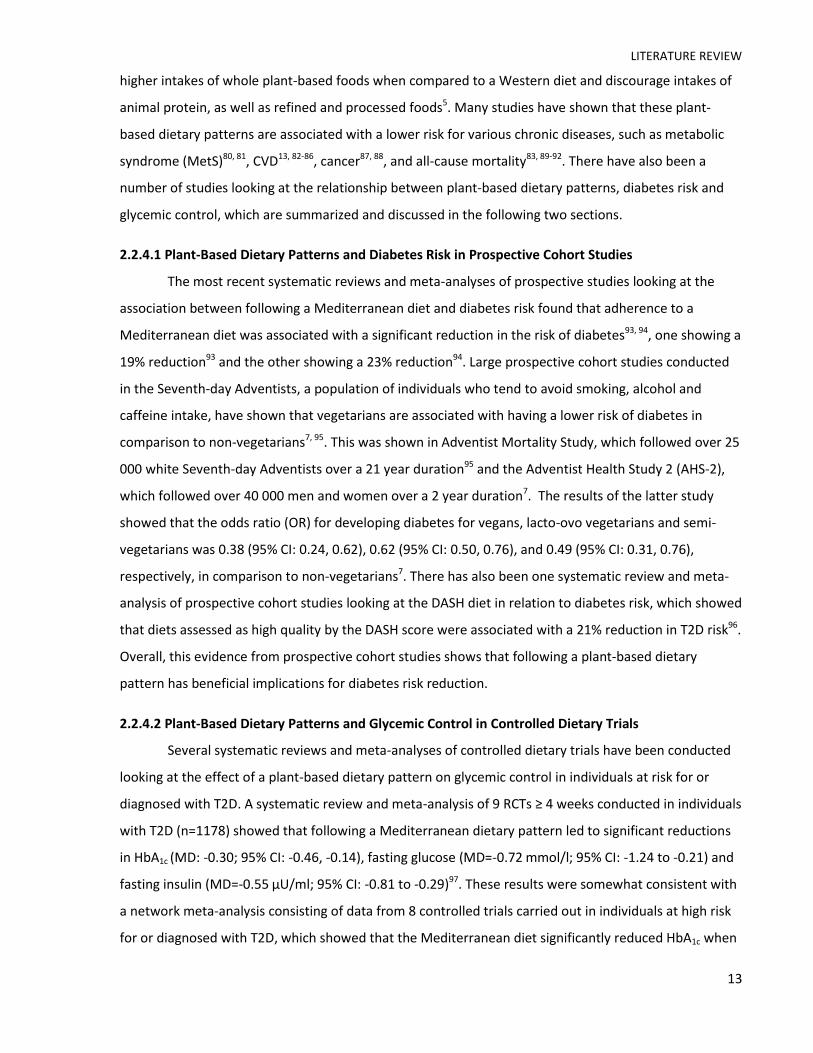
2.2.4.1 Plant-Based Dietary Patterns and Diabetes Risk in Prospective Cohort Studies
The most recent systematic reviews and meta-analyses of prospective studies looking at the
association between following a Mediterranean diet and diabetes risk found that adherence to a
Mediterranean diet was associated with a significant reduction in the risk of diabetes93, 94, one showing a
19% reduction93 and the other showing a 23% reduction94. Large prospective cohort studies conducted
in the Seventh-day Adventists, a population of individuals who tend to avoid smoking, alcohol and
caffeine intake, have shown that vegetarians are associated with having a lower risk of diabetes in
comparison to non-vegetarians7, 95. This was shown in Adventist Mortality Study, which followed over 25
000 white Seventh-day Adventists over a 21 year duration95 and the Adventist Health Study 2 (AHS-2),
which followed over 40 000 men and women over a 2 year duration7. The results of the latter study
showed that the odds ratio (OR) for developing diabetes for vegans, lacto-ovo vegetarians and semi-
vegetarians was 0.38 (95% CI: 0.24, 0.62), 0.62 (95% CI: 0.50, 0.76), and 0.49 (95% CI: 0.31, 0.76),
respectively, in comparison to non-vegetarians7. There has also been one systematic review and meta-
analysis of prospective cohort studies looking at the DASH diet in relation to diabetes risk, which showed
that diets assessed as high quality by the DASH score were associated with a 21% reduction in T2D risk96.
Overall, this evidence from prospective cohort studies shows that following a plant-based dietary
pattern has beneficial implications for diabetes risk reduction.
2.2.4.2 Plant-Based Dietary Patterns and Glycemic Control in Controlled Dietary Trials
Several systematic reviews and meta-analyses of controlled dietary trials have been conducted
looking at the effect of a plant-based dietary pattern on glycemic control in individuals at risk for or
diagnosed with T2D. A systematic review and meta-analysis of 9 RCTs ≥ 4 weeks conducted in individuals
with T2D (n=1178) showed that following a Mediterranean dietary pattern led to significant reductions
in HbA1c (MD: -0.30; 95% CI: -0.46, -0.14), fasting glucose (MD=-0.72 mmol/l; 95% CI: -1.24 to -0.21) and
fasting insulin (MD=-0.55 μU/ml; 95% CI: -0.81 to -0.29)97. These results were somewhat consistent with
a network meta-analysis consisting of data from 8 controlled trials carried out in individuals at high risk
for or diagnosed with T2D, which showed that the Mediterranean diet significantly reduced HbA1c when

LITERATURE REVIEW
14
compared to usual care but not when compared to other dietary treatments98. In addition,
Mediterranean diets, when compared to low fat and low-carbohydrate diets, have shown to delay the
need for antihyperglycemic medication in overweight individuals with newly diagnosed T2D99. Similarly,
a systematic review and meta-analysis of 6 controlled trials ≥ 4 weeks (n=255) looking at the effect of
vegetarian diets (majority of which were low-fat vegan diets) on glycemic control in middle-aged
individuals with T2D showed an overall clinically significant reduction in HbA1c (MD=-0.39; 95% CI: -0.62,
-0.15) and a non-significant reduction in fasting glucose (MD=-0.36 mmol/L ; 95% CI: -1.04, 0.32) in
comparison to comparator diets.9 In terms of the DASH diet, there has been one systematic review and
meta-analysis of RCTs conducted in individuals with various health statuses (e.g. T2D, MetS, otherwise
healthy, etc.) which showed following a DASH diet significantly reduced fasting insulin (MD: -0.15; 95%
CI:-0.22, -0.08) and non-significant reductions in fasting glucose and HOMA-IR100. Lastly, a controlled
trial looking at the effect of a modified portfolio diet in conjunction with medical management in
individuals with T2D (n=30) after receiving by-pass surgery showed a non-significant reduction in both
glucose and insulin concentrations in individuals after a 6-weeks101. Overall, these findings show that
plant-based dietary patterns may be useful for the management of glycemia in individuals at risk for or
diagnosed with T2D and appear to be consistent with prospective cohort studies showing benefits for
diabetes risk.
2.2.5 PLANT PROTEIN AND DIABETES
2.2.5.1 Plant Protein And Diabetes Risk in Prospective Cohort Studies
There have been a number of prospective cohort studies that have looked at the association
between total plant protein, as well as specific sources of plant protein, and diabetes risk. For total plant
protein, three large prospective cohort studies have been conducted and show inconsistent findings.
One of them, which was conducted using data from over 35 000 participants participating in the EPIC
study over a follow-up duration of 10 years, showed that plant protein was not associated with diabetes
incidence, whereas diets high in protein and animal protein were associated with an increased diabetes
risk102. It is important to note, however, that the main contributors to plant protein intake in this study
were bread (43%), fruit and vegetables (14%), and potatoes (9%), which are not considered to be major
sources of plant protein102. The second study, which used data from over 85 000 women participating in
the Nurses' Health Study over a follow-up duration of 20 years, assessed the relationship between low-
carbohydrate diets and T2D risk and showed that low-carbohydrate diets high in plant sources of protein
and fat modestly reduced T2D risk (RR=0.82; 95% CI: 0.71, 0.94), whereas low-carbohydrate diets high in
animal sources of protein and fat did not show this benefit (RR=0.99; 95% CI: 0.85, 1.16)8. Similarly, the
LITERATURE REVIEW
15
most recent prospective cohort study, which was conducted in a diabetes-free cohort of over 92 000
women from the Nurses’ Health Study II and over 40 000 men from the Health Professionals Follow-up
Study, showed that after a 4 year follow-up higher intakes of total protein and animal protein were
associated with an increased T2D risk (HR= 1.07; 95% CI: 1.01, 1.17 and HR=1.13; 95% CI: 1.06, 1.21,
respectively), whereas higher intake of plant protein was associated with a moderate decreased T2D risk
(HR=0.91; 95% CI: 0.84, 0.98)103.
One systematic review and meta-analysis of prospective cohort studies has been conducted to
assess the association between legume intake and diabetes risk. It consisted of only 2 studies, both of
which showed different results. One of these studies was conducted in a cohort of over 60 000 middle-
aged Chinese women over a follow-up duration of approximately ~5 years and showed that total legume
intake was inversely associated with T2D risk when comparing the upper quintile of intake to the lower
quintile of intake (RR: 0.62; 95% CI: 0.51, 0.74). In addition, when looking at different legume groups,
soybean intake was inversely associated with T2D risk (RR: 0.53; 95% CI: 0.45, 0.62), whereas soy
products (other than soy milk) and soy protein consumption (protein derived from soy beans and their
products) were not14. The second study was also a large prospective cohort study consisting of data
from over 35 000 older women participating in the Iowa Women's Health Study over a follow-up
duration of 6 years and showed no significant association between intake of mature beans and T2D
risk104. A more recent prospective cohort study conducted in a population of men and women in
Mauritius (n=1421) over a 6 year follow-up duration showed that women with the highest tertile of
pulse consumption had a reduced risk of developing abnormal glucose metabolism (OR: 0.52 [95% CI:
0.27, 0.99]) in comparison to those in the lowest tertile of consumption, which supports findings from
the former study105.
Similarly, systematic reviews and meta-analyses of prospective cohort studies looking at
association between nut intake and diabetes risk showed inconsistent results. Of the 4 most recent
meta-analyses only one showed that nut intake was inversely associated with T2D risk (RR: 0.87; 95% CI:
0.81, 0.94)13, whereas three showed no significant associations between nut intake and T2D risk82, 83, 106.
In summary, prospective cohort studies looking at total plant protein and specific sources of
plant protein show inconsistent findings in relation to diabetes risk, which may be due to the overall low
consumption of these foods in the diet.
2.2.5.2 Plant Protein and Glycemic Control in Controlled Dietary Trials
There have been several systematic reviews and meta-analyses of RCTs looking at the effect of
specific sources of plant protein on glycemic control. In terms of soy and soy products, two systematic
reviews and meta-analyses of RCTs have been conducted, one including 24 trials (n=1518) in individuals

LITERATURE REVIEW
16
with various health statuses (e.g. otherwise healthy, obese/overweight, hypercholesterolemic,
hypertensive, diabetes, etc.)107 and the other including 8 trials in individuals with T2D108. Both showed
no overall effect on HbA1c, fasting glucose, fasting insulin, and/or HOMA-IR, however the direction of the
effect favoured soy intake.107, 108
In terms of dietary pulses, there have been a series of meta-analyses conducted by our group
looking at the effect of incorporating dietary pulses into the diet alone or in the context of a low GI or
high-fibre diet in individuals with and without diabetes11. Pulses alone (11 trials) were found to
significantly lower fasting glucose (SMD = -0.82; 95% CI: -1.36, -0.27) and fasting insulin (SMD= -0.49;
95% CI: -0.93, -0.04) and in the context of a low-GI diet (19 trials) they were found to significantly lower
glycosylated blood proteins (measured as HbA1c or fructosamine, SMD= -0.28; 95% CI: -0.42, -0.14). In
the context of a high-fibre diet (11 trials), they were also found to significantly lower glycosylated blood
proteins (SMD = -0.27; 95% CI: -0.45, -0.09), as well as fasting glucose (SMD = -0.32; 95% CI: -0.49, -
0.15)11. Findings from more recent RCTs show that the effect of legumes as part of a low GI diet in
individuals with T2D (n=121) are consistent with these findings109, whereas the effect of a legume-
enriched diet in first degree relatives of patients with diabetes (n=26) showed no significant effect on
fasting glucose or HbA1c110.
Lastly, in terms of tree nut intake, there have been two systematic reviews and meta-analyses
conducted by our group, one in individuals with T2D (n=450)12 and one in individuals with at least one
criterion of the MetS (n=2226)10 . Both found significant improvements in fasting glucose (MD = -0.15
mmol/L; 95% CI: -0.27, -0.02 mmol/L and MD=-0.08 mmol/L ; 95% CI -0.16, -0.01 mmol/L, respectively)10,
12, as well as HbA1c in individuals with T2D (MD = -0.07%; 95% CI:-0.10, -0.03%)12. Several other RCTs
have been published since the conduct of these 2 meta-analyses, where majority appear to be
consistent with our findings111-115.
Overall, incorporation of major plant protein sources into the diet appears to be beneficial for
glycemic control.
2.2.5.3 Plant Protein and Other Cardiometabolic Risk Factors in Controlled Dietary Trials
Incorporation of major plant proteins into diet have also been shown to be beneficial for a
number of other cardiometabolic risk factors. Systematic reviews and meta-analyses of RCTs show that
nut consumption, dietary pulses and soy protein have beneficial effects on blood pressure116-118,
measures of kidney function (i.e. serum creatinine and phosphorus concentrations, proteinura)119, 120,
blood lipids10, 121-124, body weight125, 126, and inflammatory markers (i.e. CRP and hs-CRP)127. Overall, the
results of these meta-analyses show strong support of plant proteins having beneficial effects on other
cardiometabolic risk factors that affect diabetes prevention and management.
LITERATURE REVIEW
17
2.2.6 ANIMAL PROTEIN AND DIABETES
2.2.6.1 Animal Protein and Diabetes Risk in Prospective Cohort Studies
The consumption of animal protein sources and its impact on various health outcomes has
received an increasing amount of attention over the last several years, especially in relation to its risk for
various chronic diseases such as MetS128, CVD129, cancer130, 131 and all-cause mortality132-134. Some have
even gone as far as to suggest that meat consumption be used as an identifiable risk factor for
diabetes22. The findings from several systematic reviews and meta-analyses of prospective cohort
studies looking at various animal protein sources, such as red meat, dairy, fish, poultry, eggs and
diabetes risk are summarized and discussed below.
In terms of meat consumption, there have been three systematic reviews and meta-analyses of
prospective cohort studies conducted looking at association between meat consumption and T2D risk.
The first meta-analysis by Aune et al. found that when comparing the highest to lowest categories of
intake, red meat and processed meat were both associated with a higher T2D risk (RR: 1.21; 95% CI:
1.07, 1.38 and RR: 1.41; 95% CI: 1.25, 1.60, respectively), whereas total meat was not (RR: 1.17; 95% CI:
0.92, 1.48)15. The remaining 2 meta-analyses specifically looked at intakes of unprocessed and processed
red meat16, 135. The meta-analysis by Pan et al. found that unprocessed and processed red meat were
both associated with a higher T2D risk (RR: 1.19; 95% CI: 1.04, 1.37 per 100 g/d and RR: 1.51; 95% CI:
1.25, 1.83 per 50 g/d, respectively)16. The third meta-analysis by Micha et al. reported similar findings135.
In addition, a meta-analysis consisting of over 50 000 Caucasians showed that a higher consumption of
processed meat was associated with significantly higher fasting glucose levels and higher consumption
of unprocessed meat was associated with significantly higher fasting glucose and insulin levels136 .Since
the publication of these meta-analyses, several other prospective cohort studies have also been
published, some of which are consistent with these findings whereas others are not. In terms of
consistency, one of these studies, which analyzed data from 3 U.S. cohorts, found that in comparison to
the group that had no changes in red meat intake, increasing intake of red meat by more than ½ serving
per day was associated with a 48% higher risk in the subsequent 4-year period (HR: 1.30; 95% CI: 1.21,
1.41), whereas reducing meat intake by more than this amount was associated with a 14% lower risk
(HR: 0.86; 95% CI: 0.80, 0.93)17. In terms of inconsistency, three prospective cohort studies conducted in
the Malmö Diet and Cancer study (n=27 140)137, the Strong Heart Family Study (n=2001)138, and the E3N
study (n=66 118)139 found that higher intakes of processed red meat were associated with a higher risk
of T2D, whereas unprocessed red meat was not. There was also one study, which was conducted in the
Japan Public Health Center-based Prospective Study (n=63 849; follow-up= 5 years), that found total
meat and total red meat were associated with a higher T2D risk in men but not in women (OR: 1.36

LITERATURE REVIEW
18
[95% CI: 1.07, 1.73] and OR: 1·48 [95% CI: 1.15, 1.90], respectively) and that processed red meat was not
associated with T2D risk in either men or women140. Therefore based on the results of these meta-
analyses and recent prospective cohort studies, it appears that red meat is associated with T2D risk, but
it remains unclear whether there are differences between processed and unprocessed red meat.
In terms of dairy consumption, 4 systematic reviews and meta-analyses of prospective cohort
studies have been conducted. The findings for total dairy intake are mixed, where three meta-analyses
showed a significant inverse association between total dairy intake and T2D risk141-143 and one meta-
analysis showed no significant association144, which was also supported by a more recent prospective
cohort study conducted in the The Malmö Diet and Cancer study137. For specific sources of dairy, mixed
findings were also reported for low-fat dairy and yogurt intake141-144, whereas significant inverse
associations were reported by 2 meta-analyses for cheese intake141, 142 and no significant associations
were reported for high-fat dairy or milk intake142, 143.
Similar to dairy, the findings from systematic reviews and meta-analyses of prospective cohort
studies looking at fish intake have been mixed. In terms of overall fish/shellfish consumption, two
systematic reviews and meta-analyses found no overall association between fish/shellfish intake and
T2D risk145, 146. In another systematic review and meta-analysis, inconsistencies were found between
their categorical and linear dose-response analyses, where no significant association was reported in
their categorical analysis and a significant increased association was reported in their linear dose-
response analysis147. Evidence has also suggested that this association may be modified by geographical
region and fish type. One meta-analysis found that fish intake was associated with an increased T2D risk
in those studies conducted in the U.S. but not Europe, Asia or Australia148, whereas another meta-
analysis found that fish intake was inversely associated with T2D risk in those studies conducted in Asia
(i.e. China and Japan) but not in Western countries (i.e. the U.S., U.K., Netherlands, Finland)146. In terms
of fish type, two meta-analyses found a significant inverse association between intake of fatty fish and
T2D risk145, 149 and one found no significant association with intake of lean fish and shellfish149.
Lastly, prospective studies looking at egg and poultry consumption show mixed findings137, 150 151,
152 and no significant associations with T2D risk137, 140, respectively.
Overall, it appears that there is consistent evidence showing that red meat is associated with
T2D risk, with inconsistencies regarding processed and unprocessed red meat, and mixed findings with
regards to dairy, fish and egg consumption. Although evidence regarding poultry consumption is limited,
it does not appear to be associated with T2D risk.

LITERATURE REVIEW
19
2.2.6.2 Animal Protein and Glycemic Control in Controlled Dietary Trials
Several RCTs have looked at the effect of animal protein consumption on various
cardiometabolic risk factors, including glycemic control. In particular, there have been a number of trials
that compared the effect of diets higher in beef, pork, dairy and egg to diets lower or deficient in these
sources. The effect of varying amounts of lean beef was tested in a 5 week RCT conducted in
hypercholesterolemic men and women (n=36) and showed no significant differences in fasting glucose
and insulin when comparing one diet with the lowest amount of beef (20 g/d) to three diets higher in
beef (28 g, 113 g and 153 g of beef per day, respectively) 21. Similarly, the effect of a diet higher in pork
(1 kg pork per week) was compared to a habitual diet in an RCT conducted in overweight adults (n=144)
and showed no significant differences in fasting glucose and insulin after 3 months153. In terms of dairy,
a meta-analysis of RCTs (20 studies; n=1677) showed that consumption of high or low fat dairy products
had no significant effect on fasting glucose and HOMA-IR18. This was also supported by a more recent 6
week RCT conducted in postmenopausal women with abdominal obesity (n=27) that showed no
significant between-group differences in fasting glucose, fasting insulin, and various insulin sensitivity
indices154. Comparing diets higher in eggs to diets lower in eggs also showed no significant between-
group differences in measures of glycemic control in 2 RCTs conducted in overweight or obese people
with prediabetes or T2D19, 20. Therefore, based on the results of these studies, it appears that consuming
higher amounts of animal protein sources such as beef, pork, dairy and eggs does not significantly alter
glycemic control in individuals with one or more features of the MetS or T2D. This may be partly due to
the fact that the control arms of these studies were consuming other sources of animal protein. For
example in the study looking at higher intakes of beef, the control arm consumed a greater amount of
poultry, pork and fish21. This is further supported by evidence from RCTs conducted in individuals with
one or more features of the MetS or T2D that specifically compared the effect of consuming different
types of animal protein sources (e.g. pork versus chicken versus fish) and showed, for the most part, no
significant differences in fasting glucose155-157, fructosamine156 and/or fasting insulin155. However, when
comparing a diet higher in animal protein to a diet higher in plant protein, RCTs have shown that diets
higher in plant protein have beneficial effects on glycemic control in individuals with27, 158, 159 and
without diabetes160, 161. Therefore, although RCTs show that various sources of animal protein do not
alter glycemic control in individuals with or at risk for diabetes, majority of these studies consist of a
comparator arm with an equivalent amount of protein from another animal protein source and are not
consistent with findings from RCTs that compare animal protein with plant protein.

LITERATURE REVIEW
20
2.2.6.3 Animal Protein and Other Cardiometabolic Risk Factors in Controlled Dietary Trials
As mentioned in the previous section, many RCTs have been conducted looking at the effect of
diets higher in specific animal protein sources on various cardiometabolic risk factors, such as body
weight, blood pressure, blood lipids, kidney function, and inflammatory markers.
The findings for body weight are mixed. In terms of dairy intake, 2 systematic reviews and meta-
analyses of RCTs showed that consumption of dairy products do not alter body weight, whereas
subgroup analyses showed that in the context of energy restriction or short-term intervention (<1 year)
they appeared to reduce body weight but had the opposite effect in ad libitum trials or long-term trials
(≥1 year)162, 163. A more recent meta-analysis showed that dairy consumption increased weight18. In
terms of other animal protein sources, an RCT conducted in overweight adults (n=144) showed that
higher pork consumption resulted in significant reductions in measures of adiposity (i.e. body weight,
BMI, waist circumferences, % body fat, fat mass and abdominal fat) 153, whereas another RCT comparing
lean pork, beef and chicken found no significant differences in measures of adiposity between the 3
animal protein sources after 3 months in a group of overweight and obese middle aged men and women
(n=49), with no changes within each arm either164.
The findings for blood pressure are mixed. Two RCTs looking at fish consumption showed that
diets higher in certain types of fish (i.e. lean or white) significantly improved blood pressure in
individuals with the MetS or CHD165 166, whereas one showed no effect in blood pressure in a group of
older healthy adults167. Diets higher in lean beef also showed benefits on blood pressure in
normotensive men and women168, whereas the effect of consuming lean pork in comparison to chicken
and fish as the main protein source in the context of a DASH diet showed no significant between group
differences in blood pressure but did show reductions within each arm in men and women with elevated
blood pressure155. Lastly, a systematic review and meta-analysis of RCTs showed that consumption of
high or low fat dairy products had no significant effect on blood pressure18.
The findings for blood lipids are also mixed. Diets higher in lean beef showed benefits on blood
lipids (i.e. LDL-C, Apo-B) in hypercholesterolemic men and women21. An RCT conducted in individuals
with T2D and macroalbuminuria, showed that after 4 weeks non-HDL-C was significantly lower in a diet
replacing red meat with chicken and in a lactovegetarian low-protein diet when compared to the usual
diet156. In terms of egg consumption, 2 RCTs conducted in individuals with prediabetes or T2D found that
a high egg diet did not significantly alter most blood lipids (i.e. TC, LDL-C, triglycerides)19, 20, however one
found that higher egg consumption significantly increased HDL-C in comparison to the lower egg diet20.
In terms of diets higher in fish, one RCT conducted in older healthy adults and one in individuals with
CHD 167 found no significant effects on blood lipids, except for Apo-A1 which was significantly lower in

LITERATURE REVIEW
21
the control group of the study conducted in individuals with CHD165. There was also an RCT conducted
in individuals with the MetS that showed higher consumption of fish significantly lowering LDL-C 166.
Lastly, a systematic review and meta-analysis of RCTs showed that consumption of high or low fat dairy
products had no significant effect on blood lipids (i.e. LDL-C, HDL-C)18, which was also supported by a
more recent RCT154.
In terms of kidney function, an RCT conducted in individuals with T2D and macroalbuminuria
showed that after 4 weeks urinary albumin excretion rate was significantly lower in a usual diet
replacing red meat with chicken and a lactovegetarian low-protein diet in comparison with just the usual
diet156.
Lastly, RCTs conducted in individuals with various health statuses (i.e. otherwise healthy,
overweight and/or obese with and without glucose intolerance) show that diets higher in specific animal
protein sources, such as dairy, red meat, dairy, and fish have no significant effect on markers of
inflammation (i.e. CRP)18, 154, 157, 167, 169.
Overall, the findings from RCTs indicate that the effects of animal protein across all the
cardiometabolic risk factors discussed are inconsistent or lacking in evidence, with the exception of
markers of inflammation, where several RCTs looking at various animal protein sources consistently
showed no difference in effect.
2.2.7 REPLACING ANIMAL PROTEIN WITH PLANT PROTEIN AND DIABETES
2.2.7.1 Replacing Animal Protein with Plant Protein and Diabetes Risk in Prospective Cohort Studies
To date, there has been one prospective cohort study that specifically looked at the relationship
between substituting animal with plant protein and diabetes risk. In a diabetes-free cohort of over 92
000 women from the Nurses’ Health Study II and over 40 000 men from the Health Professionals Follow-
up Study (follow-up=4 years) substituting 5% energy from plant protein for animal protein was
associated with an 18% reduced risk for T2D and substituting 1 serving per day of plant protein foods for
animal protein foods was associated with 10-21% reduced risk for T2D103. There has also been one cross-
sectional study conducted in diabetes-free female participants from the Nurses’ Health Study (n=3690)
looking at the association between substituting animal with sources of plant protein and HbA1c. They
found no significant association between substituting one serving of total red meat with nuts or legumes
and HbA1c but did show that substitution with poultry, fish, legumes, and nuts together was associated
with significantly lower HbA1c (β ± SE: -0.031±0.015, P=0.04)170. The findings from this study suggest that
certain types of animal protein may affect glycemic control differently; however, more studies are
needed to clarify these findings.
LITERATURE REVIEW
22
2.2.7.2 Replacing Animal Protein with Plant Protein and Glycemic Control in Controlled Dietary Trials
There have been a number of RCTs looking at the effect of replacing animal protein with plant
protein sources on various cardiometabolic risk factors in individuals with diabetes and
hypercholesterolemia, as well in individuals who are overweight or obese and otherwise healthy.
In terms of glycemic control, the findings are mixed. In individuals with diabetes, some RCTs
have shown that the replacement of animal with plant protein improves markers of glycemic control,
such as HbA1c171, fasting glucose27, 158, 159, 172 and fasting insulin158, whereas other RCTs have shown no
difference in effect30, 173-175 (note: these studies will be discussed in greater detail in Chapter IV).
Similarly, in individuals with hyperlipidemia, there have been some RCTs that have shown improvements
in fasting glucose176 and fasting insulin160, 177, whereas others have shown no difference in effect178-180.
Lastly, RCTs conducted in overweight or obese individuals who were otherwise healthy have shown, for
the most part, no significant effect on markers of glycemic control181-184, however one recent study
conducted in post-menopausal women with abdominal obesity (n=15; follow-up duration= 4 weeks)
showed that the diet replacing animal protein with soy protein resulted in significantly greater insulin
sensitivity as measured by a frequently sampled intravenous glucose tolerance test (FSIGT) and the
disposition index161.
Overall, the effect of replacing animal with plant protein on glycemic control in individuals with
various health statuses is not exactly clear. Therefore, a systematic review and meta-analysis of RCTs
would be useful in quantifying and understanding how this replacement in the diet relates to markers of
glycemic control in individuals with and at risk of developing diabetes.
2.2.7.3 Replacing Animal Protein with Plant Protein and Other Cardiometabolic Risk Factors in
Controlled Dietary Trials
In terms of other cardiometabolic risk factors, there have been a number of RCTs which show
that replacing animal with plant protein has beneficial effects on blood lipids (e.g. triglycerides, TC, LDL-
C, HDL-C) in individuals with T1D or T2D with or without nephropathy27, 158, 172, 185, with the exception of
one trial which showed no significant differences in blood lipids (i.e. TC, HDL-C, triglycerides) in
individuals with T2D and microalbuminuria (n=17; follow-up=6 weeks)30. The beneficial effect of
replacing animal with plant protein on blood lipids have been attributed to plant protein sources being
higher in fiber, phytosterols, and isoflavones (in the case of soy protein). Similar beneficial effects on the
lipid profile have also been reported for hyperlipidemic160, 176, 177 and obese individuals who are
otherwise healthy161, 182. Replacement of animal with plant protein has also shown benefits on markers
related to kidney function (e.g. urinary urea nitrogen, proteinuria, urinary creatinine, GFR, renal plasma
flow) in individuals with T1D or T2D with or without nephropathy27, 159, 172, 185, 186, with the exception of

LITERATURE REVIEW
23
one trial which showed no significant differences in GFR, renal plasma flow, and albumin excretion rate
in individuals with T2D and microalbuminuria (n=17; follow-up=6 weeks)30.The beneficial effects on
kidney function may be explained, to some extent, by improvements seen in blood lipids and glycemic
control in these trials and differences in the amino acid profiles. Lastly, replacement of animal with plant
protein has shown benefits on markers of inflammation (i.e. CRP, IL-6 and TNF-α) in individuals with T2D
with or without nephropathy27, 187, which may be attributed to plant proteins being higher in nutrients
that have shown anti-inflammatory potential (i.e. fiber, magnesium , and phenolic compounds, such as
flavonoids and anthocyanins).
Overall, the findings from these RCTs suggest, for the most part, that replacing animal with plant
protein may beneficial for blood lipids, kidney function and inflammation in individuals with diabetes.

RATIONALE AND OBJECTIVES
24
CHAPTER III – RATIONALE AND OBJECTIVES

RATIONALE AND OBJECTIVES
25
CHAPTER III – RATIONALE AND OBJECTIVES
3.1 RATIONALE
Although plant protein sources have shown to be beneficial for lowering diabetes risk8, 13, 14 and
improving glycemic control11, 12, diabetes association guidelines (i.e. ADA and EASD) currently do not
make any specific recommendations for the intake of major plant protein sources (i.e. soy, soy-derived
products and nuts) for optimal glycemic control24-26. One exception to this is dietary pulses (e.g. beans,
peas, chick peas, lentils), which have recently been recommended by the CDA in their most recent
clinical practice guidelines for improving glycemic control in individuals with T2D24. Animal protein, on
the other hand, especially sources of red meat, is associated with an increased diabetes risk15-17, shows
no glycemic benefits18-21, and has even been suggested to be considered as a risk factor for T2D22.
Given this data on plant and animal protein, it still remains unclear whether replacing animal
with plant protein would confer glycemic control benefits in individuals with diabetes. Current evidence
from a small number of RCTs is inconsistent, where some have shown significant improvements in
glycemic control27, 28, whereas others show no effect29, 30. Therefore, in order to gain a clearer
understanding of this relationship and to address this knowledge gap we conducted a systematic review
and meta-analysis of RCTs looking at the effect of replacing sources of animal protein with major
sources of plant protein on HbA1c, fasting glucose, and fasting insulin in individuals with diabetes. We
also conducted a cross-sectional study using baseline data from 5 RCTs conducted in individuals with
T2D in order to assess the relationship between replacing animal with plant protein and HbA1c, the
current clinical standard for assessing glycemic control45, and to adjust for other nutrients that exist in
whole food sources of plant and animal protein (i.e. available carbohydrates, fat, fibre, magnesium).
Furthermore, the use of baseline data in these analyses would allow us to understand this relationship
in the context of “real world” intakes in a sample of people with T2D.
3.2 OBJECTIVES
The overall objective is to investigate the effect of replacing animal protein with plant protein on
glycemic control in individuals with diabetes.
Specific objectives include:
1. To assess the effect of replacing sources of animal protein with major sources of plant protein
(i.e. soy, soy-derived products, pulses, nuts) on HbA1c, fasting glucose, and fasting insulin in
individuals with diabetes in a systematic review and meta-analysis of RCTs.

RATIONALE AND OBJECTIVES
26
2. To assess the association between replacing animal protein with plant protein on HbA1c in
individuals with T2D in a cross-sectional study using baseline data from 5 RCTs conducted in
Toronto, Canada.
SYSTEMATIC REVIEW AND META-ANALYSIS
27
CHAPTER IV – EFFECT OF REPLACING ANIMAL PROTEIN WITH PLANT PROTEIN ON GLYCEMIC CONTROL IN DIABETES: A SYSTEMATIC REVIEW AND META-ANALYSIS OF RANDOMIZED CONTROLLED TRIALS

SYSTEMATIC REVIEW AND META-ANALYSIS
28
EFFECT OF REPLACING ANIMAL PROTEIN WITH PLANT PROTEIN ON GLYCEMIC CONTROL IN
DIABETES: A SYSTEMATIC REVIEW AND META-ANALYSIS OF RANDOMIZED CONTROLLED TRIALS
Effie Viguiliouk1, 2, Sarah E. Stewart1, 2, Viranda H. Jayalath1,3,12, Alena Praneet Ng1, Arash Mirrahimi1, 4,
Russell J. de Souza1, 2, 5, Anthony J. Hanley2,6,7,8, Richard P. Bazinet2, Sonia Blanco Mejia1, 2, Lawrence A.
Leiter1, 2, 7, 9, 10, Robert Josse1, 2, 7, 9, 10, Cyril W.C. Kendall1, 2,11, David J.A. Jenkins1, 2, 7, 9, 10, and John L.
Sievenpiper1, 2, 9, 10
1Toronto 3D Knowledge Synthesis and Clinical Trials Unit, Clinical Nutrition and Risk Factor Modification
Center, St. Michael’s Hospital, Toronto, Ontario, Canada
2Department of Nutritional Sciences, Faculty of Medicine, University of Toronto, Toronto, Ontario,
Canada
3Department of Surgical Oncology, Princess Margaret Cancer Center, University Health Network,
Toronto, Ontario, Canada
4School of Medicine, Faculty of Health Sciences, Queen’s University, Kingston, Ontario, Canada
5Department of Clinical Epidemiology & Biostatistics, Faculty of Health Sciences, McMaster University,
Hamilton, Ontario, Canada
6Leadership Sinai Centre for Diabetes, Mount Sinai Hospital, Toronto, Canada
7Department of Medicine, University of Toronto, Toronto, Canada
8Dalla Lana School of Public Health, University of Toronto, Toronto, ON, Canada
9Division of Endocrinology and Metabolism, St. Michael’s Hospital, Toronto, Ontario, Canada
10Li Ka Shing Knowledge Institute, St. Michael’s Hospital, Toronto, Ontario, Canada
11College of Pharmacy and Nutrition, University of Saskatchewan, Saskatoon, Saskatchewan, Canada
12Undergraduate Medical Education, University of Toronto, Toronto, ON, Canada
Corresponding author:
Dr. John L. Sievenpiper, MD, PhD, FRCPC
St. Michael's Hospital
#6137-61 Queen Street East
Toronto, ON, M5C 2T2, CANADA
T: +1 416 867 7460 x 8045
F: +1 416 867 7495

SYSTEMATIC REVIEW AND META-ANALYSIS
29
4.1 ABSTRACT
Aims: Previous research on the effect of replacing sources of animal protein with plant protein on
glycemic control has been inconsistent. To assess the evidence that this replacement may benefit
glycemic control, we conducted a systematic review and meta-analysis of randomized controlled trials
(RCTs) on the effect of replacing animal protein with plant protein on glycemic control in individuals with
diabetes.
Methods: We searched MEDLINE, EMBASE, and Cochrane databases through 26 August 2015. We
included RCTs ≥ 3-weeks comparing the effect of replacing sources of animal protein with plant protein
on HbA1c, fasting glucose (FG), and fasting insulin (FI). Two independent reviewers extracted relevant
data, assessed study quality (Heyland Methodological Score) and risk of bias (Cochrane Risk of Bias
Tool). Data were pooled by the generic inverse variance method and expressed as mean differences
(MD) with 95% CIs. Heterogeneity was assessed (Cochran Q-statistic) and quantified (I2-statistic).
Results: Twelve trials (n = 240) met the eligibility criteria. Diets using major sources of plant protein to
replace sources of animal protein at a level ≥35% of total protein per day significantly lowered HbA1c
(MD= -0.16-% [95%-CI: -0.27, -0.05-%]), FG (MD= -0.53-mmol/L [95%-CI: -0.92, -0.13-mmol/L]) and FI
(MD= -10.09-pmol/L [95%-CI: -17.31, -2.86-pmol/L]) compared with control arms. Most trials were
small, short, and of poor quality.
Conclusions: Pooled analyses show that replacing sources of animal protein with plant protein leads to
modest improvements in glycemic control in individuals with diabetes. Owing to uncertainties in our
analyses there is a need for larger, longer, higher quality trials.
Trial Registration: ClinicalTrials.gov registration number: NCT02037321
Keywords: diabetes; glycemic control; plant protein; animal protein

SYSTEMATIC REVIEW AND META-ANALYSIS
30
4.2 INTRODUCTION
Diabetes association guidelines (i.e. American Diabetes Association, and European Association
for the Study of Diabetes) do not currently recommend the intake of major sources of plant protein such
as soy, soy-derived foods (e.g. tofu) and nuts for optimal glycemic control25, 26. One exception is dietary
pulses (e.g. beans, peas, chick peas, lentils), which have recently been recommended by the Canadian
Diabetes Association clinical practice guidelines for improving glycemic control in individuals with type 2
diabetes (T2D)49. Plant proteins are a major component of vegan and/or vegetarian dietary patterns and
have been shown in prospective cohort and cross-sectional studies in Seventh day Adventists to be
associated with lower diabetes risk6, 7 and all-cause mortality91. Evidence from a systematic review and
meta-analysis of RCTs also suggests that vegetarian diets may improve glycemic control in individuals
with T2D9. Furthermore, a recent prospective cohort study conducted in over 92 000 women from the
Nurses’ Health Study II and over 40 000 men from the Health Professionals Follow-up Study found that
substituting 5% energy from plant protein for animal protein was associated with an 18% reduced risk
for T2D and substituting 1 serving per day of plant protein foods for animal protein foods was associated
with 10-21% reduced risk for T2D103. On the contrary, evidence from previous meta-analyses of
prospective cohort studies15, 16, as well as more recent prospective cohort studies17 have shown that
diets higher in animal protein, specifically in red meat, are associated with an increased incidence of
T2D. A recent review has even suggested that meat consumption be considered as a risk factor for
T2D22. However, it is unclear whether the replacement of animal with plant protein would confer
glycemic control benefits in individuals with diabetes. Evidence from RCTs remains inconsistent: some
trials have shown replacement of animal with plant protein significantly improved glycemic control27, 158,
whereas others have shown no effect30, 174. We therefore conducted a systematic review and meta-
analysis of RCTs to synthesize the effect of replacing sources of animal protein with plant protein on
glycemic control assessed by HbA1c, fasting glucose, and fasting insulin in individuals with diabetes.
4.3 METHODS
We followed the Cochrane Handbook for Systematic Reviews of Interventions for the planning
and conduct of this meta-analysis188. Reporting followed the Preferred Reporting Items for Systematic
Reviews and Meta-Analyses (PRISMA) guidelines189. The review protocol is available at ClinicalTrials.gov
(registration number: NCT02037321).
SYSTEMATIC REVIEW AND META-ANALYSIS
31
4.3.1 DATA SOURCES AND SEARCHES
We searched the databases MEDLINE, EMBASE, and the Cochrane Registry through 26 August
2015 using the search strategy shown in Supplemental Table 4.1. Manual searches of reference lists of
review articles and included trials supplemented electronic database searches.
4.3.2 STUDY SELECTION
We included RCTs that compared a diet emphasizing the replacement of animal protein sources
(e.g. meat, dairy, etc.) with major sources of plant protein (e.g. legumes, nuts, etc.) on HbA1c, fasting
glucose, and/or fasting insulin to a control diet without this replacement matched for energy (isocaloric)
for a follow-up duration ≥3 weeks in individuals with diabetes (T1D and/or T2D). Trials that consisted of
a non-randomized treatment allocation, <3-weeks follow-up duration, non-isocaloric comparisons,
lacked a suitable control (i.e. plant protein source in intervention arm did not replace an animal protein
source present in the control arm), were not conducted in individuals with diabetes, or did not provide
suitable endpoint data were excluded. No restrictions were placed on language.
4.3.3 DATA EXTRACTION AND QUALITY ASSESSMENT
Two investigators (EV, and one of SS, AN, VJ or AM) independently reviewed all reports that met
the inclusion criteria. A standardized form was used to extract relevant information on trial
characteristics and endpoint data. Trial characteristics included: sample size, participant characteristics
(e.g. health status, sex, age, etc.), study setting, design (crossover or parallel), level of feeding control
(metabolically controlled, partially metabolically controlled, or dietary advice), intervention arm (plant
protein type), percent and grams per day of animal protein replaced with plant protein from total
protein, control arm (animal protein type), food form (whole food or powder), macronutrient
breakdown of background diet(s), energy balance (neutral, positive or negative), follow-up duration, and
funding source type (agency, industry, or both). Where available, the mean±SD for baseline, end, and
change from baseline values, as well as MD were extracted for the primary endpoints (HbA1c, fasting
glucose, and fasting insulin). Missing SDs were calculated from other available data (95% CI, p-values, t
or F statistics, SE) using standard formulae recommended by the Cochrane Collaboration188. Authors
were contacted to provide missing data.
The quality of each trial was assessed using the MQS. A maximum score of 13 points could be
received on the basis of the trials methods, sample and intervention190. Trials receiving scores of ≥8 and
<8 were considered to be of higher and lower quality, respectively. Disagreements on MQS were
resolved by consensus.

SYSTEMATIC REVIEW AND META-ANALYSIS
32
Trials were assessed for risk of bias using the Cochrane Risk of Bias Tool188. Domains of bias
assessed were sequence generation, allocation concealment, blinding, outcome data, and outcome
reporting. Trials were marked as “high risk of bias” when the methodological flaw was likely to have
affected the true outcome, “low risk of bias” if the flaw was deemed inconsequential to the true
outcome, and “unclear risk of bias” when insufficient information was provided to permit judgment. All
disagreements were resolved by consensus.
4.3.4 DATA SYNTHESIS AND ANALYSIS
Data for primary analyses were conducted using Review Manager (RevMan), version 5.3 (The
Nordic Cochrane Centre, The Cochrane Collaboration, Copenhagen, Denmark). The difference between
the intervention and control arm’s change from baseline value was derived from each trial for the
primary endpoints. If change from baseline values were not available, end-of-treatment values were
used. In the case where we were not able to convert data into appropriate units (i.e. percent change
from baseline values), individual patient data was requested175. Paired analyses were conducted for all
crossover trials191. If SDs were missing for crossover trials and no other data were available for their
derivation, and where we could not derive a calculated pooled correlation coefficient for imputing
missing SDs (<5 trials reporting sufficient data) we assumed a correlation coefficient of 0.5, as it is a
conservative estimate for an expected range of 0–1. A correlation coefficient of 0.5 was assumed in all
three primary analyses due to insufficient data. Once the values were derived from each trial they were
pooled and analyzed for each primary endpoint using the generic inverse variance method with random
effects models. This approach was used even in the absence of statistically significant between-study
heterogeneity, as they yield more conservative summary effect estimates in the presence of residual
heterogeneity. Results were expressed as MD with 95% CIs. A two-sided p-value <0.05 was set as the
level of significance.
Inter-study heterogeneity was tested using the Cochran Q-statistic and quantified using the I2-
statistic with a significance level set at p-value <0.10. An I2<50%, I2≥50% and I2≥75% were considered to
be evidence of “moderate”, “substantial” and “considerable” heterogeneity, respectively188. Sources of
heterogeneity were explored using sensitivity and subgroup analyses. To determine whether a single
trial exerted an undue influence on the overall results, sensitivity analyses were performed in which
each individual trial was removed from the meta-analysis and the effect size recalculated with the
remaining trials. Sensitivity analyses were also undertaken using correlation coefficients of 0.25 and 0.75
to determine whether the overall results were robust to the use of an assumed correlation coefficient of
0.5. A priori subgroup analyses (categorical and continuous) were conducted for baseline values of

SYSTEMATIC REVIEW AND META-ANALYSIS
33
HbA1c, fasting glucose, and fasting insulin within the intervention arm, plant protein type, animal protein
type, percent and grams of animal protein replaced with plant protein (from total protein), absolute
fiber and saturated fat intake within the intervention arm, difference in fiber and saturated fat intake
between the intervention and control arm, change from baseline fiber and saturated fat intake within
the intervention arm, health status (diabetes type), design, follow-up duration, and study quality (MQS).
Post-hoc continuous or categorical subgroup analyses were conducted for isoflavone intake, body
weight, sex, food form and risk of bias. A post-hoc analysis consisting of a piecewise linear meta-
regression was performed using the mkspline function in order to identify a dose-threshold
(breakpoints) for the continuous subgroup looking at percent animal protein replaced with plant protein
(from total protein) on fasting glucose.
Publication bias was investigated by visual inspection of funnel plots, quantitative assessment
using Egger and Begg tests, and Duval and Tweedie nonparametric “trim-and-fill” analyses, where a p-
value <0.05 was considered evidence of small study effects.
All meta-regressions (a-priori and post-hoc), and publication bias analyses were conducted using
STATA software, version 13.0 (StataCorp, College Station, TX) with a significance set at P <0.05.
4.4 RESULTS
4.4.1 SEARCH RESULTS
Figure 4.1 shows the literature search and selection process. We identified a total of 2554
reports, 2496 of which were determined to be irrelevant based on review of titles and abstracts. The
remaining 58 reports were retrieved and reviewed in full, of which 45 were excluded. One of these
reports was excluded for an irreconcilable discrepancy in the reporting of the results in two places in the
same report185. A total of 12 reports containing data on 12 trials in 240 participants with T1D (n = 21)159,
172 and T2D (n = 219)27, 30, 158, 171, 173-175, 186, 192, 193 met the eligibility criteria and were included in the
analyses. Eight trials reported data for HbA1c (n = 133), 10 for fasting glucose (n = 218), and 5 for fasting
insulin (n = 118).
4.4.2 TRIAL CHARACTERISTICS
Table 4.1 shows the characteristics of the 12 included trials. Trials were conducted in outpatient
settings across 5 countries: Iran (5 trials), U.S. (4 trials), and 1 trial each from Canada, Denmark and
Greece. All trials were randomized and majority (83%) used a crossover design. Participants tended to
be middle aged (median age: 62 years [range: 30–66 years]) with an approximately equal distribution of

SYSTEMATIC REVIEW AND META-ANALYSIS
34
men and women across trials (median % women: 49% [range: 0-78% women]) and overweight or obese
(median BMI: 29 kg/m2 [range: 23.8-35.1 kg/m2]. Most trials were conducted in individuals with T2D
with the exception of 2 trials conducted in individuals with T1D159, 172. Half of the trials reported
presence of microvascular complications (e.g. nephropathy, retinopathy) among participants27, 30, 174, 175,
186, 192. Median baseline HbA1c, fasting glucose, and fasting insulin were 7.2% (range: 5.9-8.4%), 8.0-
mmol/L (range: 6.7-10.4 mmol/L), and 70.2-pmol/L (56.3-134.2 pmol/L), respectively. Mean diabetes
duration varied from ~1 to 10 years27, 30, 171, 173, 174, 186, 192, 193 for those with T2D and 15 years172 or before
the onset of 30 years of age159 for those with T1D; otherwise duration was undeclared158, 175. The
majority of trials did not explicitly provide information on how diabetes was defined with the exception
of 4 trials, in which T2D was defined as fasting plasma glucose ≥7-mmol/L27, 158, 171, 173 or the use of oral
glucose-lowering agents or insulin27, 158, 175. Trials conducted in individuals with T2D had all participants
treated with oral glucose-lowering agents (4 trials30, 171, 174, 193), some treated with either oral glucose-
lowering agents, insulin or both (3 trials27, 175, 186), all treated with insulin (1 trial192), or all treated with
diet and lifestyle alone (1 trial173); otherwise information on the use of oral glucose-lowering agents or
insulin was undeclared (1 trial158). All participants with T1D were treated with insulin (2 trials159, 172). Five
trials required participants to keep their medications stable throughout the trial158, 171, 173, 175, 186, while 4
trials reported no changes in medication use in most patients30, 158, 171-175, 186, 192; otherwise it was
undeclared27, 159, 193.
Laboratory measurements of glycemic endpoints across trials varied. HbA1c was measured by
high-performance liquid chromatography (HPLC) in 3 trials159, 173, 174 and immunoassay in 3 trials30, 171, 175;
otherwise it was unspecified172, 192. Fasting glucose was measured by enzymatic methods across all 10
trials27, 158, 159, 171-175, 186, 193. Fasting insulin was measured by a radioimmunoassay in 1 trial171 and an
immunoassay in 3 trials173-175; otherwise it was unspecified158.
The majority of trials consisted of a partial replacement of animal with plant protein, with the
exception of 2 trials which did a full replacement30, 159. The types of animal protein replaced with plant
protein varied among the trials: 6 trials (50%) replaced mixed sources of animal protein with mixed
sources of plant protein30, 159 or sources of soy protein only27, 172, 186, 192; 4 trials (33%) replaced sources of
dairy protein with sources of soy protein173, 175, 194 or almonds171; and 2 trials (17%) replaced sources of
red meat with pulses (e.g. lentils, chickpeas, peas and beans)158, 193. The animal and plant protein sources
were consumed in the form of whole foods in majority of the trials with the exception of 2 trials173, 174
where the animal and plant sources exchanged for one another were in the form of isolated protein
powders. The median percentage of animal protein replaced with plant protein from total protein was
~35%/d (range: 4-70%/d).

SYSTEMATIC REVIEW AND META-ANALYSIS
35
The background diets of the intervention arms consisted of 41–70% energy (E) from
carbohydrate, 9–25% E from protein, and 20–40% E from fat with a median fiber and saturated fat
intake of 22 g/d (range: 13–41 g/d) and 7.4% E (range: 3–10% E), respectively. The background diets of
the control arms consisted of 41–69% E from carbohydrate, 9–26% E from protein, and 22–37% E from
fat with a median fiber and saturated fat intake of 24 g/d (range: 7.7–42 g/d) and 8% E (range: 4–12% E),
respectively. In terms of feeding control, 1 trial was metabolically controlled (i.e. all foods were
provided)30, 8 trials were partially metabolically controlled (i.e. test foods/supplements were provided),
and 2 trials were not metabolically controlled (i.e. dietary advice was provided)158, 193; otherwise it was
unclear159. The median follow-up duration was 8-weeks (range: 4 weeks–4 years).
The majority of trials (92%) were considered to be of poor quality (MQS<8). Absence of double-
blinding and a preselected or indeterminate sample selection contributed to lower scores
(Supplemental Table 4.2). Majority of the trials (>75%) were judged as having a “low” or “unclear risk
bias” in majority of the domains measured by the Cochrane Risk of Bias Tool. Five trials (42%) were
considered “high risk of bias” due to incomplete outcome data (Supplemental Figure 4.1). In terms of
sources of funding, 5 trials (42%) were funded by agency alone; 4 trials (33%) were funded by both
agency and industry and for 3 trials funding information was not available.
4.4.3 HEMOGLOBIN A1C (HbA1C)
Figure 4.2A shows a forest plot of the pooled effect of replacing animal with plant protein on
HbA1c in individuals with T1D and T2D. Diets emphasizing this replacement significantly lowered HbA1c
in comparison to control diets (MD=-0.16% [95% CI: -0.27, -0.05%]; P=0.006), with no significant
evidence of inter-study heterogeneity (I2=0%; P=0.55). Systematic removal of individual trials did not
alter the results. Sensitivity analyses using different correlation coefficients in paired analyses of
crossover trials (0.25 and 0.75) did not alter the significance of the pooled effect size.
Supplemental Table 4.3 and Supplemental Figure 4.2A-B show the results of continuous and
categorical subgroup analyses for the effect of replacing sources of animal with plant protein on HbA1c.
Meta-regression analyses did not reveal any statistically significant subgroup effects.
4.4.4 FASTING GLUCOSE
Figure 4.2B shows a forest plot of the pooled effect of replacing animal with plant protein on FG
in individuals with T1D and T2D. Diets emphasizing this replacement significantly lowered fasting
glucose in comparison to control diets (MD=-0.53 mmol/L [95% CI: -0.92, -0.13 mmol/L]; P=0.009) with
considerable amount of inter-study heterogeneity (I2=82%; P<0.00001). Although heterogeneity was

SYSTEMATIC REVIEW AND META-ANALYSIS
36
significant, 8 of the 10 trials fell on the left side of the line of unity, which favours the replacement of
animal with plant protein. Systematic removal of individual trials did not alter the results. Sensitivity
analyses using different correlation coefficients in paired analyses of crossover trials (0.25 and 0.75) did
not alter the significance of the pooled effect size.
Supplemental Table 4.4, Supplemental Table 4.6A-D and Supplemental Figure 4.3A-B show the
results of continuous and categorical subgroup analyses for the effect of replacing animal with plant
protein on fasting glucose. Two significant subgroups were identified in the categorical subgroup
analyses (Supplemental Figure 4.3A). Evidence of effect modification was seen for animal protein type,
where the fasting glucose reduction achieved by replacing mixed animal protein sources with plant
protein was significantly greater than the fasting glucose reduction achieved by replacing dairy or red
meat protein sources with plant protein (P=0.003). An effect modification was also seen with percent
animal protein replaced with plant protein from total protein, where the fasting glucose reduction in
trials that replaced ≥35% of animal protein with plant protein was significantly greater than the fasting
glucose reduction when replacing <35% (P=0.025). No other subgroup analyses revealed statistically
significant subgroup effects. Post-hoc analyses for the continuous subgroup looking at percent animal
protein replaced with plant protein (from total protein) on fasting glucose using a piecewise linear meta-
regression did not indicate a dose-threshold (Supplemental Table 4.6A-D).
4.4.5 FASTING INSULIN
Figure 4.2C shows a forest plot of the pooled effect of replacing animal with plant protein on
fasting insulin in individuals with T2D. Diets emphasizing this replacement significantly lowered fasting
insulin in comparison to control diets (MD=-10.09 pmol/L [95% CI: -17.31, -2.86 pmol/L]; P=0.006) with
no significant evidence of inter-study heterogeneity (I2=0%; P=0.41). Sensitivity analyses showed that
removal of any one of the following 3 trials nullified the significance of the effect estimate: Gobert et
al.173 (MD=-6.89 pmol/L [95% CI: -19.20, 5.42 pmol/L]; P=0.27; I2=24%; P=0.27); Cohen et al.171(MD=-8.68
pmol/L [95% CI: -17.90, 0.53 pmol/L]; P=0.06; I2=22%; P=0.28) and Hosseinpour-Niazi et al.158 (MD=-3.89
pmol/L [95% CI: -15.61, 7.83 pmol/L]; P=0.52; I2=0%; P=0.52). None of these trials included insulin-
treated participants. Sensitivity analyses using different correlation coefficients of crossover trials
showed that a correlation coefficient of 0.25 did not alter the significance of the pooled effect size, but a
correlation coefficient of 0.75 changed the pooled effect size from significant to non-significant (MD=-
7.14 pmol/L [95% CI: -16.69, 2.40 pmol/L]; P=0.14; I2=38%; P=0.17).

SYSTEMATIC REVIEW AND META-ANALYSIS
37
Supplemental Table 4.5 and Supplemental Figure 4.4A-B show the results of continuous and
categorical subgroup analyses for the effect of replacing animal with plant protein on fasting insulin.
Meta-regression analyses did not reveal any statistically significant subgroup effects.
4.4.6 PUBLICATION BIAS
Figure 4.3A–C shows the funnel plots for each endpoint. Visual inspection of funnel plots
revealed asymmetry for HbA1c and fasting glucose, suggesting study effects favouring the replacement of
animal for plant protein. Egger tests revealed significant evidence of publication bias for HbA1c and
approached significance for fasting glucose. Begg tests did not reveal significant evidence of publication
bias for any of the endpoints. With one exception, these tests should be interpreted with caution, as
most of them were based on <10 trials188. Trim-and-fill analyses for HbA1c and fasting insulin did not
identify any potentially missed studies due to publication bias (Supplementary Figures 4.5A, C),
however, asymmetry in the funnel plot for fasting glucose was identified, and 1 additional study was
“filled” in to mitigate publication bias. With the inclusion of the “filled” study, the MD for fasting glucose
was not significantly altered (MD=-0.56 mmol/L [95% CI: -0.94, -0.18 mmol/L], P=0.004; Supplementary
Figure 4.5B).
4.5 DISCUSSION
To the best of our knowledge this is the first systematic review and meta-analysis of RCTs to
assess the effect of replacing sources of animal protein with major sources of plant protein on HbA1c,
fasting glucose, and fasting insulin in individuals with T1D and T2D. We included 12 RCTs looking at the
effect of replacing animal with plant protein on these 3 endpoints in 240 predominantly middle-aged
adults. Pooled analyses showed an overall significant modest lowering of HbA1c at −0.16%, fasting
glucose at −0.53 mmol/L and fasting insulin at -10.09 pmol/L when using major sources of plant protein
to replace sources of animal protein at a level ≥35% of total protein per day over a median follow-up
duration of ~8 weeks.
4.5.1 RELATION TO OTHER STUDIES
There have been several systematic reviews and meta-analyses of RCTs looking at the effect of
specific sources of plant protein (i.e. soy products, dietary pulses, and tree nuts) on glycemic control. In
terms of soy products, 2 meta-analyses have been conducted, one in individuals with T2D108 and one in
individuals with and without diabetes (e.g. healthy, hypercholesterolemia, metabolic syndrome, etc.)107.

SYSTEMATIC REVIEW AND META-ANALYSIS
38
Both found no overall significant effect on various glycemic endpoints, however, the direction of the
effect favoured soy interventions107, 108. Two meta-analyses looking at the effect of tree nuts have also
been conducted, one in individuals with T2D12 and one in individuals with and without diabetes10. Both
found significant improvements in fasting glucose, as well as HbA1c in individuals with T2D12. Lastly,
there have been a series of meta-analyses conducted looking at the effect of incorporating dietary
pulses into the diet alone or in the context of a low-GI or high-fibre diet in individuals with and without
diabetes11. Pulses alone were found to significantly lower fasting glucose and fasting insulin. In the
context of a low-GI and high-fibre diet, pulses were found to significantly lower glycosylated blood
proteins (measured as HbA1c or fructosamine), and fasting glucose in the context of a high-fibre diet11.
Overall, the results of these meta-analyses appear to be consistent with our findings.
4.5.2 POSSIBLE MECHANISMS OF ACTION
Several potential mechanisms may explain the beneficial effects of replacing animal with plant
protein on glycemic control. The reduction in body iron stores may be one such mechanism. As a pro-
oxidant, iron catalyzes several cellular reactions that result in the production of reactive oxygen species,
which increases oxidative stress and tissue damage, including damaging pancreatic β-cells60, 195.
Prospective cohort studies have shown that increased heme iron intake, found only in animal protein
sources196, is significantly associated with an increased risk of T2D197, 198, whereas non-heme iron intake,
which is found in both plant and animal source foods196, has been shown to be either inversely
associated with198 or not associated with197 T2D incidence. This may be attributed to differences in
bioavailability between non-heme and heme iron, as heme iron is associated with higher body iron
stores199, 200. Observational studies showed that serum ferritin, the storage form of iron, predicted the
development of hyperglycemia201, 202 and T2D201, 203 and was found to be positively associated with
insulin resistance201, 204, 205. In addition, randomized trials have shown that the use of phlebotomy to
reduce serum ferritin levels was associated with improved glucose tolerance in individuals with MetS206
and T2D207. Another mechanism may relate to differences in amino acid profiles of animal and plant
protein. Compared to animal proteins, plant proteins appear to be higher in L-arginine. Randomized
trials have shown that long-term oral administration of L-arginine improves insulin sensitivity in
individuals with T2D208, 209 and in vitro studies suggest that L-arginine promotes insulin secretion from
pancreatic β-cells by stimulating electrical activity210-214. Although our findings show improvements for
fasting insulin, specific measures of insulin sensitivity were not explored in the present meta-analysis,
where only one of the included trials looked at insulin resistance and showed non-significant reductions
in HOMA-IR173. Neither endpoint, however, is considered to be a good marker of peripheral insulin

SYSTEMATIC REVIEW AND META-ANALYSIS
39
sensitivity215 and thus further studies are warranted. Other potential mechanisms may involve a
reduction in the glycemic index216, 217, as well as sodium and nitrites found in processed meats218, 219.
4.5.3 A-PRIORI AND POST-HOC SUBGROUP ANALYSES
Evidence of considerable heterogeneity was found in the primary pooled analysis for fasting
glucose. Categorical subgroup analyses showed evidence of effect modification by animal protein type
(P=0.003) and percent animal protein replaced with plant protein (from total protein) (P=0.025). Based
on the residual I2 for both of these subgroups (98.26% vs. 35.82%), it appears that a large portion of the
heterogeneity is explained by the latter subgroup, which shows that trials replacing ≥35% of animal with
plant protein had greater reductions in the mean difference for fasting glucose in comparison to those
replacing <35%. Significant effect modification by this subgroup was not seen in our continuous
subgroup analysis, supporting a non-linear relationship. In addition, post-hoc analyses on this subgroup
did not identify a dose-threshold. Regarding the primary pooled analysis for fasting insulin, sensitivity
analyses suggest that the primary pooled effect size is not robust when subject to removing certain
individual trials from the pooled analysis, or when using a different correlation coefficient.
4.5.4 LIMITATIONS
Several limitations exist in the present meta-analysis. First, the majority of trials had small
sample sizes. Second, it is uncertain whether the follow-up duration of included trials was sufficient to
observe meaningful changes in glycemic control: while HbA1c levels reflect blood glucose control in the
preceding 3 months220, the majority of trials (83%) were shorter than 12-weeks in duration. There was,
however, no effect modification by follow-up duration in the subgroup analyses. Third, most trials (92%)
were of poor study quality (MQS<8), however, no effect modification by study quality were observed in
subgroup analyses. Fourth, most subgroup analyses were underpowered due to the limited number of
available studies. Fifth, only a small number of trials (17%) focused on glycemic control endpoints as a
primary outcome. Sixth, sensitivity analyses showed that the pooled effect estimate for fasting insulin
was not robust.
4.5.5 IMPLICATIONS
The reductions seen in HbA1c meets half the threshold proposed by the U.S. Food and Drug
Administration for the development of new drugs for diabetes (≥ 0.3%)221 and therefore may or may not
be clinically significant. It is important to note, however, that the glycemic benefits seen in our meta-
analysis are in addition to the use of oral glucose-lowering agents by majority of individuals. Therefore,
SYSTEMATIC REVIEW AND META-ANALYSIS
40
replacing animal protein with major sources of plant protein may be one strategy that can be utilized in
combination with medication to help improve and manage glycemic control in individuals with diabetes.
Furthermore, the majority of RCTs in our meta-analysis used soy and soy-derived products to replace
sources of animal protein, a food that is consumed by only 3.3% of Canadians on any given day, with
daily intakes ranging from 1.5 g/d among low consumers to 16.5 g/d among high consumers (<1
serving)76. In general, this is consistent with the overall consumption of major plant protein sources in
the North American population, which is very low relative to other sources of plant protein, such as
grains62, 71-73. Therefore, there is ample room in the diet to increase the intake of these sources.
4.5.6 CONCLUSIONS
In conclusion, the present systematic review and meta-analysis of RCTs found significant modest
improvements in HbA1c, fasting glucose and fasting insulin in individuals with diabetes when using major
sources of plant protein to replace sources of animal protein at a level ≥35% of total protein per day
over a median duration of ~8 weeks. Sources of uncertainty in our analyses include the estimate for
fasting glucose, which was complicated by considerable heterogeneity but largely explained by our
subgroup analysis that showed greater benefit in trials that replaced animal with plant protein at a level
≥35% of total protein and for fasting insulin, which was altered by sensitivity analyses. In order to
address these sources of uncertainty and the limitations in our analyses, there is a need for larger,
longer, higher quality RCTs designed to use other sources of plant protein, in addition to soy, to replace
animal protein at a level ≥35% total protein with glycemic endpoints as a primary outcome. The
inclusion of such RCTs in future meta-analyses will help guide the design of future RCTs in this area, as
well as the development of nutrition recommendations and health claims.
4.6 ACKNOWLEDGEMENTS
We wish to thank Teruko Kishibe of Li Ka Shing’s International Healthcare Education Centre at
St. Michael Hospital for her help in the development of the search strategy. Aspects of this work were
presented as an abstract at the Banting & Best Diabetes Centre 26th Annual Scientific Day, May 8, 2015,
Toronto, Ontario, Canada.
4.7 FUNDING
This work was supported by the Canadian Institutes of Health Research (funding reference
number, 129920) through the Canada-wide Human Nutrition Trialists’ Network (NTN). The Diet,
Digestive tract, and Disease (3-D) Centre, funded through the Canada Foundation for Innovation (CFI)
SYSTEMATIC REVIEW AND META-ANALYSIS
41
and the Ministry of Research and Innovation’s Ontario Research Fund (ORF), provided the infrastructure
for the conduct of this project. EV was funded by a Canadian Institutes of Health Research (CIHR)-
Fredrick Banting and Charles Best Canada Graduate Scholarship and the Banting and Best Diabetes
Centre (BBDC)-Yow Kam-Yuen Graduate Scholarship in Diabetes Research. RPB and DJAJ were funded by
the Government of Canada through the Canada Research Chair Endowment. None of the sponsors had a
role in any aspect of the present study, including design and conduct of the study; collection,
management, analysis, and interpretation of the data; and preparation, review, approval of the
manuscript or decision to publish.
4.8 CONFLICTS OF INTEREST
RJdS was funded by the CIHR Postdoctoral Fellowship Award and has received research support
from the CIHR, the Calorie Control Council, the Canadian Foundation for Dietetic Research and the Coca-
Cola Company (investigator initiated, unrestricted grant) and travel support from the World Health
Organization (WHO) to attend group meetings. He has served as an external resource person to WHO's
Nutrition Guidelines Advisory Group and is the lead author of 2 systematic reviews and meta-analyses
commissioned by WHO of the relation of saturated fatty acids and trans fatty acids with health
outcomes. AJH hold a Tier II Canada Research Chair in Diabetes Epidemiology. RPB has received research
funding from Bunge Ltd., travel support from Unilever and consultant fees from Kraft Foods and Mead
Johnson. CWCK has received research support from the Advanced Foods and Material Network,
Agrifoods and Agriculture Canada, the Almond Board of California, the American Pistachio Growers,
Barilla, the California Strawberry Commission, the Calorie Control Council, CIHR, the Canola Council of
Canada, the Coca-Cola Company (investigator initiated, unrestricted grant), Hain Celestial, the
International Tree Nut Council Nutrition Research and Education Foundation, Kellogg, Kraft, Loblaw
Companies Ltd., Orafti, Pulse Canada, Saskatchewan Pulse Growers, Solae and Unilever. He has received
travel funding, consultant fees and/or honoraria from Abbott Laboratories, the Almond Board of
California, the American Peanut Council, the American Pistachio Growers, Barilla, Bayer, the Canola
Council of Canada, the Coca-Cola Company, Danone, General Mills, the International Tree Nut Council
Nutrition Research and Education Foundation, Kellogg, Loblaw Companies Ltd., the Nutrition Foundation
of Italy, Oldways Preservation Trust, Orafti, Paramount Farms, the Peanut Institute, PepsiCo, Pulse
Canada, Sabra Dipping Co., Saskatchewan Pulse Growers, Solae, Sun-Maid, Tate and Lyle, and Unilever.
He is on the Dietary Guidelines Committee for the Diabetes Nutrition Study Group of the European
Association for the Study of Diabetes and has served on the scientific advisory board for the Almond
Board of California, the International Tree Nut Council, Oldways Preservation Trust, Paramount Farms
SYSTEMATIC REVIEW AND META-ANALYSIS
42
and Pulse Canada. DJAJ has received research grants from Saskatchewan Pulse Growers, the Agricultural
Bioproducts Innovation Program through the Pulse Research Network, the Advanced Foods and Material
Network, Loblaw Companies Ltd., Unilever, Barilla, the Almond Board of California, the Coca-Cola
Company (investigator initiated, unrestricted grant), Solae, Haine Celestial, the Sanitarium Company,
Orafti, the International Tree Nut Council Nutrition Research and Education Foundation, the Peanut
Institute, the Canola and Flax Councils of Canada, the Calorie Control Council, the CIHR, the Canada
Foundation for Innovation and the Ontario Research Fund. He has received an honorarium from the
United States Department of Agriculture to present the 2013 W.O. Atwater Memorial Lecture. He
received the 2013 Award for Excellence in Research from the International Nut and Dried Fruit Council.
He received funding and travel support from the Canadian Society of Endocrinology and Metabolism to
produce mini cases for the Canadian Diabetes Association. He has been on the speaker's panel, served
on the scientific advisory board, and/or received travel support and/or honoraria from the Almond
Board of California, Canadian Agriculture Policy Institute, Loblaw Companies Ltd, the Griffin Hospital (for
the development of the NuVal scoring system), the Coca- Cola Company, Saskatchewan Pulse Growers,
Sanitarium Company, Orafti, the Almond Board of California, the American Peanut Council, the
International Tree Nut Council Nutrition Research and Education Foundation, the Peanut Institute,
Herbalife International, Pacific Health Laboratories, Nutritional Fundamental for Health, Barilla,
Metagenics, Bayer Consumer Care, Unilever Canada and Netherlands, Solae, Kellogg, Quaker Oats,
Procter and Gamble, the Coca-Cola Company, the Griffin Hospital, Abbott Laboratories, the Canola
Council of Canada, Dean Foods, the California Strawberry Commission, Haine Celestial, PepsiCo, the
Alpro Foundation, Pioneer Hi- Bred International, DuPont Nutrition and Health, Spherix Consulting and
WhiteWave Foods, the Advanced Foods and Material Network, the Canola and Flax Councils of Canada,
the Nutritional Fundamentals for Health, AgriCulture and Agri-Food Canada, the Canadian Agri-Food
Policy Institute, Pulse Canada, the Saskatchewan Pulse Growers, the Soy Foods Association of North
America, the Nutrition Foundation of Italy (NFI), Nutra-Source Diagnostics, the McDougall Program, the
Toronto Knowledge Translation Group (St. Michael's Hospital), the Canadian College of Naturopathic
Medicine, The Hospital for Sick Children, the Canadian Nutrition Society (CNS), the American Society of
Nutrition (ASN), Arizona State University, Paolo Sorbini Foundation and the Institute of Nutrition,
Metabolism and Diabetes. JLS has received research support from the Canadian Institutes of health
Research (CIHR), Calorie Control Council, American Society of Nutrition (ASN), The Coca-Cola Company
(investigator initiated, unrestricted), Dr. Pepper Snapple Group (investigator initiated, unrestricted),
Pulse Canada, and The International Tree Nut Council Nutrition Research & Education Foundation. He
has received travel funding, speaker fees, and/or honoraria from the American Heart Association (AHA),

SYSTEMATIC REVIEW AND META-ANALYSIS
43
American College of Physicians (ACP), American Society for Nutrition (ASN), National Institute of
Diabetes and Digestive and Kidney Diseases (NIDDK) of the National Institutes of Health (NIH), Canadian
Diabetes Association (CDA), Canadian Nutrition Society (CNS), University of South Carolina, University of
Alabama at Birmingham, Oldways Preservation Trust, Nutrition Foundation of Italy (NFI), Calorie Control
Council, Diabetes and Nutrition Study Group (DNSG) of the European Association for the Study of
Diabetes (EASD), International Life Sciences Institute (ILSI) North America, International Life Sciences
Institute (ILSI) Brazil, Abbott Laboratories, Pulse Canada, Canadian Sugar Institute, Dr. Pepper Snapple
Group, The Coca-Cola Company, Corn Refiners Association, World Sugar Research Organization, and
Società Italiana di Nutrizione Umana (SINU). He has consulting arrangements with Winston & Strawn
LLP, Perkins Coie LLP, and Tate & Lyle. He is on the Clinical Practice Guidelines Expert Committee for
Nutrition Therapy of both the Canadian Diabetes Association (CDA) and European Association for the
study of Diabetes (EASD), as well as being on an American Society for Nutrition (ASN) writing panel for a
scientific statement on sugars. He is a member of the International Carbohydrate Quality Consortium
(ICQC) and Board Member of the Diabetes and Nutrition Study Group (DNSG) of the EASD. He serves an
unpaid scientific advisor for the International Life Science Institute (ILSI) North America, Food, Nutrition,
and Safety Program (FNSP). His wife is an employee of Unilever Canada. No competing interests were
declared by EV, SES, VHJ, APN, AM, SBM, LL and RJ. There are no patents, products in development or
marketed products to declare.
4.9 AUTHOR CONTRIBUTIONS
Conceived and designed the experiments: CWCK DJAJ JLS. Analyzed the data: EV SES VHJ AG AM
RJdS JLS. Wrote the paper: EV JLS. Interpretation of the data: EV SES VHJ AG AM RJdS AJH RPB LAL RJ.
Critical revision of the article for important intellectual content: EV SES VHJ AM RJdS AJH RPB SBM LAL
RJ CWCK DJAJ JLS. Final approval of the article: EV SES VHJ AM RJdS AJH RPB SBM LAL RJ CWCK DJAJ JLS..
Obtaining of funding: CWCK DJAJ JLS. Administrative, technical, or logistic support: SBM VHJ AM.
Collection and assembly of data: EV SES AG AM. Guarantors: CWCK DJAJ JLS.
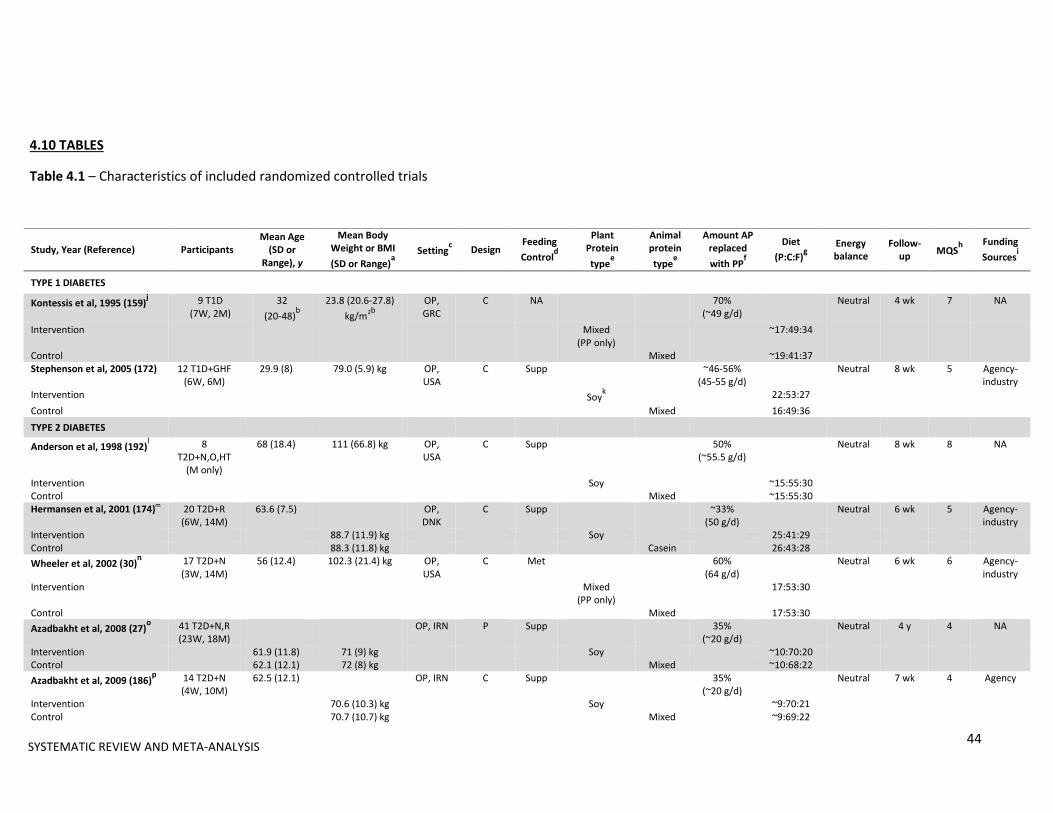
44
4.10 TABLES
Table 4.1 – Characteristics of included randomized controlled trials
Study, Year (Reference) Participants Mean Age
(SD or Range), y
Mean Body Weight or BMI
(SD or Range)a
Settingc Design
Feeding
Controld
Plant Protein
typee
Animal protein
typee
Amount AP replaced
with PPf
Diet
(P:C:F)g
Energy balance
Follow-up
MQSh
Funding
Sourcesi
TYPE 1 DIABETES
Kontessis et al, 1995 (159)j 9 T1D
(7W, 2M) 32
(20-48)b
23.8 (20.6-27.8)
kg/m2b
OP, GRC
C NA 70% (~49 g/d)
Neutral 4 wk 7 NA
Intervention Mixed (PP only)
~17:49:34
Control Mixed ~19:41:37 Stephenson et al, 2005 (172) 12 T1D+GHF
(6W, 6M) 29.9 (8) 79.0 (5.9) kg OP,
USA C Supp ~46-56%
(45-55 g/d) Neutral 8 wk 5 Agency-
industry Intervention Soy
k 22:53:27
Control Mixed 16:49:36
TYPE 2 DIABETES
Anderson et al, 1998 (192)l 8
T2D+N,O,HT (M only)
68 (18.4) 111 (66.8) kg OP, USA
C Supp 50% (~55.5 g/d)
Neutral 8 wk 8 NA
Intervention Soy ~15:55:30 Control Mixed ~15:55:30 Hermansen et al, 2001 (174)m
20 T2D+R (6W, 14M)
63.6 (7.5) OP, DNK
C Supp ~33% (50 g/d)
Neutral 6 wk 5 Agency-industry
Intervention 88.7 (11.9) kg Soy 25:41:29 Control 88.3 (11.8) kg Casein 26:43:28
Wheeler et al, 2002 (30)n 17 T2D+N
(3W, 14M) 56 (12.4) 102.3 (21.4) kg OP,
USA C Met 60%
(64 g/d) Neutral 6 wk 6 Agency-
industry Intervention Mixed
(PP only) 17:53:30
Control Mixed 17:53:30
Azadbakht et al, 2008 (27)o 41 T2D+N,R
(23W, 18M) OP, IRN P Supp 35%
(~20 g/d) Neutral 4 y 4 NA
Intervention 61.9 (11.8) 71 (9) kg Soy ~10:70:20 Control 62.1 (12.1) 72 (8) kg Mixed ~10:68:22
Azadbakht et al, 2009 (186)p 14 T2D+N
(4W, 10M) 62.5 (12.1) OP, IRN C Supp 35%
(~20 g/d) Neutral 7 wk 4 Agency
Intervention 70.6 (10.3) kg Soy ~9:70:21 Control 70.7 (10.7) kg Mixed ~9:69:22
SYSTEMATIC REVIEW AND META-ANALYSIS

45
Table 4.1 (continued) – Characteristics of included randomized controlled trials
AP=animal protein; C=crossover; CAN=Canada; DA=dietary advice; DNK=Denmark; GHF=glomerular hyperfiltration; GRC=Greece; HT=hypertension; IRN=Iran; M=men; Met=metabolic
feeding control; MQS=Heyland Methodological Quality Score; N=nephropathy; NA=data not available; O=overweight and/or obese; P=parallel; PP=plant protein; R=retinopathy;
Supp=supplemental feeding control; T1D=type 1 diabetes; T2D=type 2 diabetes; USA=United States of America; W=women; wk=weeks; y=years aBaseline body weight (kg) values. Baseline BMI values (kg/m
2) are only reported when no data on weight were available.
bReported as a median value.
cCountries are abbreviated using three letter country codes (ISO 3166-1 alpha-3 codes).
dMetabolic feeding control (Met) was the provision of all meals, snacks, and study supplements consumed during the study under controlled conditions. Supplement feeding control
(Supp) was the provision of study supplements only. Dietary advice (DA) is the provision of counseling on the appropriate test and control diets.
Study, Year (Reference) Participants Mean Age
(SD or Range), y
Mean Body Weight or BMI
(SD or Range)a
Settingc Design
Feeding
Controld
Plant Protein
typee
Animal protein
typee
Amount AP replaced
with PPf
Diet
(P:C:F)g
Energy balance
Follow-up
MQSh
Funding
Sourcesi
Gobert et al, 2010 (173)q 29 T2D
(13W, 16M) 60.1 (9.64) 83.4 (10.9) kg OP, CAN C
Supp ~34%
(40 g/d) Neutral 8 wk 7 Agency-
industry Intervention Soy ~23:45:32 Control Milk ~23:44:33
Cohen et al, 2011 (171)r 13 T2D
(6W, 7M) OP, USA P Supp NA
(~6 g/d) NA Neutral 12 wk 7 Agency
Intervention 66 (8.1) 96.1 (21.8) kg Almonds Control 66 (8.7) 105.1 (29.6) kg Cheese
Miraghajani et al, 2013 (175)s 25 T2D+N
(15W, 10M) 51 (10) OP, IRN C DA ~4%
(2.5 g/d) Neutral 4 wk 6 Agency
Intervention 76.1 (13.2) kg Soy 14:46:40 Control 76.5 (13.6) kg Milk 13:50:37 Abd-Mishani et al, 2014
(193)t
21 T2D (18W, 6M)
61.7 (6) 74.5 (7.1) kg OP, IRN C DA ~18% (~13.3 g/d)
Neutral 8 wk 4 Agency
Intervention Pulses 15:55:30 Control Red
meat 15:55:30
Hosseinpour-Niazi et al, 2014
(158)t
31 T2D+O (24W, 7M)
58.1 (33.4) OP, IRN C DA ~17% (~13.3 g/d)
Neutral 8 wk 6 Agency
Intervention 27.7 (3.34) kg/m2 Pulses 14:54:33 Control 27.8 (3.34) kg/m2 Red
meat 15:52:34
SYSTEMATIC REVIEW AND META-ANALYSIS

46
ePlant and animal protein types refer to the specific sources of plant proteins prescribed by the study to replace a specific source(s) of animal protein. If prescribed plant or animal
protein type was not specified by the study it was assumed that the protein type consisted of mixed sources. For example, Kontessis et al.159
referred to their intervention arm as a
“vegetable protein diet” and their control arm as an “animal protein diet”; therefore it was assumed that the intervention and control arm consisted of mixed sources of plant and animal
protein, respectively. All protein sources prescribed in each study were in whole food form with the exception of Hermansen et al.174
and Gobert et al.173
which prescribed isolated
protein powders. Any study with an intervention arm prescribing plant protein exclusively rather than partial substitution of animal for plant protein is indicated in parentheses as “PP
only”. fNumbers in this column represent the amount of plant protein that was prescribed by the study to replace animal protein. Numbers not in parentheses represent the percent of total
protein replacing animal protein with plant protein. Numbers in parentheses represent the amount of plant protein prescribed/amount of animal protein replaced in grams per day.
Numbers preceded by “~” were calculated using relevant data provided by the study. gNumbers in this column indicate the designed percent energy breakdown from protein:carbohydrate:fat reported from each study. If these values were not available or provided, the
measured percent energy breakdown from the end of the study were used. Numbers preceded by “~” were calculated using relevant data provided by the study. hTrials with a MQS score ≥8 were considered to be of higher quality.
iAgency funding is that from government, university, or not-for-profit health agency sources. None of the trialists declared any conflicts of interest with the exception of Stephenson et al. 172
and Hermansen et al. 29
. jBoth intervention and control arm were designed to contain 1 gram of protein per kilogram body weight per day. Intervention arm consisted of plant protein exclusively and the control
arm consisted of~70% animal protein and 30% plant protein. The intervention arm was also provided animal fat supplements, as well as calcium and phosphate tablets. kNine daily soy food intake options were provided: soy patties; soy pasta; soy chocolate beverage; chocolate, vanilla, or plain silk soy milk; lemon or chocolate soy bars; roasted soy nuts,
or frozen edamame. lBoth intervention and control arm were designed to contain 1 gram of protein per kilogram body weight per day. Fifty percent of the protein in the soy protein intervention arm was in
the form of a beverage, meat analogue patties, or ground meat analogue, whereas 50% of the protein in the animal protein control arm was in the form of ground beef with a specified
fat content and cow milk. m
Both intervention and control arm were provided with their respective powders and instructed to mix half of their daily allotted amount in 250ml of water before breakfast and half
before their evening meal. The powder provided in the intervention arm also contained 20g/d of soy cotyledon fiber and a high isoflavone content (minimum 165 mg/d), whereas the
powder provided in the control arm contained 20 g/d of cellulose. nIntervention arm consisted of plant protein exclusively (62% soy-based), where major protein foods included tofu, textured vegetable protein, soy milk, and legumes. The control arm
consisted of 60% animal protein and 40% plant protein, where major protein foods included beef, poultry, fish and milk. o73% of participants in this study had retinopathy. Both intervention and control arm were designed to contain 0.8 grams of protein per kilogram body weight per day. The intervention
arm consisted of 35% soy protein (in the form of textured soy protein), 30% other plant protein and 35% animal protein and the control arm consisted of 70% animal protein and 30%
plant protein. pThe intervention arm consisted of 35% soy protein (in the form of textured soy protein), 30% other plant protein and 35% animal protein and the control arm consisted of 70% animal
protein and 30% plant protein.
SYSTEMATIC REVIEW AND META-ANALYSIS
47
qWomen in this study were postmenopausal. The powder provided in the intervention arm also consisted of 88 mg/d isoflavones (65% genistein, 31% daidzein, 4% glycitein).
Participants supplemented their habitual diets with the powders and were provided with multiple examples of ways to consume them but were encouraged to reconstitute them with
water with the option of adding Nestle flavor packets. In order to avoid excess protein and calcium intakes, participants were counseled to replace foods like milk, cheese, and lunch
meat with the powders. rParticipants were instructed to consume their food prescription (1 oz almonds or 2 cheese sticks) 5 days per week.
sBoth intervention and control arm were designed to contain 0.8 grams of protein per kilogram body weight per day. The intervention and control arm consisted of 1 glass of soy and
cow’s milk (240 mL each) per day, respectively. tBoth intervention and control arm were prescribed a Therapeutic Lifestyle Change (TLC) diet. The intervention arm was the same as the control arm but participants were advised to
replace 2 servings of red meat with different types of cooked legumes such as lentils, chickpeas, peas and beans 3 days per week. Half a cup of cooked legumes was considered to be
one serving of red meat.
tBoth intervention
and control arm were
prescribed a
Therapeutic Lifestyle
Change (TLC) diet.
The intervention arm
was the same as the
control arm but
participants were
advised to replace 2
servings of red meat
with different types
of cooked legumes
such as lentils,
chickpeas, peas and
beans 3 days per
week. Half a cup of
cooked legumes was
considered to be one
serving of red meat.
SYSTEMATIC REVIEW AND META-ANALYSIS

SYSTEMATIC REVIEW AND META-ANALYSIS
48
4.11 FIGURES
Figure 4.1 – Flow diagram depicting the literature search and selection process
2554 Reports identified:2028 EMBASE (through 26 Aug 2015)399 MEDLINE (through 26 Aug 2015)124 The Cochrane Library (through 26 Aug 2015)3 Manual searches
2496 Reports excluded on basis of title and/or abstract:104 Acute/short-term studies872 Animal/in-vitro/non-human studies8 Case studies18 Clinical practice guidelines/recommendations486 Duplicate reports/studies148 Letters/editorials/commentaries/conference proceedings13 Non-randomized studies366 Observational studies251 Review papers and meta-analyses43 Studies not conducted in individuals with diabetes 158 Studies with no plant protein intervention 22 Studies with unsuitable control group7 Studies with unsuitable outcome data
58 Reports reviewed in full
45 Reports excluded: 6 Acute/short-term studies3 Letters/editorials/commentaries/conference proceedings5 Non-randomized studies20 Studies with unsuitable control group7 Studies with unsuitable outcome data5 Studies with no plant protein intervention
12 Reports [12 trials] included in the meta-analysis:HbA1c: 8 trials (n=133)Fasting glucose: 10 trials (n=218)Fasting insulin: 5 trials (n=118)

SYSTEMATIC REVIEW AND META-ANALYSIS
49
Figure 4.2A – Forest plot of RCTs investigating the effect of replacing sources of animal with plant
protein in individuals with diabetes on HbA1c. Pooled effect estimates for each subgroup and overall
effect are represented by the diamonds. Data are expressed as weighted mean differences (MD) with
95% CIs, using the generic inverse-variance method with random effects models. Paired analyses were
applied to all crossover trials. Inter-study heterogeneity was tested by the Cochran Q-statistic and
quantified by I2 at a significance level of P <0.10.
Study or Subgroup
4.5.1 T2D
Anderson 1998
Hermansen
Wheeler
Gobert
Cohen
MiraghajaniSubtotal (95% CI)
Heterogeneity: Tau² = 0.00; Chi² = 3.93, df = 5 (P = 0.56); I² = 0%
Test for overall effect: Z = 2.54 (P = 0.01)
4.5.2 T1D
Kontessis
StephensonSubtotal (95% CI)
Heterogeneity: Tau² = 0.00; Chi² = 0.55, df = 1 (P = 0.46); I² = 0%
Test for overall effect: Z = 1.59 (P = 0.11)
Total (95% CI)
Heterogeneity: Tau² = 0.00; Chi² = 5.93, df = 7 (P = 0.55); I² = 0%
Test for overall effect: Z = 2.75 (P = 0.006)
Test for subgroup differences: Chi² = 1.45, df = 1 (P = 0.23), I² = 31.1%
Mean Difference
-0.7
-0.3
-0.1
-0.06
-0.3
-0.364
-0.3
-0.9
SE
0.5
0.338
0.084
0.117
0.133
0.387
0.608
0.535
Weight
1.3%
2.9%
47.7%
24.6%
19.0%
2.2%97.9%
0.9%
1.2%2.1%
100.0%
IV, Random, 95% CI
-0.70 [-1.68, 0.28]
-0.30 [-0.96, 0.36]
-0.10 [-0.26, 0.06]
-0.06 [-0.29, 0.17]
-0.30 [-0.56, -0.04]
-0.36 [-1.12, 0.39]-0.15 [-0.26, -0.03]
-0.30 [-1.49, 0.89]
-0.90 [-1.95, 0.15]-0.64 [-1.43, 0.15]
-0.16 [-0.27, -0.05]
Year
1998
2001
2002
2010
2011
2012
1995
2005
Mean Difference Mean Difference
IV, Random, 95% CI
-2 -1 0 1 2Favours [experimental] Favours [control]
Subgroup and Study (Reference)
Year Participants, n Weight, % Mean Difference [95% CI] in HbA1c, %
Type 2 Diabetes
Anderson et al. (192) 1998 8 1.3 -0.70 [-1.68, 0.28]
Hermansen et al. (174) 2001 20 2.9 -0.30 [-0.96, 0.36]
Wheeler et al. (30) 2002 17 47.7 -0.10 [-0.26, 0.06]
Gobert et al. (173) 2010 29 24.6 -0.06 [-0.29, 0.17]
Cohen et al. (171) 2011 13 19.0 -0.30 [-0.56, -0.04]
Miraghajani et al. (175) 2013 25 2.2 -0.36 [-1.12, 0.39]
Subtotal (95% CI) 97.9 -0.15 [-0.26, -0.03]
Heterogeneity: Tau² = 0.00; Chi² = 3.93, df = 5 (P = 0.56); I² = 0%
Test for overall effect: Z = 2.54 (P = 0.01)
Type 1 Diabetes
Kontessis et al. (159) 1995 9 0.9 -0.30 [-1.49, 0.89]
Stephenson et al. (172) 2005 12 1.2 -0.90 [-1.95, 0.15]
Subtotal (95% CI) 2.1 -0.64 [-1.43, 0.15]
Heterogeneity: Tau² = 0.00; Chi² = 0.55, df = 1 (P = 0.46); I² = 0%
Test for overall effect: Z = 1.59 (P = 0.11)
Total (95% CI) 133 100 -0.16 [-0.27, -0.05]
Heterogeneity: Tau² = 0.00; Chi² = 5.93, df = 7 (P = 0.55); I² = 0%
Test for overall effect: Z = 2.75 (P = 0.006)
Test for subgroup differences: Chi² = 1.45, df = 1 (P = 0.23), I² = 31.1% Favours
Animal ProteinFavours
Plant Protein
-2 -1 0 1 2
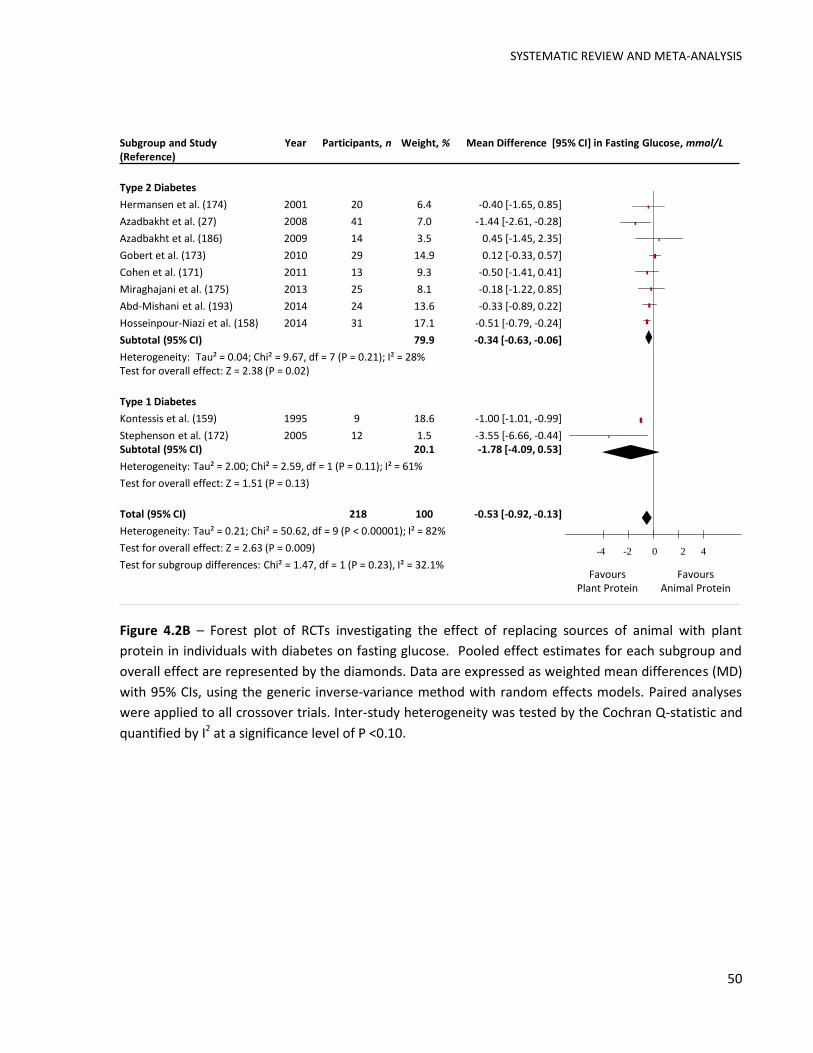
SYSTEMATIC REVIEW AND META-ANALYSIS
50
Figure 4.2B – Forest plot of RCTs investigating the effect of replacing sources of animal with plant
protein in individuals with diabetes on fasting glucose. Pooled effect estimates for each subgroup and
overall effect are represented by the diamonds. Data are expressed as weighted mean differences (MD)
with 95% CIs, using the generic inverse-variance method with random effects models. Paired analyses
were applied to all crossover trials. Inter-study heterogeneity was tested by the Cochran Q-statistic and
quantified by I2 at a significance level of P <0.10.
Study or Subgroup
4.2.1 T2D
Hermansen
Azadbakht 2008
Azadbakht 2009
Gobert
Cohen
Miraghajani
Abd-Mishani
Hosseinpour-NiaziSubtotal (95% CI)
Heterogeneity: Tau² = 0.04; Chi² = 9.67, df = 7 (P = 0.21); I² = 28%
Test for overall effect: Z = 2.38 (P = 0.02)
4.2.2 T1D
Kontessis
StephensonSubtotal (95% CI)
Heterogeneity: Tau² = 2.00; Chi² = 2.59, df = 1 (P = 0.11); I² = 61%
Test for overall effect: Z = 1.51 (P = 0.13)
Total (95% CI)
Heterogeneity: Tau² = 0.21; Chi² = 50.62, df = 9 (P < 0.00001); I² = 82%
Test for overall effect: Z = 2.63 (P = 0.009)
Test for subgroup differences: Chi² = 1.47, df = 1 (P = 0.23), I² = 32.1%
Mean Difference
-0.4
-1.443
0.45
0.12
-0.5
-0.184
-0.333
-0.511
-0.999
-3.552
SE
0.638
0.595
0.968
0.232
0.465
0.528
0.282
0.14
0.007
1.586
Weight
6.4%
7.0%
3.5%
14.9%
9.3%
8.1%
13.6%
17.1%79.9%
18.6%
1.5%20.1%
100.0%
IV, Random, 95% CI
-0.40 [-1.65, 0.85]
-1.44 [-2.61, -0.28]
0.45 [-1.45, 2.35]
0.12 [-0.33, 0.57]
-0.50 [-1.41, 0.41]
-0.18 [-1.22, 0.85]
-0.33 [-0.89, 0.22]
-0.51 [-0.79, -0.24]-0.34 [-0.63, -0.06]
-1.00 [-1.01, -0.99]
-3.55 [-6.66, -0.44]-1.78 [-4.09, 0.53]
-0.53 [-0.92, -0.13]
Year
2001
2008
2009
2010
2011
2012
2014
2014
1995
2005
Mean Difference Mean Difference
IV, Random, 95% CI
-4 -2 0 2 4Favours Vegetable Protein Favours Animal Protein
Subgroup and Study (Reference)
Year Participants, n Weight, % Mean Difference [95% CI] in Fasting Glucose, mmol/L
Type 2 Diabetes
Hermansen et al. (174) 2001 20 6.4 -0.40 [-1.65, 0.85]
Azadbakht et al. (27) 2008 41 7.0 -1.44 [-2.61, -0.28]
Azadbakht et al. (186) 2009 14 3.5 0.45 [-1.45, 2.35]
Gobert et al. (173) 2010 29 14.9 0.12 [-0.33, 0.57]
Cohen et al. (171) 2011 13 9.3 -0.50 [-1.41, 0.41]
Miraghajani et al. (175) 2013 25 8.1 -0.18 [-1.22, 0.85]
Abd-Mishani et al. (193) 2014 24 13.6 -0.33 [-0.89, 0.22]
Hosseinpour-Niazi et al. (158) 2014 31 17.1 -0.51 [-0.79, -0.24]
Subtotal (95% CI) 79.9 -0.34 [-0.63, -0.06]
Heterogeneity: Tau² = 0.04; Chi² = 9.67, df = 7 (P = 0.21); I² = 28% Test for overall effect: Z = 2.38 (P = 0.02)
Type 1 Diabetes
Kontessis et al. (159) 1995 9 18.6 -1.00 [-1.01, -0.99]
Stephenson et al. (172) 2005 12 1.5 -3.55 [-6.66, -0.44]Subtotal (95% CI) 20.1 -1.78 [-4.09, 0.53]
Heterogeneity: Tau² = 2.00; Chi² = 2.59, df = 1 (P = 0.11); I² = 61%
Test for overall effect: Z = 1.51 (P = 0.13)
Total (95% CI) 218 100 -0.53 [-0.92, -0.13]
Heterogeneity: Tau² = 0.21; Chi² = 50.62, df = 9 (P < 0.00001); I² = 82%
Test for overall effect: Z = 2.63 (P = 0.009)
Test for subgroup differences: Chi² = 1.47, df = 1 (P = 0.23), I² = 32.1% -4 -2 0 2 4
Favours Plant Protein
Favours Animal Protein

SYSTEMATIC REVIEW AND META-ANALYSIS
51
Figure 4.2C – Forest plot of RCTs investigating the effect of replacing sources of animal with plant
protein in individuals with diabetes on fasting insulin. Pooled effect estimates for each subgroup and
overall effect are represented by the diamonds. Data are expressed as weighted mean differences (MD)
with 95% CIs, using the generic inverse-variance method with random effects models. Paired analyses
were applied to all crossover trials. Inter-study heterogeneity was tested by the Cochran Q-statistic and
quantified by I2 at a significance level of P <0.10.
Study or Subgroup
Hermansen
Gobert
Cohen
Miraghajani
Hosseinpour-Niazi
Total (95% CI)
Heterogeneity: Tau² = 0.00; Chi² = 3.98, df = 4 (P = 0.41); I² = 0%
Test for overall effect: Z = 2.74 (P = 0.006)
Mean Difference
6
-11.72
-29.17
2.5
-13.89
SE
9.646
8.305
55.56
20.39
4.685
Weight
14.6%
19.7%
0.4%
3.3%
62.0%
100.0%
IV, Random, 95% CI
6.00 [-12.91, 24.91]
-11.72 [-28.00, 4.56]
-29.17 [-138.07, 79.73]
2.50 [-37.46, 42.46]
-13.89 [-23.07, -4.71]
-10.09 [-17.31, -2.86]
Year
2001
2010
2011
2012
2014
Mean Difference Mean Difference
IV, Random, 95% CI
-100 -50 0 50 100Favours [experimental] Favours [control]
Subgroup and Study (Reference)
Year Participants, n Weight, % Mean Difference [95% CI] in Fasting Insulin, pmol/L
Type 2 Diabetes
Hermansen et al. (174) 2001 20 14.6 6.00 [-12.91, 24.91]
Gobert et al. (173) 2010 29 19.7 -11.72 [-28.00, 4.56]
Cohen et al. (171) 2011 13 0.4 -29.17 [-138.07, 79.73]
Miraghajani et al. (175) 2013 25 3.3 2.50 [-37.46, 42.46]
Hosseinpour-Niazi et al. (158) 2014 31 62 -13.89 [-23.07, -4.71]
Total (95% CI) 118 100 -10.09 [-17.31, -2.86]
Heterogeneity: Tau² = 0.00; Chi² = 3.98, df = 4 (P = 0.41); I² = 0%
Test for overall effect: Z = 2.74 (P = 0.006)
Favours Animal Protein
Favours Plant Protein
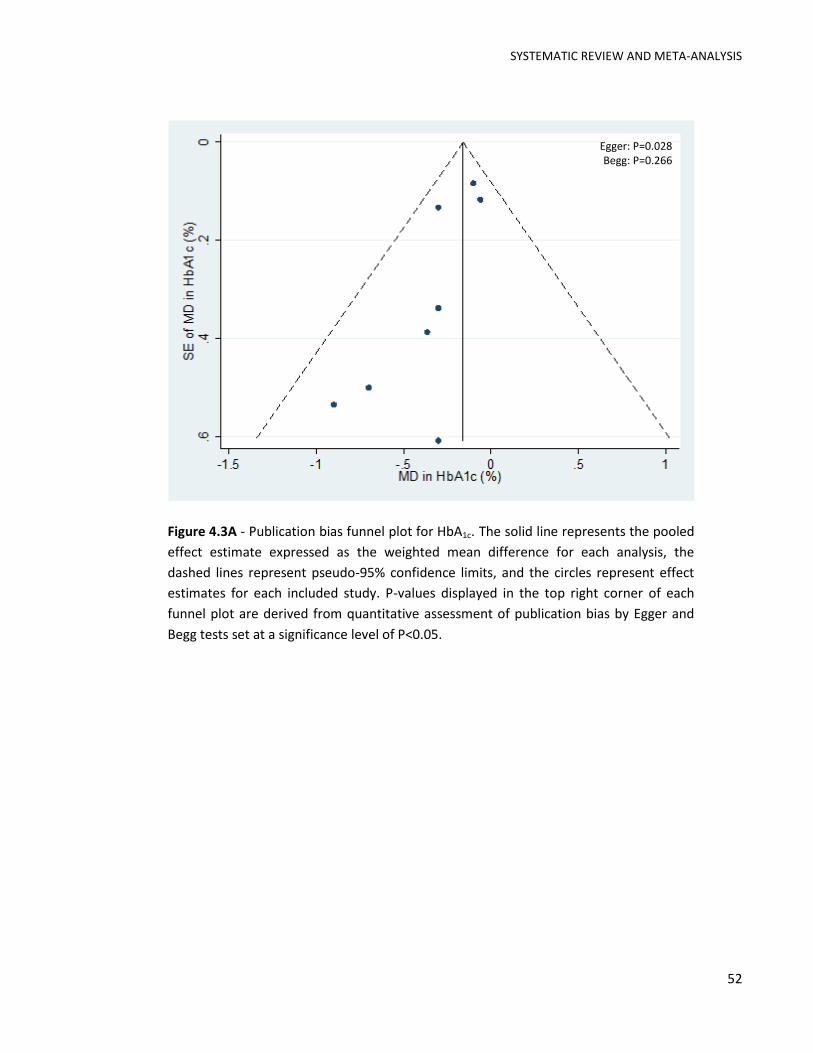
SYSTEMATIC REVIEW AND META-ANALYSIS
52
Figure 4.3A - Publication bias funnel plot for HbA1c. The solid line represents the pooled
effect estimate expressed as the weighted mean difference for each analysis, the
dashed lines represent pseudo-95% confidence limits, and the circles represent effect
estimates for each included study. P-values displayed in the top right corner of each
funnel plot are derived from quantitative assessment of publication bias by Egger and
Begg tests set at a significance level of P<0.05.
Egger: P=0.028 Begg: P=0.266

SYSTEMATIC REVIEW AND META-ANALYSIS
53
Figure 4.3B - Publication bias funnel plot for fasting glucose. The solid line represents
the pooled effect estimate expressed as the weighted mean difference for each analysis,
the dashed lines represent pseudo-95% confidence limits, and the circles represent
effect estimates for each included study. P-values displayed in the top right corner of
each funnel plot are derived from quantitative assessment of publication bias by Egger
and Begg tests set at a significance level of P<0.05.
0.5
11.5
SE
of M
D in
Fastin
g G
lucose
(m
mo
l/L)
-4 -2 0 2MD in Fasting Glucose (mmol/L)
Egger: P=0.058 Begg: P=0.210

SYSTEMATIC REVIEW AND META-ANALYSIS
54
Figure 4.3C - Publication bias funnel plot for fasting insulin. The solid line represents the
pooled effect estimate expressed as the weighted mean difference for each analysis, the
dashed lines represent pseudo-95% confidence limits, and the circles represent effect
estimates for each included study. P-values displayed in the top right corner of each
funnel plot are derived from quantitative assessment of publication bias by Egger and
Begg tests set at a significance level of P<0.05.
020
40
60
SE
of M
D in
Fastin
g Insu
lin (
pm
ol/L)
-100 -50 0 50 100MD in Fasting Insulin (pmol/L)
Egger: P=0.531 Begg: P=0.806

SYSTEMATIC REVIEW AND META-ANALYSIS
55
4.12 SUPPLEMENTARY TABLES
Supplemental Table 4.1 – Search strategy*
Database Search period Search terms
MEDLINE 1946 to August 2015 1. exp Diet, Vegetarian/ 2. vegetarian*.mp. 3. vegan*.mp. 4. exp Vegetable Proteins/ 5. (vegetable* adj1 protein*).mp. 6. (plant* adj1 protein*).mp. 7. (plant* adj1 food*).mp. 8. (plant* adj1 based).mp. 9. exp Fabaceae/ 10. exp Soybean Proteins/ 11. soy*.mp. 12. tofu*.mp. 13. natto*.mp. 14. tempeh*.mp. 15. miso*.mp. 16. lentil*.mp. 17. bean*.mp. 18. legume*.mp. 19. peanut*.mp. 20. (meat* adj1 analog*).mp. 21. lactoovo*.mp. 22. lacto-ovo*.mp. 23. ovolacto*.mp. 24. ovo-lacto*.mp. 25. lactoveg*.mp. 26. lacto-veg*.mp. 27. ovoveg*.mp. 28. ovo-veg*.mp. 29. 1 or 2 or 3 or 4 or 5 or 6 or 7 or 8 or 9 or 10 or 11 or 12 or 13 or 14 or 15 or 16 or 17 or 18 or 20 or 21 or 22 or 23 or 24 or 25 or 26 or 27 or 28 30. omnivor*.mp. 31. (conventional adj3 diet*).mp. 32. (normal adj3 diet*).mp. 33. (regular adj3 diet*).mp. 34. (mixed adj3 diet*).mp. 35. exp Meat/ 36. exp Eggs/ 37. exp Egg Proteins, Dietary/ 38. exp Dairy Products/ 39. exp Milk/ 40. exp Milk Proteins/ 41. (meat* adj1 protein*).mp. 42. (meat* adj1 product*).mp. 43. (animal* adj1 protein*).mp. 44. (animal* adj1 product*).mp. 45. (fish* adj1 protein*).mp. 46. (fish* adj1 product*).mp. 47. (poultry adj1 protein*).mp. 48. (poultry adj1 product*).mp. 49. (chicken* adj1 protein*).mp. 50. (chicken* adj1 product*).mp. 51. (egg* adj1 protein*).mp. 52. (egg* adj1 product*).mp. 53. (milk adj1 protein*).mp. 54. (milk adj1 product*).mp. 55. (dairy adj1 protein*).mp. 56. (dairy adj1 product*).mp. 57. 30 or 31 or 32 or 33 or 34 or 35 or 36 or 37 or 38 or 39 or 40 or 41 or 42 or 43 or 44 or 45 or 46 or 47 or 48 or 49 or 50 or 51 or 52 or 53 or 54 or 55 or 56 58. OGTT.mp. 59. exp Hemoglobin A, Glycosylated/

SYSTEMATIC REVIEW AND META-ANALYSIS
56
60. hba1c.mp. 61. fructosamine*.mp. 62. insulin*.mp. 63. glycemia.mp. 64. exp Glucose/ 65. exp Hyperglycemia/ 66. hyperinsulin*.mp. 67. dysglycemia.mp. 68. gly* albumin.mp. 69. exp Diabetes Mellitus/ 70. metabolic syndrome.mp. 71. HOMA*.mp. 72. 58 or 59 or 60 or 61 or 62 or 63 or 64 or 65 or 66 or 67 or 68 or 69 or 70 or 71 73. 29 and 57 and 72 74. limit 73 to animals 75. limit 74 to human 76. 74 not 75 77. 73 not 76 78. 77 not (exp infant formula/ or exp milk, human/)
EMBASE 1947 to August 2015 1. exp vegetarian diet/ 2. exp vegetarian/ 3. vegetarian*.mp. 4. vegan*.mp. 5. exp vegetable protein/ 6. (vegetable* adj1 protein*).mp. 7. (plant* adj1 protein*).mp. 8. (plant* adj1 food*).mp. 9. (plant* adj1 based).mp. 10. exp Fabaceae/ 11. soy*.mp. 12. tofu*.mp. 13. natto*.mp. 14. tempeh*.mp. 15. miso*.mp. 16. lentil*.mp. 17. bean*.mp. 18. legume*.mp. 19. peanut*.mp. 20. (meat* adj1 analog*).mp. 21. lactoovo*.mp. 22. lacto-ovo*.mp. 23. ovolacto*.mp. 24. ovo-lacto*.mp. 25. lactoveg*.mp. 26. lacto-veg*.mp. 27. ovoveg*.mp. 28. ovo-veg*.mp. 29. 1 or 2 or 3 or 4 or 5 or 6 or 7 or 8 or 9 or 10 or 11 or 12 or 13 or 14 or 15 or 16 or 17 or 18 or 20 or 21 or 22 or 23 or 24 or 25 or 26 or 27 or 28 30. exp omnivore/ 31. omnivor*.mp. 32. (conventional adj3 diet*).mp. 33. (normal adj3 diet*).mp. 34. (regular adj3 diet*).mp. 35. (mixed adj3 diet*).mp. 36. exp Meat/ 37. exp egg/ 38. exp dairy product/ 39. (meat* adj1 protein*).mp. 40. (meat* adj1 product*).mp. 41. (animal* adj1 protein*).mp. 42. (animal* adj1 product*).mp. 43. (fish* adj1 protein*).mp. 44. (fish* adj1 product*).mp. 45. (poultry adj1 protein*).mp. 46. (poultry adj1 product*).mp. 47. (chicken* adj1 protein*).mp.

SYSTEMATIC REVIEW AND META-ANALYSIS
57
48. (chicken* adj1 product*).mp. 49. (egg* adj1 protein*).mp. 50. (egg* adj1 product*).mp. 51. (milk adj1 protein*).mp. 52. (milk adj1 product*).mp. 53. (dairy adj1 protein*).mp. 54. (dairy adj1 product*).mp. 55. 30 or 31 or 32 or 33 or 34 or 35 or 36 or 37 or 38 or 39 or 40 or 41 or 42 or 43 or 44 or 45 or 46 or 47 or 48 or 49 or 50 or 51 or 52 or 53 or 54 56. exp oral glucose tolerance test/ 57. OGTT.mp. 58. exp hemoglobin A1c/ 59. hba1c.mp. 60. fructosamine*.mp. 61. insulin*.mp. 62. exp glucose blood level/ 63. glycemia.mp. 64. exp glucose/ 65. 'impaired fasting glucose'.mp. 66. hyperglycemia.mp. 67. 'impaired glucose tolerance'.mp. 68. hyperinsulin*.mp. 69. dysglycemia.mp. 70. 'gly* albumin'.mp. 71. exp diabetes mellitus/ 72. exp insulin dependent diabetes mellitus/ 73. exp non insulin dependent diabetes mellitus/ 74. exp pregnancy diabetes mellitus/ 75. exp metabolic syndrome X/ 76. HOMA*.mp. 77. 56 or 57 or 58 or 59 or 60 or 61 or 62 or 63 or 64 or 65 or 66 or 67 or 68 or 69 or 70 or 71 or 72 or 73 or 74 or 75 or 76 78. 29 and 55 and 77 79. limit 78 to (animals and animal studies) 80. 78 not 79 81. 80 not (exp breast milk/ or exp infant formula/)
Cochrane Central Register of Controlled Trials
through to 26 August 2015 1. exp Diet, Vegetarian/ 2. vegetarian*.mp. 3. vegan*.mp. 4. exp Vegetable Proteins/ 5. (vegetable* adj1 protein*).mp. 6. (plant* adj1 protein*).mp. 7. (plant* adj1 food*).mp. 8. (plant* adj1 based).mp. 9. exp Fabaceae/ 10. exp Soybean Proteins/ 11. soy*.mp. 12. tofu*.mp. 13. natto*.mp. 14. tempeh*.mp. 15. miso*.mp. 16. lentil*.mp. 17. bean*.mp. 18. legume*.mp. 19. peanut*.mp. 20. (meat* adj1 analog*).mp. 21. lactoovo*.mp. 22. lacto-ovo*.mp. 23. ovolacto*.mp. 24. ovo-lacto*.mp. 25. lactoveg*.mp. 26. lacto-veg*.mp. 27. ovoveg*.mp. 28. ovo-veg*.mp. 29. 1 or 2 or 3 or 4 or 5 or 6 or 7 or 8 or 9 or 10 or 11 or 12 or 13 or 14 or 15 or 16 or 17 or 18 or 20 or 21 or 22 or 23 or 24 or 25 or 26 or 27 or 28 30. omnivor*.mp. 31. (conventional adj3 diet*).mp.

SYSTEMATIC REVIEW AND META-ANALYSIS
58
32. (normal adj3 diet*).mp. 33. (regular adj3 diet*).mp. 34. (mixed adj3 diet*).mp. 35. exp Meat/ 36. exp Eggs/ 37. exp Egg Proteins, Dietary/ 38. exp Dairy Products/ 39. exp Milk/ 40. exp Milk Proteins/ 41. (meat* adj1 protein*).mp. 42. (meat* adj1 product*).mp. 43. (animal* adj1 protein*).mp. 44. (animal* adj1 product*).mp. 45. (fish* adj1 protein*).mp. 46. (fish* adj1 product*).mp. 47. (poultry adj1 protein*).mp. 48. (poultry adj1 product*).mp. 49. (chicken* adj1 protein*).mp. 50. (chicken* adj1 product*).mp. 51. (egg* adj1 protein*).mp. 52. (egg* adj1 product*).mp. 53. (milk adj1 protein*).mp. 54. (milk adj1 product*).mp. 55. (dairy adj1 protein*).mp. 56. (dairy adj1 product*).mp. 57. 30 or 31 or 32 or 33 or 34 or 35 or 36 or 37 or 38 or 39 or 40 or 41 or 42 or 43 or 44 or 45 or 46 or 47 or 48 or 49 or 50 or 51 or 52 or 53 or 54 or 55 or 56 58. OGTT.mp. 59. 'oral glucose tolerance test'.mp. 60. exp Hemoglobin A, Glycosylated/ 61. hba1c.mp. 62. fructosamine*.mp. 63. insulin*.mp. 64. glycemia.mp. 65. exp Glucose/ 66. exp Hyperglycemia/ 67. hyperinsulin*.mp. 68. dysglycemia.mp. 69. gly* albumin.mp. 70. exp diabetes mellitus/ 71. metabolic syndrome.mp. 72. HOMA*.mp. 73. 58 or 59 or 60 or 61 or 62 or 63 or 64 or 65 or 66 or 67 or 68 or 69 or 70 or 71 or 72 74. 29 and 57 and 73 75. 74 not (exp infant formula/ or exp milk, human/)
* For all databases the original search was 19 December 2013; updated searches were performed 10 November 2014 and 26 August 2015
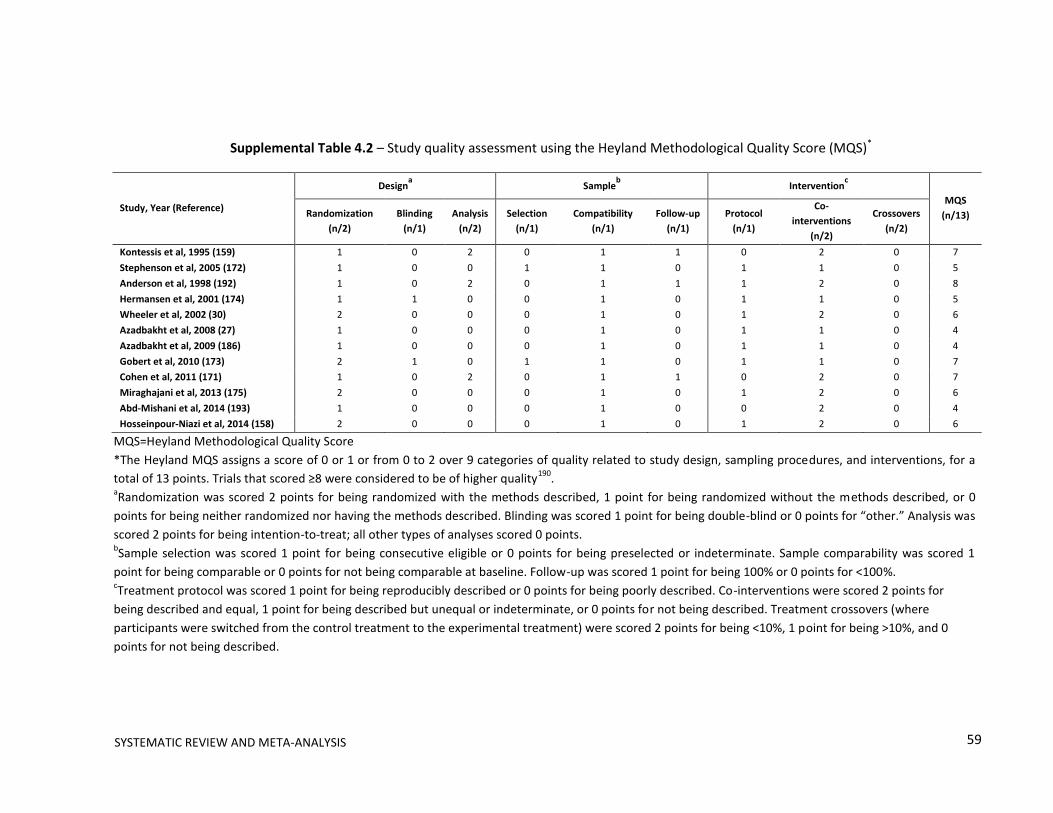
59
Supplemental Table 4.2 – Study quality assessment using the Heyland Methodological Quality Score (MQS)*
Study, Year (Reference)
Designa Sample
b Intervention
c
MQS
(n/13) Randomization
(n/2)
Blinding
(n/1)
Analysis
(n/2)
Selection
(n/1)
Compatibility
(n/1)
Follow-up
(n/1)
Protocol
(n/1)
Co-
interventions
(n/2)
Crossovers
(n/2)
Kontessis et al, 1995 (159) 1 0 2 0 1 1 0 2 0 7
Stephenson et al, 2005 (172) 1 0 0 1 1 0 1 1 0 5
Anderson et al, 1998 (192) 1 0 2 0 1 1 1 2 0 8
Hermansen et al, 2001 (174) 1 1 0 0 1 0 1 1 0 5
Wheeler et al, 2002 (30) 2 0 0 0 1 0 1 2 0 6
Azadbakht et al, 2008 (27) 1 0 0 0 1 0 1 1 0 4
Azadbakht et al, 2009 (186) 1 0 0 0 1 0 1 1 0 4
Gobert et al, 2010 (173) 2 1 0 1 1 0 1 1 0 7
Cohen et al, 2011 (171) 1 0 2 0 1 1 0 2 0 7
Miraghajani et al, 2013 (175) 2 0 0 0 1 0 1 2 0 6
Abd-Mishani et al, 2014 (193) 1 0 0 0 1 0 0 2 0 4
Hosseinpour-Niazi et al, 2014 (158) 2 0 0 0 1 0 1 2 0 6
MQS=Heyland Methodological Quality Score
*The Heyland MQS assigns a score of 0 or 1 or from 0 to 2 over 9 categories of quality related to study design, sampling procedures, and interventions, for a
total of 13 points. Trials that scored ≥8 were considered to be of higher quality190
. aRandomization was scored 2 points for being randomized with the methods described, 1 point for being randomized without the methods described, or 0
points for being neither randomized nor having the methods described. Blinding was scored 1 point for being double-blind or 0 points for “other.” Analysis was
scored 2 points for being intention-to-treat; all other types of analyses scored 0 points. bSample selection was scored 1 point for being consecutive eligible or 0 points for being preselected or indeterminate. Sample comparability was scored 1
point for being comparable or 0 points for not being comparable at baseline. Follow-up was scored 1 point for being 100% or 0 points for <100%. cTreatment protocol was scored 1 point for being reproducibly described or 0 points for being poorly described. Co-interventions were scored 2 points for
being described and equal, 1 point for being described but unequal or indeterminate, or 0 points for not being described. Treatment crossovers (where
participants were switched from the control treatment to the experimental treatment) were scored 2 points for being <10%, 1 point for being >10%, and 0
points for not being described.
SYSTEMATIC REVIEW AND META-ANALYSIS

SYSTEMATIC REVIEW AND META-ANALYSIS
60
Supplemental Table 4.3 – Continuous a priori & post-hoc subgroup analyses for HbA1c
Subgroup category Range No. of Trialsa N β [95% CI]
b Residual I2
P-value
Baseline 5.9-8.5 % 8 133 -0.04 [-0.27, 0.19] 0.00% 0.695
Percent AP replaced 4-70 %/d 7 120 0.00 [-0.01, 0.01] 0.00% 0.844
Grams AP replaced 2.4-64 g/d 8 133 0.00 [-0.00, 0.01] 0.00% 0.294
Absolute fiber intake 12.6-41 g/d 6 112 0.00 [-0.02, 0.02] 0.00% 0.751
Between arm ∆ in fiber intake -1.4-4.9 g/d 6 112 -0.04 [-0.23, 0.15] 0.00% 0.611
Within arm ∆ in fiber intake -1.8-15 g/d 3 61 -0.00 [-0.52, 0.52] 56.60% 0.995
Absolute SF intake 7.6-9.7 %E 3 58 0.02 [-4.33, 4.37] 56.60% 0.958
Between arm ∆ in SF intake -3.6-0 %E 3 58 0.16 [-1.57, 1.89] 3.07% 0.453
Within arm ∆ in SF intake - - - - - -
Isoflavone intake - - - - - -
Body weight 79-111 kg 7 124 0.00 [-0.02, 0.02] 14.86% 0.970
Sex 0-77.8 %W 8 133 -0.00 [-0.01, 0.01] 0.00% 0.632
AP=animal protein; E=energy; N=number of subjects; No.=number; SF=saturated fat;
W=women aTotal number of trials=8
bβ is the slope derived from subgroup analyses on meta-regression analyses and represents
the treatment effect of replacing animal protein with plant protein for each subgroup. The
residual I2 value indicates heterogeneity unexplained by the subgroup. Absolute intakes
represent intakes within the treatment arm. Between arm differences represent the
difference between the treatment (T) and control (C) arm (T-C). Within arm differences
represent the difference between end (E) and baseline (B) values within the treatment arm
(E-B). * Statistically significant between subgroups (P<0.05).

SYSTEMATIC REVIEW AND META-ANALYSIS
61
Supplemental Table 4.4 – Continuous a priori & post-hoc subgroup analyses for fasting glucose
Subgroup category Range No. of Trialsa N β [95% CI]
b Residual I2
P-value
Baseline 6.7-10.4 mmol/L 9 209 -0.35 [-0.80, -0.10] 24.18% 0.109
Percent AP replaced 4-70 %/d 9 205 -0.01 [-0.03, 0.01] 56.00% 0.187
Grams AP replaced 6-50 g/d 10 218 -0.01 [-0.03, 0.02] 68.19% 0.502
Absolute fiber intake 12.6-41 g/d 8 181 0.03 [-0.04, 0.10] 68.38% 0.361
Between arm ∆ in fiber intake -7-6 g/d 8 181 0.04 [-0.14, 0.22] 80.26% 0.576
Within arm ∆ in fiber intake -1.8-15 g/d 5 116 0.04 [-0.29, 0.37] 71.20% 0.729
Absolute SF intake 2.6-9.7 %E 5 127 -0.02 [-0.80, 0.77] 65.75% 0.953
Between arm ∆ in SF intake -3.6- -0.6 %E 5 127 1.00 [-0.32, 2.33] 28.52% 0.095
Within arm ∆ in SF intake -3.3- -0.2 %E 4 96 0.97 [-1.96, 3.89] 69.72% 0.291
Isoflavone intake 56-165 mg/d 4 104 0.00 [-0.47, 0.05] 68.87% 0.868
Body weight 70.6-102.3 kg 8 178 0.01 [-0.07, 0.09] 47.63% 0.756
Sex 28.6-77.8 %W 10 218 -0.01 [-0.04, 0.01] 69.77% 0.244
AP=animal protein; E=energy; N=number of subjects; No.=number; SF=saturated fat; W=women aTotal number of trials=10
bβ is the slope derived from subgroup analyses on meta-regression analyses and represents the
treatment effect of replacing animal protein with plant protein for each subgroup. The residual I2
value indicates heterogeneity unexplained by the subgroup. Absolute intakes represent intakes
within the treatment arm. Between arm differences represent the difference between the
treatment (T) and control(C) arm (T-C). Within arm differences represent the difference between
end (E) and baseline (B) values within the treatment arm (E-B). * Statistically significant between
subgroups (P<0.05).

SYSTEMATIC REVIEW AND META-ANALYSIS
62
Supplemental Table 4.5 – Continuous a priori & post-hoc subgroup analyses for fasting insulin
Subgroup category Range No. of Trialsa N β [95% CI]
b Residual I2
P-value
Baseline 56.3-134.2 pmol/L 5 118 0.18 [-0.65, 1.02] 6.36% 0.536
Percent AP replaced 4-34 %/d 4 105 0.22 [-2.34, 2.78] 36.54% 0.744
Grams AP replaced 2.5-50 g/d 5 118 0.31 [-0.45, 1.08] 0.00% 0.284
Absolute fiber intake 19.2-41 g/d 4 105 0.62 [-2.68, 3.91] 31.50% 0.506
Between arm ∆ in fiber intake -1.2-4.5 g/d 4 105 -1.37 [-12.13, 9.39] 28.58% 0.638
Within arm ∆ in fiber intake - - - - - -
Absolute SF intake - - - - - -
Between arm ∆ in SF intake - - - - - -
Within arm ∆ in SF intake - - - - - -
Isoflavone intake - - - - - -
Body weight 76.3-96.1 kg 4 87 0.44 [-7.30, 8.18] 0.00% 0.830
Sex 30-77.4 %W 5 118 -0.30 [-0.92, 0.33] 0.00% 0.226
AP=animal protein; E=energy; N=number of subjects; No. =number; SF=saturated fat; W=women aTotal number of trials=5
bβ is the slope derived from subgroup analyses on meta-regression analyses and represents the
treatment effect of replacing animal protein with plant protein for each subgroup. The residual I2
value indicates heterogeneity unexplained by the subgroup. Absolute intakes represent intakes
within the treatment arm. Between arm differences represent the difference between the
treatment (T) and control(C) arm (T-C). Within arm differences represent the difference between
end (E) and baseline (B) values within the treatment arm (E-B). * Statistically significant between
subgroups (P<0.05).
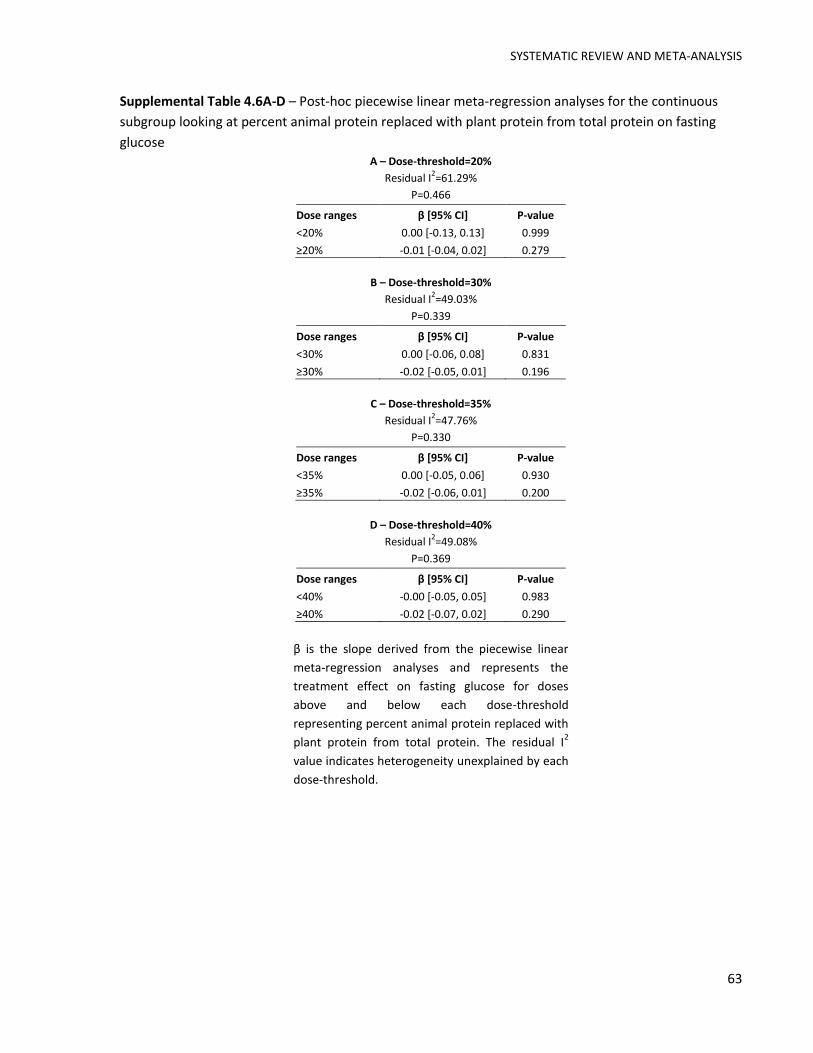
SYSTEMATIC REVIEW AND META-ANALYSIS
63
Supplemental Table 4.6A-D – Post-hoc piecewise linear meta-regression analyses for the continuous
subgroup looking at percent animal protein replaced with plant protein from total protein on fasting
glucose A – Dose-threshold=20%
Residual I2=61.29%
P=0.466
Dose ranges β [95% CI] P-value
<20% 0.00 [-0.13, 0.13] 0.999
≥20% -0.01 [-0.04, 0.02] 0.279
B – Dose-threshold=30%
Residual I2=49.03%
P=0.339
Dose ranges β [95% CI] P-value
<30% 0.00 [-0.06, 0.08] 0.831
≥30% -0.02 [-0.05, 0.01] 0.196
C – Dose-threshold=35%
Residual I2=47.76%
P=0.330
Dose ranges β [95% CI] P-value
<35% 0.00 [-0.05, 0.06] 0.930
≥35% -0.02 [-0.06, 0.01] 0.200
D – Dose-threshold=40%
Residual I2=49.08%
P=0.369
Dose ranges β [95% CI] P-value
<40% -0.00 [-0.05, 0.05] 0.983
≥40% -0.02 [-0.07, 0.02] 0.290
β is the slope derived from the piecewise linear
meta-regression analyses and represents the
treatment effect on fasting glucose for doses
above and below each dose-threshold
representing percent animal protein replaced with
plant protein from total protein. The residual I2
value indicates heterogeneity unexplained by each
dose-threshold.

SYSTEMATIC REVIEW AND META-ANALYSIS
64
4.13 SUPPLEMENTARY FIGURES
Supplemental Figure 4.1 – Cochrane Risk of Bias Graph. Risk of bias graph consists
of the review authors’ judgments about each risk of bias item presented as
percentages across all included studies. Random Sequence Generation assessed
whether the method of randomization was described. Allocation concealment
assessed whether investigators could tell which treatment participants were going
to be randomized to. Blinding of participants and personnel assessed whether the
study was blinded to investigators, study personnel/outcome assessors, and/or
participants. Incomplete outcome data assessed whether missing outcome data
effected the true outcome. Selected outcome reporting assessed whether all of
the studies pre-specified outcomes (primary and secondary) of interest have been
reported in a pre-specified way.
Random sequence generation (selection bias)
Allocation concealment (selection bias)
Blinding of participants and personnel (performance bias)
Blinding of outcome assessment (detection bias)
Incomplete outcome data (attrition bias)
Selective reporting (reporting bias)
Other bias
0% 25% 50% 75% 100%
Low risk of bias Unclear risk of bias High risk of bias
Selective reporting (reporting bias)
Random sequence generation (selection bias)
Allocation concealment (selection bias)
Blinding of participants and personnel (performance bias)
Blinding of outcome assessment (detection bias)
Incomplete outcome data (attrition bias)
Selective reporting (reporting bias)
Other bias
0% 25% 50% 75% 100%
Low risk of bias Unclear risk of bias High risk of bias
Random sequence generation (selection bias)
Blinding of participants, personnel and outcome assessors (performance and detection bias)
Incomplete outcome data (attrition bias)
Random sequence generation (selection bias)
Allocation concealment (selection bias)
Blinding of participants and personnel (performance bias)
Blinding of outcome assessment (detection bias)
Incomplete outcome data (attrition bias)
Selective reporting (reporting bias)
Other bias
0% 25% 50% 75% 100%
Low risk of bias Unclear risk of bias High risk of bias
Allocation concealment (selection bias)
Low risk of bias Unclear risk of bias High risk of bias
Random sequence generation (selection bias)
Allocation concealment (selection bias)
Blinding of participants and personnel (performance bias)
Blinding of outcome assessment (detection bias)
Incomplete outcome data (attrition bias)
Selective reporting (reporting bias)
Other bias
0% 25% 50% 75% 100%
Low risk of bias Unclear risk of bias High risk of bias

SYSTEMATIC REVIEW AND META-ANALYSIS
65
Supplemental Figure 4.2A – Categorical a priori subgroup analyses for HbA1c. Point estimates for each
subgroup level (diamonds) are the pooled effect estimates. The dashed line represents the pooled
estimate for the overall (total) analysis. The residual I2 value indicates heterogeneity unexplained by
the subgroup. Pairwise between-subgroup mean differences (95%CIs) for plant protein type were as
follows: 0.12 [-0.43, 0.68] (1 vs. 2); 0.19 [-0.47, 0.84] (1 vs. 3); -0.06 [-0.69, 0.56] (3 vs. 2). Absolute
intakes represent intakes within the treatment arm. Between arm differences represent the difference
between the treatment (T) and control (C) arm (T–C). Within arm differences represent the difference
between end (E) and baseline (B) values within the treatment arm (E–B). AP=animal protein; N=number
of participants; MQS=Heyland Methodological Quality Score; SF=saturated fat. *Statistically significant
between subgroups (P<0.05)
-5 -4 -3 -2 -1 0 1 2 3 4 5
Subgroup Level Trials N Mean Difference [95% CI] in Hemoglobin A1c, %Residual
I2P-value
Within subgroups Between subgroups
Total 8 133 -0.16 [-0.27, -0.05]
Baseline <7 %
≥7 %
3
5
58
75
-0.11 [-0.44, 0.22]
-0.23 [-0.46, 0.01] -0.12 [-0.52, 0.29] 0.00% 0.500
Plant protein type Mixed
Soy
Tree nuts
Pulses
2
5
1
-
26
94
13
-
-0.11 [-0.53, 0.30]
-0.24 [-0.61, 0.13]
-0.30 [-0.81, 0.21]
-
See legend 0.00% 0.755
Animal protein type Mixed
Dairy
Red meat
4
4
-
36
87
-
-0.19 [-0.50, 0.12]
-0.20 [-0.46, 0.07]
-
-0.01 [-0.42, 0.40] 0.00% 0.966
Percent AP replaced <35 %/d
≥35 %/d
3
4
74
46
-0.14 [-0.52, 0.24]
-0.20 [-0.56, 0.15] -0.07 [-0.59, 0.45] 0.00% 0.757
Grams AP replaced <30 g/d
≥30 g/d
2
6
38
95
-0.31 [-0.61, 0.00]
-0.12 [-0.28, 0.04] 0.19 [-0.16, 0.53] 0.00% 0.235
Absolute fiber intake <30 g/d
≥30 g/d
4
2
75
37
-0.13 [-0.42, 0.17]
-0.11 [-0.34, 0.11] 0.01 [-0.36, 0.39] 0.00% 0.924
Between arm ∆ in fiber intake <0.00 g/d
≥0.00 g/d
2
4
41
71
-0.10 [-0.42, 0.22]
-0.13 [-0.34, 0.09] -0.03 [-0.41, 0.36] 0.00% 0.855
Within arm ∆ in fiber intake <3.00 g/d
≥3.00 g/d
2
1
41
20
-0.32 [-5.24, 4.60]
-0.30 [-7.45, 6.85] 0.02 [-8.67, 8.70] 57.50% 0.983
Absolute SF intake <7 %
≥7 %
0
3
0
58
-
-0.10 [-0.26, 0.05] - - -
Between arm ∆ in SF intake <-1.24 %
≥-1.24 %
1
2
12
46
-0.90 [-7.70, 5.90]
-0.09 [-0.95, 0.78] 0.81 [-6.04, 7.67] 0.00% 0.373
Within arm ∆ in SF intake <-0.64 %
≥-0.64 %
1
1
12
29
-0.90 [-1.95, 0.15]
-0.06 [-0.29, 0.17] - - -
Design Crossover
Parallel
7
1
120
13
-0.13 [-0.28, 0.03]
-0.30 [-0.63, 0.03] -0.17 [-0.54, 0.19] 0.00% 0.285
Follow up <12 wk
≥12 wk
7
1
120
13
-0.13 [-0.28, 0.03]
-0.30 [-0.63, 0.03] -0.17 [-0.54, 0.19] 0.00% 0.285
MQS <8
≥8
7
1
125
8
-0.15 [-0.29, -0.01]
-0.70 [-1,92, 0.52] -0.55 [-1.78, 0.68] 0.00% 0.318
Food form Powder
Whole
2
6
49
84
-0.10 [-0.44, 0.24]
-0.23 [-0.46, 0.00] -0.13 [-0.54, 0.28] 0.00% 0.467
Favours Plant
Protein
Favours Animal
Protein
>
><
<
<
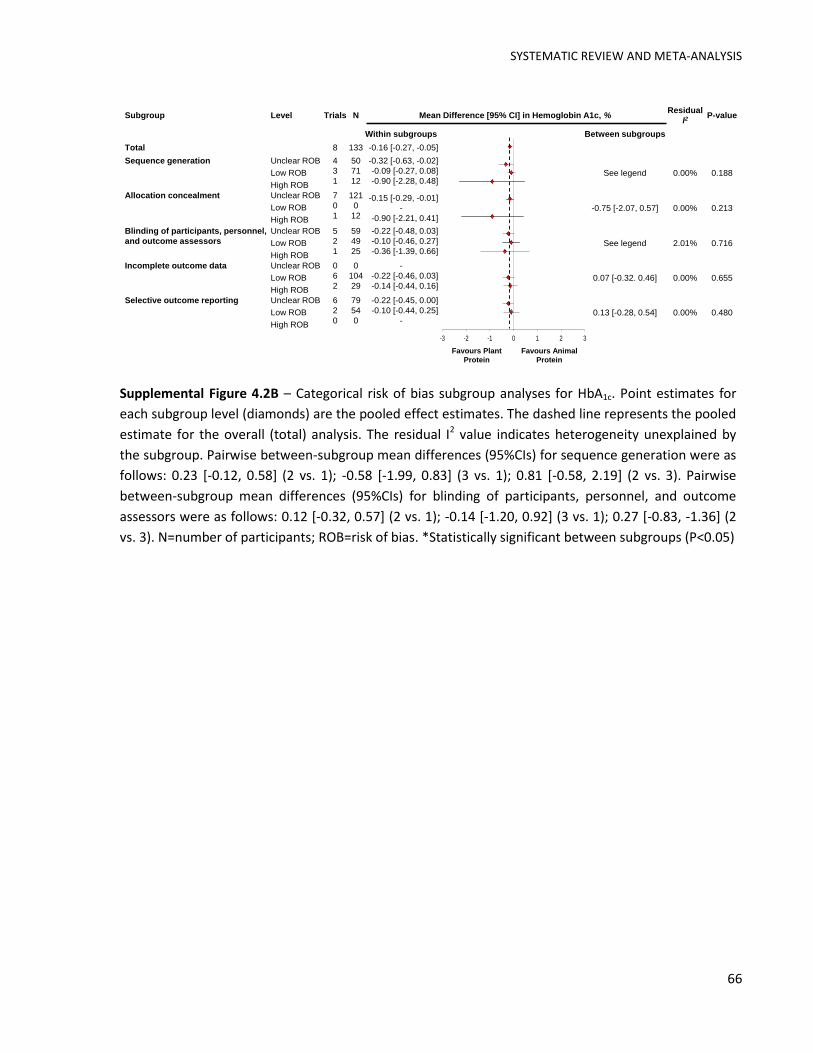
SYSTEMATIC REVIEW AND META-ANALYSIS
66
Supplemental Figure 4.2B – Categorical risk of bias subgroup analyses for HbA1c. Point estimates for
each subgroup level (diamonds) are the pooled effect estimates. The dashed line represents the pooled
estimate for the overall (total) analysis. The residual I2 value indicates heterogeneity unexplained by
the subgroup. Pairwise between-subgroup mean differences (95%CIs) for sequence generation were as
follows: 0.23 [-0.12, 0.58] (2 vs. 1); -0.58 [-1.99, 0.83] (3 vs. 1); 0.81 [-0.58, 2.19] (2 vs. 3). Pairwise
between-subgroup mean differences (95%CIs) for blinding of participants, personnel, and outcome
assessors were as follows: 0.12 [-0.32, 0.57] (2 vs. 1); -0.14 [-1.20, 0.92] (3 vs. 1); 0.27 [-0.83, -1.36] (2
vs. 3). N=number of participants; ROB=risk of bias. *Statistically significant between subgroups (P<0.05)
-3 -2 -1 0 1 2 3
Subgroup Level Trials N Mean Difference [95% CI] in Hemoglobin A1c, %Residual
I2P-value
Within subgroups Between subgroups
Total 8 133 -0.16 [-0.27, -0.05]
Sequence generation Unclear ROB
Low ROB
High ROB
4
3
1
50
71
12
-0.32 [-0.63, -0.02]
-0.09 [-0.27, 0.08]
-0.90 [-2.28, 0.48]See legend 0.00% 0.188
Allocation concealment Unclear ROB
Low ROB
High ROB
7
0
1
121
0
12
-0.15 [-0.29, -0.01]
-
-0.90 [-2.21, 0.41]
-0.75 [-2.07, 0.57] 0.00% 0.213
Blinding of participants, personnel,
and outcome assessors
Unclear ROB
Low ROB
High ROB
5
2
1
59
49
25
-0.22 [-0.48, 0.03]
-0.10 [-0.46, 0.27]
-0.36 [-1.39, 0.66]See legend 2.01% 0.716
Incomplete outcome data Unclear ROB
Low ROB
High ROB
0
6
2
0
104
29
-
-0.22 [-0.46, 0.03]
-0.14 [-0.44, 0.16]0.07 [-0.32. 0.46] 0.00% 0.655
Selective outcome reporting Unclear ROB
Low ROB
High ROB
6
2
0
79
54
0
-0.22 [-0.45, 0.00]
-0.10 [-0.44, 0.25]
-0.13 [-0.28, 0.54] 0.00% 0.480
Favours Plant
Protein
Favours Animal
Protein

SYSTEMATIC REVIEW AND META-ANALYSIS
67
Supplemental Figure 4.3A – Categorical a priori subgroup analyses for fasting glucose. Point estimates
for each subgroup level (diamonds) are the pooled effect estimates. The dashed line represents the
pooled estimate for the overall (total) analysis. The residual I2 value indicates heterogeneity
unexplained by the subgroup. Pairwise between-subgroup mean differences (95%CIs) for plant protein
type were as follows: -0.69 [-1.88, 0.50] (1 vs. 2); -0.50 [-2.39, 1.39] (1 vs. 3); -0.56 [-1.76, 0.64] (1 vs.
4); -0.19 [-2.02, 1.63] (3 vs. 2); -0.13 [-1.23, 0.96] (4 vs. 2); 0.06 [-1.77, 1.89] (4 vs. 3). Pairwise
between-subgroup mean differences (95%CIs) for animal protein type were as follows: 0.94 [0.46,
1.41] (2 vs. 1); 0.53 [0.18, 0.87] (3 vs. 1); 0.41 [-0.15, 0.97] (2 vs. 3). Absolute intakes represent intakes
within the treatment arm. Between arm differences represent the difference between the treatment
(T) and control (C) arm (T–C). Within arm differences represent the difference between end (E) and
baseline (B) values within the treatment arm (E–B). AP=animal protein; N=number of participants;
MQS=Heyland Methodological Quality Score; SF=saturated fat. *Statistically significant between
subgroups (P<0.05)
-5 -4 -3 -2 -1 0 1 2 3 4 5
Subgroup Level Trials N Mean Difference [95% CI] in Fasting Glucose, mmol/LResidual
I2P-value
Within subgroups Between subgroups
Total 10 218 -0.53 [-0.92, -0.13]
Baseline <8 mmol/L
≥8 mmol/L
7
2
172
37
-0.36 [-0.82, 0.11]
-0.58 [-2.11, 0.94] -0.22 [-1.82, 1.37] 48.53% 0.749
Plant protein type Mixed
Soy
Tree nuts
Pulses
1
6
1
2
9
141
13
55
-1.00 [-1.91, -0.09]
-0.31 [-1.08, 0.46]
-0.50 [-2.16, 1.16]
-0.44 [-1.22, 0.34]
See legend 48.00% 0.575
Animal protein type Mixed
Dairy
Red meat
4
4
2
76
87
55
-1.00 [-1.12, -0.88]
-0.06 [-0.52, 0.40]
-0.47 [-0.80, -0.15]
See legend 98.26% 0.003*
Percent AP replaced <35 %/d
≥35 %/d
5
4
129
76
-0.28 [-0.67, 0.12]
-1.02 [-1.50, -0.54] -0.74 [-1.36, -0.12] 35.82% 0.025*
Grams AP replaced <30 g/d
≥30 g/d
6
4
148
70
-0.48 [-1.09, 0.13]
-0.59 [-1.31, 0.12] -0.11 [-1.05, 0.83] 74.10% 0.789
Absolute fiber intake <30 g/d
≥30 g/d
6
2
130
51
-0.61 [-1.44, 0.23]
-0.48 [-1.74, 0.79]0.13 [-1.39, 1.64] 80.67% 0.842
Between arm ∆ in fiber intake <0.00 g/d
≥0.00 g/d
3
5
82
99
-0.69 [-1.95, 0.57]
-0.51 [-1.37, 0.34] 0.18 [-1.35, 1.70] 78.79% 0.788
Within arm ∆ in fiber intake <3.00 g/d
≥3.00 g/d
2
3
41
75
-0.87 [-4.35, 2.62]
-0.55 [-3.27, 2.17]0.32 [-4.10, 4.73] 64.44% 0.835
Absolute SF intake <7 %
≥7 %
2
3
55
72
-0.68 [-3.94, 2.59]
-0.60 [-3.01, 1.82]0.08 [-3.98, 4.14] 75.55% 0.953
Between arm ∆ in SF intake <-1.24 %
≥-1.24 %
3
2
57
70
-0.72 [-3.50. 2.06]
-0.57 [-3.42, 2.29]0.16 [-3.83, 4.14] 71.83% 0.909
Within arm ∆ in SF intake <-0.64 %
≥-0.64 %
2
2
26
70
-1.18 [-7.84, 5.47]
-0.62 [-6.05, 4.81]0.56 [-8.02, 9.15] 81.18% 0.804
Design Crossover
Parallel
8
2
164
54
-0.46 [-0.94, 0.02]
-0.90 [-2.04, 0.24]-0.44 [-1.67, 0.80] 84.15% 0.437
Follow up <12 wk
≥12 wk
8
2
164
54
-0.46 [-0.94, 0.02]
-0.90 [-2.04, 0.24]-0.44 [-1.67, 0.80] 84.15% 0.437
MQS <8
≥8
10
0
218
0
-0.53 [-0.92, -0.13]- - -
Food form Powder
Whole
2
8
49
169
0.01 [-0.80, 0.81]
-0.68 [-1.08, -0.28]-0.69 [-1.58, 0.21] 70.55% 0.116
Favours Plant
Protein
Favours Animal
Protein
><<

SYSTEMATIC REVIEW AND META-ANALYSIS
68
Supplemental Figure 4.3B – Categorical risk of bias subgroup analyses for fasting glucose. Point
estimates for each subgroup level (diamonds) are the pooled effect estimates. The dashed line
represents the pooled estimate for the overall (total) analysis. The residual I2 value indicates
heterogeneity unexplained by the subgroup. Pairwise between-subgroup mean differences (95%CIs)
for sequence generation were as follows: 0.48 [-0.26, 1.23] (2 vs. 1); -2.84 [-6.70, 1.01] (3 vs. 1); 3.32
[-0.54, 7.19] (2 vs. 3). Pairwise between-subgroup mean differences (95%CIs) for blinding of
participants, personnel, and outcome assessors were as follows: 0.28 [-0.72, 1.27] (2 vs. 1); 0.51 [-
1.39, 2.41] (3 vs. 1); -0.23 [-2.13, 1.68] (2 vs. 3). Pairwise between-subgroup mean differences
(95%CIs) for incomplete outcome data were as follows: 0.11 [-1.43, 1.65] (1 vs. 2); 0.45 [-1.23, 2.13] (1
vs. 3); -0.34 [-1.50, 0.82] (3 vs. 2). Pairwise between-subgroup mean differences (95%CIs) for selective
outcome reporting data were as follows: 0.74 [0.06, 1.43] (1 vs. 2); 0.62 [-0.40, 1.64] (1 vs. 3); 0.12 [-
0.90, 1.14] (2 vs. 3). N=number of participants; ROB=risk of bias. *Statistically significant between
subgroups (P<0.05)
-8 -6 -4 -2 0 2 4 6 8
Favours Plant
Protein
Favours Animal
Protein
Subgroup Level Trials N Mean Difference [95% CI] in Fasting Glucose, mmol/LResidual
I2P-value
Within subgroups Between subgroups
Total 10 218 -0.53 [-0.92, -0.13]
Sequence generation Unclear ROB
Low ROB
High ROB
6
3
1
121
85
12
-0.71 [-1.19, -0.23]
-0.23 [-0.79, 0.34]
-3.55 [-7.38, 0.27]See legend 56.00% 0.118
Allocation concealment Unclear ROB
Low ROB
High ROB
9
0
1
206
0
12
-0.49 [-0.90, -0.09]
-
-3.55 [-7.31, 0.21]
-3.06 [-6.84, 0.72] 83.34% 0.099
Blinding of participants, personnel,
and outcome assessors
Unclear ROB
Low ROB
High ROB
5
4
1
72
121
25
-0.69 [-1.39, 0.01]
-0.41 [-1.12, 0.30]
-0.18 [-1.95, 1.58]See legend 65.46% 0.729
Incomplete outcome data Unclear ROB
Low ROB
High ROB
1
5
4
24
96
98
-0.33 [-1.72, 1.05]
-0.44 [-1.12, 0.23]
-0.78 [-1.73, 0.16]See legend 79.78% 0.747
Selective outcome reporting Unclear ROB
Low ROB
High ROB
5
4
1
95
99
24
-0.96 [-1.44, -0.47]
-0.21 [-0.69, 0.27]
-0.33 [-1.23, 0.57]See legend 38.26% 0.087

SYSTEMATIC REVIEW AND META-ANALYSIS
69
Supplemental Figure 4.4A – Categorical a priori subgroup analyses for fasting insulin. Point estimates for
each subgroup level (diamonds) are the pooled effect estimates. The dashed line represents the pooled
estimate for the overall (total) analysis. The residual I2 value indicates heterogeneity unexplained by the
subgroup. Pairwise between-subgroup mean differences (95%CIs) for plant protein type were as follows:
-26.15 [-268.74, 216.45] (3 vs. 2); -10.87 [-56.82, 35.08] (4 vs. 2); 15.28 [-227.65, 258.21] (4 vs. 3).
Absolute intakes represent intakes within the treatment arm. Between arm differences represent the
difference between the treatment (T) and control (C) arm (T–C). Within arm differences represent the
difference between end (E) and baseline (B) values within the treatment arm (E–B). AP=animal protein;
N=number of participants; MQS=Heyland Methodological Quality Score; SF=saturated fat. *Statistically
significant between subgroups (P<0.05)
-70 -50 -30 -10 10 30 50 70
Subgroup Level Trials N Mean Difference [95% CI] in Fasting Insulin, pmol/L Residual I2 P-value
Within subgroups Between subgroups
Total 5 118 -10.09 [-17.31, -2.86]
Baseline <70.2 pmol/L
≥70.2 pmol/L
2
3
51
67
-6.42 [-32.47, 19.64]
-9.12 [-43.07, 24.83]-2.70 [-45.49, 40.10] 24.58% 0.854
Plant protein type Mixed
Soy
Tree nuts
Pulses
0
3
1
1
0
74
13
31
-
-3.02 [-34.26, 28.21]
-29.17 [-269.75, 211.41]
-13.89 [-47.59, 19.81]
See legend 1.76% 0.630
Animal protein type Mixed
Dairy
Red meat
0
4
1
0
87
31
-
-3.49 [-25.99, 19.01]
-13.89 [-37.86, 10.08]
-10.40 [-43.28, 22.48] 0.00% 0.388
Percent AP replaced <35 %/d
≥35 %/d
4
-
105
-
-8.68 [-17.90, 0.53]
-- - -
Grams AP replaced <30 g/d
≥30 g/d
3
2
69
49
-12.26 [-35.29, 10.78]
-3.75 [-28.22, 20.72] 8.50 [-25.10, 42.11] 0.00% 0.480
Absolute fiber intake <30 g/d
≥30 g/d
2
2
54
51
-8.29 [-55.99, 39.42]
-6.29 [-42.57, 29.99]1.99 [-57.94, 61.92] 48.15% 0.899
Between arm ∆ in fiber intake <0.00 g/d
≥0.00 g/d
1
3
29
76
-11.72 [-67.13, 43.69]
-5.15 [-39.56, 29.27] 6.57 [-58.65, 71.80] 47.45% 0.707
Within arm ∆ in fiber intake <3.00 g/d
≥3.00 g/d
1
1
29
20
-11.72 [-28.00, 4.56]
6.00 [-12.91, 24.91] - - -
Absolute SF intake <7 %
≥7 %
0
2
0
60
-
-13.37 [-21.36, -5.37]- - -
Between arm ∆ in SF intake <-1.24 %
≥-1.24 %
1
1
31
29
-13.89 [-23.07, -4.71]
-11.72 [-28.00, 4.56] - - -
Within arm ∆ in SF intake <-0.64 %
≥-0.64 %
0
1
0
29
-
-11.72 [-28.00, 4.56] - - -
Design Crossover
Parallel
4
1
105
13
-8.26 [-24.50, 7.98]
-29.17 [-206.92, 148.58]-20.91 [-199.40, 157.57] 22.27% 0.734
Follow up <12 wk
≥12 wk
4
1
105
13
-8.26 [-24.50, 7.98]
-29.17 [-206.92, 148.58]-20.91 [-199.40, 157.57] 22.27% 0.734
MQS <8
≥8
5
0
118
0
-10.09 [-17.31, -2.86]
-- - -
Food form Powder
Whole
2
3
49
69
-3.75 [-28.22, 20.72]
-12.26 [-35.29, 10.78]-8.50 [-42.11, 25.10] 0.00% 0.480
Favours Plant
Protein
Favours Animal
Protein
< >
< >
< >

SYSTEMATIC REVIEW AND META-ANALYSIS
70
Supplemental Figure 4.4B – Categorical risk of bias subgroup analyses for fasting insulin. Point
estimates for each subgroup level (diamonds) are the pooled effect estimates. The dashed line
represents the pooled estimate for the overall (total) analysis. The residual I2 value indicates
heterogeneity unexplained by the subgroup. Pairwise between-subgroup mean differences (95%CIs) for
blinding of participants, personnel, and outcome assessors were as follows: -20.35 [-274.86, 234.16] (1
vs. 2); -31.67 [-302.72, 239.38] (1 vs. 3); 11.32 [-88.11, 110.75] (3 vs. 2). N=number of participants;
ROB=risk of bias. *Statistically significant between subgroups (P<0.05)
-100-80 -60 -40 -20 0 20 40 60 80 100
Favours Plant
Protein
Favours Animal
Protein
Subgroup Level Trials N Mean Difference [95% CI] in Fasting Insulin, pmol/LResidual
I2P-value
Within subgroups Between subgroups
Total 5 118 -10.09 [-17.31, -2.86]
Sequence generation Unclear ROB
Low ROB
High ROB
2
3
0
33
85
0
4.97 [-25.27, 35.22]
-12.76 [-25.49, -0.02]
-17.73 [-15.09, 50.54] 0.00% 0.184
Allocation concealment Unclear ROB
Low ROB
High ROB
5
0
0
118
0
0
-10.09 [-17.31, -2.86]
-
-
- - -
Blinding of participants, personnel,
and outcome assessors
Unclear ROB
Low ROB
High ROB
1
3
1
13
80
25
-29.17 [-282.50, 224.16]
-8.82 [-33.26, 15.61]
2.5 [-93.88, 98.88]See legend 42.38% 0.845
Incomplete outcome data Unclear ROB
Low ROB
High ROB
0
4
1
0
87
31
-
-3.49 [-25.99, 19.01]
-13.89 [-37.86, 10.08]-10.40 [-43.28, 22.48] 0.00% 0.388
Selective outcome reporting Unclear ROB
Low ROB
High ROB
2
3
0
33
85
0
4.97 [-25.27, 35.22]
-12.76 [-25.49, -0.02]
-17.73 [-15.09, 50.54] 0.00% 0.184

SYSTEMATIC REVIEW AND META-ANALYSIS
71
Supplemental Figure 5.5A – Funnel plot for trim-and-fill
analysis of HbA1c. The horizontal line represents the pooled
effect estimate expressed as a mean difference, the diagonal
lines represent the pseudo-95% CIs of the mean difference and
the clear circles represent effect estimates for each included.
SE of MD in HbA1c (%)
MD
in H
bA
1c
(%)
Imputed MD accounting for publication bias: N/AP-value: N/A

SYSTEMATIC REVIEW AND META-ANALYSIS
72
Supplemental Figure 5.5B – Funnel plot for trim-and-fill
analysis of fasting glucose. The horizontal line represents the
pooled effect estimate expressed as a mean difference, the
diagonal lines represent the pseudo-95% CIs of the mean
difference and the clear circles represent effect estimates for
each included study while back squares represent "imputed"
studies.
MD
in F
asti
ng
Glu
cose
(m
mo
l/L)
SE of MD in Fasting Glucose (mmol/L)
Imputed MD accounting for publication bias: -0.56 [95% CI: -0.94, -0.18]P-value: 0.004

SYSTEMATIC REVIEW AND META-ANALYSIS
73
Supplemental Figure 5.5C – Funnel plot for trim-and-fill
analysis of fasting insulin. The horizontal line represents the
pooled effect estimate expressed as a mean difference, the
diagonal lines represent the pseudo-95% CIs of the mean
difference and the clear circles represent effect estimates for
each included.
MD
in F
asti
ng
Insu
lin (
pm
ol/
L)
SE of MD in Fasting Insulin (pmol/L)
Imputed MD accounting for publication bias: N/A P-value: N/A

CROSS-SECTIONAL STUDY
74
CHAPTER V –ASSOCIATION BETWEEN SUBSTITUTING ANIMAL PROTEIN WITH PLANT PROTEIN AND HEMOGLOBIN A1C IN TYPE 2 DIABETES: A CROSS-SECTIONAL STUDY

CROSS-SECTIONAL STUDY
75
ASSOCIATION BETWEEN SUBSTITUTING ANIMAL PROTEIN WITH PLANT PROTEIN AND HEMOGLOBIN
A1C IN TYPE 2 DIABETES: A CROSS-SECTIONAL STUDY
Effie Viguiliouk1, 2, Christopher Ireland1, Viranda H. Jayalath1,3,10, Russell J. de Souza1, 2, 4, Anthony J.
Hanley2,5,6,7, Richard P. Bazinet2, John L. Sievenpiper1, 2, 8, 9 and David J.A. Jenkins1, 2, 6, 8, 9
1Toronto 3D Knowledge Synthesis and Clinical Trials Unit, Clinical Nutrition and Risk Factor Modification
Center, St. Michael’s Hospital, Toronto, Ontario, Canada
2Department of Nutritional Sciences, Faculty of Medicine, University of Toronto, Toronto, Ontario,
Canada
3Department of Surgical Oncology, Princess Margaret Cancer Center, University Health Network,
Toronto, Ontario, Canada
4Department of Clinical Epidemiology & Biostatistics, Faculty of Health Sciences, McMaster University,
Hamilton, Ontario, Canada
5Leadership Sinai Centre for Diabetes, Mount Sinai Hospital, Toronto, Canada
6Department of Medicine, University of Toronto, Toronto, Canada
7Dalla Lana School of Public Health, University of Toronto, Toronto, ON, Canada
8Division of Endocrinology and Metabolism, St. Michael’s Hospital, Toronto, Ontario, Canada
9Li Ka Shing Knowledge Institute, St. Michael’s Hospital, Toronto, Ontario, Canada
10Undergraduate Medical Education, University of Toronto, Toronto, ON, Canada
Corresponding author:
Dr. David J.A. Jenkins, MD, PhD, DSc
University Professor
Canada Research Chair in Nutrition and Metabolism
University of Toronto
150 College St., Toronto, Ontario, M5S 3M2, CANADA
T: 416 867 7475
F: 416 867 7495

CROSS-SECTIONAL STUDY
76
5.1 ABSTRACT
Aims: It remains unclear whether replacing animal with plant protein would confer glycemic control
benefits in individuals with T2D. Current evidence from observational studies is lacking and findings
from RCTs are inconsistent. Therefore, we conducted a cross-sectional study to assess the effect of
substituting animal with plant protein on HbA1c, in individuals with T2D.
Methods: We analyzed baseline data from 5 RCTs conducted in a group of middle-aged men and women
with T2D (n=627) in Toronto, Canada. A multivariate nutrient density model was used to model the
effect of substituting total plant protein for animal protein on HbA1c. A spearman correlation was used to
validate protein intake by correlating total protein intake with urinary urea measurements.
Results: Substituting total plant protein for animal protein was not associated with a difference in HbA1c
concentrations. Total protein intake correlated with urinary urea measurements (rs=0.397; P<0.0001).
Conclusions: This cross-sectional study showed that replacement of animal protein with total plant
protein was not associated with HbA1c. Prospective cohort studies and large, high quality RCTs are
warranted in order to address the limitations in our study and to further clarify the relationship between
substituting animal protein with major sources of plant protein and glycemic control in individuals with
diabetes.
Keywords: diabetes; HbA1c; plant protein; animal protein

CROSS-SECTIONAL STUDY
77
5.2 INTRODUCTION
Type 2 diabetes is largely preventable through diet and lifestyle modification, which has been
shown to be significantly more effective than the use of pharmacological agents4. For individuals living
with diabetes, achieving optimal glycemic control is an integral component in management of the
disease. Nutrition therapy is one such method that can help with the management of diabetes, where it
has been shown to lead to a 1-2% reduction in HbA1c49 and reduce the use of diabetes medications50, 51.
Diets high in major plant protein sources (i.e. soy, soy-derived foods, pulses and nuts) and
deficient in animal protein, such as a vegetarian or vegan diets, have been shown to be protective
against the development of T2D6-8 and beneficial for glycemic control in individuals with T2D9.
Prospective cohort studies and RCTs looking at higher intakes of specific plant protein sources alone
have also shown similar benefits10-14. Diets high in animal protein, especially in sources of red meat, are
associated with an increased diabetes risk15-17 and have even been suggested to be considered as a risk
factor for T2D22. Given these data on plant and animal protein, it still remains unclear whether replacing
animal protein with plant protein would confer glycemic control benefits in individuals with diabetes.
Current evidence from observational studies is lacking and findings from RCTs are inconsistent27-30.
Therefore, in order to assess the relationship between replacing animal protein with plant
protein and HbA1c, the current clinical standard for assessing glycemic control45, we have undertaken a
cross-sectional study using baseline data from 5 RCTs conducted in individuals with T2D. More
specifically, this study will allow us to assess this relationship while adjusting for other nutrients that
exist in whole food sources of plant and animal protein (i.e. available carbohydrates, fat, fibre,
magnesium) and to understand this relationship in the context of “real world” intakes in T2D.
5.3 METHODS
Baseline data were obtained from 5 RCTs conducted at the Clinical Nutrition and Risk Factor
Modification Centre at St. Michael’s Hospital (SMH) in Toronto, Canada. All 5 trials were approved by
the research ethics board of SMH and the University of Toronto, and written consent was obtained from
all participants at the time of recruitment. The trials were registered on ClinicalTrials.gov (registration
numbers: NCT00410722, NCT01063361, NCT01348568, NCT00438698, NCT01063374). Details of the
methods for 4 of the 5 original trials have previously been reported109, 222-224.
5.3.1 STUDY POPULATION
Participants were recruited by placing advertisements in local newspapers, the subway, hospital
clinics and/or distribution of similar advertisements to diabetes education programs. A total of 672

CROSS-SECTIONAL STUDY
78
unique individuals with dietary, anthropometric and biomarker data were included in the analysis.
Eligible participants consisted of men and post-menopausal women diagnosed with T2D for at least 6
months, were on a stable dose of antihyperglycemic medications for at least the previous 3 months, had
an HbA1c value between 6.5% to 8.5% at screening and baseline, and were free of any clinically
significant cardiovascular, renal (serum creatinine >150µmol/L) or liver (serum alanine aminotransferase
>3 times greater than the upper limit of the normal) disease, or a history of cancer.
5.3.2 ASSESSMENT OF DIETARY INTAKE
Participants provided food records covering the previous 7 days before their clinic visit at
baseline. Diet records were analyzed using a computer program (ESHA Food Processor SQL, version
10.9.0; ESHA, Salem, OR) based on U.S. Department of Agriculture data225 and international GI tables226
using the bread scale227 with additional GI measurements made on local foods (Glycemic Index
Laboratories).
5.3.3 BIOCHEMICAL ANALYSES
Blood and urine were analyzed at the SMH Core Lab and University of Toronto, FitzGerald
Building. In two of the trials HbA1c was analyzed within 2 days using whole blood collected in EDTA
Vacutainer tubes and measured by a designated high-performance liquid chromatography (HPLC)
method (Tosoh G7 Automated HPLC Analyzer; Tosoh Bioscience, Grove City, OH) with a coefficient of
variation (CV) of 1.7%222, 224. In the remaining three trials, HbA1c was analyzed within 24 hours using
whole blood collected in EDTA Vacutainer tubes by a turbidometric inhibition latex immunoassay (TINIA
Roche Diagnostics) with a CV between assays of 3% to 4%109, 223. Urea from 24-hour urine collection was
measured using an enzymatic method (SYNCHROLINX LX System).
5.3.4 STATISTICAL ANALYSES
Distributions of all continuous variables were assessed for normality by visual inspection of
distribution and probability plots. Variables that were not normally distributed underwent natural log
transformations. Descriptive statistics for continuous variables were summarized as means ± SDs and
categorical variables were summarized using frequencies and percents.
For the primary analysis a multivariate nutrient density model228 was used to evaluate the
relationship between the main predictor variable: substitution of animal protein with total plant protein
and the main outcome variable: HbA1c. We used seven models adjusted for different sets of covariates in
our analyses. Model 1 was adjusted for total plant protein, available carbohydrate, total fat, alcohol,
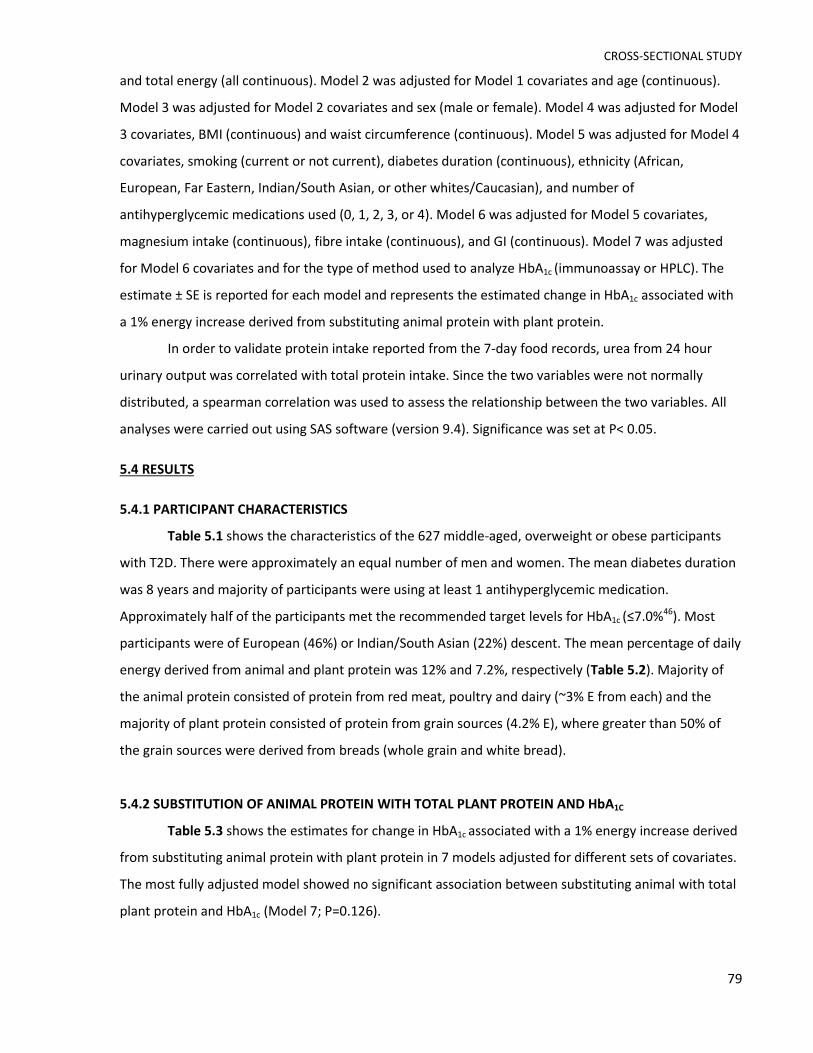
CROSS-SECTIONAL STUDY
79
and total energy (all continuous). Model 2 was adjusted for Model 1 covariates and age (continuous).
Model 3 was adjusted for Model 2 covariates and sex (male or female). Model 4 was adjusted for Model
3 covariates, BMI (continuous) and waist circumference (continuous). Model 5 was adjusted for Model 4
covariates, smoking (current or not current), diabetes duration (continuous), ethnicity (African,
European, Far Eastern, Indian/South Asian, or other whites/Caucasian), and number of
antihyperglycemic medications used (0, 1, 2, 3, or 4). Model 6 was adjusted for Model 5 covariates,
magnesium intake (continuous), fibre intake (continuous), and GI (continuous). Model 7 was adjusted
for Model 6 covariates and for the type of method used to analyze HbA1c (immunoassay or HPLC). The
estimate ± SE is reported for each model and represents the estimated change in HbA1c associated with
a 1% energy increase derived from substituting animal protein with plant protein.
In order to validate protein intake reported from the 7-day food records, urea from 24 hour
urinary output was correlated with total protein intake. Since the two variables were not normally
distributed, a spearman correlation was used to assess the relationship between the two variables. All
analyses were carried out using SAS software (version 9.4). Significance was set at P< 0.05.
5.4 RESULTS
5.4.1 PARTICIPANT CHARACTERISTICS
Table 5.1 shows the characteristics of the 627 middle-aged, overweight or obese participants
with T2D. There were approximately an equal number of men and women. The mean diabetes duration
was 8 years and majority of participants were using at least 1 antihyperglycemic medication.
Approximately half of the participants met the recommended target levels for HbA1c (≤7.0%46). Most
participants were of European (46%) or Indian/South Asian (22%) descent. The mean percentage of daily
energy derived from animal and plant protein was 12% and 7.2%, respectively (Table 5.2). Majority of
the animal protein consisted of protein from red meat, poultry and dairy (~3% E from each) and the
majority of plant protein consisted of protein from grain sources (4.2% E), where greater than 50% of
the grain sources were derived from breads (whole grain and white bread).
5.4.2 SUBSTITUTION OF ANIMAL PROTEIN WITH TOTAL PLANT PROTEIN AND HbA1C
Table 5.3 shows the estimates for change in HbA1c associated with a 1% energy increase derived
from substituting animal protein with plant protein in 7 models adjusted for different sets of covariates.
The most fully adjusted model showed no significant association between substituting animal with total
plant protein and HbA1c (Model 7; P=0.126).

CROSS-SECTIONAL STUDY
80
5.4.3 PROTEIN VALIDATION
Figure 5.1 shows the results of the spearman correlation analysis conducted to validate protein
intake, which showed that total protein intake was moderately correlated with 24 hour urinary urea
output (rs=0.397; P<0.0001; n=444).
5.5 DISCUSSION
To the best of our knowledge this is the first cross-sectional study to assess the relationship
between substituting animal protein with plant protein and HbA1c in individuals with T2D. Our analysis
of 627 middle-aged men and women showed that substituting animal protein with total plant protein
was not associated with HbA1c.
5.5.1 RELATION TO OTHER STUDIES AND POTENTIAL EXPLANATIONS
Our findings appear to be consistent with a previous cross-sectional study conducted in
diabetes-free female participants from the Nurses’ Health Study (n=3690), which did not show a
significant association between substituting one serving of total red meat with nuts or legumes and
HbA1c, but did show that substitution with poultry, fish, legumes, and nuts together was associated with
significantly lower HbA1c (β ± SE: -0.031±0.015, P=0.04)170. The lack of association between substituting
animal protein with total plant protein intake and HbA1c in our analysis may be due to the overall low
consumption of major plant protein sources (soy, pulses and nuts/seeds) by participants in our study,
which together contributed to <2% of total energy intake. This low level of consumption is reflected in
the overall pattern of protein intake by participants, which showed that 60% of total protein intake
consisted of animal protein, with the remaining protein consisting of >50% from grain sources and only
18% from soy, pulses, and nuts/seeds, which is consistent with the overall pattern of protein intake
reported for the North American population71, 72. As a result, it is possible that the range of intake in our
study may not be large enough to detect an overall difference and that with higher intakes of major
plant protein sources the association between substituting animal protein with plant protein and HbA1c
may change. This is supported by evidence from RCTs showing beneficial effects on glycemic control
when substituting animal protein with major plant protein sources in individuals with T2D27, 171. In
addition, the lack of association between substituting animal protein with total plant protein and HbA1c
may also be due to the high intake of plant protein for grain sources, which may be a marker of high GI
refined carbohydrates. This is supported by evidence from prospective cohort studies and RCTs showing
that consumption of higher GI foods is associated with increased T2D risk229-231 and poorer glycemic
CROSS-SECTIONAL STUDY
81
control outcomes in individuals with diabetes216, 217, respectively. Therefore, due to the heterogeneous
nature of plant and animal protein sources, it would be useful to compare substitutions of different
animal protein sources with major plant protein sources in order to gain a better understanding of
whether substitution of specific sources is more beneficial than overall substitution.
Furthermore, it is possible that our findings could be influenced by incomplete adjustment
resulting from measured residual confounding, which may include measurement errors from 7 day food
records. Misreporting of dietary intake is a major issue in dietary studies as it introduces error in the
estimation of energy intake and nutrients. Several cross-sectional and prospective studies using weighed
food records have been shown to underestimate energy intake by approximately 18% and the
prevalence of under reporters in these studies was 33%232. The extent of misreporting by individuals in
our study is not clear. Our protein validation analysis showed a moderate correlation between reported
daily protein intake and urea measured from 24 hour urinary output (rs=0.397). However, since there
may be a large within-subject variation in daily nitrogen excretion, repeat collections of consecutive 24
hour urinary output samples are required to validate protein intake 232, 233, which was not possible in the
current study since this was an exploratory analysis using baseline data from 5 RCTs.
5.5.2 LIMITATIONS
There are several limitations in our study that require consideration when interpreting our
findings. First, this was a cross-sectional analysis and therefore causal relationships cannot be inferred.
Second, the extent of misreporting by individuals in our analysis is not clear and may potentially
contribute to measured residual confounding. Third, since we were not able to adjust for other relevant
covariates (e.g. physical activity, socioeconomic status, etc.) it is possible that unmeasured residual
confounding may also exist in our analysis. Fourth, the adjusted R2’s for the main analysis was very small
(R2 ≤0.05), suggesting that the relationship is not strongly linear. Fifth, given the low intakes of major
plant protein sources it is possible that there was not a large enough range of intake to detect an overall
difference between substituting animal protein with plant protein and HbA1c
.
5.5.3 CONCLUSIONS
Overall, the results of our cross-sectional study show that replacing animal protein with total
plant protein is not associated with HbA1c in a group of middle-aged men and women with T2D. Given
the overall low consumption of major plant protein sources in the general population and the
heterogeneous nature of plant and animal protein sources, there is a need for prospective cohort
studies and large RCTs looking at the replacement of different types of animal protein with major plant
CROSS-SECTIONAL STUDY
82
protein sources on markers of glycemic control in individuals with diabetes in order to help address the
limitations in our study and further clarify our findings.
5.6 FUNDING
This work was supported by the Canadian Institutes of Health Research, Canola Council of
Canada, Agriculture and Agri-Food Canada, Loblaw Companies (Canada), Barilla (Italy), International
Tree Nut Council Nutrition Research and Education Foundation, Peanut Institute, ABIP through the
PURENet and the Saskatchewan Pulse Growers. . EV was funded by a Canadian Institutes of Health
Research (CIHR)-Fredrick Banting and Charles Best Canada Graduate Scholarship and the Banting and
Best Diabetes Centre (BBDC)-Yow Kam-Yuen Graduate Scholarship in Diabetes Research. RPB and DJAJ
were funded by the Government of Canada through the Canada Research Chair Endowment. None of
the sponsors had a role in any aspect of the present study, including design and conduct of the study;
collection, management, analysis, and interpretation of the data; and preparation, review, approval of
the manuscript or decision to publish.
5.7 CONFLICTS OF INTEREST
RJdS was funded by the CIHR Postdoctoral Fellowship Award and has received research support
from the CIHR, the Calorie Control Council, the Canadian Foundation for Dietetic Research and the Coca-
Cola Company (investigator initiated, unrestricted grant) and travel support from the World Health
Organization (WHO) to attend group meetings. He has served as an external resource person to WHO's
Nutrition Guidelines Advisory Group and is the lead author of 2 systematic reviews and meta-analyses
commissioned by WHO of the relation of saturated fatty acids and trans fatty acids with health
outcomes. AJH hold a Tier II Canada Research Chair in Diabetes Epidemiology. RPB has received
research funding from Bunge Ltd., travel support from Unilever and consultant fees from Kraft Foods
and Mead Johnson. JLS has received research support from the Canadian Institutes of health Research
(CIHR), Calorie Control Council, American Society of Nutrition (ASN), The Coca-Cola Company
(investigator initiated, unrestricted), Dr. Pepper Snapple Group (investigator initiated, unrestricted),
Pulse Canada, and The International Tree Nut Council Nutrition Research & Education Foundation. He
has received travel funding, speaker fees, and/or honoraria from the American Heart Association (AHA),
American College of Physicians (ACP), American Society for Nutrition (ASN), National Institute of
Diabetes and Digestive and Kidney Diseases (NIDDK) of the National Institutes of Health (NIH), Canadian
Diabetes Association (CDA), Canadian Nutrition Society (CNS), University of South Carolina, University of
Alabama at Birmingham, Oldways Preservation Trust, Nutrition Foundation of Italy (NFI), Calorie Control

CROSS-SECTIONAL STUDY
83
Council, Diabetes and Nutrition Study Group (DNSG) of the European Association for the Study of
Diabetes (EASD), International Life Sciences Institute (ILSI) North America, International Life Sciences
Institute (ILSI) Brazil, Abbott Laboratories, Pulse Canada, Canadian Sugar Institute, Dr. Pepper Snapple
Group, The Coca-Cola Company, Corn Refiners Association, World Sugar Research Organization, and
Società Italiana di Nutrizione Umana (SINU). He has consulting arrangements with Winston & Strawn
LLP, Perkins Coie LLP, and Tate & Lyle. He is on the Clinical Practice Guidelines Expert Committee for
Nutrition Therapy of both the Canadian Diabetes Association (CDA) and European Association for the
study of Diabetes (EASD), as well as being on an American Society for Nutrition (ASN) writing panel for a
scientific statement on sugars. He is a member of the International Carbohydrate Quality Consortium
(ICQC) and Board Member of the Diabetes and Nutrition Study Group (DNSG) of the EASD. He serves an
unpaid scientific advisor for the International Life Science Institute (ILSI) North America, Food, Nutrition,
and Safety Program (FNSP). His wife is an employee of Unilever Canada. DJAJ has received research
grants from Saskatchewan Pulse Growers, the Agricultural Bioproducts Innovation Program through the
Pulse Research Network, the Advanced Foods and Material Network, Loblaw Companies Ltd., Unilever,
Barilla, the Almond Board of California, the Coca-Cola Company (investigator initiated, unrestricted
grant), Solae, Haine Celestial, the Sanitarium Company, Orafti, the International Tree Nut Council
Nutrition Research and Education Foundation, the Peanut Institute, the Canola and Flax Councils of
Canada, the Calorie Control Council, the CIHR, the Canada Foundation for Innovation and the Ontario
Research Fund. He has received an honorarium from the United States Department of Agriculture to
present the 2013 W.O. Atwater Memorial Lecture. He received the 2013 Award for Excellence in
Research from the International Nut and Dried Fruit Council. He received funding and travel support
from the Canadian Society of Endocrinology and Metabolism to produce mini cases for the Canadian
Diabetes Association. He has been on the speaker's panel, served on the scientific advisory board,
and/or received travel support and/or honoraria from the Almond Board of California, Canadian
Agriculture Policy Institute, Loblaw Companies Ltd, the Griffin Hospital (for the development of the
NuVal scoring system), the Coca- Cola Company, Saskatchewan Pulse Growers, Sanitarium Company,
Orafti, the Almond Board of California, the American Peanut Council, the International Tree Nut Council
Nutrition Research and Education Foundation, the Peanut Institute, Herbalife International, Pacific
Health Laboratories, Nutritional Fundamental for Health, Barilla, Metagenics, Bayer Consumer Care,
Unilever Canada and Netherlands, Solae, Kellogg, Quaker Oats, Procter and Gamble, the Coca-Cola
Company, the Griffin Hospital, Abbott Laboratories, the Canola Council of Canada, Dean Foods, the
California Strawberry Commission, Haine Celestial, PepsiCo, the Alpro Foundation, Pioneer Hi- Bred
International, DuPont Nutrition and Health, Spherix Consulting and WhiteWave Foods, the Advanced

CROSS-SECTIONAL STUDY
84
Foods and Material Network, the Canola and Flax Councils of Canada, the Nutritional Fundamentals for
Health, AgriCulture and Agri-Food Canada, the Canadian Agri-Food Policy Institute, Pulse Canada, the
Saskatchewan Pulse Growers, the Soy Foods Association of North America, the Nutrition Foundation of
Italy (NFI), Nutra-Source Diagnostics, the McDougall Program, the Toronto Knowledge Translation Group
(St. Michael's Hospital), the Canadian College of Naturopathic Medicine, The Hospital for Sick Children,
the Canadian Nutrition Society (CNS), the American Society of Nutrition (ASN), Arizona State University,
Paolo Sorbini Foundation and the Institute of Nutrition, Metabolism and Diabetes. No competing
interests were declared by EV, CI, and VHJ. There are no patents, products in development or marketed
products to declare.
5.8 AUTHOR CONTRIBUTIONS
Conceived and designed the experiments: DJAJ JLS. Analyzed the data: EV CI VHJ RJdS JLS.
Wrote the paper: EV JLS. Interpretation of the data: EV CI VHJ RJdS AJH RPB DJAJ JLS. Critical revision of
the article for important intellectual content: EV CI VHJ RJdS AJH RPB DJAJ JLS. Final approval of the
article: EV CI VHJ RJdS AJH RPB DJAJ JLS. Obtaining of funding: DJAJ JLS. Administrative, technical, or
logistic support: CI VHJ. Collection and assembly of data: EV CI. Guarantors: DJAJ JLS.
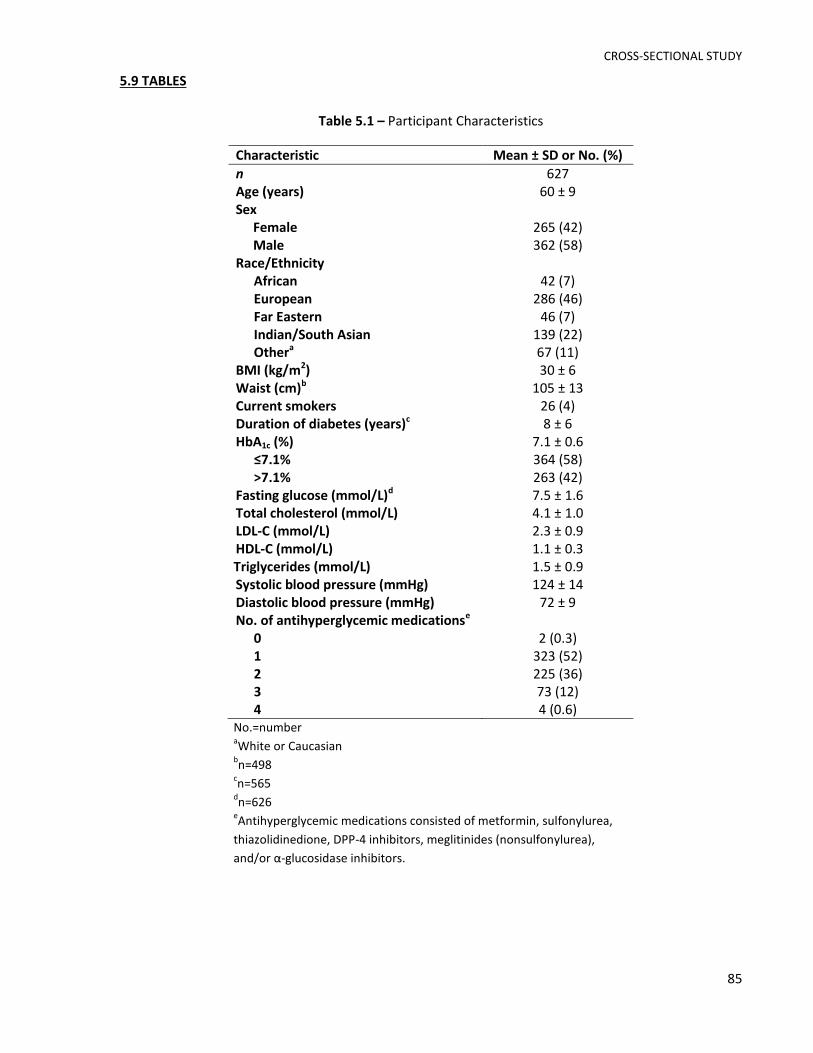
CROSS-SECTIONAL STUDY
85
5.9 TABLES
Table 5.1 – Participant Characteristics
Characteristic Mean ± SD or No. (%)
n 627 Age (years) 60 ± 9 Sex
Female 265 (42) Male 362 (58)
Race/Ethnicity African 42 (7) European 286 (46) Far Eastern 46 (7) Indian/South Asian 139 (22) Othera 67 (11)
BMI (kg/m2) 30 ± 6 Waist (cm)b 105 ± 13 Current smokers 26 (4) Duration of diabetes (years)c 8 ± 6 HbA1c (%) 7.1 ± 0.6
≤7.1% 364 (58) >7.1% 263 (42)
Fasting glucose (mmol/L)d 7.5 ± 1.6 Total cholesterol (mmol/L) 4.1 ± 1.0 LDL-C (mmol/L) 2.3 ± 0.9 HDL-C (mmol/L) 1.1 ± 0.3 Triglycerides (mmol/L) 1.5 ± 0.9 Systolic blood pressure (mmHg) 124 ± 14 Diastolic blood pressure (mmHg) 72 ± 9 No. of antihyperglycemic medicationse
0 2 (0.3) 1 323 (52) 2 225 (36) 3 73 (12) 4 4 (0.6)
No.=number aWhite or Caucasian
bn=498
cn=565
dn=626
eAntihyperglycemic medications consisted of metformin, sulfonylurea,
thiazolidinedione, DPP-4 inhibitors, meglitinides (nonsulfonylurea),
and/or α-glucosidase inhibitors.

CROSS-SECTIONAL STUDY
86
Table 5.2 – Nutritional Profile of Participants
Nutrient Mean ± SD
Energy (kcal/d) 1827.8 ± 498.2 Available carbohydrate (%E) 42.7 ± 7.4 Total fat (%E) 32.6 ± 6.5 Total Protein (%E) 19.2 ± 3.4
Plant protein (%E) 7.2 ± 1.8 Grain (%E) 4.2 ± 1.3 Potato (%E) 0.2 ± 0.2 Pulse (%E) 0.5 ± 0.8 Soy (%E) 0.2 ± 0.5 Nut/Seed (%E) 0.6 ± 0.7 Othera (%E) 1.5 ± 0.7
Animal protein (%E) 12 ± 4.0 Red meat (%E) 2.7 ± 2.5 Poultry (%E) 2.9 ± 2.5 Seafood (%E) 1.2 ± 1.4 Egg (%E) 0.6 ± 0.6 Dairy (%E) 2.9 ± 1.5 Other (%E)a 1.7 ± 1.8
Alcohol (%E) 1.7 ± 3.3 Fibre (g/1000 kcal) 14.4 ± 5.0 Magnesium (g/1000 kcal) 196 ± 49.3 Glycemic Index 56.3 ± 4.1 %E =percent energy aThis includes any remaining sources of plant or
animal protein (i.e. fruits and vegetables, gluten
added to various foods, etc.)

CROSS-SECTIONAL STUDY
87
Table 5.3 – Estimates for change in HbA1c associated with a 1% energy increase derived from
substituting animal protein with total plant protein*
Modela n Estimate ± SE (%) Adjusted-R2 P-value
1 627 0.01 ± 0.01 -0.002 0.492 2 627 0.01 ± 0.01 0.013 0.382 3 627 0.01 ± 0.01 0.015 0.485 4 498 0.04 ± 0.02 0.026 0.033 5 487 0.04 ± 0.02 0.035 0.031 6 487 0.03 ± 0.02 0.044 0.117 7 487 0.03 ± 0.02 0.044 0.126
n=sample size aModel 1 was adjusted for total plant protein, available carbohydrate
(continuous), total fat (continuous), alcohol (continuous), and total
energy (continuous). Model 2 was adjusted for Model 1 covariates and
age (continuous). Model 3 was adjusted for Model 2 covariates and sex
(male or female). Model 4 was adjusted for Model 3 covariates, BMI
(continuous) and waist circumference (continuous). Model 5 was
adjusted for Model 4 covariates, smoking (current or not current),
diabetes duration (continuous), ethnicity (African, European, Far
Eastern, Indian/South Asian, or other), and number of
antihyperglycemic medications used (0, 1, 2, 3, or 4). Model 6 was
adjusted for Model 5 covariates, magnesium intake (continuous), fibre
intake (continuous), and GI (continuous). Model 7 was adjusted for
Model 6 covariates and for the type of method used to analyze HbA1c
(immunoassay or HPLC)
*Note: Data are presented using non-log transformed variables

CROSS-SECTIONAL STUDY
88
5.10 FIGURES
Figure 5.1 – Correlation between Total Protein Intake and Urea Output
Total Protein Intake (g/d)
Ure
a O
utp
ut
(mm
ol/
d)
rs= 0.397P < 0.0001

OVERALL DISCUSSION AND LIMITATIONS
89
CHAPTER VI – OVERALL DISCUSSION AND LIMITATIONS
OVERALL DISCUSSION AND LIMITATIONS
90
CHAPTER VI – OVERALL DISCUSSION AND LIMITATIONS
6.1 OVERALL DISCUSSION
We conducted two studies to investigate the effect of replacing animal protein with plant
protein on glycemic control in individuals with diabetes. Our systematic review and meta-analysis of
RCTs found that replacing animal protein with major plant protein sources (i.e. soy, soy-derived
products, pulses and nuts) modestly improved glycemic control in individuals with T1D and T2D, where
our pooled analyses showed a statistically significant reduction in HbA1c, fasting glucose, and fasting
insulin by 0.16%, 0.53 mmol/L and 10.09 pmol/L, respectively. Our cross-sectional study showed that
substituting animal protein with total plant protein independent of other nutrients (i.e. available
carbohydrates, fat, fibre, magnesium) was not associated with HbA1c in a group of middle-aged men and
women with T2D. Taken together our results suggest that (1) replacing animal protein with major plant
protein sources leads to modest improvements in glycemic control in individuals with diabetes and (2)
due to the limited amount of data in this area, future research is warranted to address the limitations of
our systematic review and meta-analysis and lack of agreement with the associations seen in our cross-
sectional study.
Although both studies are the first to assess the replacement of animal with plant protein on
glycemic control in individuals with diabetes, our results support findings from previous studies related
to this area of study. In terms of our systematic review and meta-analysis, there have been several
systematic reviews and meta-analyses of RCTs looking at the effect of specific sources of plant protein
on glycemic control. Three of these meta-analyses were conducted by our group, which found that
incorporation of nuts or pulses into the diet led to significant improvements in measures of glycemic
control in individuals with and without diabetes10-12. There have also been two meta-analyses that
looked at the effect of soy and soy-derived products, which showed non-significant reductions in
measures of glycemic control107, 108. Overall these results are consistent with the findings of our meta-
analysis. In terms of our cross-sectional study, our results were somewhat consistent with a previous
cross-sectional study conducted in diabetes-free women participating in the Nurses’ Health Study, which
assessed the relationship between substituting one serving of red meat with alternative protein sources
such as poultry, fish, legumes and nuts and HbA1c. Similar to our findings, substituting a serving of red
meat with nuts or legumes alone were not associated with HbA1c, but substitution with poultry, fish,
legumes, and fish together was associated with significantly lower HbA1c (β ± SE: -0.031±0.015,
P=0.04)170. This inconsistency between the results of RCTs and epidemiological studies may be due to
the fact that there is a low consumption of major plant protein sources in the North American diet

OVERALL DISCUSSION AND LIMITATIONS
91
relative to animal protein and protein from other plant sources (i.e. grains)62, 71-73. Due to the low range
of intakes, this makes it difficult to detect an overall difference between substituting animal protein with
major sources of plant protein and HbA1c in individuals with diabetes. Furthermore, the high intake of
protein from grain sources may be contributing to the lack of association between substituting animal
with total plant protein and HbA1c, since it may be a marker for refined carbohydrates. This is consistent
with systematic reviews and meta-analyses of prospective cohort studies showing that higher GI is
associated with higher T2D risk229-231 and RCTs showing that higher GI is associated with higher HbA1c
levels in individuals with T2D234, 235.
6.2 LIMITATIONS
6.2.1 SYSTEMATIC REVIEW AND META-ANALYSIS
Limitations of our systematic review and meta-analysis include: 1) most of the trials had small
sample sizes (50% <20 participants); 2) the majority of trials (83%) were shorter than 12-weeks, which
may not be a sufficient follow-up duration to observe meaningful changes in glycemic control220; 3) the
majority of trials (92%) were of low quality (MQS<8); 4) most subgroup analyses were underpowered
due to the limited number of available studies; 5) only a small number of trials (17%) focused on
glycemic control endpoints as a primary outcome; and 6) sensitivity analyses showed that the pooled
effect estimate for fasting insulin was not robust.
6.2.2 CROSS-SECTIONAL STUDY
Limitations of our cross-sectional study include: 1) since this is an observational study causal
relationships cannot be inferred; 2) the extent of misreporting by individuals is not clear and may
potentially contribute to measured residual confounding in our analysis; 3) we were not able to adjust
for other relevant covariates (e.g. physical activity, socioeconomic status, etc.) and therefore it is
possible that there may also be unmeasured residual confounding in our analysis; 4) the adjusted R2 for
the main analysis was very small (R2 ≤0.05), suggesting that the relationship between substituting animal
with plant protein and HbA1c is not strongly linear; and 5) given the low intakes of major plant protein
sources it is possible that there was not a large enough range of intake to detect an overall difference
between substituting animal protein with plant protein and HbA1c.
Overall, the limitations of these 2 studies reinforce the need for more trials that are larger,
longer and of higher quality with a specific focus on glycemic endpoints as a primary outcome to better
understand the effect of replacing animal protein with plant protein on glycemic control in individuals
with diabetes.

OVERALL DISCUSSION AND LIMITATIONS
92
6.3 MECHANISMS OF ACTION
There are several potential mechanisms that may explain the beneficial effects of replacing
animal protein with major plant protein sources on glycemic control. The reduction in body iron stores
may be one such mechanism. Prospective cohort studies have shown that increased heme iron intake,
found only in animal protein sources196, is associated with a significantly higher risk of T2D197, 198,
whereas non-heme iron intake, which is found in both plant and animal protein sources196, has been
shown to be either inversely associated with198 or not associated with the incidence of T2D197. This may
be attributed to differences in bioavailability between non-heme and heme iron, where heme iron is
associated with higher body iron stores199, 200. Furthermore, observational studies have shown that
serum ferritin, the storage form of iron, predicted the development of hyperglycemia202 and T2D203, 236
and was found to be positively associated with insulin resistance204, 205, whereas randomized trials have
shown that the use of phlebotomy to reduce serum ferritin levels was associated with improved glucose
tolerance in individuals with metabolic syndrome206and T2D207. Overall, the negative impact of iron on
glycemic control may be due to its pro-oxidant activities, where it catalyzes several cellular reactions
that result in the production of reactive oxygen species, which in turn increases oxidative stress and
tissue damage, including damage to the pancreatic β-cells60, 195.
Another mechanism may relate to differences in the amino acid profiles between animal and
plant protein. Compared to animal proteins, plant proteins appear to be higher in L-arginine185 (Figure
6.1A-B). Randomized trials have shown that long-term oral administration of L-arginine improves insulin
sensitivity in individuals with T2D208, 209 and in vitro studies suggest that L-arginine promotes insulin
secretion from pancreatic β-cells by directly depolarizing the plasma membrane at a neutral pH and only
in the presence of glucose. Specifically, the electrogenic transport of L-arginine into the β-cell via the
amino acid transporter mCAT2A has been shown to lead to an increase in intracellular Ca2+
concentration through depolarization of the plasma membrane and activation of voltage-dependent
calcium channels, which in turn stimulates insulin secretion (see Figure 6.2)211-214, 237. However, other
mechanisms have also been proposed (i.e. the NO/cGMP pathway209). Given these findings, it is
uncertain whether the arginine levels typically found in dietary proteins would also have a significant
effect on insulin secretion. Furthermore, although our findings show improvements for fasting insulin,
specific measures of insulin sensitivity were not explored in our meta-analysis, where only one of the
included trials looked at HOMA-IR and found non-significant reductions173. Neither endpoint, however,
is considered to be a good marker of peripheral insulin sensitivity238 and therefore further studies are
warranted.
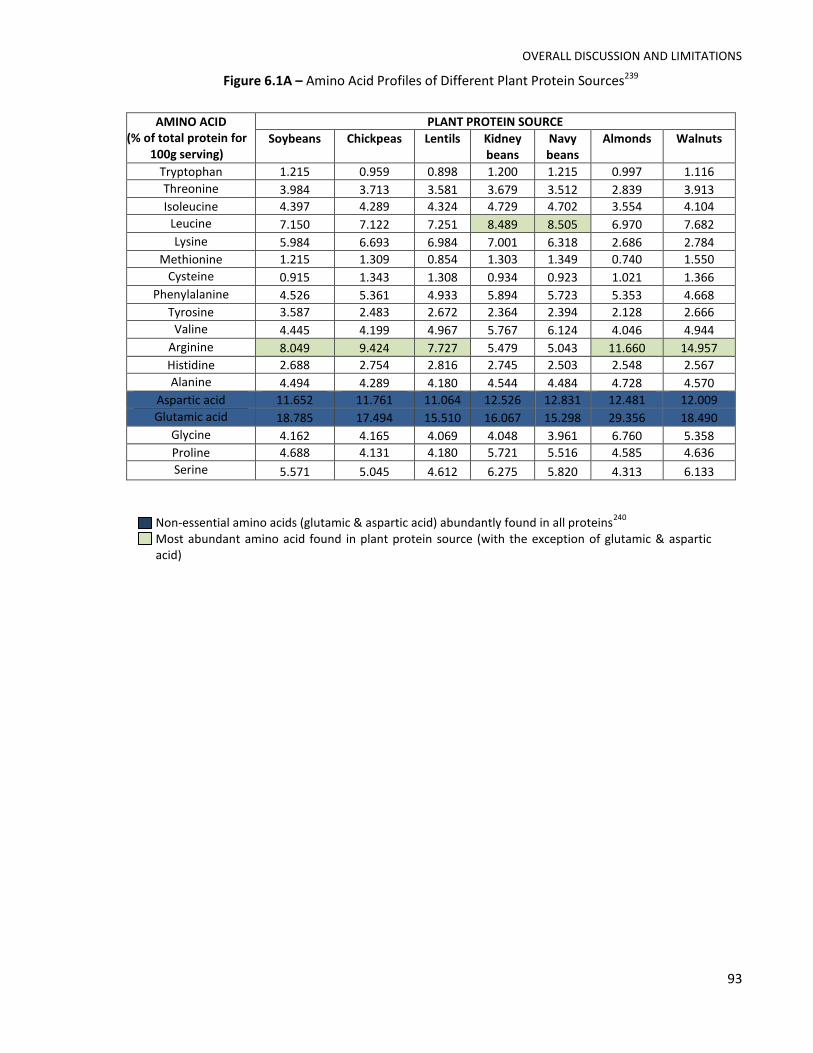
OVERALL DISCUSSION AND LIMITATIONS
93
Figure 6.1A – Amino Acid Profiles of Different Plant Protein Sources239
AMINO ACID (% of total protein for
100g serving)
PLANT PROTEIN SOURCE
Soybeans Chickpeas Lentils Kidney beans
Navy beans
Almonds Walnuts
Tryptophan 1.215 0.959 0.898 1.200 1.215 0.997 1.116
Threonine 3.984 3.713 3.581 3.679 3.512 2.839 3.913
Isoleucine 4.397 4.289 4.324 4.729 4.702 3.554 4.104
Leucine 7.150 7.122 7.251 8.489 8.505 6.970 7.682
Lysine 5.984 6.693 6.984 7.001 6.318 2.686 2.784
Methionine 1.215 1.309 0.854 1.303 1.349 0.740 1.550
Cysteine 0.915 1.343 1.308 0.934 0.923 1.021 1.366
Phenylalanine 4.526 5.361 4.933 5.894 5.723 5.353 4.668
Tyrosine 3.587 2.483 2.672 2.364 2.394 2.128 2.666
Valine 4.445 4.199 4.967 5.767 6.124 4.046 4.944
Arginine 8.049 9.424 7.727 5.479 5.043 11.660 14.957
Histidine 2.688 2.754 2.816 2.745 2.503 2.548 2.567
Alanine 4.494 4.289 4.180 4.544 4.484 4.728 4.570
Aspartic acid 11.652 11.761 11.064 12.526 12.831 12.481 12.009
Glutamic acid 18.785 17.494 15.510 16.067 15.298 29.356 18.490
Glycine 4.162 4.165 4.069 4.048 3.961 6.760 5.358
Proline 4.688 4.131 4.180 5.721 5.516 4.585 4.636
Serine 5.571 5.045 4.612 6.275 5.820 4.313 6.133
Non-essential amino acids (glutamic & aspartic acid) abundantly found in all proteins240
Most abundant amino acid found in plant protein source (with the exception of glutamic & aspartic acid)

OVERALL DISCUSSION AND LIMITATIONS
94
Figure 6.1B – Amino Acid Profile Of Animal Protein Sources239
Non-essential amino acids (glutamic & aspartic acid) abundantly found in all proteins240
Most abundant amino acid found in plant protein source (with the exception of glutamic & aspartic acid)
AMINO ACID (% of total protein for
100g serving)
ANIMAL PROTEIN SOURCE
Beef Chicken Cod fish Salmon Eggs Milk
Tryptophan 0.657 1.261 1.121 1.120 1.216 1.273
Threonine 3.995 4.486 4.385 4.383 4.801 4.273
Isoleucine 4.551 4.905 4.608 4.607 5.453 5.182
Leucine 7.956 8.274 8.130 8.125 8.545 9.485
Lysine 8.453 9.614 9.185 9.182 7.186 8.364
Methionine 2.604 2.600 2.961 2.960 3.116 2.636
Cysteine 1.291 1.048 1.073 1.073 2.321 0.606
Phenylalanine 3.950 4.037 3.903 3.903 5.310 5.182
Tyrosine 3.186 3.602 3.377 3.377 4.078 5.061
Valine 4.963 5.177 5.151 5.149 6.097 6.545
Arginine 6.465 6.762 5.983 5.983 6.002 2.848
Histidine 3.190 3.726 2.943 2.944 2.369 3.030
Alanine 6.079 5.838 6.049 6.046 5.564 3.394
Aspartic acid 9.110 9.404 10.241 10.240 10.048 8.576
Glutamic acid 15.011 14.813 14.928 14.925 13.068 22.485
Glycine 6.091 4.427 4.801 4.800 3.362 1.970
Proline 4.766 3.176 3.535 3.534 3.983 9.879
Serine 3.939 3.811 4.082 4.080 7.440 6.030

OVERALL DISCUSSION AND LIMITATIONS
95
Figure 6.2 – Model for the regulation of insulin secretion in the β-cell stimulated by glucose and amino
acids. Reprinted with permission from Diabetes, Vol 55 © 2006 by the American Diabetes Association
http://diabetes.diabetesjournals.org213.
Other potential mechanisms that may explain the effects of replacing animal protein with plant
protein on glycemic control involve a reduction in the glycemic index216, 217, the sodium and nitrite
content found in processed meats218, 219, reduced intake of saturated fat241-243, advanced glycation end
products (AGEs)244, phytoestrogens found in soy245, 246, and higher fiber intake247-250. It has also been
suggested that the negative impact of meat intake may be mediated by its effects on body weight251, 252,
inflammatory biomarkers170, 253, visceral adiposity254, 255, and intracellular lipid concentrations256, 257.
With regards to the results of our cross-sectional study, the lack of association between
substituting animal with major plant protein sources may be due to the low intake of soy, pulses and
nuts/seeds in our analysis, which together contributed to <2% E. This is consistent with North American
and European dietary intake patterns, which show that sources of animal protein are the major
contributors to total protein intake and that protein from grain sources are the major contributors to
total plant protein intake62, 71-74. As a result, these low ranges of intake makes it difficult to detect an
overall difference between substituting animal protein with major sources of plant protein and HbA1c in
individuals with diabetes. Furthermore, the lack of association may be a result of grain protein being a
marker of refined carbohydrates, where higher GI has been shown to be associated with an increased
T2D risk229-231 and poorer glycemic control in individuals with diabetes216, 217.
OVERALL DISCUSSION AND LIMITATIONS
96
Therefore, the findings from both of our studies suggest that if major plant protein sources were
consumed at higher levels of intake there may be less of an inconsistency between the results reported
from observational studies and those reported from RCTs.
6.4 CLINICAL IMPLICATIONS
Higher consumption of major sources of plant protein appears to be beneficial for the
management of diabetes. Our data support the evidence from existing recommendations for diabetes
management that recommend following plant-based diets, such as the Portfolio, vegetarian or vegan,
Mediterranean, and DASH diet, of which soy, soy-derived products, pulses and/or nuts are key
components 26, 258. In our meta-analysis, the median percent of animal protein replaced with plant
protein from total protein was approximately ~35% per day, which is equivalent to approximately 29
grams of protein per day49 for a middle-aged, overweight or obese adult with diabetes. This amount of
protein is found in approximately 3 servings of pulses or tofu53, which meets the recommended intakes
made by public health guidelines for intakes of meat and alternatives53, 54. Achieving such intakes,
however, may be challenging in North America as well as Europe, given that current intake levels of
major plant protein sources are low62, 71, 72, 74. In addition, it has been shown that although individuals
with diabetes are willing to follow a plant-based diet, very few actually do259. This may be in part due to
a gap in translation from knowledge to practice, where most health care providers appear to be aware
of plant-based diets for the management of diets, but the level of practice in implementing them is
low259. Overall, our data support that a partial or full substitution of animal with plant protein may be
beneficial in the management of with glycemic in individuals with diabetes, however further research is
needed to clarify our findings.
6.5 FUTURE DIRECTIONS
Future research is needed to confirm the results of our two studies. First, our systematic review
and meta-analysis revealed that majority of existing RCTs consist of small sample sizes (50% <20
participants), short follow-up duration (83% <12 weeks), are of low-quality (92% MQS<8) and do not
focus on measurements of glycemic control as a primary outcome. Therefore, there is an urgent need
for larger, longer, higher quality RCTs to assess the effect of replacing whole food sources of animal with
plant protein on measurements of glycemic control as a primary outcome in individuals with diabetes.
The inherent limitations of our cross-sectional study also support the need for such trials. Second, there
is only one prospective cohort study that has assessed the association between replacing animal with
plant protein on hard endpoints (i.e. development of diabetes)103, whereas most have looked at either

OVERALL DISCUSSION AND LIMITATIONS
97
plant-based dietary patterns or specific plant protein sources. Therefore, more studies are needed to
understand how replacement of animal with plant protein in the diet affects diabetes risk. Third, our
cross-sectional study provided further support for the fact that consumption of major plant protein
sources is low, which makes it difficult to detect a difference in HbA1c when substituting animal protein
with plant protein. Fourth, given the heterogeneous nature of plant and animal protein sources, we
suggest comparing substitutions of different animal protein sources with major plant protein sources in
order to gain a better understanding of whether it is more beneficial to substitute specific sources of
animal protein versus overall animal protein. Fifth, given the increasing amount of evidence that have
shown plant-based dietary patterns are associated with reducing the risk of diabetes, metabolic
syndrome80, 81, CVD13, 82-86, cancer87, 88, and all-cause mortality83, 89-92 and plant protein sources such as
soy, pulses and/or nuts showing beneficial effects on glycemic control10-12, blood pressure116-118, kidney
function119, 120, blood lipids10, 121-124, body weight125, 126, and inflammation127, it is clear that there is a gap
between knowledge and translation. Therefore, there is a need to focus on strategies that will promote
consumption of plant-based diets in those with or at risk for diabetes. As a first step in addressing these
future directions, our group has undertaken a series of systematic reviews and meta-analyses of RCTs to
look at the effect of replacing animal with plant protein on other cardiometabolic risk factors, such as
blood lipids and measures of kidney function, which will help us gain a better understanding of the
effects of replacing animal with plant protein in the management of diabetes. Overall, given the global
diabetes epidemic and mounting concern for the protection of our environment, it will remain
important to implement life-style modification strategies that will also positively impact our
environment. The replacement of animal protein with plant protein in our diet may serve as one
potential strategy.

CONCLUSIONS
98
CHAPTER VII – CONCLUSIONS
CONCLUSIONS
99
CHAPTER VII – CONCLUSIONS
Replacing animal protein with major sources of plant protein (i.e. soy, soy-derived products,
pulses and nuts) leads to modest improvements in glycemic control in individuals with diabetes,
however research is needed to address the limitations of our systematic review and meta-analysis and
lack of agreement with the associations seen in our cross-sectional study.
Overall, this thesis demonstrated the following:
1. In a systematic review and meta-analysis of 12 RCTs (n=240), diets emphasizing a replacement
of animal protein with major sources of plant protein significantly lowered HbA1c, fasting glucose
and fasting insulin in comparison with control diets in individuals with diabetes.
2. In a cross-sectional study using baseline data from 5 RCTs conducted in a sample of middle-aged
men and women with T2D (n=627), substitution of animal protein with total plant protein was
not associated with HbA1c.

REFERENCES
100
CHAPTER VIII – REFERENCES

REFERENCES
101
CHAPTER VIII - REFERENCES
1. International Diabetes Federation. IDF Diabetes Atlas, 6th edition update. Brussels, Belgium: International Diabetes Federation, 2014. http://www.idf.org/diabetesatlas. 2. Lin Y and Sun Z. Current views on type 2 diabetes. The Journal of endocrinology. 2010;204:1-11. 3. Zhang P, Zhang X, Brown J, Vistisen D, Sicree R, Shaw J and Nichols G. Global healthcare expenditure on diabetes for 2010 and 2030. Diabetes Res Clin Pract. 2010;87:293-301. 4. Knowler WC, Barrett-Connor E, Fowler SE, Hamman RF, Lachin JM, Walker EA, Nathan DM and Diabetes Prevention Program Research G. Reduction in the incidence of type 2 diabetes with lifestyle intervention or metformin. The New England journal of medicine. 2002;346:393-403. 5. Tuso PJ, Ismail MH, Ha BP and Bartolotto C. Nutritional update for physicians: plant-based diets. Perm J. 2013;17:61-6. 6. Tonstad S, Butler T, Yan R and Fraser GE. Type of vegetarian diet, body weight, and prevalence of type 2 diabetes. Diabetes care. 2009;32:791-6. 7. Tonstad S, Stewart K, Oda K, Batech M, Herring RP and Fraser GE. Vegetarian diets and incidence of diabetes in the Adventist Health Study-2. Nutrition, metabolism, and cardiovascular diseases : NMCD. 2013;23:292-9. 8. Halton TL, Liu S, Manson JE and Hu FB. Low-carbohydrate-diet score and risk of type 2 diabetes in women. The American journal of clinical nutrition. 2008;87:339-46. 9. Yokoyama Y, Barnard ND, Levin SM and Watanabe M. Vegetarian diets and glycemic control in diabetes: a systematic review and meta-analysis. Cardiovasc Diagn Ther. 2014;4:373-82. 10. Blanco Mejia S, Kendall CW, Viguiliouk E, Augustin LS, Ha V, Cozma AI, Mirrahimi A, Maroleanu A, Chiavaroli L, Leiter LA, de Souza RJ, Jenkins DJ and Sievenpiper JL. Effect of tree nuts on metabolic syndrome criteria: a systematic review and meta-analysis of randomised controlled trials. BMJ open. 2014;4:e004660. 11. Sievenpiper JL KC, Esfahani A, Wong JM, Carleton AJ, Jiang HY, Bazinet RP, Vidgen E, Jenkins DJ. Effect of non-oil-seed pulses on glycaemic control: a systematic review and meta-analysis of randomised controlled experimental trials in people with and without diabetes. Diabetologia. 2009;52:1479-95. 12. Viguiliouk E, Kendall CW, Blanco Mejia S, Cozma AI, Ha V, Mirrahimi A, Jayalath VH, Augustin LS, Chiavaroli L, Leiter LA, de Souza RJ, Jenkins DJ and Sievenpiper JL. Effect of tree nuts on glycemic control in diabetes: a systematic review and meta-analysis of randomized controlled dietary trials. PloS one. 2014;9:e103376. 13. Afshin A, Micha R, Khatibzadeh S and Mozaffarian D. Consumption of nuts and legumes and risk of incident ischemic heart disease, stroke, and diabetes: a systematic review and meta-analysis. The American journal of clinical nutrition. 2014;100:278-88. 14. Villegas R, Gao YT, Yang G, Li HL, Elasy TA, Zheng W and Shu XO. Legume and soy food intake and the incidence of type 2 diabetes in the Shanghai Women's Health Study. The American journal of clinical nutrition. 2008;87:162-7. 15. Aune D, Ursin G and Veierod MB. Meat consumption and the risk of type 2 diabetes: a systematic review and meta-analysis of cohort studies. Diabetologia. 2009;52:2277-87. 16. Pan A, Sun Q, Bernstein AM, Schulze MB, Manson JE, Willett WC and Hu FB. Red meat consumption and risk of type 2 diabetes: 3 cohorts of US adults and an updated meta-analysis. The American journal of clinical nutrition. 2011;94:1088-96. 17. Pan A, Sun Q, Bernstein AM, Manson JE, Willett WC and Hu FB. Changes in red meat consumption and subsequent risk of type 2 diabetes mellitus: three cohorts of US men and women. JAMA Intern Med. 2013;173:1328-35. 18. Benatar JR, Sidhu K and Stewart RA. Effects of high and low fat dairy food on cardio-metabolic risk factors: a meta-analysis of randomized studies. PloS one. 2013;8:e76480. 19. Fuller NR, Caterson ID, Sainsbury A, Denyer G, Fong M, Gerofi J, Baqleh K, Williams KH, Lau NS and Markovic TP. The effect of a high-egg diet on cardiovascular risk factors in people with type 2

REFERENCES
102
diabetes: the Diabetes and Egg (DIABEGG) study-a 3-mo randomized controlled trial. The American journal of clinical nutrition. 2015;101:705-13. 20. Pearce KL CP, Noakes M. Egg consumption as part of an energy-restricted high-protein diet improves blood lipid and blood glucose profiles in individuals with type 2 diabetes. The British journal of nutrition. 2011;105:584-92. 21. Roussell MA, Hill AM, Gaugler TL, West SG, Heuvel JP, Alaupovic P, Gillies PJ and Kris-Etherton PM. Beef in an Optimal Lean Diet study: effects on lipids, lipoproteins, and apolipoproteins. The American journal of clinical nutrition. 2012;95:9-16. 22. Barnard N LS, Trapp C. Meat Consumption as a Risk Factor for Type 2 Diabetes Nutrients 2014;6:897-910. 23. Tilman D and Clark M. Global diets link environmental sustainability and human health. Nature. 2014;515:518-22. 24. Canadian Diabetes Association Clinical Practice Guidelines Expert C, Goldenberg R and Punthakee Z. Definition, classification and diagnosis of diabetes, prediabetes and metabolic syndrome. Canadian journal of diabetes. 2013;37 Suppl 1:S8-11. 25. Mann JI, De Leeuw I, Hermansen K, Karamanos B, Karlstrom B, Katsilambros N, Riccardi G, Rivellese AA, Rizkalla S, Slama G, Toeller M, Uusitupa M, Vessby B, Diabetes and Nutrition Study Group of the European A. Evidence-based nutritional approaches to the treatment and prevention of diabetes mellitus. Nutrition, metabolism, and cardiovascular diseases : NMCD. 2004;14:373-94. 26. Evert AB, Boucher JL, Cypress M, Dunbar SA, Franz MJ, Mayer-Davis EJ, Neumiller JJ, Nwankwo R, Verdi CL, Urbanski P and Yancy WS, Jr. Nutrition therapy recommendations for the management of adults with diabetes. Diabetes care. 2014;37 Suppl 1:S120-43. 27. Azadbakht L, Atabak S and Esmaillzadeh A. Soy protein intake, cardiorenal indices, and C-reactive protein in type 2 diabetes with nephropathy: a longitudinal randomized clinical trial. Diabetes Care. 2008;31:648-54. 28. Hosseinpour-Niazi S, Mirmiran P, Hedayati M and Azizi F. Substitution of red meat with legumes in the therapeutic lifestyle change diet based on dietary advice improves cardiometabolic risk factors in overweight type 2 diabetes patients: a cross-over randomized clinical trial. Eur J Clin Nutr. 2014. 29. Hermansen K, Sondergaard M, Hoie L, Carstensen M and Brock B. Beneficial effects of a soy-based dietary supplement on lipid levels and cardiovascular risk markers in type 2 diabetic subjects. Diabetes Care. 2001;24:228-33. 30. Wheeler ML, Fineberg SE, Fineberg NS, Gibson RG and Hackward LL. Animal versus plant protein meals in individuals with type 2 diabetes and microalbuminuria: effects on renal, glycemic, and lipid parameters. Diabetes care. 2002;25:1277-82. 31. American Diabetes A. Diagnosis and classification of diabetes mellitus. Diabetes care. 2014;37 Suppl 1:S81-90. 32. Orgnaization WH. Diabetes Fact sheet N°312. 2015;January 2015. 33. Cornell S. Continual evolution of type 2 diabetes: an update on pathophysiology and emerging treatment options. Ther Clin Risk Manag. 2015;11:621-32. 34. Gan MJ, Albanese-O'Neill A and Haller MJ. Type 1 diabetes: current concepts in epidemiology, pathophysiology, clinical care, and research. Curr Probl Pediatr Adolesc Health Care. 2012;42:269-91. 35. Kahn SE, Cooper ME and Del Prato S. Pathophysiology and treatment of type 2 diabetes: perspectives on the past, present, and future. Lancet. 2014;383:1068-83. 36. Federation ID. IDF Diabetes Atlas, 6th edn. Brussels, Belgium: International Diabetes Federation, 2013
2013. 37. U.S. Department of Agriculture ARSaUSDoHaHS, Centers for Disease Control and Prevention. What We Eat In America, NHANES 2001-2004, 1 day mean intakes for adult males and females, adjusted to 2,000 calories and aver-aged.
REFERENCES
103
38. Agriculture USDo. Scientific Report of the 2015 Dietary Guidelines Advisory Committee 2015. 39. Centers for Disease Control and Prevention National diabetes statistics report: estimates of diabetes and its burden in the United States, 2014. 2014. [Accessed July 14, 2015]. Available from: http://www.cdc.gov.myaccess.library.utoronto.ca/diabetes/pubs/statsreport14/national-diabetes-report-web.pdf. 40. Canadian Diabetes Association Clinical Practice Guidelines Expert C, Ransom T, Goldenberg R, Mikalachki A, Prebtani AP and Punthakee Z. Reducing the risk of developing diabetes. Canadian journal of diabetes. 2013;37 Suppl 1:S16-9. 41. Public Health Agency of Canada. Diabetes in Canada: Facts and figures from a public health perspective. 2011. http://www.phac-aspc.gc.ca/cd-mc/publications/diabetes-diabete/facts-figures-faits-chiffres-2011/highlights-saillants-eng.php 42. Canadian Diabetes Association Clinical Practice Guidelines Expert C, Ekoe JM, Punthakee Z, Ransom T, Prebtani AP and Goldenberg R. Screening for type 1 and type 2 diabetes. Canadian journal of diabetes. 2013;37 Suppl 1:S12-5. 43. Sarwar N AT, Eiriksdottir G. Markers of dysglycaemia and risk of coronary heart disease in people without diabetes: Reykjavik Prospective Study and systematic review. PLoS Med 2010;7. 44. Selvin E, Steffes MW, Zhu H, Matsushita K, Wagenknecht L, Pankow J, Coresh J and Brancati FL. Glycated hemoglobin, diabetes, and cardiovascular risk in nondiabetic adults. The New England journal of medicine. 2010;362:800-11. 45. Hanas R, John G and International Hb ACC. 2010 consensus statement on the worldwide standardization of the hemoglobin A1c measurement. Clin Chem. 2010;56:1362-4. 46. Canadian Diabetes Association Clinical Practice Guidelines Expert C, Imran SA, Rabasa-Lhoret R and Ross S. Targets for glycemic control. Canadian journal of diabetes. 2013;37 Suppl 1:S31-4. 47. American Diabetes Association. Approaches to glycemic treatment. Sec 7. In Standards of medical care in diabetes – 2015. Diabetes Care. 2015;38(Suppl 1):S41–S48. 48. Nathan DM, Buse JB, Davidson MB, Ferrannini E, Holman RR, Sherwin R, Zinman B, American Diabetes A and European Association for Study of D. Medical management of hyperglycemia in type 2 diabetes: a consensus algorithm for the initiation and adjustment of therapy: a consensus statement of the American Diabetes Association and the European Association for the Study of Diabetes. Diabetes care. 2009;32:193-203. 49. Canadian Diabetes Association Clinical Practice Guidelines Expert C, Dworatzek PD, Arcudi K, Gougeon R, Husein N, Sievenpiper JL and Williams SL. Nutrition therapy. Canadian journal of diabetes. 2013;37 Suppl 1:S45-55. 50. Barnard ND, Cohen J, Jenkins DJ, Turner-McGrievy G, Gloede L, Jaster B, Seidl K, Green AA and Talpers S. A low-fat vegan diet improves glycemic control and cardiovascular risk factors in a randomized clinical trial in individuals with type 2 diabetes. Diabetes care. 2006;29:1777-83. 51. Nicholson AS1 SM, Barnard ND, Gore S, Sullivan R, Browning S. Toward improved management of NIDDM: A randomized, controlled, pilot intervention using a lowfat, vegetarian diet. Prev Med. 1999;29:87-91. 52. Pulse Canada. "What is a Pulse?". PulseCanada.com. 2015. Web. Accessed 19 June 2015. 53. Health Canada. (2011). Eating well with Canada’s food guide (HC Pub.: 4651). Ottawa: Queen’s Printer. . 54. U.S. Department of Agriculture. (2011). Choosemyplate.gov. Retrieved from: http://www.choosemyplate.gov/. 55. American Dietetic Association (ADA) (2003) Position of the American Dietetic Association and Dietitians of Canada: Vegetarian diets. J Amer Diet Assoc 103, 748–765. 56. Marsh KA, Munn EA and Baines SK. Protein and vegetarian diets. Med J Aust. 2013;199:S7-S10. 57. FAO/WHO Expert Consultation (1991) Protein Quality Evaluation Report of the Joint FAO/WHO Expert Consultation held in Bethseda, Md., USA, in 1989. FAO Food and Nutrition Paper 51, Rome.

REFERENCES
104
58. Boye J, Wijesinha-Bettoni R and Burlingame B. Protein quality evaluation twenty years after the introduction of the protein digestibility corrected amino acid score method. The British journal of nutrition. 2012;108 Suppl 2:S183-211. 59. Agency CFI. Elements within the Nutrition Facts Table: Protein. Available at: http://inspection.gc.ca/food/labelling/food-labelling-for-industry/nutrition-labelling/elements-within-the-nutrition-facts-table/eng/1389206763218/1389206811747?chap=7#s9c7
2014. 60. Puntarulo S. Iron, oxidative stress and human health. Mol Aspects Med. 2005;26:299-312. 61. WHO/FAO/UNU (2007) Protein and amino acid requirements in human nutrition: report of a joint WHO/FAO/UNU expert consultation. WHO Technical Report Series 935. Geneva. FAO/WHO/UNU, 276. 62. Phillips SM, Fulgoni VL, 3rd, Heaney RP, Nicklas TA, Slavin JL and Weaver CM. Commonly consumed protein foods contribute to nutrient intake, diet quality, and nutrient adequacy. The American journal of clinical nutrition. 2015. 63. O'Neil CE NT, Fulgoni VL 3rd. Tree nut consumption is associated with better nutrient adequacy and diet quality in adults: National Health and Nutrition Examination Survey 2005-2010. Nutrients. 2015;7:595-607. 64. Craig WJ, Mangels AR and American Dietetic A. Position of the American Dietetic Association: vegetarian diets. Journal of the American Dietetic Association. 2009;109:1266-82. 65. US Food and Drug Administration (FDA). Qualified health claims: Letter of enforcement discretion-nuts and coronary heart disease (Docket No 02P-0505) [accessed June 29 2015]. Available from: http://www.fda.gov/food/ingredientspackaginglabeling/labelingnutrition/ucm072926.htm. 66. US Food and Drug Administration (FDA). Qualified Health Claims: Letter of Enforcement Discretion - Walnuts and Coronary Heart Disease (Docket No 02P-0292) [accessed June 29 2015]. Available from: http://www.fda.gov/Food/IngredientsPackagingLabeling/LabelingNutrition/ucm072910.htm. 67. Health Canada. Summary of Health Canada's Assessment of a Health Claim about Soy Protein and Cholesterol Lowering [accessed June 29 2015]. Available from: http://www.hc-sc.gc.ca/fn-an/label-etiquet/claims-reclam/assess-evalu/soy-protein-cholesterol-eng.php. 68. Craig WJ. Nutrition concerns and health effects of vegetarian diets. Nutr Clin Pract. 2010;25:613-20. 69. Lea EJ, Crawford D and Worsley A. Public views of the benefits and barriers to the consumption of a plant-based diet. Eur J Clin Nutr. 2006;60:828-37. 70. NIH. Amino acids. Medical Encyclopedia 2013;2015. 71. Berner LA BG, Wise M, Doi J. Characterization of Dietary Protein among Older Adults in the United States: Amount, Animal Sources, and Meal Patterns. J Acad Nutr Diet. 2013;113:809-15. 72. Smit E, Nieto FJ, Crespo CJ and Mitchell P. Estimates of animal and plant protein intake in US adults: results from the Third National Health and Nutrition Examination Survey, 1988-1991. Journal of the American Dietetic Association. 1999;99:813-20. 73. O'Neil CE, Keast DR, Fulgoni VL III., Nicklas TA. Food sources of energy and nutrients among adults in the US: NHANES 2003-2006. Nutrients 2012;4(12):2097–120. 74. Halkjaer J OA, Bjerregaard LJ, Deharveng G, Tjønneland A, Welch AA, Crowe FL, Wirfält E, Hellstrom V, Niravong M, Touvier M, Linseisen J, Steffen A, Ocké MC, Peeters PH, Chirlaque MD, Larrañaga N, Ferrari P, Contiero P, Frasca G, Engeset D, Lund E, Misirli G, Kosti M, Riboli E, Slimani N, Bingham S. Intake of total, animal and plant proteins, and their food sources in 10 countries in the European Prospective Investigation into Cancer and Nutrition. Eur J Clin Nutr. 2009;63:S16-36. 75. Mudryj AN, Yu N, Hartman TJ, Mitchell DC, Lawrence FR and Aukema HM. Pulse consumption in Canadian adults influences nutrient intakes. The British journal of nutrition. 2012;108 Suppl 1:S27-36.

REFERENCES
105
76. Mudryj AN, Aukema HM and Yu N. Intake patterns and dietary associations of soya protein consumption in adults and children in the Canadian Community Health Survey, Cycle 2.2. The British journal of nutrition. 2015:1-11. 77. Hamdy O and Horton ES. Protein content in diabetes nutrition plan. Curr Diab Rep. 2011;11:111-9. 78. Agriculture USDo. What Counts as an Ounce Equivalent in the Protein Foods Group? 79. World Health Organization FaAOotUN. Diet, nutrition and the prevention of chronic diseases - Report of a joint WHO/FAO expert consultation (WHO Technical Report Series 916). 2003. 80. Rizzo NS, Sabate J, Jaceldo-Siegl K and Fraser GE. Vegetarian dietary patterns are associated with a lower risk of metabolic syndrome: the adventist health study 2. Diabetes care. 2011;34:1225-7. 81. Hosseinpour-Niazi S MP, Amiri Z, Hosseini-Esfahani F, Shakeri N, Azizi F. Legume intake is inversely associated with metabolic syndrome in adults. Arch Iran Med. 2012;15:538-44. 82. Zhou D, Yu H, He F, Reilly KH, Zhang J, Li S, Zhang T, Wang B, Ding Y and Xi B. Nut consumption in relation to cardiovascular disease risk and type 2 diabetes: a systematic review and meta-analysis of prospective studies. The American journal of clinical nutrition. 2014;100:270-7. 83. Luo C, Zhang Y, Ding Y, Shan Z, Chen S, Yu M, Hu FB and Liu L. Nut consumption and risk of type 2 diabetes, cardiovascular disease, and all-cause mortality: a systematic review and meta-analysis. The American journal of clinical nutrition. 2014;100:256-69. 84. Kwok CS, Umar S, Myint PK, Mamas MA and Loke YK. Vegetarian diet, Seventh Day Adventists and risk of cardiovascular mortality: a systematic review and meta-analysis. Int J Cardiol. 2014;176:680-6. 85. Zhang X SX, Gao YT, Yang G, Li Q, Li H, Jin F, Zheng W. Soy food consumption is associated with lower risk of coronary heart disease in Chinese women. The Journal of nutrition. 2003;133:2874-8. 86. Kokubo Y, Iso H, Ishihara J, Okada K, Inoue M, Tsugane S and Group JS. Association of dietary intake of soy, beans, and isoflavones with risk of cerebral and myocardial infarctions in Japanese populations: the Japan Public Health Center-based (JPHC) study cohort I. Circulation. 2007;116:2553-62. 87. Tantamango-Bartley Y, Jaceldo-Siegl K, Fan J and Fraser G. Vegetarian diets and the incidence of cancer in a low-risk population. Cancer Epidemiol Biomarkers Prev. 2013;22:286-94. 88. Orlich MJ, Singh PN, Sabate J, Fan J, Sveen L, Bennett H, Knutsen SF, Beeson WL, Jaceldo-Siegl K, Butler TL, Herring RP and Fraser GE. Vegetarian dietary patterns and the risk of colorectal cancers. JAMA Intern Med. 2015;175:767-76. 89. van den Brandt PA and Schouten LJ. Relationship of tree nut, peanut and peanut butter intake with total and cause-specific mortality: a cohort study and meta-analysis. Int J Epidemiol. 2015. 90. Grosso G, Yang J, Marventano S, Micek A, Galvano F and Kales SN. Nut consumption on all-cause, cardiovascular, and cancer mortality risk: a systematic review and meta-analysis of epidemiologic studies. The American journal of clinical nutrition. 2015;101:783-93. 91. Orlich MJ, Singh PN, Sabate J, Jaceldo-Siegl K, Fan J, Knutsen S, Beeson WL and Fraser GE. Vegetarian dietary patterns and mortality in Adventist Health Study 2. JAMA Intern Med. 2013;173:1230-8. 92. Luu HN, Blot WJ, Xiang YB, Cai H, Hargreaves MK, Li H, Yang G, Signorello L, Gao YT, Zheng W and Shu XO. Prospective evaluation of the association of nut/peanut consumption with total and cause-specific mortality. JAMA Intern Med. 2015;175:755-66. 93. Schwingshackl L, Missbach B, Konig J and Hoffmann G. Adherence to a Mediterranean diet and risk of diabetes: a systematic review and meta-analysis. Public Health Nutr. 2015;18:1292-9. 94. Koloverou E, Esposito K, Giugliano D and Panagiotakos D. The effect of Mediterranean diet on the development of type 2 diabetes mellitus: a meta-analysis of 10 prospective studies and 136,846 participants. Metabolism. 2014;63:903-11. 95. Snowdon DA PR. Does a vegetarian diet reduce the occurrence of diabetes? Am J Public Health. 1985;75:507-12.

REFERENCES
106
96. Schwingshackl L HG. Diet quality as assessed by the Healthy Eating Index, the Alternate Healthy Eating Index, the Dietary Approaches to Stop Hypertension score, and health outcomes: a systematic review and meta-analysis of cohort studies. J Acad Nutr Diet. 2015;115:780-800. 97. Huo R DT, Xu Y, Xu W, Chen X, Sun K, Yu X. Effects of Mediterranean-style diet on glycemic control, weight loss and cardiovascular risk factors among type 2 diabetes individuals: a meta-analysis. Eur J Clin Nutr. 2014;2014 Nov 5. doi: 10.1038/ejcn.2014.243. [Epub ahead of print]. 98. Carter P AF, Troughton J, Gray LJ, Khunti K, Davies MJ. A Mediterranean diet improves HbA1c but not fasting blood glucose compared to alternative dietary strategies: a network meta-analysis. J Hum Nutr Diet. 2014;27:280-97. 99. Esposito K, Maiorino MI, Ciotola M, Di Palo C, Scognamiglio P, Gicchino M, Petrizzo M, Saccomanno F, Beneduce F, Ceriello A and Giugliano D. Effects of a Mediterranean-style diet on the need for antihyperglycemic drug therapy in patients with newly diagnosed type 2 diabetes: a randomized trial. Ann Intern Med. 2009;151:306-14. 100. Shirani F S-AA, Azadbakht L. Effects of Dietary Approaches to Stop Hypertension (DASH) diet on some risk for developing type 2 diabetes: a systematic review and meta-analysis on controlled clinical trials. Nutrition. 2013;29:939-47. 101. Keith M, Kuliszewski MA, Liao C, Peeva V, Ahmed M, Tran S, Sorokin K, Jenkins DJ, Errett L and Leong-Poi H. A modified portfolio diet complements medical management to reduce cardiovascular risk factors in diabetic patients with coronary artery disease. Clin Nutr. 2015;34:541-8. 102. Sluijs I, Beulens JW, van der AD, Spijkerman AM, Grobbee DE and van der Schouw YT. Dietary intake of total, animal, and vegetable protein and risk of type 2 diabetes in the European Prospective Investigation into Cancer and Nutrition (EPIC)-NL study. Diabetes care. 2010;33:43-8. 103. Malik VSL, Y. Tobias, D. K. Pan, A. Hu, F. B. Dietary protein intake and risk of type 2 diabetes in U.S. Men and women. Diabetes 2015;64:A424. 104. Meyer KA, Kushi LH, Jacobs DR, Jr., Slavin J, Sellers TA and Folsom AR. Carbohydrates, dietary fiber, and incident type 2 diabetes in older women. The American journal of clinical nutrition. 2000;71:921-30. 105. Wennberg M SS, Uusitalo U, Tuomilehto J, Shaw JE, Zimmet PZ, Kowlessur S, Pauvaday V, Magliano DJ. High consumption of pulses is associated with lower risk of abnormal glucose metabolism in women in Mauritius. Diabet Med 2015;32:513-20. 106. Guo K ZZ, Jiang Y, Li W, Li Y. Meta-analysis of prospective studies on the effects of nut consumption on hypertension and type 2 diabetes mellitus. J Diabetes. 2015;7:202-12. 107. Liu ZM, Chen YM and Ho SC. Effects of soy intake on glycemic control: a meta-analysis of randomized controlled trials. The American journal of clinical nutrition. 2011;93:1092-101. 108. Yang B, Chen Y, Xu T, Yu Y, Huang T, Hu X and Li D. Systematic review and meta-analysis of soy products consumption in patients with type 2 diabetes mellitus. Asia Pacific journal of clinical nutrition. 2011;20:593-602. 109. Jenkins DJ KC, Augustin LS, Mitchell S, Sahye-Pudaruth S, Blanco Mejia S, Chiavaroli L, Mirrahimi A, Ireland C, Bashyam B, Vidgen E, de Souza RJ, Sievenpiper JL, Coveney J, Leiter LA, Josse RG. Effect of legumes as part of a low glycemic index diet on glycemic control and cardiovascular risk factors in type 2 diabetes mellitus: a randomized controlled trial. Arch Intern Med. 2012;172:1653-60. 110. Saraf-Bank S EA, Faghihimani E, Azadbakht L. Effects of Legume-Enriched Diet on Cardiometabolic Risk Factors among Individuals at Risk for Diabetes: A Crossover Study. J Am Coll Nutr. 2015;11:1-10. 111. Parham M, Heidari S, Khorramirad A, Hozoori M, Hosseinzadeh F, Bakhtyari L and Vafaeimanesh J. Effects of pistachio nut supplementation on blood glucose in patients with type 2 diabetes: a randomized crossover trial. The review of diabetic studies : RDS. 2014;11:190-6. 112. Hernandez-Alonso P, Salas-Salvado J, Baldrich-Mora M, Juanola-Falgarona M and Bullo M. Beneficial effect of pistachio consumption on glucose metabolism, insulin resistance, inflammation, and related metabolic risk markers: a randomized clinical trial. Diabetes care. 2014;37:3098-105.

REFERENCES
107
113. Gulati S, Misra A, Pandey RM, Bhatt SP and Saluja S. Effects of pistachio nuts on body composition, metabolic, inflammatory and oxidative stress parameters in Asian Indians with metabolic syndrome: a 24-wk, randomized control trial. Nutrition. 2014;30:192-7. 114. Kasliwal RR, Bansal M, Mehrotra R, Yeptho KP and Trehan N. Effect of pistachio nut consumption on endothelial function and arterial stiffness. Nutrition. 2015;31:678-85. 115. Abazarfard Z, Salehi M and Keshavarzi S. The effect of almonds on anthropometric measurements and lipid profile in overweight and obese females in a weight reduction program: A randomized controlled clinical trial. J Res Med Sci. 2014;19:457-64. 116. Mohammadifard N, Salehi-Abargouei A, Salas-Salvado J, Guasch-Ferre M, Humphries K and Sarrafzadegan N. The effect of tree nut, peanut, and soy nut consumption on blood pressure: a systematic review and meta-analysis of randomized controlled clinical trials. The American journal of clinical nutrition. 2015;101:966-82. 117. Jayalath VH, de Souza RJ, Sievenpiper JL, Ha V, Chiavaroli L, Mirrahimi A, Di Buono M, Bernstein AM, Leiter LA, Kris-Etherton PM, Vuksan V, Beyene J, Kendall CW and Jenkins DJ. Effect of dietary pulses on blood pressure: a systematic review and meta-analysis of controlled feeding trials. Am J Hypertens. 2014;27:56-64. 118. Dong JY, Tong X, Wu ZW, Xun PC, He K and Qin LQ. Effect of soya protein on blood pressure: a meta-analysis of randomised controlled trials. The British journal of nutrition. 2011;106:317-26. 119. Zhang J, Liu J, Su J and Tian F. The effects of soy protein on chronic kidney disease: a meta-analysis of randomized controlled trials. Eur J Clin Nutr. 2014;68:987-93. 120. Jing Z and Wei-Jie Y. Effects of soy protein containing isoflavones in patients with chronic kidney disease: A systematic review and meta-analysis. Clin Nutr. 2015. 121. Bazzano LA, Thompson AM, Tees MT, Nguyen CH and Winham DM. Non-soy legume consumption lowers cholesterol levels: a meta-analysis of randomized controlled trials. Nutrition, metabolism, and cardiovascular diseases : NMCD. 2011;21:94-103. 122. Anderson JW and Bush HM. Soy protein effects on serum lipoproteins: a quality assessment and meta-analysis of randomized, controlled studies. J Am Coll Nutr. 2011;30:79-91. 123. Ha V, Sievenpiper JL, de Souza RJ, Jayalath VH, Mirrahimi A, Agarwal A, Chiavaroli L, Mejia SB, Sacks FM, Di Buono M, Bernstein AM, Leiter LA, Kris-Etherton PM, Vuksan V, Bazinet RP, Josse RG, Beyene J, Kendall CW and Jenkins DJ. Effect of dietary pulse intake on established therapeutic lipid targets for cardiovascular risk reduction: a systematic review and meta-analysis of randomized controlled trials. CMAJ : Canadian Medical Association journal = journal de l'Association medicale canadienne. 2014;186:E252-62. 124. Banel DK and Hu FB. Effects of walnut consumption on blood lipids and other cardiovascular risk factors: a meta-analysis and systematic review. The American journal of clinical nutrition. 2009;90:56-63. 125. Flores-Mateo G, Rojas-Rueda D, Basora J, Ros E and Salas-Salvado J. Nut intake and adiposity: meta-analysis of clinical trials. The American journal of clinical nutrition. 2013;97:1346-55. 126. Wu J, Dong J, Jiang X and Qin L. [Effects of soy protein supplement on overweight and obese population: meta-analysis of randomized controlled trials]. Wei Sheng Yan Jiu. 2013;42:185-9. 127. Salehi-Abargouei A, Saraf-Bank S, Bellissimo N and Azadbakht L. Effects of non-soy legume consumption on C-reactive protein: a systematic review and meta-analysis. Nutrition. 2015;31:631-9. 128. Babio N SM, Bulló M, Basora J, Ibarrola-Jurado N, Fernández-Ballart J, Martínez-González MA, Serra-Majem L, González-Pérez R, Salas-Salvadó J; Nureta-PREDIMED Investigators. Association between red meat consumption and metabolic syndrome in a Mediterranean population at high cardiovascular risk: cross-sectional and 1-year follow-up assessment. Nutrition, metabolism, and cardiovascular diseases : NMCD. 2012;22:200-7. 129. Micha R, Wallace SK and Mozaffarian D. Red and processed meat consumption and risk of incident coronary heart disease, stroke, and diabetes mellitus: a systematic review and meta-analysis. Circulation. 2010;121:2271-83.

REFERENCES
108
130. Zhu H YX, Zhang C, Zhu C, Tao G, Zhao L, Tang S, Shu Z, Cai J, Dai S, Qin Q, Xu L, Cheng H, Sun X. Red and processed meat intake is associated with higher gastric cancer risk: a meta-analysis of epidemiological observational studies. PloS one. 2013;8:e70955. 131. Guo J, Wei W and Zhan L. Red and processed meat intake and risk of breast cancer: a meta-analysis of prospective studies. Breast Cancer Res Treat. 2015;151:191-8. 132. Abete I, Romaguera D, Vieira AR, Lopez de Munain A and Norat T. Association between total, processed, red and white meat consumption and all-cause, CVD and IHD mortality: a meta-analysis of cohort studies. The British journal of nutrition. 2014;112:762-75. 133. Larsson SC and Orsini N. Red meat and processed meat consumption and all-cause mortality: a meta-analysis. Am J Epidemiol. 2014;179:282-9. 134. Wang X, Lin X, Ouyang YY, Liu J, Zhao G, Pan A and Hu FB. Red and processed meat consumption and mortality: dose-response meta-analysis of prospective cohort studies. Public Health Nutr. 2015:1-13. 135. Micha R, Michas G and Mozaffarian D. Unprocessed red and processed meats and risk of coronary artery disease and type 2 diabetes--an updated review of the evidence. Curr Atheroscler Rep. 2012;14:515-24. 136. Fretts AM FJ, Nettleton JA, Lemaitre RN, Ngwa JS, Wojczynski MK, Kalafati IP, Varga TV, Frazier-Wood AC, Houston DK, Lahti J, Ericson U, van den Hooven EH, Mikkilä V, Kiefte-de Jong JC, Mozaffarian D, Rice K, Renström F, North KE, McKeown NM, Feitosa MF, Kanoni S,Smith CE, Garcia ME, Tiainen AM, Sonestedt E, Manichaikul A, van Rooij FJ, Dimitriou M, Raitakari O, Pankow JS, Djoussé L, Province MA, Hu FB, Lai CQ, Keller MF, Perälä MM, Rotter JI, Hofman A, Graff M, Kähönen M, Mukamal K, Johansson I, Ordovas JM, Liu Y,Männistö S, Uitterlinden AG, Deloukas P, Seppälä I, Psaty BM, Cupples LA, Borecki IB, Franks PW, Arnett DK, Nalls MA, Eriksson JG,Orho-Melander M, Franco OH, Lehtimäki T, Dedoussis GV, Meigs JB, Siscovick DS. Consumption of meat is associated with higher fasting glucose and insulin concentrations regardless of glucose and insulin genetic risk scores: a meta-analysis of 50,345 Caucasians. Am J Clin Nutr 2015;pii: ajcn101238. [Epub ahead of print]. 137. Ericson U, Sonestedt E, Gullberg B, Hellstrand S, Hindy G, Wirfalt E and Orho-Melander M. High intakes of protein and processed meat associate with increased incidence of type 2 diabetes. The British journal of nutrition. 2013;109:1143-53. 138. Fretts AM, Howard BV, McKnight B, Duncan GE, Beresford SA, Mete M, Eilat-Adar S, Zhang Y and Siscovick DS. Associations of processed meat and unprocessed red meat intake with incident diabetes: the Strong Heart Family Study. The American journal of clinical nutrition. 2012;95:752-8. 139. Lajous M TL, Fagherazzi G, de Lauzon-Guillain B, Boutron-Ruaualt MC, Clavel-Chapelon F. Processed and unprocessed red meat consumption and incident type 2 diabetes among French women. Diabetes care. 2012;35:128-30. 140. Kurotani K NA, Goto A, Mizoue T, Noda M, Oba S, Kato M, Matsushita Y, Inoue M, Tsugane S; Japan Public Health Center-based Prospective Study Group. Red meat consumption is associated with the risk of type 2 diabetes in men but not in women: a Japan Public Health Center-based Prospective Study. The British journal of nutrition. 2013;110:1910-8. 141. Gao D, Ning N, Wang C, Wang Y, Li Q, Meng Z, Liu Y and Li Q. Dairy products consumption and risk of type 2 diabetes: systematic review and dose-response meta-analysis. PloS one. 2013;8:e73965. 142. Aune D, Norat T, Romundstad P and Vatten LJ. Dairy products and the risk of type 2 diabetes: a systematic review and dose-response meta-analysis of cohort studies. The American journal of clinical nutrition. 2013;98:1066-83. 143. Tong X, Dong JY, Wu ZW, Li W and Qin LQ. Dairy consumption and risk of type 2 diabetes mellitus: a meta-analysis of cohort studies. Eur J Clin Nutr. 2011;65:1027-31. 144. Chen M, Sun Q, Giovannucci E, Mozaffarian D, Manson JE, Willett WC and Hu FB. Dairy consumption and risk of type 2 diabetes: 3 cohorts of US adults and an updated meta-analysis. BMC Med. 2014;12:215.

REFERENCES
109
145. Zhang M, Picard-Deland E and Marette A. Fish and marine omega-3 polyunsatured Fatty Acid consumption and incidence of type 2 diabetes: a systematic review and meta-analysis. International journal of endocrinology. 2013;2013:501015. 146. Xun P and He K. Fish Consumption and Incidence of Diabetes: meta-analysis of data from 438,000 individuals in 12 independent prospective cohorts with an average 11-year follow-up. Diabetes care. 2012;35:930-8. 147. Zhou Y, Tian C and Jia C. Association of fish and n-3 fatty acid intake with the risk of type 2 diabetes: a meta-analysis of prospective studies. The British journal of nutrition. 2012;108:408-17. 148. Wallin A, Di Giuseppe D, Orsini N, Patel PS, Forouhi NG and Wolk A. Fish consumption, dietary long-chain n-3 fatty acids, and risk of type 2 diabetes: systematic review and meta-analysis of prospective studies. Diabetes care. 2012;35:918-29. 149. Muley A, Muley P and Shah M. ALA, fatty fish or marine n-3 fatty acids for preventing DM?: a systematic review and meta-analysis. Current diabetes reviews. 2014;10:158-65. 150. Djousse L, Gaziano JM, Buring JE and Lee IM. Egg consumption and risk of type 2 diabetes in men and women. Diabetes care. 2009;32:295-300. 151. Djoussé L PA, Hickson DA, Talegawkar SA, Dubbert PM, Taylor H, Tucker KL. Egg consumption and risk of type 2 diabetes among African Americans: The Jackson Heart Study. Clin Nutr. 2015;pii: S0261-5614(15)00126-0. 152. Kurotani K, Nanri A, Goto A, Mizoue T, Noda M, Oba S, Sawada N, Tsugane S and Japan Public Health Center-based Prospective Study G. Cholesterol and egg intakes and the risk of type 2 diabetes: the Japan Public Health Center-based Prospective Study. The British journal of nutrition. 2014;112:1636-43. 153. Murphy KJ, Thomson RL, Coates AM, Buckley JD and Howe PR. Effects of eating fresh lean pork on cardiometabolic health parameters. Nutrients. 2012;4:711-23. 154. Drouin-Chartier JP, Gagnon J, Labonte ME, Desroches S, Charest A, Grenier G, Dodin S, Lemieux S, Couture P and Lamarche B. Impact of milk consumption on cardiometabolic risk in postmenopausal women with abdominal obesity. Nutr J. 2015;14:12. 155. Sayer RD WA, Chen N, Campbell WW. Dietary Approaches to Stop Hypertension diet retains effectiveness to reduce blood pressure when lean pork is substituted for chicken and fish as the predominant source of protein. The American journal of clinical nutrition. 2015;Jun 10. pii: ajcn111757. [Epub ahead of print]. 156. de Mello VD, Zelmanovitz T, Perassolo MS, Azevedo MJ and Gross JL. Withdrawal of red meat from the usual diet reduces albuminuria and improves serum fatty acid profile in type 2 diabetes patients with macroalbuminuria. The American journal of clinical nutrition. 2006;83:1032-8. 157. Turner KM, Keogh JB and Clifton PM. Red meat, dairy, and insulin sensitivity: a randomized crossover intervention study. The American journal of clinical nutrition. 2015;101:1173-9. 158. Hosseinpour-Niazi S, Mirmiran P, Hedayati M and Azizi F. Substitution of red meat with legumes in the therapeutic lifestyle change diet based on dietary advice improves cardiometabolic risk factors in overweight type 2 diabetes patients: a cross-over randomized clinical trial. Eur J Clin Nutr. 2015;69:592-7. 159. Kontessis PA, Bossinakou I, Sarika L, Iliopoulou E, Papantoniou A, Trevisan R, Roussi D, Stipsanelli K, Grigorakis S and Souvatzoglou A. Renal, metabolic, and hormonal responses to proteins of different origin in normotensive, nonproteinuric type I diabetic patients. Diabetes care. 1995;18:1233. 160. Chen ST, Ferng SH, Yang CS, Peng SJ, Lee HR and Chen JR. Variable effects of soy protein on plasma lipids in hyperlipidemic and normolipidemic hemodialysis patients. American journal of kidney diseases : the official journal of the National Kidney Foundation. 2005;46:1099-106. 161. van Nielen M, Feskens EJ, Rietman A, Siebelink E and Mensink M. Partly replacing meat protein with soy protein alters insulin resistance and blood lipids in postmenopausal women with abdominal obesity. The Journal of nutrition. 2014;144:1423-9.
REFERENCES
110
162. Chen M, Pan A, Malik VS and Hu FB. Effects of dairy intake on body weight and fat: a meta-analysis of randomized controlled trials. The American journal of clinical nutrition. 2012;96:735-47. 163. Abargouei AS, Janghorbani M, Salehi-Marzijarani M and Esmaillzadeh A. Effect of dairy consumption on weight and body composition in adults: a systematic review and meta-analysis of randomized controlled clinical trials. International journal of obesity. 2012;36:1485-93. 164. Murphy KJ, Parker B, Dyer KA, Davis CR, Coates AM, Buckley JD and Howe PR. A comparison of regular consumption of fresh lean pork, beef and chicken on body composition: a randomized cross-over trial. Nutrients. 2014;6:682-96. 165. Erkkilä AT SU, de Mello VD, Lappalainen T, Mussalo H, Lehto S, Kemi V, Lamberg-Allardt C, Uusitupa MI. Effects of fatty and lean fish intake on blood pressure in subjects with coronary heart disease using multiple medications. European journal of nutrition. 2008;47:319-28. 166. Vazquez C, Botella-Carretero JI, Corella D, Fiol M, Lage M, Lurbe E, Richart C, Fernandez-Real JM, Fuentes F, Ordonez A, de Cos AI, Salas-Salvado J, Burguera B, Estruch R, Ros E, Pastor O, Casanueva FF and Investigators W-CS. White fish reduces cardiovascular risk factors in patients with metabolic syndrome: the WISH-CARE study, a multicenter randomized clinical trial. Nutrition, metabolism, and cardiovascular diseases : NMCD. 2014;24:328-35. 167. Grieger JA, Miller MD and Cobiac L. Investigation of the effects of a high fish diet on inflammatory cytokines, blood pressure, and lipids in healthy older Australians. Food & nutrition research. 2014;58. 168. Roussell MA, Hill AM, Gaugler TL, West SG, Ulbrecht JS, Vanden Heuvel JP, Gillies PJ and Kris-Etherton PM. Effects of a DASH-like diet containing lean beef on vascular health. Journal of human hypertension. 2014;28:600-5. 169. Hodgson JM WN, Burke V, Beilin LJ, Puddey IB. Increased lean red meat intake does not elevate markers of oxidative stress and inflammation in humans. The Journal of nutrition. 2007;137:363-7. 170. Ley SH SQ, Willett WC, Eliassen AH, Wu K, Pan A, Grodstein F, Hu FB. Associations between red meat intake and biomarkers of inflammation and glucose metabolism in women. The American journal of clinical nutrition. 2014;99:352-60. 171. Cohen AE JC. Almond ingestion at mealtime reduces postprandial glycemia and chronic ingestion reduces hemoglobin A(1c) in individuals with well-controlled type 2 diabetes mellitus. Metabolism. 2011;60:1312-7. 172. Stephenson TJ, Setchell KD, Kendall CW, Jenkins DJ, Anderson JW and Fanti P. Effect of soy protein-rich diet on renal function in young adults with insulin-dependent diabetes mellitus. Clin Nephrol. 2005;64:1-11. 173. Gobert CP PE CS, Darlington GA, Lampe JW, Duncan AM. Soya protein does not affect glycaemic control in adults with type 2 diabetes. The British journal of nutrition. 2010;103:412-21. 174. Hermansen K SM, Høie L, Carstensen M, Brock B. Beneficial effects of a soy-based dietary supplement on lipid levels and cardiovascular risk markers in type 2 diabetic subjects. Diabetes care. 2001;24:228-33. 175. Miraghajani MS EA, Najafabadi MM, Mirlohi M, Azadbakht L. Soy milk consumption, inflammation, coagulation, and oxidative stress among type 2 diabetic patients with nephropathy. Diabetes care. 2012;35:1981-5. 176. Borodin EA, Menshikova IG, Dorovskikh VA, Feoktistova NA, Shtarberg MA, Yamamoto T, Takamatsu K, Mori H and Yamamoto S. Effects of two-month consumption of 30 g a day of soy protein isolate or skimmed curd protein on blood lipid concentration in Russian adults with hyperlipidemia. J Nutr Sci Vitaminol (Tokyo). 2009;55:492-7. 177. Chen ST, Chen JR, Yang CS, Peng SJ and Ferng SH. Effect of soya protein on serum lipid profile and lipoprotein concentrations in patients undergoing hypercholesterolaemic haemodialysis. The British journal of nutrition. 2006;95:366-71.

REFERENCES
111
178. Gardner CD, Messina M, Kiazand A, Morris JL and Franke AA. Effect of two types of soy milk and dairy milk on plasma lipids in hypercholesterolemic adults: a randomized trial. J Am Coll Nutr. 2007;26:669-77. 179. Weisse K, Brandsch C, Zernsdorf B, Nkengfack Nembongwe GS, Hofmann K, Eder K and Stangl GI. Lupin protein compared to casein lowers the LDL cholesterol:HDL cholesterol-ratio of hypercholesterolemic adults. European journal of nutrition. 2010;49:65-71. 180. West SG HK, Juturu V, Bordi PL, Lampe JW, Mousa SA, Kris-Etherton PM. Effects of including soy protein in a blood cholesterol-lowering diet on markers of cardiac risk in men and in postmenopausal women with and without hormone replacement therapy. J Womens Health (Larchmt). 2005;14:253-62. 181. Takahira M, Noda K, Fukushima M, Zhang B, Mitsutake R, Uehara Y, Ogawa M, Kakuma T and Saku K. Randomized, double-blind, controlled, comparative trial of formula food containing soy protein vs. milk protein in visceral fat obesity. -FLAVO study. Circ J. 2011;75:2235-43. 182. Liao FH, Shieh MJ, Yang SC, Lin SH and Chien YW. Effectiveness of a soy-based compared with a traditional low-calorie diet on weight loss and lipid levels in overweight adults. Nutrition. 2007;23:551-6. 183. Abete I, Parra D and Martinez JA. Legume-, fish-, or high-protein-based hypocaloric diets: effects on weight loss and mitochondrial oxidation in obese men. J Med Food. 2009;12:100-8. 184. Anderson JW, Fuller J, Patterson K, Blair R and Tabor A. Soy compared to casein meal replacement shakes with energy-restricted diets for obese women: randomized controlled trial. Metabolism. 2007;56:280-8. 185. Teixeira SR, Tappenden KA, Carson L, Jones R, Prabhudesai M, Marshall WP and Erdman JW, Jr. Isolated soy protein consumption reduces urinary albumin excretion and improves the serum lipid profile in men with type 2 diabetes mellitus and nephropathy. The Journal of nutrition. 2004;134:1874-80. 186. Azadbakht L EA. Soy-protein consumption and kidney-related biomarkers among type 2 diabetics: a crossover, randomized clinical trial. J Ren Nutr. 2009;19:479-86. 187. Hosseinpour-Niazi S, Mirmiran P, Fallah-Ghohroudi A and Azizi F. Non-soya legume-based therapeutic lifestyle change diet reduces inflammatory status in diabetic patients: a randomised cross-over clinical trial. The British journal of nutrition. 2015:1-7. 188. Collaboration TC. Cochrane Handbook for Systematic Reviews of Interventions Version 5.1.0 [updated March 2011]. 5.1.0 [updated March 2011] ed; 2011. 189. Moher D, Liberati A, Tetzlaff J, Altman DG and Group P. Preferred reporting items for systematic reviews and meta-analyses: the PRISMA statement. PLoS Med. 2009;6:e1000097. 190. Heyland DK NF DJ JM, Su X, Suchner U Should immunonutrition become routine in critically ill patients? A systematic review of the evidence. JAMA. 2001;286(8):944-53. 191. Elbourne DR, Altman DG, Higgins JP, Curtin F, Worthington HV and Vail A. Meta-analyses involving cross-over trials: methodological issues. Int J Epidemiol. 2002;31:140-9. 192. Anderson JW, Blake JE, Turner J and Smith BM. Effects of soy protein on renal function and proteinuria in patients with type 2 diabetes. The American journal of clinical nutrition. 1998;68:1347S-1353S. 193. Abd-Mishani M H-NS, Delshad H, Bahadori-Monfared A, Mirmiran P, Azizi F. Effect of modified diet on lipid profiles in type 2 diabetic patients. Iranian Journal of Endocrinology and Metabolism 2014;16 (2):103-10. 194. Herman WH and Wareham NJ. The diagnosis and classification of diabetes mellitus in nonpregnant adults. Prim Care. 1999;26:755-70. 195. Rajpathak SN, Crandall JP, Wylie-Rosett J, Kabat GC, Rohan TE and Hu FB. The role of iron in type 2 diabetes in humans. Biochim Biophys Acta. 2009;1790:671-81. 196. Hurrell R and Egli I. Iron bioavailability and dietary reference values. The American journal of clinical nutrition. 2010;91:1461S-1467S. 197. Bao W, Rong Y, Rong S and Liu L. Dietary iron intake, body iron stores, and the risk of type 2 diabetes: a systematic review and meta-analysis. BMC Med. 2012;10:119.

REFERENCES
112
198. Lee DH, Folsom AR and Jacobs DR, Jr. Dietary iron intake and Type 2 diabetes incidence in postmenopausal women: the Iowa Women's Health Study. Diabetologia. 2004;47:185-94. 199. Fleming DJ, Jacques PF, Dallal GE, Tucker KL, Wilson PW and Wood RJ. Dietary determinants of iron stores in a free-living elderly population: The Framingham Heart Study. The American journal of clinical nutrition. 1998;67:722-33. 200. Liu JM HS, Stampfer MJ, Rifai N, Willett WC, Ma J. Body iron stores and their determinants in healthy postmenopausal US women. The American journal of clinical nutrition. 2003;78:1160-7. 201. Barnard ND, Katcher HI, Jenkins DJ, Cohen J and Turner-McGrievy G. Vegetarian and vegan diets in type 2 diabetes management. Nutr Rev. 2009;67:255-63. 202. Fumeron F PF, Driss F, Balkau B, Tichet J, Marre M, Grandchamp B; Insulin Resistance Syndrome (DESIR) Study Group. Ferritin and transferrin are both predictive of the onset of hyperglycemia in men and women over 3 years: the data from an epidemiological study on the Insulin Resistance Syndrome (DESIR) study. Diabetes care. 2006;29:2090-4. 203. Jiang R, Manson JE, Meigs JB, Ma J, Rifai N and Hu FB. Body iron stores in relation to risk of type 2 diabetes in apparently healthy women. JAMA. 2004;291:711-7. 204. Jehn M, Clark JM and Guallar E. Serum ferritin and risk of the metabolic syndrome in U.S. adults. Diabetes care. 2004;27:2422-8. 205. Tsimihodimos V, Gazi I, Kalaitzidis R, Elisaf M and Siamopoulos KC. Increased serum ferritin concentrations and liver enzyme activities in patients with metabolic syndrome. Metab Syndr Relat Disord. 2006;4:196-203. 206. Houschyar KS, Ludtke R, Dobos GJ, Kalus U, Broecker-Preuss M, Rampp T, Brinkhaus B and Michalsen A. Effects of phlebotomy-induced reduction of body iron stores on metabolic syndrome: results from a randomized clinical trial. BMC Med. 2012;10:54. 207. Fernandez-Real JM, Penarroja G, Castro A, Garcia-Bragado F, Hernandez-Aguado I and Ricart W. Blood letting in high-ferritin type 2 diabetes: effects on insulin sensitivity and beta-cell function. Diabetes. 2002;51:1000-4. 208. Lucotti P, Setola E, Monti LD, Galluccio E, Costa S, Sandoli EP, Fermo I, Rabaiotti G, Gatti R and Piatti P. Beneficial effects of a long-term oral L-arginine treatment added to a hypocaloric diet and exercise training program in obese, insulin-resistant type 2 diabetic patients. Am J Physiol Endocrinol Metab. 2006;291:E906-12. 209. Piatti PM, Monti LD, Valsecchi G, Magni F, Setola E, Marchesi F, Galli-Kienle M, Pozza G and Alberti KG. Long-term oral L-arginine administration improves peripheral and hepatic insulin sensitivity in type 2 diabetic patients. Diabetes care. 2001;24:875-80. 210. Charles S HJ. Distinct effects of various amino acids on 45Ca2+ fluxes in rat pancreatic islets. Biochem J. 1983;214(3):899-907. 211. Henquin JC and Meissner HP. Effects of amino acids on membrane potential and 86Rb+ fluxes in pancreatic beta-cells. Am J Physiol. 1981;240:E245-52. 212. Herchuelz A LP BA, Malaisse WJ. Mechanism of arginine-stimulated Ca2+ influx into pancreatic B cell. Am J Physiol Endocrinol Metab. 1984;246 E38 –E43. 213. Newsholme P BL BK. Amino Acid Metabolism, β-Cell Function, and Diabetes. Diabetes 2006;55:S39-S47. 214. Sener A BL YA, Kadiata MM, Olivares E, Louchami K, Jijakli H, Ladrière L, Malaisse WJ. Stimulus-secretion coupling of arginine-induced insulin release: comparison between the cationic amino acid and its methyl ester. Endocrine. 2000;13:329-40. 215. Matsuda M DR. Insulin sensitivity indices obtained from oral glucose tolerance testing: comparison with the euglycemic insulin clamp. Diabetes Care 1999;22(9):1462–70. 216. Thomas DE EE. The use of low-glycaemic index diets in diabetes control. The British journal of nutrition. 2010;104:797-802.

REFERENCES
113
217. Wang Q XW ZZ, Zhang H. Effects comparison between low glycemic index diets and high glycemic index diets on HbA1c and fructosamine for patients with diabetes: A systematic review and meta-analysis. Prim Care Diabetes. 2014:pii: S1751-9918(14)00127-2. d. 218. Pereira EC, Ferderbar S, Bertolami MC, Faludi AA, Monte O, Xavier HT, Pereira TV and Abdalla DS. Biomarkers of oxidative stress and endothelial dysfunction in glucose intolerance and diabetes mellitus. Clin Biochem. 2008;41:1454-60. 219. Tong M, Neusner A, Longato L, Lawton M, Wands JR and de la Monte SM. Nitrosamine exposure causes insulin resistance diseases: relevance to type 2 diabetes mellitus, non-alcoholic steatohepatitis, and Alzheimer's disease. J Alzheimers Dis. 2009;17:827-44. 220. Saudek CD DR, Kalyani RR. Assessing Glycemia in Diabetes Using Self-monitoring Blood Glucose and Hemoglobin A1c. JAMA. 2006;295:1688-97. 221. Center for Drug Evaluation and Research. Guidance for Industry: Diabetes Mellitus: Developing Drugs and Therapeutic Biologics for Treatment and Prevention (DRAFT GUIDANCE). Rockville, Md, U.S. Department of Health and Human Services Food and Drug Administration, 2008, p. 1–30 222. Jenkins DJ KC, Banach MS, Srichaikul K, Vidgen E, Mitchell S, Parker T, Nishi S, Bashyam B, de Souza R, Ireland C, Josse RG. Nuts as a replacement for carbohydrates in the diabetic diet. Diabetes care. 2011;34:1706-11. 223. Jenkins DJ, Kendall CW, Vuksan V, Faulkner D, Augustin LS, Mitchell S, Ireland C, Srichaikul K, Mirrahimi A, Chiavaroli L, Blanco Mejia S, Nishi S, Sahye-Pudaruth S, Patel D, Bashyam B, Vidgen E, de Souza RJ, Sievenpiper JL, Coveney J, Josse RG and Leiter LA. Effect of lowering the glycemic load with canola oil on glycemic control and cardiovascular risk factors: a randomized controlled trial. Diabetes care. 2014;37:1806-14. 224. Jenkins DJ, Kendall CW, McKeown-Eyssen G, Josse RG, Silverberg J, Booth GL, Vidgen E, Josse AR, Nguyen TH, Corrigan S, Banach MS, Ares S, Mitchell S, Emam A, Augustin LS, Parker TL and Leiter LA. Effect of a low-glycemic index or a high-cereal fiber diet on type 2 diabetes: a randomized trial. JAMA. 2008;300:2742-53. 225. US Department of Agriculture. Composition of Foods, Agriculture Handbook No. 8: The Agriculture Research Service. Washington, DC: US Dept of Argiculture; 1992. 226. Atkinson FS, Foster-Powell K and Brand-Miller JC. International tables of glycemic index and glycemic load values: 2008. Diabetes care. 2008;31:2281-3. 227. International Standards Organisation. ISO 26642-2010: Food Products: Determination of the Glycaemic Index (GI) and Recommendation for Food Classification. Geneva, Switzerland: International Standards Organisation; 2010. 228. Willett W. Nutritional epidemiology. 3rd ed. New York, NY: Oxford University Press, 2013. 229. Bhupathiraju SN, Tobias DK, Malik VS, Pan A, Hruby A, Manson JE, Willett WC and Hu FB. Glycemic index, glycemic load, and risk of type 2 diabetes: results from 3 large US cohorts and an updated meta-analysis. The American journal of clinical nutrition. 2014;100:218-32. 230. Dong JY, Zhang L, Zhang YH and Qin LQ. Dietary glycaemic index and glycaemic load in relation to the risk of type 2 diabetes: a meta-analysis of prospective cohort studies. The British journal of nutrition. 2011;106:1649-54. 231. Greenwood DC, Threapleton DE, Evans CE, Cleghorn CL, Nykjaer C, Woodhead C and Burley VJ. Glycemic index, glycemic load, carbohydrates, and type 2 diabetes: systematic review and dose-response meta-analysis of prospective studies. Diabetes care. 2013;36:4166-71. 232. Poslusna K, Ruprich J, de Vries JH, Jakubikova M and van't Veer P. Misreporting of energy and micronutrient intake estimated by food records and 24 hour recalls, control and adjustment methods in practice. The British journal of nutrition. 2009;101 Suppl 2:S73-85. 233. Gibson RS (2005) Principles of Nutritional Assessment, 2nd ed., pp. 908. New York: Oxford University Press.
REFERENCES
114
234. Wang ML GL, Nathanson BH, Pbert L, Ma Y, Ockene I, Rosal MC. Decrease in Glycemic Index Associated with Improved Glycemic Control among Latinos with Type 2 Diabetes. J Acad Nutr Diet. 2015;115:898-906. 235. Li D ZP, Guo H, Ling W. Taking a low glycemic index multi-nutrient supplement as breakfast improves glycemic control in patients with type 2 diabetes mellitus: a randomized controlled trial. Nutrients. 2014;6:5740-55. 236. Orban E, Schwab S, Thorand B and Huth C. Association of iron indices and type 2 diabetes: a meta-analysis of observational studies. Diabetes Metab Res Rev. 2014;30:372-94. 237. HJ CS. Distinct effects of various amino acids on 45Ca2+ fluxes in rat pancreatic islets. Biochem J. 1983;214:899-907. 238. DR MM. Insulin sensitivity indices obtained from oral glucose tolerance testing: comparison with the euglycemic insulin clamp. Diabetes care. 1999;22:1462–70. 239. USDA Nutrient Database. Available from: http://www.nal.usda.gov/fnic/foodcomp. Accessed March 4 2014. 240. Ranawana V and Kaur B. Role of proteins in insulin secretion and glycemic control. Adv Food Nutr Res. 2013;70:1-47. 241. Lovejoy JC. The influence of dietary fat on insulin resistance. Curr Diab Rep. 2002;2:435-40. 242. Xiao C, Giacca A, Carpentier A and Lewis GF. Differential effects of monounsaturated, polyunsaturated and saturated fat ingestion on glucose-stimulated insulin secretion, sensitivity and clearance in overweight and obese, non-diabetic humans. Diabetologia. 2006;49:1371-9. 243. Vessby B, Uusitupa M, Hermansen K, Riccardi G, Rivellese AA, Tapsell LC, Nalsen C, Berglund L, Louheranta A, Rasmussen BM, Calvert GD, Maffetone A, Pedersen E, Gustafsson IB, Storlien LH and Study K. Substituting dietary saturated for monounsaturated fat impairs insulin sensitivity in healthy men and women: The KANWU Study. Diabetologia. 2001;44:312-9. 244. Peppa M, Goldberg T, Cai W, Rayfield E and Vlassara H. Glycotoxins: a missing link in the "relationship of dietary fat and meat intake in relation to risk of type 2 diabetes in men". Diabetes care. 2002;25:1898-9. 245. Talaei M and Pan A. Role of phytoestrogens in prevention and management of type 2 diabetes. World journal of diabetes. 2015;6:271-83. 246. Gilbert ER LD. Anti-diabetic functions of soy isoflavone genistein: mechanisms underlying its effects on pancreatic β-cell function. Food Funct. 2013;4:200-12. 247. Chandalia M, Garg A, Lutjohann D, von Bergmann K, Grundy SM and Brinkley LJ. Beneficial effects of high dietary fiber intake in patients with type 2 diabetes mellitus. The New England journal of medicine. 2000;342:1392-8. 248. Schulze MB, Schulz M, Heidemann C, Schienkiewitz A, Hoffmann K and Boeing H. Fiber and magnesium intake and incidence of type 2 diabetes: a prospective study and meta-analysis. Arch Intern Med. 2007;167:956-65. 249. Jenkins DJ, Wolever TM, Leeds AR, Gassull MA, Haisman P, Dilawari J, Goff DV, Metz GL and Alberti KG. Dietary fibres, fibre analogues, and glucose tolerance: importance of viscosity. Br Med J. 1978;1:1392-4. 250. Weickert MO and Pfeiffer AF. Metabolic effects of dietary fiber consumption and prevention of diabetes. The Journal of nutrition. 2008;138:439-42. 251. Berkow SE and Barnard N. Vegetarian diets and weight status. Nutr Rev. 2006;64:175-88. 252. Bujnowski D XP, Daviglus ML, Van Horn L, He K, Stamler J. Longitudinal association between animal and vegetable protein intake and obesity among men in the United States: the Chicago Western Electric Study. Journal of the American Dietetic Association. 2011;111:1150-1155. 253. Montonen J, Boeing H, Fritsche A, Schleicher E, Joost HG, Schulze MB, Steffen A and Pischon T. Consumption of red meat and whole-grain bread in relation to biomarkers of obesity, inflammation, glucose metabolism and oxidative stress. European journal of nutrition. 2013;52:337-45.

REFERENCES
115
254. Kahleova H MM, Malinska H, Oliyarnik O, Kazdova L, Neskudla T, Skoch A, Hajek M, Hill M, Kahle M, Pelikanova T. Vegetarian diet improves insulin resistance and oxidative stress markers more than conventional diet in subjects with type 2 diabetes. Diabet Med. 2011;28:549-59. 255. Hamdy O PS, Al-Ozairi E. Metabolic obesity: the paradox between visceral and subcutaneous fat. Current diabetes reviews. 2006;2:367-73. 256. Barnard ND, Scialli AR, Turner-McGrievy G, Lanou AJ and Glass J. The effects of a low-fat, plant-based dietary intervention on body weight, metabolism, and insulin sensitivity. Am J Med. 2005;118:991-7. 257. Goff LM, Bell JD, So PW, Dornhorst A and Frost GS. Veganism and its relationship with insulin resistance and intramyocellular lipid. Eur J Clin Nutr. 2005;59:291-8. 258. Sievenpiper JL and Dworatzek PD. Food and dietary pattern-based recommendations: an emerging approach to clinical practice guidelines for nutrition therapy in diabetes. Canadian journal of diabetes. 2013;37:51-7. 259. Lee V, McKay T and Ardern CI. Awareness and perception of plant-based diets for the treatment and management of type 2 diabetes in a community education clinic: a pilot study. Journal of nutrition and metabolism. 2015;2015:236234.