effects of renal disease on pharmacokinetics · goals of effects of renal disease on...
TRANSCRIPT

1
Effects of Renal Disease on Pharmacokinetics
Juan J. L. Lertora, M.D., Ph.D.
Director
Clinical Pharmacology Program
October 9, 2014
Office of Clinical Research Training
and Medical Education
National Institutes of Health
Clinical Center
2
GOALS of Effects of Renal Disease on Pharmacokinetics Lecture
A. Dose Adjustment in patients with
renal Impairment
B. Effect of Renal Disease on:
Renal Drug Elimination
Hepatic Drug Metabolism
Drug Transporters
Drug Distribution
Drug Absorption

3
Drug Disposition in Kidney Disease
Therapeutics in Kidney Disease
Challenges, Innovations, Opportunities
Supplement to
The Journal of Clinical Pharmacology
January 2012 – Volume 52 – Suppl. 1

4
Drug Disposition in Kidney Disease
Nephropharmacology
Clinical Pharmacology & Therapeutics
November 2009 – Volume 86, No.5

5
Pharmacokinetics in Renal Disease
Dose Adjustments in Patients with Renal
Impairment: Statement of the Problem
How is renal function assessed?
How is drug dose adjusted based on this
assessment?

6
PATHOPHYSIOLOGIC FACTORS NOT ACCOUNTED FOR IN DRUG DOSING*
* Lesar TS, Briceland L, Stein DS. JAMA 1997;277:312-7.
ADVANCED AGE
42%
OTHER
6%
PATIENT
WEIGHT
19%
RENAL
IMPAIRMENT
33%

7
Central Role of DRUG LABEL
The DRUG LABEL is the primary source of
drug prescribing information and is reviewed
by the FDA as part of the drug approval
process.
As such the drug label is a distillate of the
entire drug development process.

8
INFORMATION CONTENT OF DRUG LABELS*
CORE INFORMATION
CATEGORY
Inclusion of Desirable
Data Elements
MEAN (95% CI)
MECHANISM OF ACTION 88% (84% - 93%)
PHARMACODYNAMICS 43% (37% - 49%)
DRUG METABOLISM 23% (16% - 29%)
PHARMACOKINETICS 42% (35% - 49%)
DOSE ADJUSTMENT 37% (32% - 42%)
* Spyker DA, et al. Clin Pharmacol Ther 2000;67:196-200.

9
“Renal Dosing” Data in NDAs
• FDA survey of NDAs (2003-2007)
57% of NDAs included data from studies in
patients with renal impairment.
44% of those with renal data included
hemodialysis information.
41% of those with renal data included
dose adjustment recommendations.
Zhang Y, et al, Clin Pharmacol Ther 2009; 85:305-311

10
FDA GUIDANCE FOR INDUSTRY
PHARMACOKINETICS IN PATIENTS WITH
IMPAIRED RENAL FUNCTION – Study Design,
Data Analysis, and Impact on Dosing and
Labeling (1998) – Revision 1 (2010-Draft)
AVAILABLE AT:
http://www.fda.gov/cder/guidance/index.htm

11
Pharmacokinetics in Renal Disease
• DOSE ADJUSTMENT in Patients with Renal
Impairment
- Statement of the Problem
- How is renal function assessed?
- How is drug dose adjusted based on this
assessment?

12
RENAL CLEARANCE EQUATION
P
Vx UCL
U = URINE CONCENTRATION
V = URINE VOLUME / TIME
P = PLASMA CONCENTRATION

13
COCKCROFT & GAULT EQUATION*
women]for 15% by estimate [reduce
mg/dL) inCr (serum 72
kg) in(weight age) - (140CLCr
* Cockroft DW, Gault MH: Nephron 1976;16:31-41.

14
COCKCROFT & GAULT EQUATION
Terms in red estimate creatinine synthesis rate.
(140 - age) (weight in kg) CLCr = ———————— 72 (serum Cr in mg/dL)
[reduce estimate by 15% for women]
P
ICLCr

15
CLEARANCE TECHNIQUES FOR ASSESSING RENAL FUNCTION
GLOMERULAR FILTRATION:
Normal: 120 – 130 mL/min/1.73 m2
CLEARANCE MARKERS:
Inulin
Creatinine
125I-Iothalamate
RENAL BLOOD FLOW:
Normal: ♂ 1,209 ± 256 mL/min/1.73 m2
♀ 982 ± 184 mL/min/1.73 m2
CLEARANCE MARKER:
Para-Aminohippuric Acid

16
Pharmacokinetics in Renal Disease
• EFFECT OF RENAL DISEASE ON RENAL
DRUG ELIMINATION
- MECHANISMS OF RENAL DRUG ELIMINATION
- CONCEPT OF RESTRICTIVE VS.
NONRESTRICTIVE ELIMINATION

17
MECHANISMS of Renal Drug Elimination
Glomerular Filtration
Renal Tubular Secretion
Reabsorption by Non-Ionic Diffusion
Active Reabsorption
18
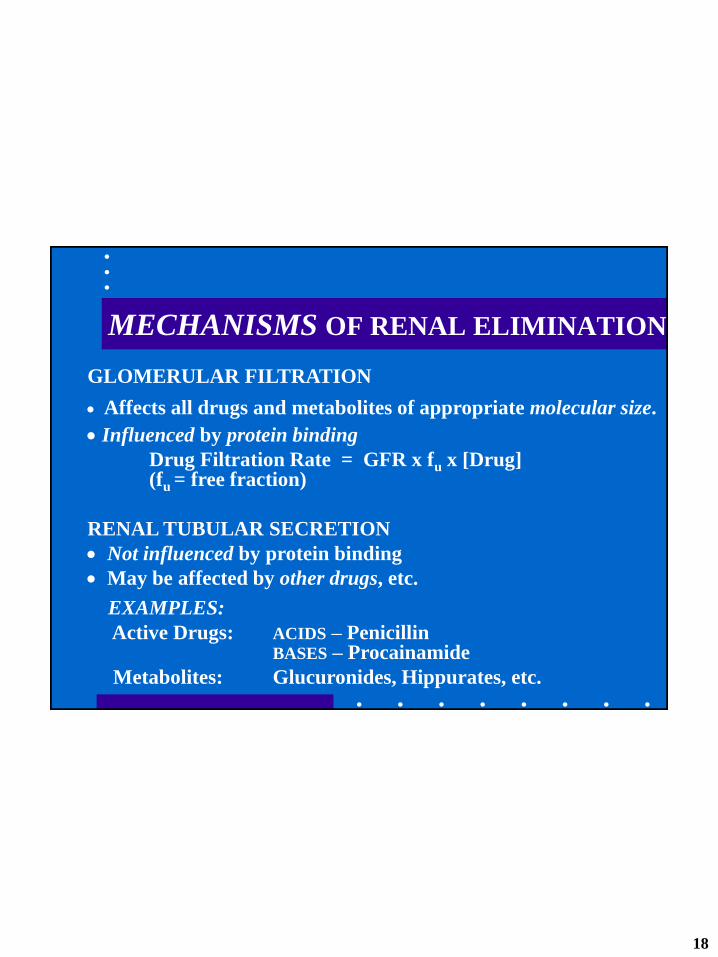
MECHANISMS OF RENAL ELIMINATION
GLOMERULAR FILTRATION
Affects all drugs and metabolites of appropriate molecular size.
Influenced by protein binding
Drug Filtration Rate = GFR x fu x [Drug] (fu = free fraction)
RENAL TUBULAR SECRETION
Not influenced by protein binding
May be affected by other drugs, etc.
EXAMPLES:
Active Drugs: ACIDS – Penicillin BASES – Procainamide
Metabolites: Glucuronides, Hippurates, etc.

19
RESTRICTIVE VS. NONRESTRICTIVE ELIMINATION
RESTRICTIVE:
Clearance DEPENDS on Protein Binding.
KIDNEY: Drug Filtration Rate = fU GFR
LIVER: CL = fU Clint
NONRESTRICTIVE:
Clearance INDEPENDENT of Protein Binding
KIDNEY: CL = Q (renal blood flow)
EXAMPLE: PARA-AMINOHIPPURATE CLEARANCE
MEASURES RENAL BLOOD FLOW.

20
INTRINSIC CLEARANCE
INTRINSIC CLEARANCE IS THE
ELIMINATION CLEARANCE THAT
WOULD BE OBSERVED IN THE
ABSENCE OF ANY PROTEIN BINDING
RESTRICTIONS.

21
RESTRICTIVE VS. NONRESTRICTIVE ELIMINATION
RESTRICTIVE:
Clearance DEPENDS on Protein Binding
KIDNEY: Drug Filtration Rate = fU GFR
LIVER: CL = fU Clint
NONRESTRICTIVE:
Clearance INDEPENDENT of Protein Binding
KIDNEY: CL = Q (renal blood flow)
LIVER: CL = Q (hepatic blood flow)

22
Renal REABSORPTION Mechanisms
REABSORPTION BY NON-IONIC DIFFUSION
Affects weak acids and weak bases.
Only important if excretion of free drug is major
elimination pathway.
EXAMPLES: Weak Acids: PHENOBARBITAL Weak Bases: QUINIDINE
ACTIVE REABSORPTION
Affects ions, not proved for other drugs.
EXAMPLES: Halides: FLUORIDE, BROMIDE Alkaline Metals: LITHIUM

23
GFR Estimating Equations
Stevens LA, et al.
Advances in GFR-estimating equations
Curr Opin Nephrol Hypertens 2010;19:298-307
Schwartz GJ, et al.
New equations to estimate GFR in children with
CKD
J Am Soc Nephrol 2009;20:629-637

24
Assessment of Renal Function
In adults with stable renal function:
Cockcroft and Gault equation (estimates creatinine clearance).
Modification of Diet in Renal Disease
(MDRD) Study equation (estimates GFR).
CKD-Epidemiology Collaboration Equation (estimates GFR).

25
Assessment of Renal Function
• Cockcroft-Gault equation:
• Creatinine Clearance: ml/min
• MDRD Study equation:
• eGFR: ml/min/1.73 meter square*
*Numeric value for GFR<60 ml/min/m2

26
Estimation of GFR - MDRD • The MDRD equation* estimates GFR from serum
creatinine and is more accurate in reference to the (125)I-iothalamate standard.
• Based on CKD population, using standardized creatinine assays* (traceable to IDMS reference measurement) that reduce variability between laboratories.
• However, it tends to underestimate high GFRs and may also overestimates low GFRs.
*MDRD 4 parameter equation
Levey AS et al. Ann Intern Med. 2006;145:247-254
Lalonde RL, Wagner JA. Clin Pharmacol Ther 2009;86:557-561

27
Estimation of GFR–CKD-EPI
• The CKD-Epidemiology Collaboration
proposed a new equation: CKD-EPI
(same variables as the 4 parameter
MDRD).
• Accurate at GFR > 60 ml/min/1.73m2
• Normal and CKD subject population
Levey et al. Ann Intern Med 2009;150:604-12

28
Renal Clearance of Drugs
• Generally, there is a linear
correlation between the clearance of
creatinine and the clearance of drugs
excreted via the kidneys.
• We take advantage of this correlation
when making dose adjustments in
patients with impaired renal function.

29
STEADY STATE CONCENTRATION
E
SS CL
IC
Continuous Infusion:
Intermittent Dosing:
E
SS CL
τDOSEC

30
Professor
Luzius Dettli
Clin. Pharmacol.
Ther. Nov 2009
Focus: Nephro-
pharmacology

31
ADDITIVITY OF CLEARANCES
NRRE CLCLCL
CLR = RENAL CLEARANCE
CLNR = NON-RENAL CLEARANCE

32
Dettli Approach*
NRRE CLCLCL
CrR CLαCL
NEED: 1. CLE IN NORMAL SUBJECTS
2. NORMAL % RENAL EXCRETION
* Dettli L. Med Clin North Am 1974;58:977-85

33
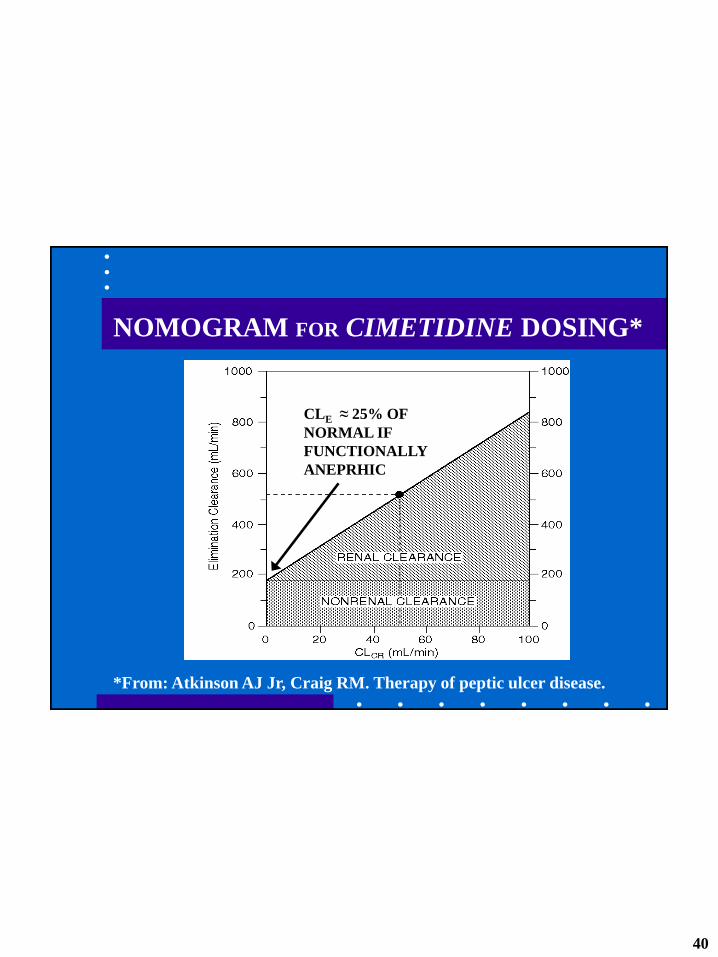
NOMOGRAM FOR CIMETIDINE DOSING*
*From: Atkinson AJ Jr, Craig RM. Therapy of peptic ulcer disease.

34
RENAL EXCRETION OF DRUGS
• Regardless of mechanism, renal drug elimination
declines in parallel with decreases in GFR.
• Therefore, CLCr can be used to assess impact of
renal impairment on renal excretion of drugs.
INTACT NEPHRON HYPOTHESIS: Provides a
basis for dose adjustment when renal excretion of
drug is impaired.
WHAT ABOUT OTHER EXCRETION ROUTES?

35
Key ASSUMPTIONS of Dettli Method
• CLNR remains CONSTANT when renal
function is impaired.
• CLR declines in LINEAR FASHION with CLCR
- Intact Nephron Hypothesis
- Some drugs ↓ SECRETION > GFR
with aging*
* Reidenberg MM, et al. Clin Pharmacol Ther 1980;28:732-5.

36
CIMETIDINE Case History
A 67-year-old veteran had been functionally
anephric, requiring outpatient hemodialysis
for several years. He was hospitalized for
revision of his arteriovenous shunt and
postoperatively complained of symptoms of
gastroesophageal reflux. This complaint
prompted institution of cimetidine therapy in
a dose of 300 mg every 6 hours.

37
CIMETIDINE Case History (cont.)
Rationale for Prescribed Cimetidine Dose:
At that time, 600 mg every 6 hours was the
usual cimetidine dose for patients with
normal renal function and the Physician’s
Desk Reference recommended halving the
cimetidine dose for patients “with
creatinine clearance less than 30 ml/min”.

38
CIMETIDINE Case History (cont.)
Three days later the patient was noted to be
confused. The nephrology team reevaluated
the patient and agreed to discontinue
cimetidine as suggested by the attending
internist/clinical pharmacologist. Two days
later the patient was alert and was
discharged from the hospital to resume
outpatient hemodialysis therapy.

39
LABELING FOR CIMETIDINE*
• DOSAGE ADJUSTMENT
1/2 normal dose if CLCr < 30 mL/min
• PHARMACOKINETICS
Following I.V. or I.M. administration in normal
subjects,
~ 75% of drug is recovered from the urine as
parent compound.
* Physician’s Desk Reference. 58th edition, 2004.
40
NOMOGRAM FOR CIMETIDINE DOSING*
*From: Atkinson AJ Jr, Craig RM. Therapy of peptic ulcer disease.
CLE ≈ 25% OF
NORMAL IF
FUNCTIONALLY
ANEPRHIC

41
DOSE ADJUSTMENT OPTIONS FOR PATIENTS WITH RENAL IMPAIRMENT
• MAINTAIN USUAL DOSING INTERVAL BUT
REDUCE DOSE IN PROPORTION TO ↓CLE
• MAINTAIN USUAL DOSE BUT INCREASE
DOSING INTERVAL IN PROPORTION TO ↓CLE
• ADJUST BOTH DOSE AND DOSING INTERVAL
E
SS CL
τDOSEC
42
Pharmacokinetics in Renal Disease
• EFFECT OF RENAL DISEASE ON DRUG
METABOLISM and TRANSPORT

43
CRF – Effects on Drug
Metabolism and Transport
TD Nolin, J Naud, FA Leblond, V Pichette
Emerging Evidence of the Impact of
Kidney Disease on Drug Metabolism
and Transport
Clin. Pharmacol. Ther. 2008;83:898-903

44
CRF – Effects on Drug
Metabolism and Transport
AW Dreisbach
The influence of chronic renal failure
on drug metabolism and transport.
Clin. Pharmacol. Ther. 2009;86:553-556

45
Effect of CRF on Non-Renal
Drug Clearance in Humans
CLNR (%) Enzyme
Captopril - 50 TPMT
Morphine - 40 UGT2B7
Procainamide - 60 NAT-2
Verapamil - 54 CYP3A4
Metoclopramide - 66 CYP2D6
Warfarin - 50 CYP2C9
46
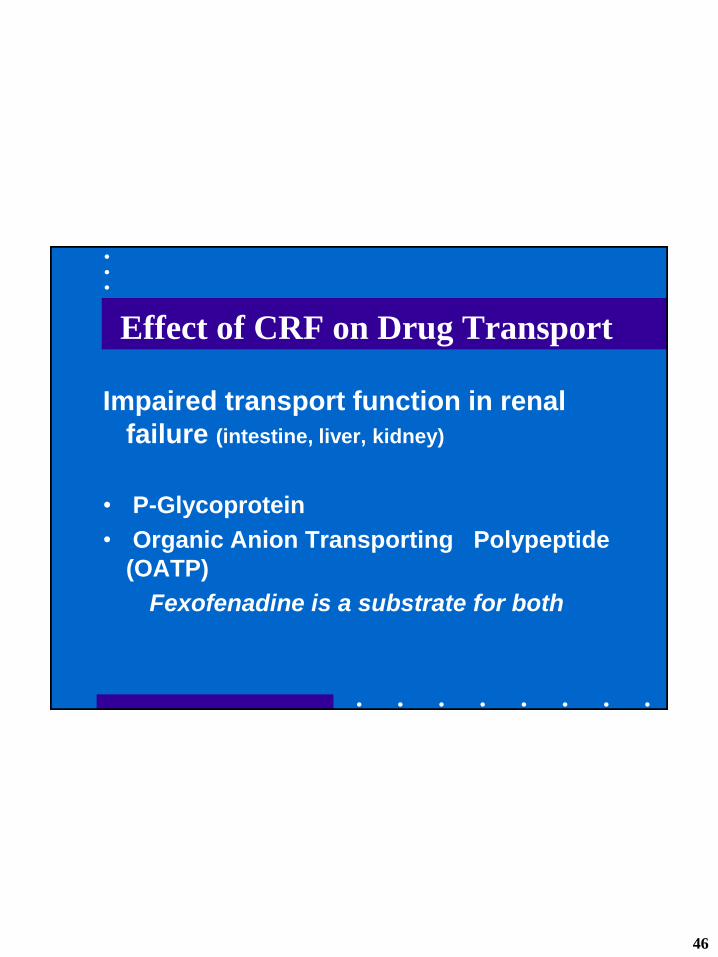
Effect of CRF on Drug Transport
Impaired transport function in renal
failure (intestine, liver, kidney)
• P-Glycoprotein
• Organic Anion Transporting Polypeptide
(OATP)
Fexofenadine is a substrate for both

47
Effect of CRF on Bioavailability
Studies in human subjects:
Propranolol +300 % CYP2D6
Erythromycin +100 % CYP3A4
Propoxyphene +100 % CYP3A4
Dyhydrocodeine +70 % CYP2D6

48
Effects of Uremic Toxins
Indoxyl sulfate
CMPF-propanoic acid
Parathyroid hormone (PTH)
Cytokines (chronic inflammation)
Inhibition of drug metabolism and
transport reversed by hemodialysis

49
Effects of Hemodialysis
Advanced CRF:
Stage IV (GFR 15-29 ml/min)
Stage V (GFR 0-15 ml/min)
Hemodialysis may reverse the
inhibition of drug metabolizing
enzymes and transporters
50
N
NO
OH
H
N
NO
OH
H OH
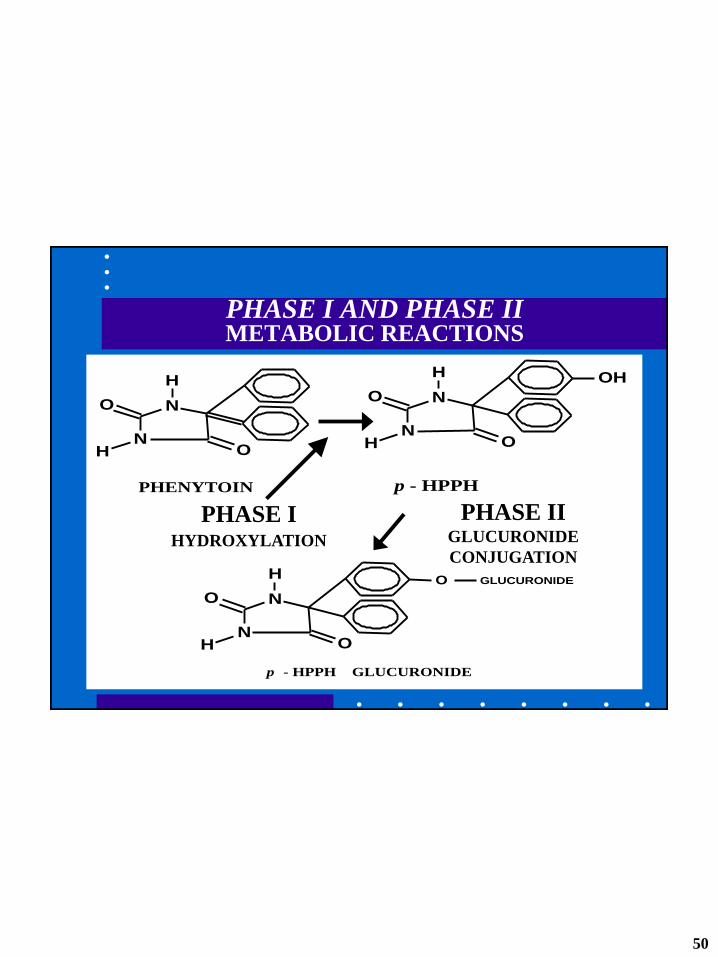
PHENYTOIN p - HPPH
N
NO
OH
H O GLUCURONIDE
p - HPPH GLUCURONIDE
PHASE I AND PHASE II METABOLIC REACTIONS
PHASE II GLUCURONIDE
CONJUGATION
PHASE I HYDROXYLATION

51
GOALS of Renal Disease Effects Lecture
• Effect of Renal Disease on
DRUG METABOLISM
• EXAMPLES:
PROCAINAMIDE - Acetylation
PHENYTOIN - Hydroxylation

52
PROCAINAMIDE ACETYLATION
RENAL
ELIMINATON
NORMALLY 50% NAT2: FAST VS. SLOW

53
Procainamide Kinetics in DIALYSIS PATIENTS*
* From: Gibson TP. Kidney Int 1977;12:422-9.
FUNCTIONALLY NORMALS ANEPHRIC PATIENTS
Fast Slow Fast Slow
T1/2 (hr) 2.6 3.5 12.2 17.0
CLE (L/kg) 809 600 118 94
CLR (L/kg) 426 357 0 0
CLNR (L/kg) 383 243 118 94
Vd(ss) (L/kg) 1.95 1.93 1.41 1.93

54
Procainamide Dosing Nomogram (FAST ACETYLATORS)
0
100
200
300
400
500
600
700
800
900
0 10 20 30 40 50 60 70 80 90 100
CLCr [mL/min]
PA
CL
EA
RA
NC
E [
mL
/min
]
CLNR
CLE = CLR + CLNR
55
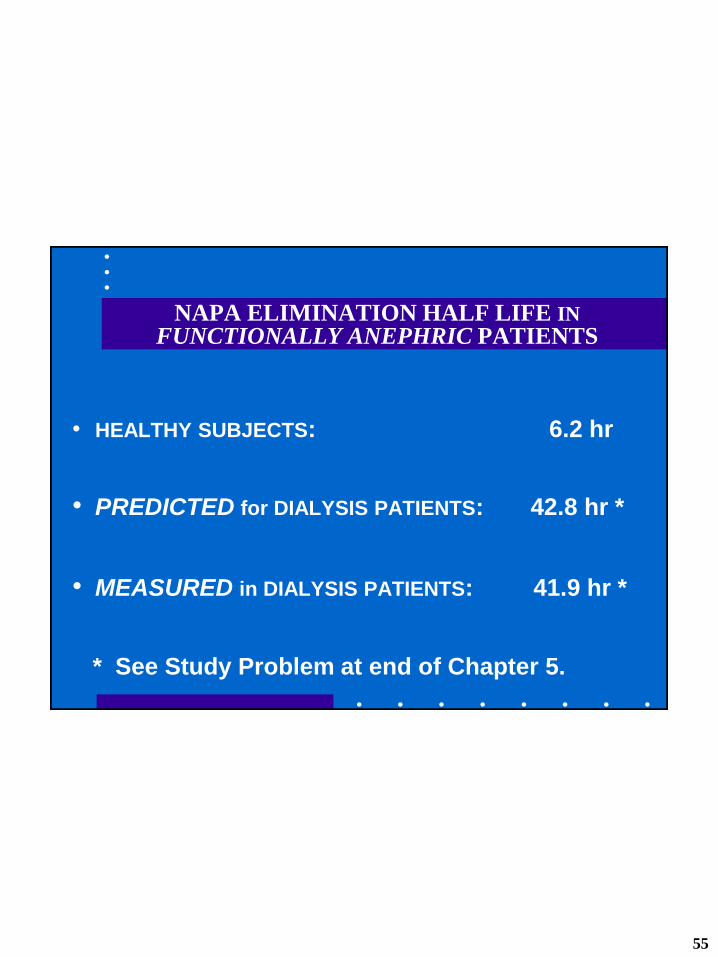
NAPA ELIMINATION HALF LIFE IN
FUNCTIONALLY ANEPHRIC PATIENTS
• HEALTHY SUBJECTS: 6.2 hr
• PREDICTED for DIALYSIS PATIENTS: 42.8 hr *
• MEASURED in DIALYSIS PATIENTS: 41.9 hr *
* See Study Problem at end of Chapter 5.

56
PHENYTOIN HYDROXYLATION BY P450
N
NO
OH
H
N
NO
OH
H OH
PHENYTOIN p - HPPH
CYP2C9: Major, CYP2C19: Minor

57
Effect of Renal Disease on PHENYTOIN PROTEIN BINDING

58
PHENYTOIN KINETICS IN DIALYSIS PATIENTS*
* From: Odar-Cederlöf I, Borgå O: Eur J Clin Pharmacol 1974;7:31-7.
NORMALS UREMIC PATIENTS
(N = 4) (N = 4)
% UNBOUND (fu) 12% 26%
CLH 2.46 L/hr 7.63 L/hr
CLint 20.3 L/hr 29.9 L/hr
CLH = fu Clint , So: Clint = CLH/fu
NS

59
Effect of PROTEIN BINDING Changes on Phenytoin Plasma Concentration
E
SSCL
DOSEC
/
INTCL
/DOSEC USS,
PHENYTOIN > 98% ELIMINATED BY
HEPATIC METABOLISM, SO CLE = CLH
/fu fu

60
FREE AND TOTAL PHENYTOIN LEVELS (DOSE = 300 MG/DAY)
0
2
4
6
8
10
12
NORMAL
RENAL FUNCTION
FUNCTIONALLY
ANEPHRIC
[PH
EN
YT
OIN
] μ
g/m
L
■ BOUND [PHENYTOIN]
■ FREE [PHENYTOIN]
CLH ↑
CLINT =
61
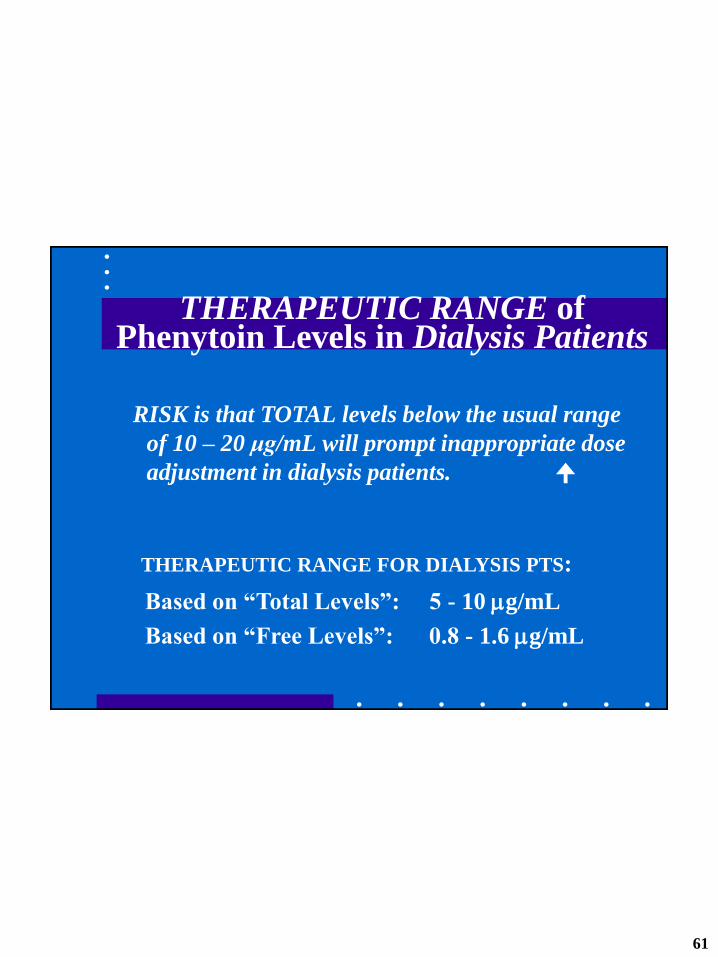
RISK is that TOTAL levels below the usual range
of 10 – 20 μg/mL will prompt inappropriate dose
adjustment in dialysis patients.
THERAPEUTIC RANGE of Phenytoin Levels in Dialysis Patients
THERAPEUTIC RANGE FOR DIALYSIS PTS:
Based on “Total Levels”: 5 - 10 g/mL
Based on “Free Levels”: 0.8 - 1.6 g/mL

62
GOALS of Renal Disease Effects Lecture
• EFFECT OF RENAL DISEASE ON DRUG
DISTRIBUTION
- PLASMA PROTEIN BINDING
EXAMPLE: PHENYTOIN
- TISSUE BINDING
EXAMPLE: DIGOXIN

63
Effect of Renal Disease on BINDING TO PLASMA PROTEINS*
BASIC OR NEUTRAL NORMAL OR
DRUGS: SLIGHTLY REDUCED
ACIDIC DRUGS: REDUCED FOR MOST
* From: Reidenberg MM, Drayer DE: Clin Pharmacokinet
1984;9(Suppl. 1):18-26.

64
Effect of Binding Changes on APPARENT DISTRIBUTION VOLUME*
ECF-TBWf ECFVud
* Atkinson AJ Jr, et al. Trends Pharmacol Sci 1991;12:96-101.
Φ = TISSUE/PLASMA PARTITION RATIO
fu = FRACTION NOT BOUND TO PLASMA
PROTEINS
FOR PHENYTOIN: Φ = 10.4

65
PHENYTOIN DISTRIBUTION IN DIALYSIS PATIENTS*
* From: Odar-Cederlöf I, Borgå O: Eur J Clin Pharmacol 1974;7:31-7.
NORMALS UREMIC PATIENTS
% UNBOUND (fu) 12%† 26%
Vd(AREA) 0.64 L/kg 1.40 L/kg
† Usual Value in Normal Subjects ~ 9%
66
GOALS OF RENAL DISEASE EFFECTS LECTURE
• EFFECT OF RENAL DISEASE ON DRUG
DISTRIBUTION
- PLASMA PROTEIN BINDING
EXAMPLE: PHENYTOIN
- TISSUE BINDING
EXAMPLE: DIGOXIN

67
IMPAIRED RENAL FUNCTION REDUCES DIGOXIN DISTRIBUTION VOLUME*
(mL/min)CL3.12 (kg)wt 3.84VCrd
* Sheiner LB, et al. J Pharmacokinet Biopharm 1977;5:445-79.

68
CRITERIA FOR NORMAL ABSORPTION OF 25 GRAM D-XYLOSE DOSE
5-hr URINE RECOVERY > 4 g
[SERUM] 1 hr AFTER DOSE 0.2 mg/mL
% DOSE ABSORBED > 42%
ka > 0.37 hr-1

69
EFFECT OF RENAL DISEASE ON D-XYLOSE ABSORPTION*
PATIENT ka ko % DOSE
GROUP (hr -1) (hr -1) ABSORBED
NORMALS 1.03 ± 0.33 0.49 ± 0.35 69.4 ± 13.6
MODERATE 0.64 ± 0.28 0.19 ± 0.15 77.4 ± 14.8
DIALYSIS 0.56 ± 0.42 0.67 ± 0.61 48.6 ± 13.3
* From: Worwag EM et al. Clin Pharmacol Ther 1987;41:351-7.

70
FUROSEMIDE
OCH2NH
Cl
NH2SO2
COOH

71
BIOPHARMACEUTIC CLASSIFICATION of FUROSEMIDE*
* From: Lenneräs. J Pharm Pharmacol 1997;49:627-38.
FUROSEMIDE

72
BIOPHARMACEUTIC DRUG CLASSIFICATION of FUROSEMIDE *
CLASS IV:
LOW SOLUBILITY-LOW PERMEABILITY
- in vitro – in vivo correlation poor
- good bioavailability not expected
* From: Lenneräs, et al. Pharm Res 1995;12:S396

73
Biopharmaceuticals Classification
System (BCS)
- Class I (high S, high P)
Enzyme effects predominate
- Class II (low S, high P)
Both enzymes and transporters
- Class III (high S, low P)
Transporter effects predominate
Sun H, et al (2006)
Amidon GI, et al (1995)

74
FDA GUIDANCE FOR INDUSTRY
PHARMACOKINETICS IN PATIENTS WITH
IMPAIRED RENAL FUNCTION – Study Design,
Data Analysis, and Impact on Dosing and
Labeling (1998)
AVAILABLE AT:
http://www.fda.gov/cder/guidance/index.htm

75
BASIC “FULL” STUDY DESIGN
SEVERE MOD MILD
ESRD NORMAL

76
FDA GUIDANCE FOR INDUSTRY
• A revision of this guidance document is currently under way (initiated in 2008).
• A concept paper/draft guidance has been posted by the FDA regarding revised recommendations for PK studies in patients with impaired renal function.
(March 2010-Revision 1)
US FDA Perspective:
S-M Huang, R Temple, S Xiao, L Zhang,
LJ Lesko
Clin. Pharmacol. Ther. 2009;86:475-479