effects of ph, lactate, hematocrit and potassium level on
TRANSCRIPT
ITALIAN JOURNALOF PEDIATRICS
Marics et al. Italian Journal of Pediatrics (2015) 41:17 DOI 10.1186/s13052-015-0122-x
RESEARCH Open Access
Effects of pH, lactate, hematocrit and potassiumlevel on the accuracy of continuous glucosemonitoring (CGM) in pediatric intensive care unitGábor Marics1*, Levente Koncz2, Katalin Eitler1, Barbara Vatai1, Boglárka Szénási1,3, David Zakariás1, Borbála Mikos2,Anna Körner1 and Péter Tóth-Heyn1
Abstract
Background: Continuous glucose monitoring (CGM) originally was developed for diabetic patients and it may be auseful tool for monitoring glucose changes in pediatric intensive care unit (PICU). Its use is, however, limited by thelack of sufficient data on its reliability at insufficient peripheral perfusion. We aimed to correlate the accuracy ofCGM with laboratory markers relevant to disturbed tissue perfusion.
Patients and Methods: In 38 pediatric patients (age range, 0–18 years) requiring intensive care we tested theeffect of pH, lactate, hematocrit and serum potassium on the difference between CGM and meter glucosemeasurements. Guardian® (Medtronic®) CGM results were compared to GEM 3000 (Instrumentation laboratory®)and point-of-care measurements. The clinical accuracy of CGM was evaluated by Clarke Error Grid -, Bland-Altmananalysis and Pearson’s correlation. We used Friedman test for statistical analysis (statistical significance wasestablished as a p < 0.05).
Results: CGM values exhibited a considerable variability without any correlation with the examined laboratoryparameters. Clarke, Bland-Altman analysis and Pearson’s correlation coefficient demonstrated a good clinicalaccuracy of CGM (zone A and B = 96%; the mean difference between reference and CGM glucose was 1,3 mg/dL,48 from the 780 calibration pairs overrunning the 2 standard deviation; Pearson’s correlation coefficient: 0.83).
Conclusions: The accuracy of CGM measurements is independent of laboratory parameters relevant to tissuehypoperfusion. CGM may prove a reliable tool for continuous monitoring of glucose changes in PICUs, not muchinfluenced by tissue perfusion, but still not appropriate for being the base for clinical decisions.
Keywords: CGM, CGM accuracy, CGM limitations, Tissue perfusion, Intensive care
IntroductionEvidence on increased overall mortality in both hypo-,and hyperglycemia has led to an escalating interest inglucose homeostasis disturbances in intensive care units.Pediatric intensive care unit (PICUs) teams are commit-ted to close monitoring of glucose, in view of the vulner-ability of the developing central nervous system, and thelack of appropriate clinical signs of hypoglycemia in se-dated or unconscious patients [1-7].Continuous glucose monitoring (CGM) originally de-
veloped for diabetic patients [8,9] may be a useful tool
* Correspondence: [email protected] Department of Pediatrics, Semmelweis University, Budapest, HungaryFull list of author information is available at the end of the article
© 2015 Marics et al.; licensee BioMed Central.Commons Attribution License (http://creativecreproduction in any medium, provided the orDedication waiver (http://creativecommons.orunless otherwise stated.
for monitoring glucose changes in pediatric or adult in-tensive care units [10-14]. CGM could be an appropriateadditional device of PICU toolbar, but its use is limitedby the lack of convincing data on its accuracy at patho-logical abnormalities causing tissue perfusion disturb-ance. These clinical settings may potentially lead totemporal shifts between glucose levels of the intravasaland interstitial compartments. Common PICU condi-tions characterized by diminished peripheral perfusionare hypovolemia, shock, vasoactive therapy with dopa-mine or noradrenaline, and hypothermia. Studies evalu-ating the effect of the above situations on the accuracyof CGM measurements has shown controversial results,probable due to the heterogeneity of the critical care
This is an Open Access article distributed under the terms of the Creativeommons.org/licenses/by/4.0), which permits unrestricted use, distribution, andiginal work is properly credited. The Creative Commons Public Domaing/publicdomain/zero/1.0/) applies to the data made available in this article,
Marics et al. Italian Journal of Pediatrics (2015) 41:17 Page 2 of 6
population and differences in study design [10,14-16].Therefore, we tested a set of laboratory parameters thattypically change in the PICU either primarily or second-arily in parallel with glucose, measured by CGM andmeter glucose measurements to analyze whether any as-sociations could be detected.The following parameters were tested in our compara-
tive analysis. pH a composite marker of metabolic and/or respiratory insufficiency; serum lactate reflecting ontissue hypoxia; hematocrit (htc), a marker of hemocon-centration and blood viscosity; in addition, serum potas-sium (SeK) was included as PICU stay can often beaffected by potassium abnormalities secondary to renalhypoperfusion and hypofiltration.The aim of the study was to evaluate the relationship
between the accuracy of CGM, characterized by the dif-ference of CGM and meter measurements, and bloodpH, htc, lactate and SeK values in the PICU setting.
Patients and methodsThe study was approved by the local research committeeand the parents signed informed consent for each child.Pediatric patients (between the age of 0–18 years) admit-ted to PICU at the 1st Department of Pediatrics of Sem-melweis University, Budapest and Bethesda Children’sHospital, Budapest between 1st February 2012 and 30th
June 2013, with an expected stay of at least 3 days wereenrolled. Those patients with known diabetes mellituswere excluded from the study. CGM recordings of 40measurements were analyzed from 38 patients.Clinical data: mean age (range): 1.3 (0–18) years; gender:
10 females, 28 males; length of PICU stay: mean (range)21 (1–80 days); 32/38 patients were on mechanical venti-lation during CGM measurement; 11/38 needed vaso-active therapy (dopamine, noradrenaline, adrenaline).
Glucose monitoring systemInterstitial glucose level was monitored by Guardian®REAL Time (Medtronic®, USA) CGM. The flexible plat-inum Enlite® sensor was inserted in the subcutaneoustissue of the left or right lateral thigh and covered bytransparent dressing. Each measurement was startedafter 2 hours of equilibration period. The initial calibra-tions were performed at the beginning of the CGMmeasurement and four hours afterwards. Further calibra-tions were done regularly at least two times daily. Add-itional calibrations were repeated as clinically needed.The calibration was not allowed immediately after en-teral nutrition or during rapid changes of subcutaneousglucose (more than 1 mg/dL/min, alerted by the display).The range of the glucose measurement by Guardian®Real Time is 40–400 mg/dL. Reference glucose valueswere obtained from blood gas analyzer (GEM 3000Premier™, Instrumentation Laboratory®) or point-of-care
glucose testing (DCONT Ideal, 77 Elektronika®). Referenceblood gas measurements were taken from arterial (77samples), central venous (184) or capillary (276) sites.
Data analysisFor this study we used raw CGM data including the cali-bration’s times and values, that could be exported incomma-separated values format (.CSV) from bothMedtronic® CareLink® Professional and Medtronic® Care-Link® Personal software. Clarke Error Grid analysis,Bland-Altman analysis and Pearson’s correlation wereused for general characterization of the accuracy ofCGM. For this, we used both the calibrating values andall the other documented blood gas analyzer glucose re-sults not used for calibration. Clarke Error Grid Analysiswas developed to evaluate the accuracy of different gluc-ometers; as its clinical and research application for deter-mination of CGM accuracy is established. It consists offive accuracy zones: A, B, C, D and E. Zone A representsthe glucose values that deviate by 20% or less from the ref-erence, or are in the hypoglycemic range (<70 mg/dL)when the reference glucose is also <70 mg/dL. In zone Bthe deviation is more than 20%, however, without any clin-ical consequence. Comparison points located in C, D or Erequire special clinical attention because they could leadto significant harm, if acted upon them The CGM clinicalaccuracy is the percentage of the comparison points lo-cated within zones A and B [17].The effect of pH, lactate, htc, and SeK levels on the ac-
curacy of CGM were interpreted on line charts (withstandard error of mean - SEM - bars) and scatter plots.For the line charts we stratified pH, lactate, htc, and potas-sium levels in arbitrarily defined ranges. For each rangewe calculated group’s mean for the difference between ref-erence and CGM glucose levels. On scatter plots eachpoint represented the difference of a glucose pair. Thestatistical effect was evaluated by repeated measures non-parametric ANOVA (Friedman test, statistical significancewas established as a p < 0.05) with STATISTICA 8. Devel-opment environment: MATLAB 2010b.
ResultsAltogether 4199 hours of CGM recordings were analyzedfrom the 40 measurements. Calibration was performed555 times, 312 of them with archived blood gas records.The mean time between the calibrations was 7.5 hours.Other 225 relevant blood gas records were used for com-parison without calibration. In total 537 blood gas recordswere used for detailed analysis in the study (353 arterial/capillary samples, and 184 venous samples).The accuracy of the CGM was evaluated based on the
calibrating and the relevant blood gas results (n = 780).Pearson’s correlation coefficient was 0.83. By the ClarkeError Grid Analysis 74% of the measurement were in

Marics et al. Italian Journal of Pediatrics (2015) 41:17 Page 3 of 6
zone A, 22% were in zone B and 4% in zone D. None ofthe glucose pairs fell in field C or E. The overall clinicalaccuracy was 96% (zone A and zone B together). TheBland Altman plot showed that the mean difference be-tween reference and CGM glucose was 1,3 mg/dL, 48calibration pairs exceeding the 2 SD (Figure 1). Theaverage difference of the CGM and the reference (bloodgas) glucose measurement was in the range of −2 and8 mg/dL for all investigated parameters (Figure 2). Al-though the mean (+SEM) lines seemed to show consid-erable variability, in the studied range the differenceswere not statistically significant. Even extreme values ofpH, lactate, htc and SeK had no effect on the accuracyof CGM measurement. High levels of error were due tothe decreasing number of results in these ranges, but theindividual results seen on scatter plots represented aconsiderably good accuracy of CGM at the extremities(Figure 2). It was, however, notable on scatter plots thatCGM had some significant individual error in the nor-mal ranges of investigated parameters. The pH, lactate,htc and SeK did not influence the accuracy of CGM re-sults even if subgroup analysis was performed for arter-ial, venous and capillary reference measurements.Table 1 shows the actual pH, lactate, htc, SeK and
mean glucose values associated with the ten highest glu-cose differences compared to the reference values. Datademonstrate that most of these values fell into or nearto the normal range. The 2 highest glucose differenceswere 86 mg/dL with corresponding mean glucose valuesof 353 and 207 mg/dL. Interestingly, these points werelocated in the clinically acceptable Zone B of the ClarkeError Grid Analysis (difference from the reference glu-cose: 23 and 35%).
DiscussionIncreasing efforts in order to introduce CGM into theintensive care often face the criticism that serum and
Figure 1 Left side: Clarke Error Grid analysis. The clinical accuracy of CGRight side: Bland Altman plot, representing CGM – reference glucose differ
the subcutaneous tissue are different compartments po-tentially leading to considerable errors in glucose meas-urement in cases of disturbed peripheral perfusion [18].Changes of blood glucose level may appear delayed inthe interstitial space when tissue perfusion is compro-mised. The average delay of about 10 minutes may besignificantly prolonged resulting in wide differences be-tween the simultaneously taken blood and subcutaneousglucose values [19]. The need for continuous glucosemeasurement in the PICU could not allow an increasingreaction time in cases of rapidly changing glucose level.It is clinically not evident to prove or exclude the
problem of inaccurate glucose measurement in periph-eral hypoperfusion. Many clinical scenarios could lead todecreased tissue blood flow with other confoundingpathogenetic or therapeutic factors, making it very diffi-cult to evaluate the effect on the accuracy of glucosemeasurements. Simply, there is no homogenous patientgroup in the PICU characterized by tissue hypoperfu-sion. We aimed therefore to define a set of simply meas-urable laboratory parameters which could characterizetissue perfusion, and compare their effects on the accur-acy of glucose measurements in the subcutaneous space.Metabolic acidosis primarily due to anaerobic lactate
production is evidently one of the most frequently rec-ognized markers of tissue hypoperfusion. ThereforepH and serum lactate were chosen as key elements ofour laboratory tools. In many cases, especially inpediatrics, hypovolemia and secondary hemoconcentra-tion play significant role in disturbed microcirculation.Hematocrit was chosen as an element of our tools basedon this approach. Finally, renal function is commonlyaltered by systemic hypoperfusion, easily detectablefrom clinical signs such as oligo-anuria, leading to sig-nificant morbidity. From practical aspects we havechosen serum potassium as a secondary marker of pos-sibly decreased renal perfusion.
M was 96% as a result of 780 CGM – reference glucose pair analysis.ences in function of mean glucose values.
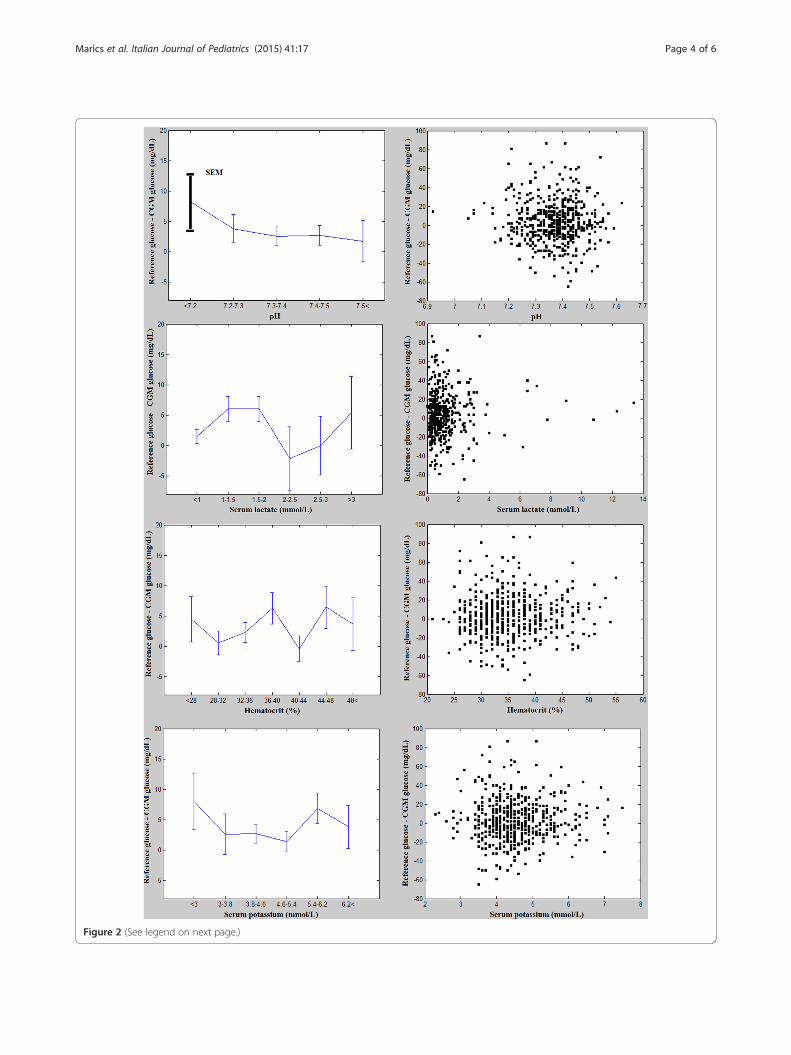
Figure 2 (See legend on next page.)
Marics et al. Italian Journal of Pediatrics (2015) 41:17 Page 4 of 6
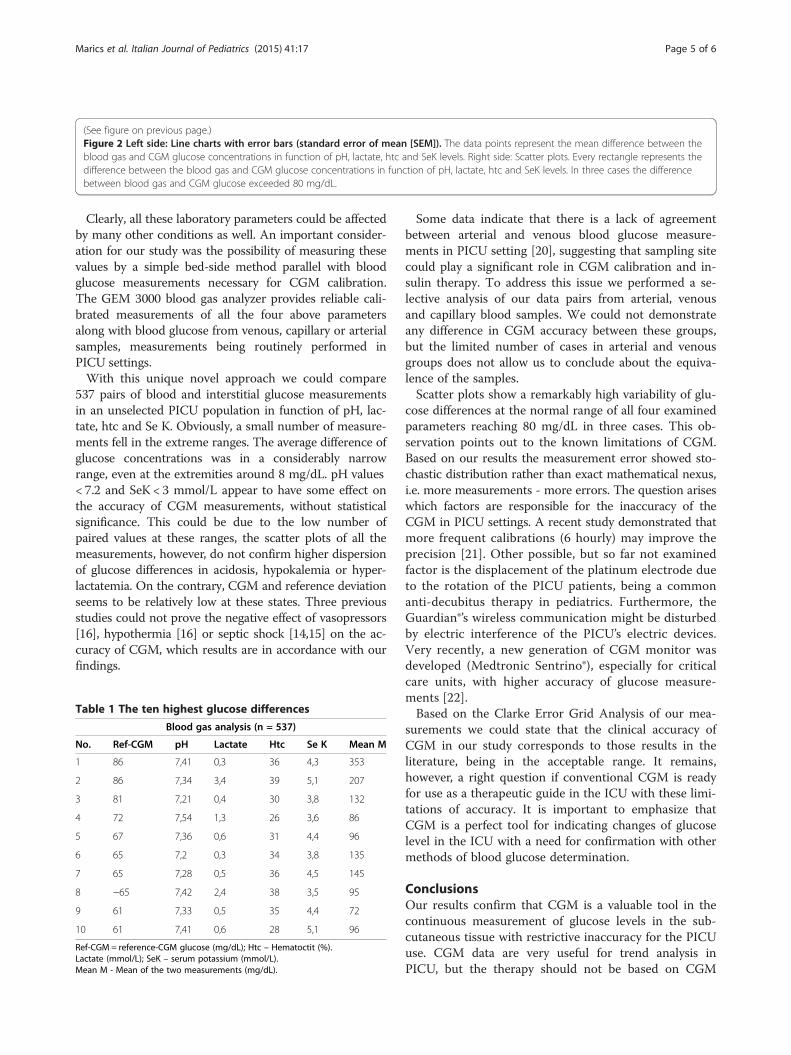
(See figure on previous page.)Figure 2 Left side: Line charts with error bars (standard error of mean [SEM]). The data points represent the mean difference between theblood gas and CGM glucose concentrations in function of pH, lactate, htc and SeK levels. Right side: Scatter plots. Every rectangle represents thedifference between the blood gas and CGM glucose concentrations in function of pH, lactate, htc and SeK levels. In three cases the differencebetween blood gas and CGM glucose exceeded 80 mg/dL.
Marics et al. Italian Journal of Pediatrics (2015) 41:17 Page 5 of 6
Clearly, all these laboratory parameters could be affectedby many other conditions as well. An important consider-ation for our study was the possibility of measuring thesevalues by a simple bed-side method parallel with bloodglucose measurements necessary for CGM calibration.The GEM 3000 blood gas analyzer provides reliable cali-brated measurements of all the four above parametersalong with blood glucose from venous, capillary or arterialsamples, measurements being routinely performed inPICU settings.With this unique novel approach we could compare
537 pairs of blood and interstitial glucose measurementsin an unselected PICU population in function of pH, lac-tate, htc and Se K. Obviously, a small number of measure-ments fell in the extreme ranges. The average difference ofglucose concentrations was in a considerably narrowrange, even at the extremities around 8 mg/dL. pH values< 7.2 and SeK < 3 mmol/L appear to have some effect onthe accuracy of CGM measurements, without statisticalsignificance. This could be due to the low number ofpaired values at these ranges, the scatter plots of all themeasurements, however, do not confirm higher dispersionof glucose differences in acidosis, hypokalemia or hyper-lactatemia. On the contrary, CGM and reference deviationseems to be relatively low at these states. Three previousstudies could not prove the negative effect of vasopressors[16], hypothermia [16] or septic shock [14,15] on the ac-curacy of CGM, which results are in accordance with ourfindings.
Table 1 The ten highest glucose differences
Blood gas analysis (n = 537)
No. Ref-CGM pH Lactate Htc Se K Mean M
1 86 7,41 0,3 36 4,3 353
2 86 7,34 3,4 39 5,1 207
3 81 7,21 0,4 30 3,8 132
4 72 7,54 1,3 26 3,6 86
5 67 7,36 0,6 31 4,4 96
6 65 7,2 0,3 34 3,8 135
7 65 7,28 0,5 36 4,5 145
8 −65 7,42 2,4 38 3,5 95
9 61 7,33 0,5 35 4,4 72
10 61 7,41 0,6 28 5,1 96
Ref-CGM = reference-CGM glucose (mg/dL); Htc – Hematoctit (%).Lactate (mmol/L); SeK – serum potassium (mmol/L).Mean M - Mean of the two measurements (mg/dL).
Some data indicate that there is a lack of agreementbetween arterial and venous blood glucose measure-ments in PICU setting [20], suggesting that sampling sitecould play a significant role in CGM calibration and in-sulin therapy. To address this issue we performed a se-lective analysis of our data pairs from arterial, venousand capillary blood samples. We could not demonstrateany difference in CGM accuracy between these groups,but the limited number of cases in arterial and venousgroups does not allow us to conclude about the equiva-lence of the samples.Scatter plots show a remarkably high variability of glu-
cose differences at the normal range of all four examinedparameters reaching 80 mg/dL in three cases. This ob-servation points out to the known limitations of CGM.Based on our results the measurement error showed sto-chastic distribution rather than exact mathematical nexus,i.e. more measurements - more errors. The question ariseswhich factors are responsible for the inaccuracy of theCGM in PICU settings. A recent study demonstrated thatmore frequent calibrations (6 hourly) may improve theprecision [21]. Other possible, but so far not examinedfactor is the displacement of the platinum electrode dueto the rotation of the PICU patients, being a commonanti-decubitus therapy in pediatrics. Furthermore, theGuardian®’s wireless communication might be disturbedby electric interference of the PICU’s electric devices.Very recently, a new generation of CGM monitor wasdeveloped (Medtronic Sentrino®), especially for criticalcare units, with higher accuracy of glucose measure-ments [22].Based on the Clarke Error Grid Analysis of our mea-
surements we could state that the clinical accuracy ofCGM in our study corresponds to those results in theliterature, being in the acceptable range. It remains,however, a right question if conventional CGM is readyfor use as a therapeutic guide in the ICU with these limi-tations of accuracy. It is important to emphasize thatCGM is a perfect tool for indicating changes of glucoselevel in the ICU with a need for confirmation with othermethods of blood glucose determination.
ConclusionsOur results confirm that CGM is a valuable tool in thecontinuous measurement of glucose levels in the sub-cutaneous tissue with restrictive inaccuracy for the PICUuse. CGM data are very useful for trend analysis inPICU, but the therapy should not be based on CGM

Marics et al. Italian Journal of Pediatrics (2015) 41:17 Page 6 of 6
values without a confirming reference measurement. Theaccuracy of CGM is not dependent on the changes of la-boratory parameters indicative for tissue hypoperfusion,thus those states typical for PICU patients with disturbedmicrocirculation do not further limit its suitability.
AbbreviationsCGM: Continuous glucose monitoring; htc: Hematocrit; PICU: Pediatricintensive care unit; SeK: Serum potassium; SEM: Standard error of mean.
Competing interestsThe authors declare that they have no competing interests.
Authors’ contributionsGM was responsible for the CGM analysis, statistical analysis and writing themanuscript and approved the final manuscript as submitted. AK, BM carried outthe initial analyses, reviewed and revised the manuscript and approved the finalmanuscript as submitted. LK, KE, VB, SzB, DZ participated in patient selection,clinical data collection, CGM implantation and revised the manuscript andapproved the final manuscript as submitted. PTH was responsible for protocoldevelopment, patient screening, enrollment, preliminary data analysis andwriting the manuscript and approved the final manuscript as submitted.
Authors’ informationGM (MD and electrical engineer) is a PhD student at First Department ofPediatrics, Semmelweis University. BV and LK are pediatricians at FirstDepartment of Pediatrics Semmelweis University and Bethesda Children’sHospital. KE is a member of the Students’ Scientific Association at FirstDepartment of Pediatrics Semmelweis University. BSz and DZ are formermembers of the Students’ Scientific Association at First Department ofPediatrics Semmelweis University. BM is the head of the Department ofAnaesthesiology and Intensive Therapy, at Bethesda Children’s Hospital.AK DSc is a pediatrician at the First Department of Pediatrics, SemmelweisUniversity. PTH MD, PhD is the former head of the PICU at first Departmentof Pediatrics, Semmelweis University.
AcknowledgmentsThe professional help of ICU nurses of the Ist Dept. of Pediatrics andBethesda Children Hospital is highly acknowledged. The authors thank thefinancial support of the local government of Semjénháza. We also thank theuseful advices of Ágnes Jermendy MD, MPH (First Department of Pediatrics,Semmelweis University).
Author details1First Department of Pediatrics, Semmelweis University, Budapest, Hungary.2Bethesda Children’s Hospital, Budapest, Hungary. 3Department ofAnaesthesiology and Intensive Therapy, Semmelweis University, Budapest,Hungary.
Received: 10 September 2014 Accepted: 4 March 2015
References1. Lucas A, Morley R, Cole TJ. Adverse neurodevelopmental outcome of
moderate neonatal hypoglycaemia. BMJ. 1988;297:1304–8.2. Corstjens AM, van der Horst ICC, Zijlstra JG, Groeneveld ABJ, Zijlstra F,
Tulleken JE, et al. Hyperglycaemia in critically ill patients: marker or mediatorof mortality? Crit Care. 2006;10:R216.
3. Mikos B, Barkai L. Hyperglycemia and mortality in critically ill children.[Hyperglykaemia és mortalitás kritikus állapotú gyermekeknél.]. Orv Hetil.2007;148:683–8 [Hungarian].
4. Klein GW, Hojsak JM, Rapaport R. Hyperglycemia in the pediatric intensivecare unit. Curr Opin Clin Nutr Metab Care. 2007;10:187–92.
5. Rigby MR. Hypoglycemia in pediatric intensive care units: it’s already here.Pediatr Crit Care Med. 2010;11:752–4.
6. Vlasselaers D, Milants I, Desmet L, Wouters PJ, Vanhorebeek I, van denHeuvel I, et al. Intensive insulin therapy for patients in paediatric intensivecare: a prospective, randomised controlled study. Lancet. 2009;373:547–56.
7. Agus MS, Steil GM, Wypij D, Costello JM, Laussen PC, Langer M, et al. Tightglycemic control versus standard care after pediatric cardiac surgery. N EnglJ Med. 2012;367:1208–19.
8. Bode BW, Battelino T. Continuous glucose monitoring. Int J Clin Pract Suppl.2010;166:11–5.
9. Toth-Heyn P, Korner A, Madacsy L. Continuous glucose monitoring system,as a valuable tool in the care of children and adolescents with diabetesmellitus. [A folyamatos glukózszenzor (CGMS) értékes eszköz a gyermek- ésserdülőkori diabetes mellitus gondozásában.]. Orv Hetil. 2004;145:1265–70[Hungarian].
10. Branco RG, Chavan A, Tasker RC. Pilot evaluation of continuoussubcutaneous glucose monitoring in children with multiple organdysfunction syndrome. Pediatr Crit Care Med. 2010;11:415–9.
11. Bridges BC, Preissig CM, Maher KO, Rigby MR. Continuous glucose monitorsprove highly accurate in critically ill children. Crit Care. 2010;14:R176.
12. Corstjens AM, Ligtenberg JJ, van der Horst IC, Spanjersberg R, Lind JS,Tulleken JE, et al. Accuracy and feasibility of point-of-care and continuousblood glucose analysis in critically ill ICU patients. Crit Care. 2006;10:R135.
13. Harris DL, Battin MR, Weston PJ, Harding JE. Continuous glucose monitoringin newborn babies at risk of hypoglycemia. J Pediatr. 2010;157:198–202.
14. Holzinger U, Warszawska J, Kitzberger R, Herkner H, Metnitz PG, Madl C.Impact of shock requiring norepinephrine on the accuracy and reliability ofsubcutaneous continuous glucose monitoring. Intens Care Med.2009;35:1383–9.
15. Lorencio C, Leal Y, Bonet A, Bondia J, Palerm CC, Tache A, et al. Real-timecontinuous glucose monitoring in an intensive care unit: better accuracy inpatients with septic shock. Diabetes Technol Ther. 2012;14:568–75.
16. Piper HG, Alexander JL, Shukla A, Pigula F, Costello JM, Laussen PC, et al.Real-time continuous glucose monitoring in pediatric patients during andafter cardiac surgery. Pediatrics. 2006;118:1176–84.
17. Clarke WL, Cox D, Gonder-Frederick LA, Carter W, Pohl SL. Evaluating clinicalaccuracy of systems for self-monitoring of blood glucose. Diabetes Care.1987;10:622–8.
18. Cengiz E, Tamborlane WV. A tale of two compartments: interstitial versusblood glucose monitoring. Diabetes Technol Ther. 2009;11 Suppl 1:S11–16.
19. Keenan DB, Mastrototaro JJ, Voskanyan G, Steil GM. Delays in minimallyinvasive continuous glucose monitoring devices: a review of currenttechnology. J Diabetes Sci Technol. 2009;3:1207–14.
20. Nayak PP, Morris K, Lang H, Laker S, Stickley J, Davies P, et al. Lack ofagreement between arterial and central venous blood glucosemeasurement in critically ill children. Intens Care Med. 2009;35:762–3.
21. Yue XY, Zheng Y, Cai YH, Yin NN, Zhou JX. Real-time continuous glucosemonitoring shows high accuracy within 6 hours after sensor calibration: aprospective study. PLoS One. 2013;8:e60070.
22. Kosiborod M, Gottlieb R, Sekella J, Peterman D, Grodzinsky A, Kennedy P,et al. Performance of the Medtronic Sentrino® continuous glucosemanagement system in the cardiac ICU. Crit Care. 2013;17:P462.
Submit your next manuscript to BioMed Centraland take full advantage of:
• Convenient online submission
• Thorough peer review
• No space constraints or color figure charges
• Immediate publication on acceptance
• Inclusion in PubMed, CAS, Scopus and Google Scholar
• Research which is freely available for redistribution
Submit your manuscript at www.biomedcentral.com/submit