effects of non-tariff barriers to trade on prices, public disclosure...
TRANSCRIPT

Effects of Non-tariff Barriers to Trade on Prices,Employment, and Imports: The Case of theSwedish Textile and Clothing Industry / E.5'
SWP- 429World Bank Staff Working Paper No. 429(Revised)
December 1980
Prepared by: Carl Hamilton, ConsulantEconomic Analysis and Projections Department
Copyright ( 1980The World Bank1818 H Street, N.W.Washington, D.C. 20433, U.S.A.
The views and interpretations in this document are those of the authorand should not be attributed to the World Bank, to its affiliatedorganizations, or to any individual acting in their behalf.
It[ f i Operations Review andSupport Unit
Dl019
Pub
lic D
iscl
osur
e A
utho
rized
Pub
lic D
iscl
osur
e A
utho
rized
Pub
lic D
iscl
osur
e A
utho
rized
Pub
lic D
iscl
osur
e A
utho
rized
Pub
lic D
iscl
osur
e A
utho
rized
Pub
lic D
iscl
osur
e A
utho
rized
Pub
lic D
iscl
osur
e A
utho
rized
Pub
lic D
iscl
osur
e A
utho
rized


The views and interpretations in this document are those of the authorand should not be attributed to the World Bank, to its affiliatedorganizations, or to any individual acting in their behalf.
WORLD BANK
Staff Working Paper No. 429
December 1980
EFFECTS OF NON-TARIFF BARRIERS TO TRADE ON PRICES, EPLOYMENT, AND IMPORTS:THE CASE OF THE SWEDISH TEXTILE AND CLOTHING INDUSTRY
This work in progress report is part of an inquiry being undertakenby the World Bank in conjunction with scholars from twelve industrial coun-tries into the penetration of the markets of industrial countries by exportsof manufactures from developing countries. The project seeks to establishthe shares of industrial country markets held by the developing countries,changes in such shares in the 1970s, and why they vary among industry groupsand countries. The aim is to assist developing and industrial countries toimprove their policies through a better understanding of trade patterns andprotectionist pressures.
This paper analyzes the effects of "voluntary restraints" imposedon developing country exporters by Sweden, and by Swedish domestic adjustmentsubsidies on prices, import volumes and employment in the Swedish clothingand textile industries. The impact of a 50 percent increase of imports fromcountries in which voluntary export restrictions operate on Swedish domesticprices and employment is examined in some detail. It becomes evident thatthe competitiveness of the products in question from the exporters' and fromthe importers' points of view is of considerable importance. The effects ofsubsidies on employment and import volume are then analyzed. It is clearthat their marginal effectiveness decreases rapidly as their amount grows.
I am grateful for comments from participants in an Institute forInternational Economic Studies, Stockholm University, seminar at which thispaper was presented, in particular to Lars E.O. Svensson and Lars Heikensten,and to comments from participants in the market penetration workshop in Kielin December 1979, in particular to Jean Waelbroeck and Jeurgen Donges. Ialso wish to thank Urban Backstrom and Sven Cele for their assistance withdata and calculations.
Prepared by: Carl Hamilton (Consultant)Economic Analysis and Projections Department
Copyright ()1980The World Bank1818 H St., N.W.Washington, D.C. 20433, U.S.A.


TABLE OF CONTENTS
I. INTRODUCTION AND SUMMARY RESULTS ..................................... 1
II. VOLUNTARY EXPORT RESTRAINTS ................. ....... ............... 4
The Institutional Structure and Policy Statements .................. 4
Effects on Domestic Prices .................... . .... .. ...... 8
The Perfect Substitute in Export Markets and thePerfect Substitute in Domestic Production ........................ 12
The Non-substitute in Export Markets and thePerfect Substitute in Domestic Production ........................ 23
Effects on Domestic Employment ............ ....................... 27
The Overall Effect ........................ ........................... 27
The Regional Effect .... .............................. ..... .. ........ 32
III. GOVERNMENT SUBSIDIES ... ............. . ......... . .. . . .............................. 34
The Data ....................... ...................... 34
Import Volumes and Domestic Prices in the Absence of Subsidies ..... 39
The Price Variable .............. 0......... 0....0.................................. 39
The Activity Variable ....................... .............................. ........ 40
VERs .... .*................ o..o................. .... o..o.... *O............ 40
Subsidies before 1971 ....... ............... ........................ 40
Simulated Import Volumes and the Effecton Domestic Competitiveness ...... ................................ 42
Effects on Domestic Employment ..................................... 46
The Overall Effect .................................... .... **.*.................. 46
The Regional Effect . ....... 48
A Comparison with a Commonly Used Approachto Estimate the Impact of Increased Exportsfrom Developing to Industrial Country Markets .................... 50
Appendix ............................... .......... ..... ......................... 54


(i)
Tables
1. The Swedish textile and clothing industry: number of employees,
value added per employee, number of plants, 1970 and 1977; and
share of non-Swedes in the labour force, 1977.
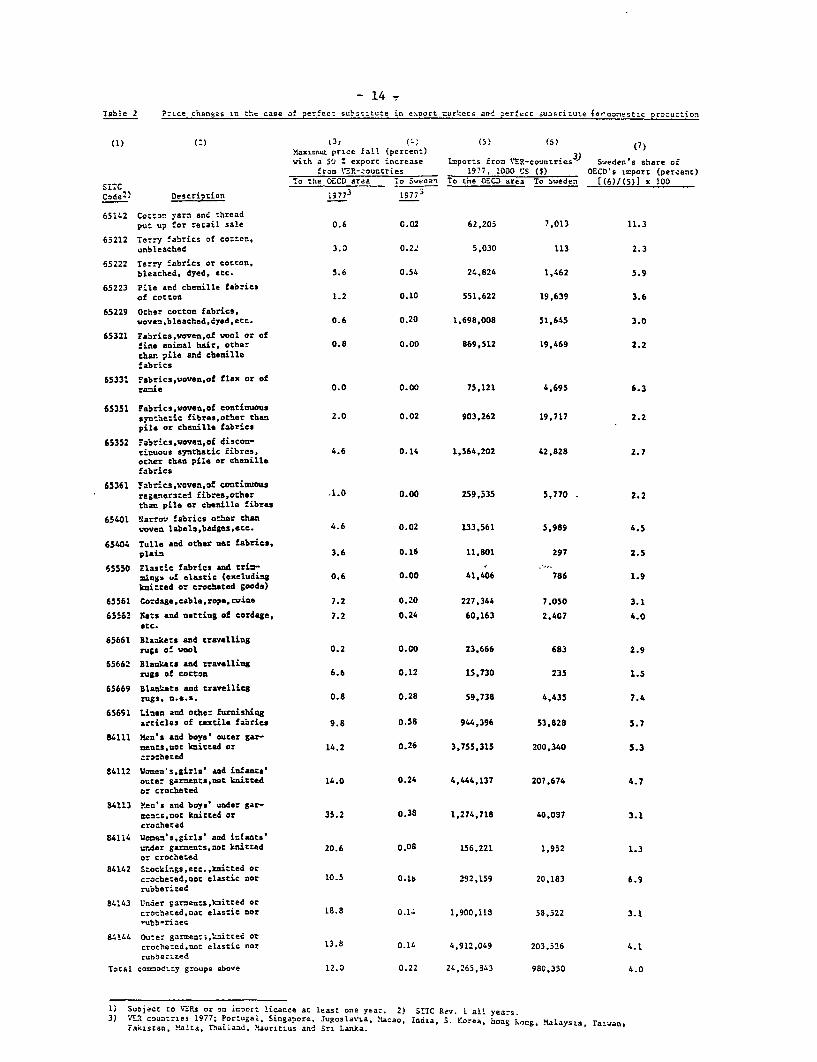
2. Price changes in the case of the perfect substitute in export markets
and the perfect substitute for domestic production.
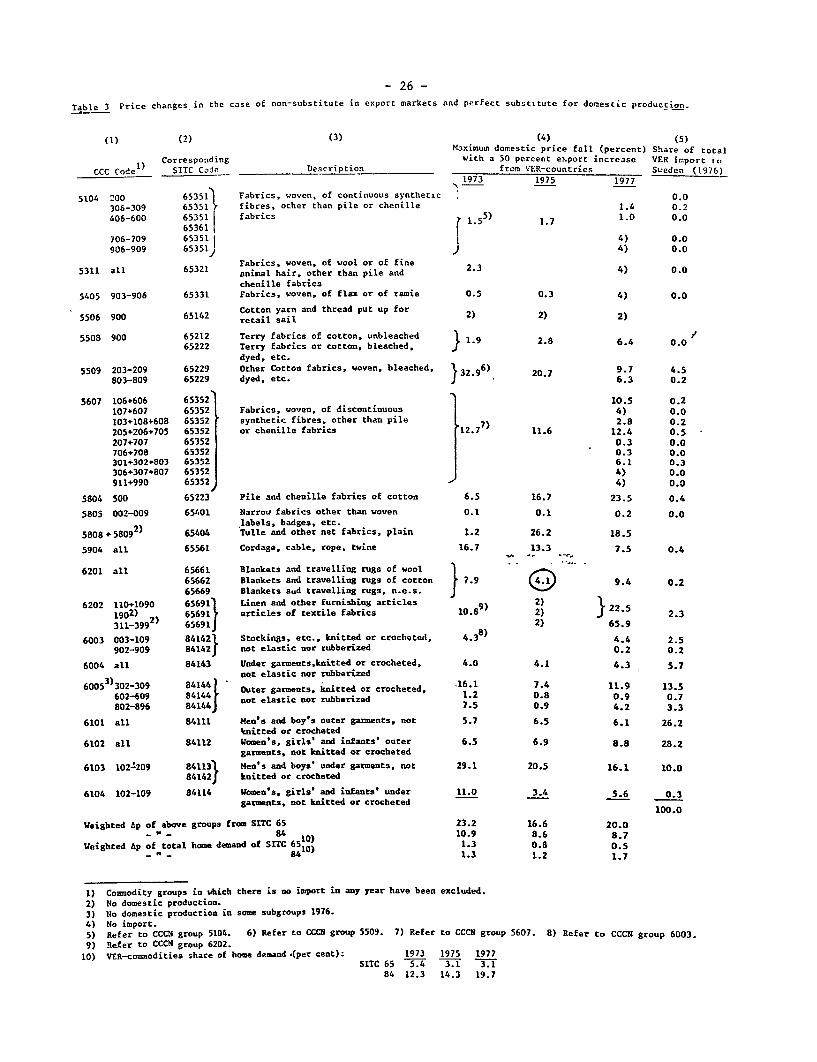
3. Price changes in the case of the non-substitute in export
markets and the perfect substitute for domestic production.
4. Predicted number of man-years "lost" if VER imports increased by
50 per cent in the case of non-substitutability in export markets.
5. Subsidies paid out to the Swedish textile and clothing industry,
fiscal years 1970/71 and 1977/78.
6. Adjusted and non-adjusted domestic unit cost.
7. Predicted number of man-years "saved" because of government subsidies
1973-77.
Al. Total subsidies to the textile and clothing industry.
A2. Trade and employment in textiles and clothing, 1963-77.
A3. Commodity group shares of total VER imported to Sweden 1973 and 1977.

Figures
1. The perfect substitute in export markets and the perfect substitute
for domestic production.
2. A Salter diagram in principle.
3. A Salter diagram in practice: The clothing industry, 1972/73
and 1976.
4. Subsidy and relative labour cost per unit of output, 1973-77.
5. Estimating the import demand function.
6. Simulated import demand and employment, 1971-77.
7. Regional distribution of man-years "saved" due to subsidies,
total number 1973-77.
8. Increase in counties' stocks of unemployed in the absence of
subsidies (per cent).
Al. Regional distribution of man years "saved"; each county's share
of the total (per cent).

I. INTRODUCTION AND SUMMARY OF RESULTS
During the 1970s a "new protectionism" appears to have emerged.
What distinguishes today's protectionism from the "old" is its reliance on
non-tariff barriers to trade (NTBs) and its concern for employment and social
objectives.
One of the two most important types of NTBs current today consists
of government "adjustment" subsidies to import-competing industries and
sometimes also to export industries facing fierce international competition
(for example, the shipbuilding industry).
The second important kind of NTB consists of various arrangements
agreed upon to restrict commodities such as textiles and clothing from
penetrating the industrial countries' markets. The most common arrangement is
the so-called voluntary export restraint (VER) imposed on selected exporting
countries by almost all industrial country governments.
The principal effects on the economic system of these NTBs have been
discussed at length. In this paper, however, we address a practical question:
what have been the effects of these two types of NTBs on prices, import volume
and employment in the Swedish textile and clothing industry? The emphasis of
the paper is on developing methods for the analysis of this kind of question.
In section II we analyse the effect on prices and employment of an
import increase by 50 percent of commodities from countries under VERs.
Assumptions are chosen throughout so as to yield a maximum price fall and a
maximum number of jobs potentially "lost". From our analysis it turns
out to be important to distinguish between cases in which, from the exporter's
point of view, the commodities are perfect or imperfect substitutes in export
markets (that is, is the commodity specific to one export market?), and, from

- 2 -
the user's point of view, the commodities are perfect or imperfect substi-
tutes to domestic production. Employing elsewhere estimated elasticities
in a derived formula for the potential price change,the maximum price fall
is calculated to be very small in the case of a perfect substitute in export
markets, provided the import increase is "small" in relation to the world
market as would be the case with a small country. For Sweden the fall would
be approximately 0.2 percent on average for 1977. However, if all OECD
countries increased their imports by 50 percent, the result would be a 12
percent price fall on VER commodities on average for 1977.
A 50 percent increase in value of the VER countries' export of VER-
commodities to the OECD area is estimated to increase these countries' export
earnings by $1805 million in 1977. Further, a one percent Increase in export
supply is estimated to result in 0.66 percent increase in VER countries'
export earnings. Changing the assumptions and taking VER commodities to be
nonsubstitutes in export markets yields average price falls on the Swedish
market in the neighborhood of 20 percent on VER textiles and 9 percent on
VER clothing. The employment effects of such price falls - overall as well as
regionally -are analysed by way of marrying the calculated price falls (by
year and industry) to a calculated Salter structure (by year and industry).
Imposing the estimated price falls on the Salter structures indicates which
plants would have had to close down.
With information on each plant's location and number of employees,
the overall and regional employment effect can then be calculated. Given some
additional assumptions, we arrive at an upper limit figure of just over 2200
jobs "lost" in 1974 and a lower limit figure of just below 400 jobs "lost" in
1976 by increasing VER imports by 50 percent. (Given that the VER commodi-
ties are non-substitutes in export markets and perfect substitutes to domestic

- 3 -
production.) This means a 4 percent reduction of the industry's labor force
in 1974. More than 50 percent of the potential unemployment would have been
concentrated in one county, Alvsborg.
Section II analyses the import reducing and job "saving" effect of
government subsidies on the textile and clothing industry during 1973-77. A
disaggregated import demand function is estimated, and the data on subsidies
are used to simulate the import volume in the absence of subsidies. In 1976
and 1977 particularly imports would have been substantially higher without
subsidies. The employment effect of subsidies is again analysed through a
Salter approach. We estimate that approximately 28,900 man-years were "saved"
during 1973-77 through the government subsidies. The marginal effectiveness
of the subsidies decreases rapidly as the amount grows; it is high in boom
years, when subsidies are small and low when macroeconomic conditions force
the government to increase their level. The subsidies postpone the fall in
actual employemnt below its predicted level by between one and two and a half
years.
Sweden's textile and clothing industry is highly concentrated region-
ally, and approximately 50 percent of the man-years "saved" would originate
in Alvsborg: the regional unemployment rate would increase by 2.5 percent and
the stock of unemployed by 90 percent. However, even in this very county, the
potentially unemployed would at no time constitute more than 0.25 percent of
the employed labour force. Of the potentially unemployed, around 60 percent
were women and at least 25 percent were non-Swedes, mainly from Finland, the
single largest exporter to Sweden of textiles and clothing. Finally, we use
the estimated import volume in an alternative approach to estimate the number
of jobs "lost" to check the robustness of our method.

- 4 -
Compared to other studies of the impact of increased developing
country exports on industrial economies, our approach has at least three
advantages. First, it explicitly brings prices into the picture, opening up
the possibility of estimating the gain to consumers of increased imports and
to developing countries of increased exports. Second, in our analysis we
consider employment in the marginal plants facing potential close down. In
fact we derive a demand for labor curve specific to the industry. In other
studies average labor-output ratios have frequently been used as an approxima-
tion. In this case, the difference in approach results in a 20 percent
difference in the estimated number of jobs potentially lost. A marginal plant
is more labour intensive than an average plant. Third, we calculate new
Salter structures for each year, thus avoiding working with outdated labor-
output coefficients.
Our analysis is based on a partial equilibrium approach, and it is
important to be careful when drawing conclusions about the overall employment
effects. Would the subsidies have a greater employment impact had they been
used in other activities? Will developing countries hit by the Swedish
non-tariff barriers import less from Sweden reducing employment in export
industries? Would a differently pursued macroeconomic policy on the part of
the government have been a more efficient way of creating jobs? We disregard
these issues.
II. VOLUNTARY EXPORT RESTRAINTS
The Institutional Structure and Policy Statements
Sweden has succeeded in negotiating bilateral agreements with
each exporting country to restrict exports to Sweden and places the onus for

enforcement on the exporting countries. The restrictions are euphemistically
labelled "voluntary" export restraints. Each agreement usually runs for
approximately one year. The exporting countries concerned are 1/ Portugal
(1968), Yugoslavia (1968), Malta 2/ (1975), Mauritius 1/ (1977), Pakistan
(1975), India (1973), Sri Lanka (1977), Thailand (1976), Malaysia (1973),
Singapore (1972), Philippines (1978), The Republic of Korea (1967), Taiwan 1/
(1968), Hong Kong (1968) and Macau (1970). 3/ These countries took only
24 percent of the total 1977 textile and clothing imports. In 1977, state-
trading countries took 4 percent, and other unrestricted countries, notably
Finland and the UK, took 72 percent.
In addition to VERs, since 1976 there has been an import-licensing
system covering all countries except those belonging to the European Community
(EC) or the European Free Trade Area (EFTA) but excluding Portugal. This
system is said to have been designed only to improve "supervision" of imports. 4/
VERS are usually stated in volume terms for each CCC category 5/ as
number of shirts, tons of towels, and so on. However, for some countries there
have also been since 1976 volume and value quotas within which the country is
free to some extent to choose its own mix of export commodities to Sweden.
1/ The year of introduction of the VER is given in parenthesis.
2/ For Malta and Mauritius, imports to Sweden are, in addition to VERs,also formally restricted by quantitative restriction (QR).
Imports from Taiwan are subject to a unilateral Swedish QR.
3/ In addition to these countries, imports from state trading countriesare also restricted. Previously imports from Japan were also subjectto VER type restrictions.
4/ The effect on the exporting country of this kind of "supervision" istaken up in Bhagwati and Srinivasan (1976).
5/ Customs Cooperation Council Nomenclature, formerly the Brussels Nomen-clature (BTN).

For example, the Philippines can export within a given set of optional com-
modities for $400,000 and India likewise (within a different set) up to 140
tons (1979).
The normal procedure has been to "freeze" exports to Sweden (usually
-in volume terms 1/) at the same level as the preceding 12-month period 2/ or to
allow for an increase of one to two percent annually. This is less than the
six percent recommended in the Multifibre Agreement (MFA). The low rate of
increase is allowed by the so-called "Nordic clause" of the MFA. The clause
states that "special regard should be given to importing countries with small
markets, an exceptionally high level of imports and a correspondingly low
level of domestic production.... Even if the interpretation of the clause has
been a matter of dispute, Sweden has with its help been- able to reduce annual
increases in the restricted import levels "(i.e. VERs) have been reduced to,
at present, one to two percent and even less in some instances" (The Conserva-
tive Minister of Commerce 3/ in Proposition 1977/78:82, p. 65).
In the bill it is also stated that "provided the Multifibre Agreement
can be prolonged according to the conditions [agreed upon in the summer of
1977] it should imply improved possibilities for Sweden to curtail disturbing
1/ For state trading countries, quotas are always defined in value terms butadjusted for inflation from one year to another.
2/ Counted from the date Sweden demands negotiations with the exporting coun-try: Negotiations have to start within three months of this date.
3/ The present author's translation. Incidentally, the Minister at the timewas Professor Staffan Burenstam Linder, father of the "Linder hypothesis"in trade theory.

-7-
low-price imports given that [VERs] can be agreed upon.... We have also been
assured of an improved application of the Nordic clause" (p. 66). Sweden
joined the prolonged MFA later, in April 1978. "To achieve a better protec-
tive effect than we have had so far, we also have to reckon upon [VERs] with
a larger number of low-price countries than before. In these cases, one
should try to take special note of the fact that restrictions hit different
countries with different severity, depending on their degree of development"
(p. 67).
In a later bill (under a new Liberal Minister; Proposition 1978/79:
145] it was stated that, "One should thus be able to conclude that within the
framework of the MFA we have obtained significantly improved possibilities for
effective restrictions of market disturbing low-price imports. This conclu-
sion also speaks in favor of a continuation of the present system" (p. 49).
Yet a few pages earlier, the same Minister had stated that "protectionism in
different forms must be fought against". The Minister, however, reiterated
that "the poorest countries are often hit in a particularly severe way which
is taken into account whenever possible" (p. 38).
In spite of these statements, the distribution of VERs clashes with
Swedish foreign aid policy. Thus India, Pakistan, Sri Lanka, and Portugal
have long been given the status of high priority countries for foreign aid.
In 1979/80 they received 22 percent of the bilateral aid budget. The Minister
of Foreign Aid has been aware of the ambiguity in Swedish policy toward devel-
oping countries: "[Sweden's] policy towards developing countries must not be
passive or unaware but should represent a consistent policy in different
fields so as to consciously take into account the legitimate interests of

- 8 -
the developing countries and coordinate them with our own more immediate
interests. If we disregard (the coordination] there is even a risk that
the effects in the field of foreign aid can be undermined or neutralized."
(Proposition 1977/78:135, p. 75).
It is worth noting that the VER system was introduced and admini-
stered by Social Democratic governments from 1965 to 1976 and prolonged and
extended to a larger number of developing countries under later Conservative
and Liberal Ministers of Commerce. The various parties have taken similar
stands on the issue of VERs.
Import of textiles and clothing have nevertheless increased, with
the import share of apparent consumption (home demand) rising from below
30 percent in 1960 to-more than 80 percent in 1978/9. The textile and cloth-
ing industry is a declining industry measured in number of employees and
plants (Table 1). Of the total industrial labour force it employed 7.4
percent in 1970 but only 4.8 percent in 1977. In numbers this means a reduc-
tion between 1970 and 1977 of 25,000 persons or 30 percent of the industry's
labor force. The share of women in the labour force is two to three times
the average for manufacturing industry, and the share of immigrant labor is
also much higher than the average (Table 1).
Effects on Domestic Prices
Suppose the home country, such as Sweden, relaxes a VER on the
foreign country's exports to the home country. How will this action influence
the price of an import competing commodity in the home country?

Table 1 The Swedish textile and clothing industry: number of employees, value added per employee,
number of plants, 1970 and 1977;and share of non-Swedes in the labour force, 1977
ISIC Description Number of employees 1 Value added per Number of plantsCode of which of which non- employee, 1,000
women, % Swedes, Z Skr, 1974 prices 2____________ 1970 1977 1970 1977 1977 1970 1977 1970 1977
321 Textile industry 33,700 23,600 56 50 53.5 118.1 527 398
25
322 Clothing industry 33,900 19,100 74 76 J 41.6 85.2 805 471(wearing apparel)
3 Manufacturing 907,700 890,900 23 23 11 70.1 148.8 13,352 11,383industry
1) Includes white collar workers.
2) Government subsidies are included inthese figures.
Source: SOS, Industri, 1970 and 1977, AKU.

- 10 -
Depending on the characteristics of the market and of the commodity,
four outcomes appear to be possible.
(i) If the commodity is the same regardless of the export market in
which it is sold, we say that the commodity is a perfect substitute in
export markets. For example, Indian shirts exported to West Germany are just
the same Indian shirts exported to Sweden as well as to all other countries on
the world market. This case is characterised by the existence of a world
market for the commodity in question.
(ii) However, if the commodity is differentiated by export markets, we
say that the commodity is an imperfect substitute in export markets. Then in
the extreme case, there is one different commodity assigned to each market.
For instance, the Swedish market is the only market for a particular type of
Indian shirt. Thus, this case is characterized by the home country market
being equal to the world market for the commodity. Increasing the supply of
imports by a given quantity, one will expect the price fall to be greater in
case (ii) than in case (i) as the market to which the given quantity is added
is smaller in case (ii) than in (i).
(iii) Looking at the commodity from the point of view of its user,
it can be a perfect substitute to a domestically produced commodity. In this
case, the "law of one price" prevails, implying that the price of the imported
commodity is the same as the domestically produced one.
(iv) The imported can have a domestically produced imperfect sub-
stitute and then the "law of one price" does not hold. A price increase for
the imported commodity, dp, will result in a price increaseA'/(p of the imperfect
substitute, where 0O.' K 1. The more imperfect as a substitute the domestic
commodity is, the smaller w, will be. The four cases are shown in the matrix
below:

- 11 -
Price clhanige of tbe domestically produced commodity
Substitute in export markets?
Perfect Non-substitute substitute
Perfectsubstitute max
Substituteto dc;T'Cqtjcproduct ion?
Imperfect PAPAP min JP maxsubstitute
O < pj < I O < p< I
The rankings of price changes are:
Pmax p> Pmax > P = Pmin and
Apmax P > P Pmin,
Throughout the analysis we want to assess the maximum influence of a
change in VERs on the price of the domestically produced commodity so as to
arrive at upper limit estimates of the price effect and the employment effect.
In the following we choose our assumptions accordingly. Hence, we will concen-
trate on the two northern quadrants in the matrix although we are well aware
that the southern ones may be applicable in some cases. In fact, the southwest
case, producing the smallest price changes of all four in the matrix, may be a
common one with regard to consumer goods such as clothing.

- 12 -
Perfect Substitute in Export Markets and the Perfect Substitutein Domestic Production (the Northwest case)
The foreign country can either be under VERs on all its export markets
or it may have free access to some export markets. In the latter case, the
VER may only change the country composition of exports. The foreign country
will expand exports in non-restrained markets and take over market shares from
other exporting countries which, in their turn, expand their export to the
VER-imposing home country. For example, India expands its exports to West
Germany where it takes market shares from, say, Indonesia, which expands its
export to Sweden, taking over the former Indian market share. This market
switch effect presupposes, of course, that Indonesia unlike India in our
example, is not under VERs on the Swedish market, and that its short run export
supply elasticity is high. Thus, there will be no effect on the world market
price if this kind of adjustment is possible. In the calculations below, we
may for this reason tend to overestimate the price change.
Regarding our two assumptions in the matrix, one would think that the
assumption about perfect substitutes in export markets is quite reasonable for
industrial countries, in particular for textile products which are inputs in
industrial country clothing industries. However, as almost all industrial
countries restrict imports from developing countries, there has been for some
time (e.g. in Hong Kong, Taiwan, S. Korea and Thailand; see Jenkins, 1980)
a market for "entrance tickets" (licences) to industrial country markets.
When and if there is such trade it means that there are different price tags
on exports to different industrial countries and the assumption about per-
fect substitutability in export markets is not fufilled. In this section we
analyze the case of perfect substitutability in export markets and return to
the case of imperfect substitutability in the next section.
a 13 -
The second assumption about the imported commodity being a perfect sub-
stitute to a domestically produced commodity may well be a reasonable one. In
this analysis we are only considering commodities which are under Swedish
VERs or licenses, and which have been identified at the most disaggregated
level possible,the five digit level, in the Standard International Trade
Classification (SITC). The commodities in question are shown in Table 2.
These commodities may be very close to perfect substitutes. First, at this
low level of aggregation one would expect the included commodities to be
quite similar to each other from the user-s point of view. Secondly, and
more importantly, the selection of commodities to be put under VERs or
licences is certainly not a choice taken at random. On the contrary, it
reveals the preferences on the part of the Swedish government for precisely
those textile and clothing commodities which appear to most threaten import
competing firms. These firms must be expected to produce perfect or very close
substitutes to the VER-commodities. If not, their non-perfect substitutes
would have been under a more normal degree of foreign competition. The
government's choice of commodity groups is, of course, strongly influenced
by the advice of the industry and the trade union. Thus Table 2 demonstrates
the revealed preferences of the people in the industry and the union for close
substitutes to domestically produced commodities.
Under the two assumptions of perfect substitutability and also making
the restrictive assumption that the foreign country is under VERs on all
its export markets, we analyse the effects on price and output in Figure 1.
This Figure shows four interrelated markets. Under our assumptions the home
market price is equal to that in the world market.
- 14 -
Table 2 ?-ice chanses in th. case of perfect subst:tute in eapoort rarkecs and perfect susrcitute ;raonecstc procuction
(1) ( ) t3s ( Z~~~~~~~0 (5} 5 (7)Maxinu price fall (percen:)with a ;'J Z export increase Imports from V'ER-countries ) Sweden's share cf
from .EP.-zountries 1977. 1000 US (S) OECD's import (percenc)
To the OECD area .o Swenel To the OECD area To sweden [(6)/(5)] x 100
Code-) Descriotion _973 1977'
65142 Co:toc yarn and threadput up for retail sale 0.6 0.02 62,20; 7,013 11.3
65212 Terry 'abrics of cotten,unbleached 3.0 0.2. 5,030 113 2.3
65222 Terry 'abrics or cotcon,bleached, dyed, etc. 5.6 0.54 24,826 1,462 5.9
65223 Pile and cbenille fabricsof cotton 1.2 0.10 551,622 19,639 3.6
65229 Other cotton fabrics,voven.bleached,dyed,ett. 0.6 0.20 1,698,008 51,645 3.0
65321 Tabrics,voven,of vDOl or offine animal hair, other 0.8 0.00 869,512 19,469 2.2
than pile and chenillefabrics
65331 Fabrics,woven,of flax or ofranie 0.0 0.00 75,121 4,695 6.3
65351 Pabrics,voven,of continuoussynthetic fibres,other than 2.0 0.02 903,262 19,717 2.2pile or chenille fabrics
65352 Fabrics,woven,of discon-tinuous synthetic fibres, 4.6 0.14 1,564,202 42,828 2.7ocher than pile or chenillefabrics
65361 !abrics,woven,of continuousre;eners:ed fibres,other .1.0 0.00 259,535 5,770 2.2thaa pile or chenille fibres
65401 Narrow fabrics other thanwoven labela,badSgs,ect. 4.6 0.02 133,561 5,989 4.5
65404 Tulle and other net fabrics,plain 3.6 0.16 11,801 297 2.5
65550 Elastic fabrics and tri:- Inions uf elastic (excludins 0.6 0.00 41,406 786 1.9knitted or crocheted goods)
65561 Cordage,cable.rope,cwine 7.2 0.20 227,344 7.050 3.1
65562 Sets and netting of cordage, 7.2 0.24 60,163 2,407 4.0etc.
65661 Blankets and travellingrugs of wool 0.2 0.00 23,666 683 2.9
65662 Blankuts and travellingrugs of cocton 6.6 0.12 15,730 235 1.5
65669 Blanlets and travellitgrugs, n.e.s. 0.8 0.28 59,738 4,435 7.4
65691 Linen and other furnishingarticles of testila fabrics 9.8 0.58 944,396 53,828 5.7
84111 Men's and boys' outer gar-nents,nor knitted or 14.2 0.26 3,755,315 200,340 5.3
:rcbheted
84112 Vonme's,girls' and infants'oucer garnants,not knitted 14.0 0.24 4,466,137 207,674 4.7or crocbeted
84113 Men's and boys' under sar-mcn:s,not knitted or 35.2 o.38 1,274,718 40,087 3.1crocheted
84114 Wcien's,girls' and infants'under garnenta,sot knitted 20.6 0.08 156,221 1,9;2 1.3or crocheted
84142 Stockings,etc. ,knitted orcrocbeted,not elastic nor 10.5 0.16 292,159 20,183 6.9rubberized
84143 Under garnents,knitted orcrochated,noc elastic nor 18.8 0.14 1,900,118 58,522 3.1-ubb.rizec
8;144 Outer garment;,'aitted orcrocheted,not elastic nor 13.8 0.14 4,912,049 203,526 4.1
runberezed
Total conodicy groups above 12.0 0.22 24,265,343 980,330 4.0
1) SUDject to VERs or on icOort licence at least one year. 2) SITC Rev. I all years.3) VE8 countries 1977; Por:ugal, Singapore. jugoslavia, Macao, India, S. rorea hong Korns. Malaysia, Tatwan,
Pakistan, Malta, Thaiiaad, .'auriLtus and S-i Lanka.

- 15 -
When the foreign country is being subjected to an additional VER,
or increased stringency in an existing VER, the foreign country changes its
exports supply curve into a vertical line in the relevant interval and reduces
exports from q to qF in Figure 1:1. 1/ The VER-imposed change in export
supply gives the world export supply curve a kink beyond which the world
supply curve is steeper than before (Figure 1:4). The traded quantity on the
world market decreases by q - q- , and the world market price increases by
P1 - pO. The group of exporters of the country under the VER will increase
their producers' surplus by area A but lose B. (If area A is larger than B,
the foreign country will have made a net gain by the home country imposing
a VER. This could be relevant when the foreign government would not have been
able to enforce an export tax, or the exporters of the foreign country would
have been unable to form a supply restricting cartel.)
The exporters of the rest of the world will gain area C, that is,
they gain from the "trade diversion" of VERs. In the VER-imposing home coun-
try import competing producers will gain D and consumers will lose D plus E.
(Note that S (D) in Figure 1:3 is a domestic supply (demand) curve while in
Figures 1:1, 1:2 and 1:4 the supply curves are export supply ones.) Finally,
all consumers of imports will lose the consumer surplus represented by F. 2/
How can the impact of a VER on price be measured more precisely? Con-
sider three markets. First, the supply of quantity qF from a country under VER,
1/ In Figure 1 the initial situation is depicted as one in which therestrained export supply at p equals the non-restrained export supplyat po.
2/ In Figure 1 it is implicitly assumed that any income changes are sosmall that they can safely be ignored and that demand only depends onprice.

l'igure 1 Perfect substitute on export markets andfor domestic production
Foreign country under Rest of the world VER-imposing home country World marketVER
p p X s p X s
sos
p 0 'a~~~0D
A c D--- E - - - / f B
q q~~~~~~~~~~~~~~~~~~~~~~~~~'
qF qF qR qR qH qH ~q
1:1 1:2 1:3 1:4
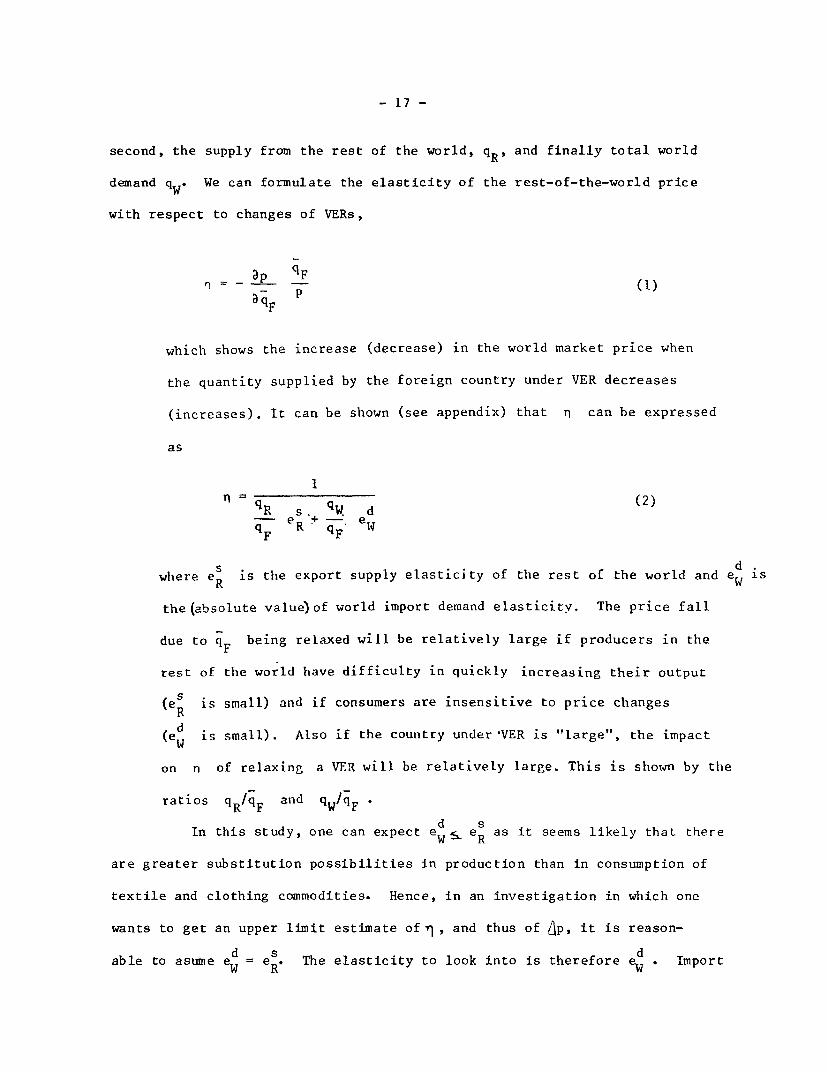
- 17 -
second, the supply from the rest of the world, q R and finally total world
demand qW. We can formulate the elasticity of the rest-of-the-world price
with respect to changes of VERs,
-p qFa- paqF
which shows the increase (decrease) in the world market price when
the quantity supplied by the foreign country under VER decreases
(increases). It can be shown (see appendix) that n can be expressed
as
1
qR s. qW d (2)- e + - eqF R q l
F F.
where eR is the export supply elasticity of the rest of the world and ed is
the(absolute value)of world import demand elasticitv. The price fall
due to qF being relaxed will be relatively large if producers in the
rest of the world have difficulty in quickly increasing their output
(eS is small) and if consumers are insensitive to price changesR
(ed is small). Also if the country under-VER is "large", the impact
on n of relaxing a VER will be relatively large. This is shown by the
ratios qRIqF and qW/qF
d SIn this study, one can expect eW _ eR as it seems likely that there
are greater substitution possibilities in production than in consumption of
textile and clothing commodities. Hence, in an investigation in which one
wants to get an upper linit estimate of- , and thus of ip, it is reason-
d s dable to asume eW = e R The elasticity to look into is therefore eW Import

- 18 -
demand elasticities have been estimated at the disaggregated level for
textiles and clothing (Kreinin, 1973, Stern et.al, 1976, Hamilton, 1980).
For textiles the estimates are found in the interval 0.8 to 3.0 with large
importers like the U.S., U.K. and France being found in the interval 1.14 to
3.0. For clothing the few estimated import demand elasticities are higher,
2.4 to 3.9 in Sweden and the US respectively. 1/
It has been suggested that elasticities at a disaggregated
level are larger than at a more aggregated level. In consumption it is easier
to substitute, for example, between different kinds of clothes than between
clothes and other goods. In production, it is likewise easier to switch from
producing one textile or clothing commodity to another than from clothing,
say, to other manufactured goods. These are arguments for our elasticities
being lower limit values leading to -n being on the high side.
To undertake the empirical test, the commodity groups under
VERs, or subject to import licences, were classified from the CCC into 26 five
digit SITC commodity groups. The CCC code is more disaggregated than our five
digit SITC groups, and our 26 SITC groups may include some commodities not
subject to VERs or licenses. However, we have little choice but to use the
SITC classification as international trade statistics are not compiled on a
CCC basis.
In Table 2 we have estimated for each commodity group the maximum
price increase due to a 50 percent export increase from VER-countries to
Sweden, employing import demand elasticities estimated for the more aggregated
1/ These estimates have been arrived at by using an implicit assumption ofnon-perfect substitutability between home and foreign goods. Had thecommodities in fact been perfect substitutes, our method of estimationwould work against high elasticities being assessed. If anything, thiswould result in a bias in the desired ("upper limit") direction in ourestimates.

- 19 -
groups, textile and clothing (see below). The estimated price change in Table
2, column (4), is
A~ 0.5 qSWEAqF F05 (3)
AP= n1qF qF
Where qSWE are the Swedish imports of the commodity group from VER countries
during the year in question. The following assumptions are made:
s d(i) For commodities belonging to SITC 65, eR = eW = 0.8 and for commodi-
s dties belonging to SITC 84, eR = eW = 2.4. In picking the lower bound estimates
we tend to overestimate the price increase.
(ii) The definition of qF is taken to be the export to the OECD countries
from all countries which were subject to VERs imposed by Sweden during the
particular year in question. (This implies a slight underestimate of the true
qFt as the export to OECD is a subset of world exports.) The definition of qR
is taken to be total exports to the OECD countries, qw, minus exports from
the VER-countries, qF (this is also a slight underestimate).
(iii) We assume that when VER countries increase their export to the OECD
markets, other countries do not decrease their export in response, that is, by
assumption there is no reversed "trade diversion" effect when increased
VER-exports are allowed into the OECD markets. This assumption is again made
so as to produce - if anything - an upward bias in the price change. If there
is reversed "trade diversion", which seems likely, the additional supply on
the OECD markets would be smaller than the additional supply from VER
countries.
(iv) dqF is defined as a 50 percent increase in Swedish import from coun-
tries under Swedish VERs during the particular year in question. (The number

- 20 -
of countries under Swedish VERs increases during the period from nine to
fourteen; footnotes 3 to 6, Table 1). A 50 per cent increase can be regarded
as an extraordinary liberalization of Swedish VERs. In fact the increased
supply may be such that the "rent" on export licences in exporting countries
may disappear altogether on some commodities.
From Table 2 we can see that under these assumptions the estimated
price fall in no case exceeds 0.6 percent for any individual commodity group
in 1977. Taking a weighted average indicates that the Swedish import price for
the commodity group SITC 65 and 84 combined would fall by only 0.14 percent in
1977. As Sweden is a small country, a low figure is indeed what one would
expect.
It is remarkable to realize that in this case, even if exports to
Sweden from VER-countries would have increased by 100 per cent the price fall
would exceed 2 percent in only two cases, notably, SITC 65222 (2.12 percent)
and SITC 65691 (2.32 per cent). For the large clothing groups, SITC 84111,
84112 and 84144, the price fall would be less than 0.5 per cent. Under the
stated assumptions, what Sweden alone does with its VERs has little effect on
its consumers and producers, although it may affect some producers margin-
ally. 1/
Looking back at the situation during the 1970's, Swedish producers
may have been protected somewhat in the short run insofar as exporters' and
importers' adjustment costs for circumventing the VERs were reflected in
higher prices on the Swedish market. To keep changing the "rules of the
1/ In the unlikely event that Sweden's example was followed by otherNordic countries the relevant AqF would be at most be double the onein Table 2.

- 21 -
game", that is, the mix of commodities under VERs as well as the number of coun-
tries under VERs, means increased costs for exporters and importers. This may
have temporarily allowed Swedish import competing producers to sell domes-
tically at a price above the world market level. The VERs would thus have
resulted in a pure waste of resources to the extent that the government could
have achieved its objectives through less resource-consuming instruments. 1/
The previous analysis needs a further qualification because input-
output relationships have been ignored. As the prices of textiles fall
because of relaxed VERs, and as textiles are inputs into clothing production,
the price of clothing could fall more than has been indicated above, and/or
domestic producers could have a higher output of clothing. How important is
this input-output relationship? Imports of textiles (here defined as CCC
50-59 and 60.01) from developing countries accounted for only 9-10 per
cent (1976 to 1978) of textile imports. The percentage of the market is, of
course, even smaller when domestic production is also included. Hence, a 50
percent change in developing countries exports of textiles is relatively
"small" and is unlikely to improve significantly the competitiveness of the
Swedish clothing industry. This is also the impression obtained from discussions
with clothing manufacturers. Henceforth, we ignore this input-output relationship.
1/ For example, a higher direct employment subsidy, provided that the sub-sidy has a lower distribution cost than the above-mentioned adjustmentcost. However, having once introduced such a subsidy it may be politic-ally almost impossible to withdraw it, and it may be easier to withdraw,or simplify, the less "transparent" system of VERs. Hence, considering alonger time perspective it is an open question as to which policy is theleast resource consuming. An important difference between the two policiesis, of course, that consumers will pay lower prices, but higher taxes withan employment subsidy system.

- 22 -
The method of estimation used above can be employed with regard
to all OECD countries combined. Suppose that the VER-countries mentioned
in Table 2 increased their exports to the whole OECD area by 50 percent.
How would that affect the world market price given the two assumptions above?
The pLikc change would be
O. OECDAP = n qF = 0.5 n . (4)
OECD
as qF = q . The VER countries' export to the world market is approx-
imated by their export to the OECD countries. The price changes are shown in
column (3) of Table 2. In one case such an export increase would reduce the
price by more than 30 percent (SITC 84113), and for the three largest commod-
ity groups (clothing), representing 54 percent of OECD's imports of VER
commodities, the increases are approximately 14 percent. Such price falls
are likely to have a substantial negative effect on employment in the OECD
countries' textile and clothing industries. This should be balanced against
the gain on the part of OECD's consumers and the employment opportunities and
export earnings gained in increased exports to the developing countries
concerned.
A 50 percent increase in value terms in VER exports (as defined in
Table 2) to OECD would increase VER-countries export earnings by $1805 million
in 1977: Export earnings increase because of the 50 percent increase in
supply (0.5 x $5.64 $ million), but this increase is partly offset by a fall
in price - 12 per cent - on the VER-countries' present "stock" of exports and
export increase [1.5 x 5.64 x (1 - 0.12) $ million]. Thus the 50 percept

- 23 -
increase in supply is estimated to result in 32 percent increase in VER-coun-
tries' export earnings in the OECD markets in 1977, that is, one percent in-
crease in export supply results in an 0.66 percent increase in export earnings.
Note that Swedish import-competing producers would be hit much more
by a 50 per cent export increase to the whole OECD area than by such an export
increase to Sweden only.
It may seem that the modest price falls of Table 2 cast doubt on the
idea that imports from developing countries "disrupt markets", an argument
often heard from proponents of VERs. First, it should be realised that the
experiment we are undertaking is a "one shot affair" of increasing VER imports
one year. (We are not increasing imports by 50 percent in 1974 and from this
higher level in 1975 increasing imports by a further 50 percent, etc.).
Successive import increases would, of course, have a much larger impact on
prices and employment in the import competing industries. Second, in this
section we have employed an assumption of commodities not being export market
specific. In many cases this may be a poor assumption and produces too small
a price change. Therefore, in the next section we investigate the price
change when commodities are assumed to be export market specific.
The Non-substitute in Export Markets and Perfect Substitutein Domestic Production (the Northeast case)
The Northeast case gives an upper limit estimate of the pr.ice change
of the imported commodity in the home country, that is, the price relevant to
home country producers. We denote the relevant elasticity by "j,
1n = -SWE
q e s (qH eqF d-SWE eH+ -SWE -HqF qF

- 24 -
-SWEwhere qH is domestic production and qF are imports from VER countries to
Sweden. eH and ed are the home country domestic supply and demand elastici-H H d
ties, respectively. Again taking es > e and again making the conservative
s d dassumption of eH = e , allows us to compute e as there is a relationshipH H H
between the domestic supply elasticity, the domestic demand elasticity and the
import demand elasticity. 1/ In this instance, we were able to calculate Ap
on commodity groups classified according to the CCC nomenclature. The results
are reported in Table 3 for three years. As an illustration the encircled
price change is derived step by step in the Appendix.
The price of textile commodities under VERs would fall by as much
as 20 per cent if imports were relaxed in the way we have described. (Depend-
ing on the year in question, the textile group "cotton fabrics" (SITC 65229)
d d d s s d t t 1/ The relationship is eW = eH a + eH a , where a is the inverted share of
imports in domestic demand and a is the inverted share of imports indomestic supply (see Kreinin (1975), Appendix III).
a and a were calculated for SITC groups 65 and 84 separately andfor each year. The source was Swedish industry statistics (it is compiledon a CCC basis as well as on ISIC and SITC. SOS Industri, Parts 1 and 2,yearly). As estimates of import demand elasticities we employed 0.8 forSITC 65 and 2.4 for SITC 84 (see above). With these data we
calculated the following values for edH
1973 1974 1975 1976 1977eH(SITC 65) 0.4 0.4 0.4 0.5 0.5eH (SITC 84) 0.8 0.8 0.9 1.3 1.4
- 25 -
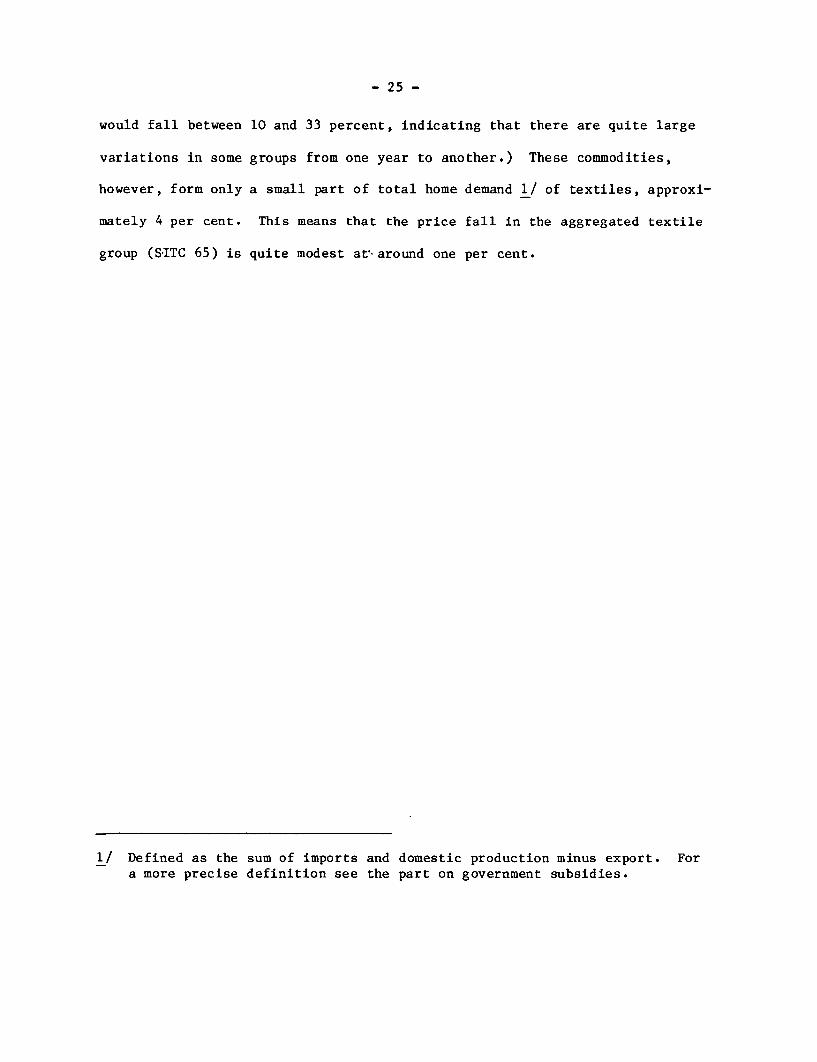
would fall between 10 and 33 percent, indicating that there are quite large
variations in some groups from one year to another.) These commodities,
however, form only a small part of total home demand 1/ of textiles, approxi-
mately 4 per cent. This means that the price fall in the aggregated textile
group (SITC 65) is quite modest at around one per cent.
1/ Defined as the sum of imports and domestic production minus export. Fora more precise definition see the part on government subsidies.
- 26 -
Table 3 Price changes in the case of non-substitute in export markets and perfect substitute for domestic production.
(1) (2) (3) (4) (5)Maximum domestic price fall (percent) Share of total
Corresponding with a 50 percent export increase VER irpor-t ic,
CCC Code) sitC Code Description from VER-countries Sweden (1976)1973 1975 1977
5104 200 653511 Fabrics, woven, of continuous synthetic 0.0
306-309 65351 fibres, other than pile or chenille 1.4 0.2
406-600 65351 fabrics 1 5) 1.7 1.0 0.0
653611.1.1. 00
706-709 65351 4) 0.0
906-909 65351 4) 0.0
5311 all 65321 Fabrics, woven, of wool or of fine 2.3 4) 0.0animal hair. other than pile andchenille fabrics
5405 903-906 65331 Fabrics, woven, of flax or of ramie 0.5 0.3 4) 0.0
Cotton yarn and thread put up for5506 900 65142 retail sail 2) 2) 2)
5508 900 65212 Terry fabrics of cotton, unbleached 1.9 2.8 6.4 0.065222 Terry fabrics or cotton, bleached, |
dyed, etc.
5509 203-209 65229 Other Cotton fabrics, woven, bleached, X3 2 .9 6) 20.7 9-7 4.5
803-809 65229 dyed, etc. 6.3 0.2
5607 106+606 65352' 10.5 0.2
107+607 65352 Fabrics, woven, of discontinuous 4) 0.0
103+108+608 65352 synthetic fibres, other than pile 7) 2.8 0.2
205+206+705 65352 or chenille fabrics 12.7 11.6 12.4 0.5
207+707 65352 0.3 0.0
706+708 65352 0.3 0.0
301+302+803 65352 6.1 0.3
306+307+807 65352 4) O O
911+990 65352 J 4) 0.0
5804 500 65223 Pile and chenille fabrics of cotton 6.5 16.7 23.5 0.4
5805 002-009 65401 Narrow fabrics other than woven 0.1 0.1 0.2 0.0
2labels, badges, etc.5808+58092) 65404 Tulle and other net fabrics, plain 1.2 26.2 18.5
5904 all 65561 Cordage, cable, rope, twine 16.7 13.3 7.5 0.4
6201 all 65661 Blankets and travelling rugs of wool [65662 Blankets and travelling rugs of cotton 7.9 9.4 0.2
65669 Blankets aud travelling rugs, n.e.s. J "v
6202 110+1090 656911 Linen and other furnishing articles 2) 2)25
190) 65691 articles of textile fabrics 10.8 2) 22
.5 2.32) 656 !,t l: 10.89)~~~~~~2)65.
311-3992) 65
6 91 2) 65.9
6003 003-109 84142k Stockings, etc., knitted or crocheted, 438) 4.4 2.5
902-909 84142 not elastic nor rubberized 0.2 0.2
6004 all 84143 Under garments,knitted or crocheted, 4.0 4.1 4.3 5.7not elastic nor rubberized
6005 3) 302-309 84144 Outer garments, knitted or crocheted, .16.1 7.4 11.9 13.5
602-609 84144 not elastic nor rubberized 1.2 0.8 0.9 0.7
802-896 84144 7.5 0.9 4.2 3.3
6101 all 84111 Hen's and boy's outer garments, not 5.7 6.5 6.1 26.2knitted or crocheted
6102 all 84112 Uomen's, girls' and infants' outer 6.5 6.9 8.8 28.2garments, not knitted or crocheted
6103 102-209 84113l Men's and boys' under garments, not 29.1 20.5 16.1 10.084142J knitted or crocheted
6104 102-109 84114 Women's, girls' and infants' under 11.0 3.4 5.6 0.3garments, not knitted or crocheted
100.0
Weigbted dp of above groups from SITC 65 23.2 16.6 20.0
_ .' - 84 10) 10.9 8.6 8.7
Weighted ap of total home demand of SrTC 6510) 1.3 0.8 0.584 10) 1.3 1.2 1.7
1) Commodity groups in which there is no import in any year have been excluded.
2) No domestic production.3) No domestic production in some subgroups 1976.4) No import.5) Refer to CCCN group 5104. 6) Refer to CCCQ group 5509. 7) Refer to CCCN group 5607. 8) Refer to CCCN group 6003.
9) Refer to CCCN group 6202.10) VER-commodities share of home demand (per cent): 1973 1975 1977
SITC 65 5.4 3.1 3.184 12.3 14.3 19.7

- 27 -
The price fall for clothing commodities under VERs would be 9 percent
on average. The two large groups containing "outer garments" (SITC 84111 and
84112) are slightly below the average price fall. The price fall for the
whole clothing group SITC 84 combined would be approximately 1.5 percent.
Remembering that, if anything, we overestimate the price falls, these
results point to price falls in the home country market that are fairly modest
given the restrictive assumptions. They also point to overall consumer losses
due to VERs being smaller than widely believed. Note, however, that for some
commodity groups the price fall would be very substantial had VERs been
relaxed.
The VER countries' potentially increased export earnings are estimated
to be for SITC 65 $49 million in 1977, and for SITC 85 $271 millions in
1977. This means 33 percent increased export earnings for the VER countries
in the Swedish market.
Effects on Domestic Employment
A. The overall effect. Suppose imports from VER countries
increased by 50 percent as described in the previous section. What would be
the effect on employment in the textile and clothing industry?
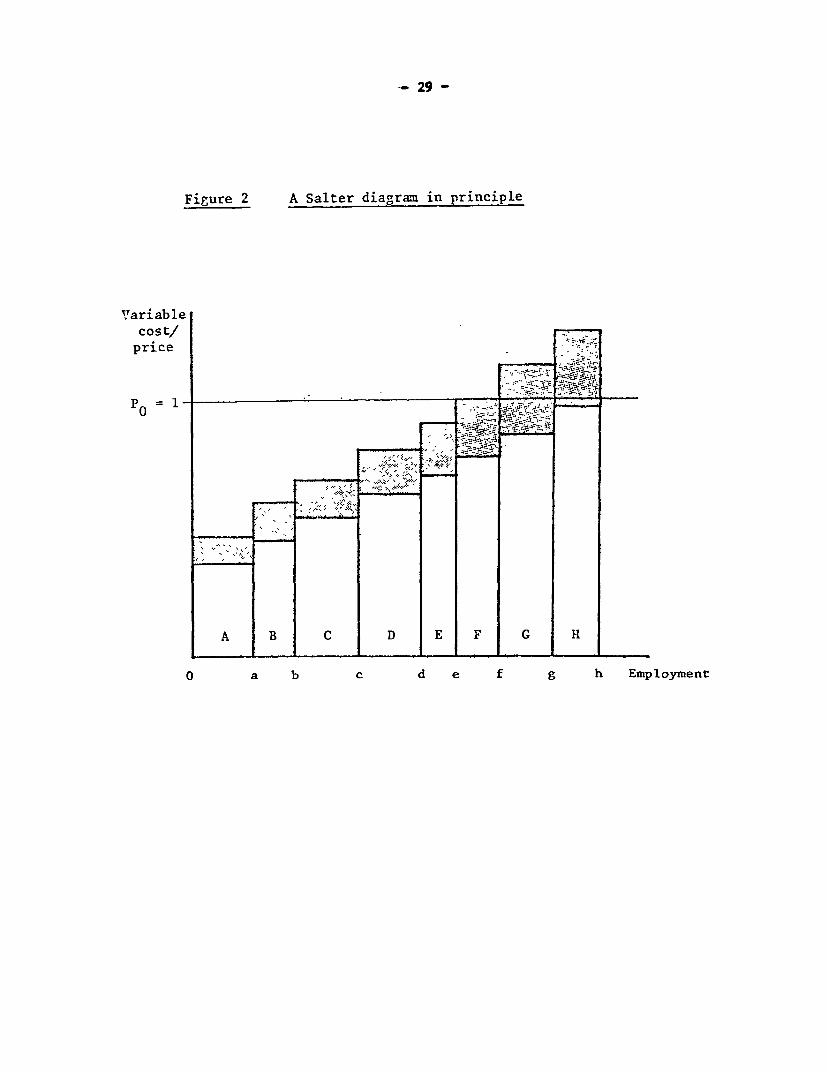
To try and answer this question we applied industry data to a model
of the Salter (1969) type. This class of models focuses on efficiency differ-
ences between production plants within an industry. Some plants are older and
technically less efficient than the more modern ones. Alternatively put,
plants with comparably low productivity have higher variable costs per unit of
output than more efficient, modern plants. In principle, a plant will have to
close down when (private) variable cost exceeds price. 1/
1/ I have only come across one other paper which uses a Salter approach to atrade problem; R. Webb (1975) looks into intra-industry differences ineffective protection.

- 28 -
In Figure 2 we have ranked the plants along the horizontal axis with
the most profitable ones closest to the origin. Profitability is indicated
along the vertical axis and is measured as the variable cost share of price.
At price P all units run without (private) loss (no non-shaded pile crosses
the price line) and employment is Oh. However, if producers' private costs
increase by the shaded areas, for example, because government subsidies are
withdrawn, units G and H will have to close down and fh individuals will face
unemployment.
Some simplifying assumptions are embedded in the above reasoning.
First, all plants are assumed to encounter the same price on variable factors
of production. This -is likely to be a very fair assumption with regard to
;labour: in Sweden with the trade union movement's "solidarity wage policy" and
the count-ry's very centralized wage bargaining system (Lindbeck, 1975)..
Secondly, the reasoning rests upon an assumption that plants are
price takers and cannot escape a closedown by increasing the price of output.
This is a very reasonable assumption to make for this industry during the
period under study.
Thirdly, all plants are assumed to produce one homogenous good. This
assumption is not fulfilled in our case and plant managers may resort to
changing the product mix to avoid closing down. Disregarding this adjustment
possibility might lead to an overestimate of the effect on employment.
Fourthly, plants may be able to avoid a closedown through increased
efficiency without investment, for example, by reduced "slack" and "x-inefficiency
- 29 -
Figure 2 A Salter diagram in principle
Variablecost/price
Po 1- .. ,. . -- -,0
0 ~a b c d e f g h Employment

- 30' -
and possibly through "learning-by-doing". Again, disregarding this possibility
might lead to an overestimate of the employment effect of the subsidies. We
will investigate this issue.
From the basic industry data, we gathered information on the share of
variable cost for each production unit in the textile industry (ISIC 321) and
in the clothing industry (ISIC 322). 1/ For each industry and year a Salter
structure was derived. Figure 3 shows Salter diagrams of the clothing
industry as examples for 1972/3 and 1976. The steeper "stair case" of 1976
indicates that the industry has become, at the margin, less employment sensi-
tive, for example, to foreign competition, and also that the industry has
declined.
Looking at the data f-or each year and industry it is seen that .some
plants cannot cover their variable costs. If there were no adjustment possi-
bilities for these plants, they would close down and, as a consequence, a
certain number of individuals would become unemployed. Comparing this ex ante
estimate of employment decline with the ex post decline should reveal the
extent of adjustment possibilities. Contrary to our presumption it was found
that there was very little difference between the ex ante and ex post employ-
ment figures (3 percent) and that this difference was the same for both
industries. Both the textile and the clothing industry seem to have had
similar but small possibilities of avoiding dismissing workers through such
measures as a change in product mix or reduced "slack" in organization.
To investigate the employment effect of increased VER-imports, the
experiment we undertook was to lower the average price of output by an amount
1/ Head offices and plants under start-up conditions are excluded.

Figure 3
A Salter diagram in practice: The clothing industry 1972/73 and 1976
Laoour cost/value added(percent) 1972/73
100
90 197 v--
80 -
70 -
60 -
50 I
40 -
30 -
20 -
10- J I 2.9
5 10 15 20 25 Employment(thousands)
Source: Heikensten (1979) from Bearbetning av primarmaterialettill SCB, Industristatistik, 1972 och 1976.

- 32 -
equal to the price cut for the whole industry combined, caused by a 50 percent
increase in VER-imports. The price changes were taken from Table 3 and
weighted to an industry average by the commodity groups share of home demand.
The resulting estimates of potential unemployment are given in Table 4.
It turns out that under our assumptions, which if anything, tend to
overstate the employment fall, on average approximately 1,000 people in Sweden
would have become unemployed if VER imports had increased in one year by 50
percent. In 1974, more than 2,000 man years would have been lost compared to
less than 400 in 1976. Of these potentially unemployed, a majority, approxi-
mately 60 percent, would work in the clothing industry and a majority would be
women. This increased unemployment constitutes about 0.03 percent of the
total Swedish labour force.
B. The regional effect. It is an advantage of our approach that
once the Salter structure has been calculated it is simple to investigate
the regional distribution of the potential unemployment. Among the data col-
lected, those on the location of plants are probably the easiest to find. 1/
Table 4 shows the potential unemployment impact on Alvsborgs county, the
region in which the two industries are heavily concentrated.
The impact on that county varies very much from one year to another.
It is interesting that only during one year (1974) would the potentially
unemployed constitute more than one percent of the total employed labour force
in this region.
1/ Provided they are kept secret from competitors.

Table 4 Predicted number of man years lost if VER imports increased by 50 per cent in the case of
non-substitutability, in export market-s
(1) (2) (3) (4) (5)
Predicted number of man yearsPredicted number of man years lost* lost as per cent of total
number of employed individuals**Textile Clothing Total of which in
Year (321) (322) (321+322) Xlvsborgs county, Z Total Sweden Xlvsborgs county
1973 337 677 1,014 40 0.03 0.23
1974 816 1,419 2,235 90 0.06 1.07
1975 648 153 801 69 0.02 0.29
1976 10 376 386 26 0.01 0.05 w
1977 105 576 681 16 0.02 0.06
' Note that one should not aggregate over time the predicted number of man years lostas the experiment is a "one shot affair" during any of the years.
"*Excluding agriculture.

- 34 -
Regional concentration does not necessarily imply a severe unemploy-
ment problem. If the declining industry is concentrated in a booming region
there may be little problem compared to the closedown of a single small
factory in an already severely unemployment stricken region. In the Swedish
case, Alvsborg's county is also a region with relatively high unemployment.
If imports increased, the stock of unemployed individuals would rise by 19
percent (average), the highest figure among all the 25 counties. The regional
dimension of the employment issue is further analyzed below.
III. GOVERNMENT SUBSIDIES
The Data
Data on-subsidies to the textile and-clothing industry were taken
from a study undertaken at the Swedish Board of Industry by P.G. Nyberg
(Nyberg, 1978). The study covers the fiscal years 1971/72 to 1977/78 (a
fiscal year runs from 1.7 to 30.6 the following year). Some of these subsi-
dies are euphemistically called loans and they have been placed among the
subsidies in order to distinguish them from "true" government loans. The
latter have been placed at the end of Table 5. Even in the true loans there
is a grant element but henceforth we disregard this though this means that
total government subsidies to the industry are somewhat underestimated. 1/
The number of subsidies is large, 23 in all. Some can be said to
conform to market mechanisms, for example, "subsidies to make firms merge
1/ A precondition for obtaining a true government loan is often that theloan application first has been turned down by the commercial banks.Secondly, the rate of interest is often below the market rate.

Table 5 Subsidies paid out to the Swedish textile and clothing industry, - 35fiscal years 1970/71 and 1977/78
1970/71 1977)78Sv crowns Share of Sv crowns Share of
Type of subsidy and loan (thousands, total subsidies (thousands, total subsidies
current prices) (per cent) current prices) (per cent)
Exp rt pro-otion 3535 19.8 17701 3.5
1. Firm-specific 2468 13.9 9943 2.0subsidies
2. Industry 801 4.5 6307 1.2subsidy
3. Export consultants 192 1.1 1400 0.3
4. Other 74 0.4 46 0.0
Training and15ustment subsidies 2182 12.2 70795 13.9
5. Educatona 1018 5.7 2500 0.5
6. Firm-specific 0 4900 1.0adjustmer.t
7. Subsidies to rLake 0 2000 0.4firms merga orcooperate
8. Industry subsidy 0 3000 0.6
9. Refunded interest 0 1000 0.2payments andhonoured gua:antees
10. Specially refunded 0 35800 7.0
interest payments andbonoured guarantees
11. Efficiency inczea3ieg 0 15700 3.1subsidies
12. Research and 1164 6.5 5895 1.2Development
Subsidies to maintain 0 116300 22.9r2 paredness in case otblocked inports
13. Subsidies conditioned on 0 76000 ILmaintaining a certain levelof production
14. Investment subsidies 0 30400 6.0
15. Ccvervrent procurement 0 9000 1.8subsidy
Regional subsidies 12100 67.9 2950 0.6
16. Subsidies to firms in 6400 35.9 9001 0.2
depressed areas, includingsubsidies to encouragefirm. to move
17. Introduction and 4300 24.1 18001 0.4cducation subsidies
18. Pure employment subsidy 1400 7.9 U.S.
19. Transport subsidy to 0 250 0.0firms in the nortb
Laboir Market subsidies 0 300670 59.1
20. Subsidies to labour 0 227300 44.7over 50 years of age
21. Subsidy to training 0 60930 12.0when unemployment isthe alternative
22. Subsidies to firms 9440 1.9chreatened by clo'edonv
23. Special employment subsidy 0 3000 0.6
TOTAL 17817 508416
TOTAL in fixed (1974) prices 23851 377163

- 36 -
Table 5 (continued)
24. Environmetal and enorgypolicy neasures includingsubsidies to envirormnetitnproving activities, Up to 31.12.1977: Approximataly 3 million Sw. crowns
reduced energy tax. andsubsidies to energy-savinlg activiries
Loan and credit zuarantees
25. Cuarantees for industry 3850 172701
loans
26. flandicraft and industry 30O03 119004
loans
272. Covernaunt banks' loas 0 93200.
28. Export credit guarantees 1400 S6005
29. Tariff reduction on inported y s y.textile machinery
TOTAL 8250 127970
TOTAL in fixed (1974) prices 11044 94933
1) The period 1.7-31.12.1977 only2) " " 1.7.1977-31.31978 only3) The calendar year 19724) o I " 1977, includes the leather and leathergoods industry
5) The fiscal year 1976/77

- 37 -
or cooperate", "efficiency increasing subsidies" and retraining subsidies.
However, the explicit objective of several subsidies, such as the "the
regional" and the "labor market" subsidies, is to soften the impact of
market forces on employees in industry.
Economists often worry about industry subsidies being difficult to
withdraw once they have been introduced even if the primary cause is elimi-
nated. From this point of view the "subsidy to labour over 50 years of age"
should be comparatively attractive as it will eventually cease, provided no
new commitments are made. The subsidy also goes to a category within the
labour force which has comparatively serious difficulties in retraining and
moving. Finally, the "national defence" subsidies are intended to help
maintain a certain level of domestic production.
During the period covered by Nyberg's study, subsidies increased
more than 15 fold in constant fixed prices. Note, however, that the end year
was exceptional (Figure 4 and Appendix-Table 1). The sharp increase in 1977
can be explained as a government response to the dramatic fall in the com-
petitiveness of Swedish industry after 1975, in spite of three successive
devaluations in 1976 and 1977. The weakened competitiveness is illustrated by
the increase in the aggregate labour costs for Swedish industry relative to
foreign competitors (Figure 4). 1/ The increase in subsidies lagged behind
1/ Sweden can be regarded as small open economy. It maintained a fixedexchange rate up to 1977. Employment, the overall level of production,and investment in the tradable sector will depend mainly on relativelabour cost per unit (wages and salaries constitute 85-90 percent of theSwedish GNP). When the relative labour cost rose in the mid-seventiesso did subsidies to industry as the government tried to keep down openunemployment.

- 38 -
Figure 4 Subsidy and relative labour cost per unit of output 1973-77
Index 1977293
Ill
150- 1 SubsidyI per unit of output
140-
130- I
I120-I
Labour cost Der unit nf output.Xelative.. to foreign
10 Icompetitors
100100 74 75 7f 77
90- -
80-
\ ~~~/70 -1
60 -
50 -Iv
40 t
Source: Svenska Handelsbanken for relative labour cost.

- 39 -
the rises in relative labor cost and the devaluation had no apparent
effect on subsidies.
The data on subsidies were used to answer two questions. What
would the volume of imports have been in the absence of subsidies? What
impact did subsidies have on employment in the textile and clothing indus-
tries?
Import Volumes and Domestic Prices in the Absence of Subsidies
To appraise the effect of subsidies on the volume of imports we
estimated an import demand function for textiles and clothing. The estimated
equation was then used to simulate imports for 1971-77.
The import demand function is
Qm f(pm, Pd' s, A) (6)
where Qm is imports in volume terms, pm is the import price, Pd is the domes-
tic price, s is a subsidy variable, and A is a variable reflecting the level
of economic activity. The estimated equation is based on yearly data for the
period 1960 to 1977.
The Price variable. Prices for 1960 onwards at a disaggregated
level (SITC commodity groups 65 and 84 combined) were taken from Hamilton
(1980) and extended to 1977.- .The relative price is the ratio between (i) the
commodity price "on the quay" including the tariff, pm, and (ii) the price of
the domestically produced good "at the factory gate", P d. The specification
implicitly assumes that markups, and so on are proportional to price.
Our formulation of the import demand function with two prices implies
an assumption that the imported and domestically produced commodities are

- 40 -
imperfect substitutes. This assumption however, does not clash with the
belief that the commodities of Tables 2 and 3 being perfect substitutes.
These commodities constitute only a minor part of SITC 65 and 84 combined
(19 percent in 1977), and there is little reason to think that all commodities
in SITC 65 and 84, but not in Tables 2 and 3, would be perfect substitutes.
The Activity Variable. As the activity variable we used the domes-
tically produced part of home demand (apparent consumption) of textiles
and clothing. Actual figures were used to represent the domestically pro-
duced part of the home demand 1971-77.
VERs. How do VERs influence our estimation? Very little, as they
infl-uence domestic prices only marginally. Asqa further check we ran the
import demand function with:.a dummy variable for the VER-years. The coeffi-
cient was both very small and very insignificant. Hence, what we estimate is
the import volume in the absence of subsidies; if VERs have a price influence
it is assumed to be the same for all years. In Figure 5 that means comparing
paths M(O, VER) and M(s, VER).
Subsidies Before 1971. For the pre-1971 period data is not avail-
able on subsidies to the textile and clothing industry. We know, however,
that subsidies during the sixties and in 1970 were very small. Government
policy at that time was that any subsidies given were exceptions to a general
policy of not extending government assistance to industry (The 1970 Medium
Term Plan, Appendix 2 on the textile and clothing industry, p. 174). The
first government commission on the textile and clothing industry was set up in
1968 and its reports were delivered in 1969 and 1970. These reports suggested
various types of assistance to the industry, such as a government procurement

- 41 -
Figure 5 Estimating the import demand function
Importvolume
M(O, 0)
< / ~~M(O, VER)
/ ~~~~~~~~M(s, VER)
Time
M(O, 0): Imports without VERs and subsidies
M(S, 0): Imports with VERs but without subsidies
M(s, VER): Imports with VERs and subsidies, i.e. actual imports

- 42 -
program (mainly uniforms), export-promotion subsidies, training subsidies,
R&D subsidies and a regional subsidy to the area in which the Swedish textile
and clothing industries had traditionally been concentrated.
Subsidies would be expected to improve the international competi-
tiveness of the industry. But by how much? Producers could also utilize
the subsidies to increase profits and wages. The equation which is estimated
below answers this question.
Simulated Import Volume and Effect on Domestic Competitiveness
The estimated Import demand function is of the form
M- = r + a(p-) + 0 A (6)m P
where M is the value of imports of textiles and clothing
Pm is the unit import price of textiles and clothing,
Pd is the domestic unit cost of textiles and clothing
gross of subsidies,
is a constant, and
A is the volume of the domestically produced part of home demand
DP - Xand is defined as p, where DP and X are the values of domestic
production and exports, respectively.
In the specification we want to distinquish between the influence
of a change in the rate of subsidy, s, and a change in the domestic unit cost
net of subsidies, Pd. Thus we write Pd Pd (1 - s). The price and subsidy

- 43 -
variables are then expressed in comparable units, and equation (6) is written
as
H 1I.P 2 1(7tl - lr + a ( +) . a (-) + B A(77) i-s
The OLS procedure yielded the following estimated equation (t-values in paren-
thesis),
m p 1
M 3 175334 - 73174 ( - 73632 (y-) -'0.5968 A (8)
(6.24) (-9.39) (-3.07) (-2.72)
-2-dvw 2.3 R - 0.97 F - 172
We can now ask whether subsidies improved the
international competitiveness of the industry. If subsidies had no impact on
the demand for imports, X2 would not be significant; it is clearly not
(t = -3.07). As is seen from the estimated coefficients, import demand is
just as sensitive to a relative price change caused by a change in subsidies
as an equivalent change caused by other factors; that is,|< 1( w2 . 1/ Thus
it seems that these subsidies have improved domestic competitiveness and do
not seem to have passed through to higher wages or profits. 2/
This also seems to be a result more reasonable for textiles and cloth-
ing than for other industries, since textile and clothing firms typically
1/ Testing at the 99% level of significance we could not reject the hypothe-
sis that i 1 = 0X2
2/ Bjorklund and Holmlund (1980) report a similar result for the Swedish labormarket as a whole during the late 70s.
- 44 -
face intensive price competition which threeatens their survival. In other
industries, government subsidies are more likely to spill over into
higher wages. The resulting implicit unit cost increases are shown in Table
4, column (3).
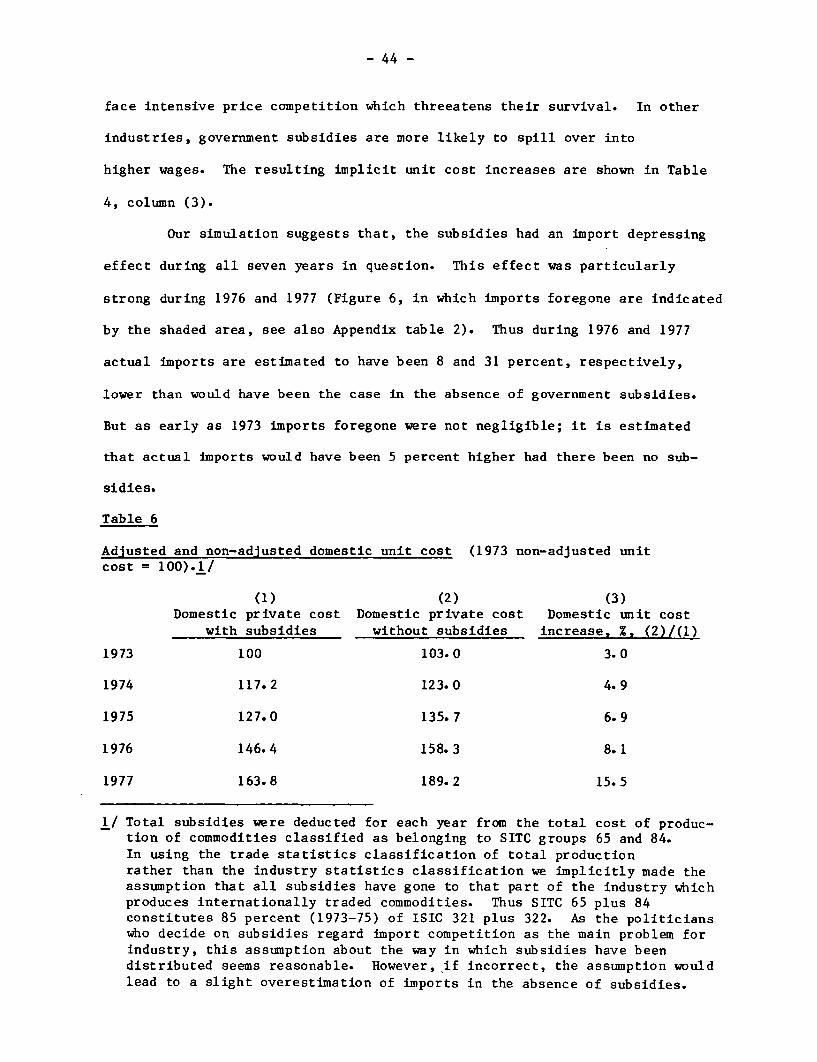
Our simulation suggests that, the subsidies had an import depressing
effect during all seven years in question. This effect was particularly
strong during 1976 and 1977 (Figure 6, in which imports foregone are indicated
by the shaded area, see also Appendix table 2). Thus during 1976 and 1977
actual imports are estimated to have been 8 and 31 percent, respectively,
lower than would have been the case in the absence of government subsidies.
But as early as 1973 imports foregone were not negligible; it is estimated
that actual imports would have been 5 percent higher had there been no sub-
sidies.
Table 6
Adjusted and non-adjusted domestic unit cost (1973 non-adjusted unitcost = 100).1/
(1) (2) (3)Domestic private cost Domestic private cost Domestic unit cost
with subsidies without subsidies increase, %, (2)/(1)
1973 100 103.0 3.0
1974 117.2 123.0 4.9
1975 127.0 135.7 6.9
1976 146.4 158.3 8.1
1977 163.8 189.2 15.5
1/ Total subsidies were deducted for each year from the total cost of produc-tion of commodities classified as belonging to SITC groups 65 and 84.In using the trade statistics classification of total productionrather than the industry statistics classification we implicitly made theassumption that all subsidies have gone to that part of the industry whichproduces internationally traded commodities. Thus SITC 65 plus 84constitutes 85 percent (1973-75) of ISIC 321 plus 322. As the politicianswho decide on subsidies regard import competition as the main problem forindustry, this assumption about the way in which subsidies have beendistributed seems reasonable. However, if incorrect, the assumption wouldlead to a slight overestimation of imports in the absence of subsidies.

- 45 -
Figure 6 Simulated import demand and predicted employment 1971-77
INDEX
200-
190 Actual homedemand (volume)
180-1, Predicted
170- imports170 / ' ' (volume)
160 / '
150 -
140-
130- mot(volume)
120 -
110 v
100-197 72 199374 1975 1976 1977
90
80 -
70_ _ Actual employ-70\ ment
60 N
'%%Predictedemployment

- 46 -
The import penetration ratio (defined as import volume divided by
home demand volume) would have been substantially higher than was in fact the
case. This is indicated by the vertical distance between the two upper curves
in Figure 6. The actual import penetration ratio increased from 60.6 percent
in 1971 to 76.0 percent in 1977. The predicted ratio already reached the
latter level in 1975, and in 1977 it reached 99 percent.
Effects on Domestic Employment
In this section we estimate the employment effects of government
subsidies again using the Salter approach. In addition, the import simula-
tion in the previous section is used as alternative measure of the employment
effect to check the robustness of the.Salter approach. 1/
The Overall Effect. The subsidy statistics, Nyberg (1978), are
unfortunately not disaggregated. Hence, we have to treat the textile and
clothing industries as one industry and assume that each of the two had the
same proportion of its variable costs covered by subsidies. A second assump-
tion is that subsidies were distributed in a uniform fashion over all plants.
If this assumption is violated and some of the production units indeed have
received more than average subsidies, our method of measuring jobs "saved"
will produce an approximative estimate. In fact there is reason to believe
that some larger and regionally predominant plants have received a more than
average share of the subsidies. 2/ Thirdly, for the marginal plants we take
1/ The second method can also be used as an alternative to the Salter methodin Section II.
2/ I owe this information to Lennart Ohlsson.

- 47 -
it that subsidies are reflected as reductions in unit cost. This seems
1 2reasonable both against the background of our discussion, the test of a* = d2
in the previous section, and because the plants we are interested in are the
marginal ones with their "backs against the wall". 1/ The textile and cloth-
ing industries are particularly suitable for this type of analysis' since the
plants in these industries are small compared to most other branches of
industry. 2/ The price changes employed in the analysis are presented in
Table 6, column (3). Applying these necessary simplifying assumptions,
the overall figures for predicted employment are presented in Table 7 and
Figure 6.
The total number of man-years "saved" is estimated at 28,900, of
which 34 percent occurred during 1977. In that year both subsidies and number
of jobs "saved" reached peak values. For the other four years there is no
clear relationship between subsidies and jobs "saved". Table 7, column (6),
shows that the 1974, 1975 and 1976 subsidies were more efficient in saving
jobs than the subsidies of 1973 or 1977, measuring efficiency as subsidy cost
per man-year "saved". This feature is measured in Figure 6 by the length of
the dotted horizontal lines. In 1973 the subsidies could postpone unemploy-
ment only one year before it fell below the predicted value, but the (smaller)
subsidies of 1974 postponed the predicted unemployment twice as much. Note
1/ This "back against the wall" characteristic is also confirmed by ourinvestigation of the industries (lacking) adjustment possibilitiesin section II.
2/ Of total output, approximately 20 percent was produced in units withless than five employees. In the remaining plants the average numberof employees was 61 in the textile industry and 41 in the clothingindustry in 1976.
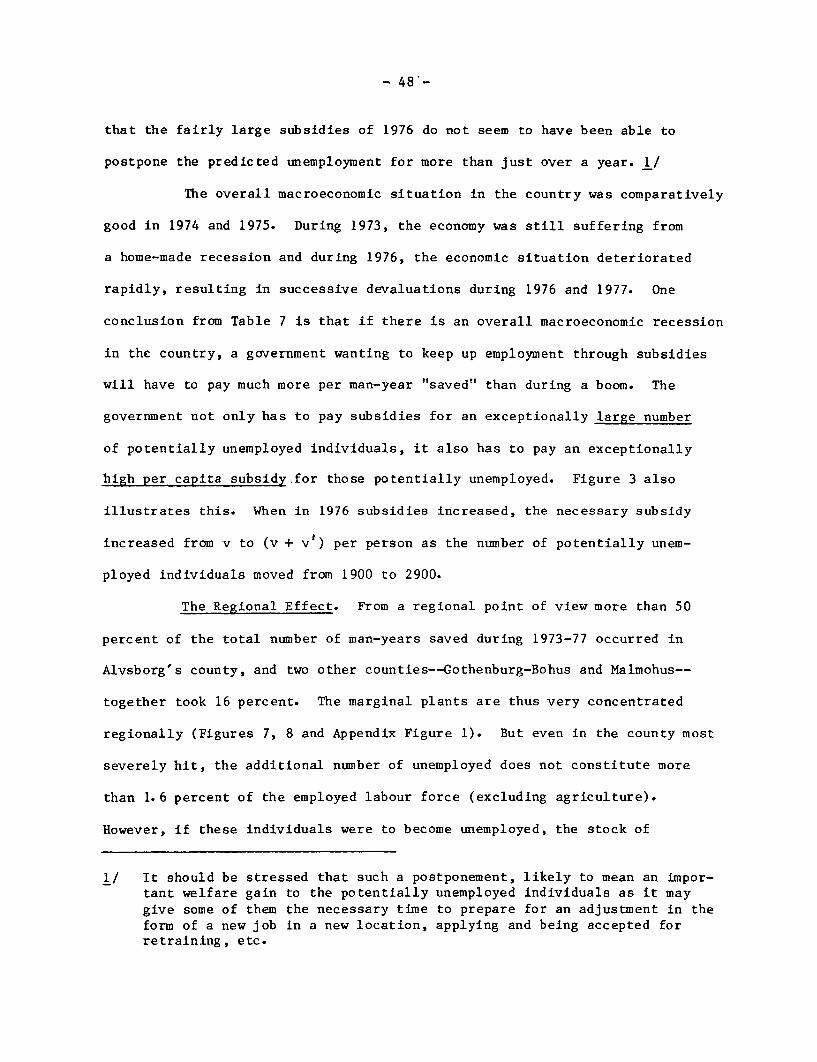
- 48 -
that the fairly large subsidies of 1976 do not seem to have been able to
postpone the predicted unemployment for more than just over a year. 1/
The overall macroeconomic situation in the country was comparatively
good in 1974 and 1975. During 1973, the economy was still suffering from
a home-made recession and during 1976, the economic situation deteriorated
rapidly, resulting in successive devaluations during 1976 and 1977. One
conclusion from Table 7 is that if there is an overall macroeconomic recession
in the country, a government wanting to keep up employment through subsidies
will have to pay much more per man-year "saved" than during a boom. The
government not only has to pay subsidies for an exceptionally large number
of potentially unemployed individuals, it also has to pay an exceptionally
high per capita subsidy for those potentially unemployed. Figure 3 also
illustrates this. When in 1976 subsidies increased, the necessary subsidy
increased from v to (v + vl) per person as the number of potentially unem-
ployed individuals moved from 1900 to 2900.
The Regional Effect. From a regional point of view more than 50
percent of the total number of man-years saved during 1973-77 occurred in
Alvsborg's county, and two other counties--Gothenburg-Bohus and Malmohus--
together took 16 percent. The marginal plants are thus very concentrated
regionally (Figures 7, 8 and Appendix Figure 1). But even in the county most
severely hit, the additional number of unemployed does not constitute more
than 1.6 percent of the employed labour force (excluding agriculture).
However, if these individuals were to become unemployed, the stock of
1/ It should be stressed that such a postponement, likely to mean an impor-tant welfare gain to the potentially unemployed individuals as it maygive some of them the necessary time to prepare for an adjustment in theform of a new job in a new location, applying and being accepted forretraining, etc.

Table 7 Predicted number of man years "saved" due to government subsidies 1973-77
(1) (2) (3) (4) (5) (6) (7)
Number of man years saved in the Predicted number of man Subsidy per man Total subsidiestextile and clothing industries* years saved as per cent year saved (Skr, (1,000 Skr,
of total number of 1974 prices) 1974 prices)of which of which in employed individuals**
Year women, % Alvsborgs county, %
1973 2,600 57 50 0.07 39,400 102,438
1974 6,100 56 59 0.16 15,600 94,897
1975 4,700 58 57 0.12 9,000 42,311
1976 5,800 62 53 0.15 14,300 82,668 >
1977 9,700 62 42 0.25 24,900 241,050
All years 28,900
* Rounded off.
*Excluding agriculture.

- 50 -
unemployed in this county would increase by 90 percent (average, see Figure
8). It is worth noting that in only five counties out of 25 would the stock
of unemployed have increased by more than ten percent (average) if the sub-
sidies had been withdrawn (Skaraborg, Alvsborg, Jonkoping, Kronoberg and
Kristianstad).
A general conclusion from studies in other countries of the employ-
ment effects of trade with developing countries has been that the overall
effect on employment is very marginal but that increased competition can
affect certain groups severely (for a summary of studies, see UNIDO 1978).
Typically unskilled people, women and those living in a depressed area
can be hard hit by competing imports. The region which would be most hit if
subsidies were withdrawn is a fairly depressed one. As is seen-in Table 1,
women are over-represented in the industry's labor force. But it should be
noted that most of Sweden's textile and clothing imports do not originate in
developing countries. Finland's export of textiles and clothing to Sweden
is of about the same volume as the developing countries' and in the import-
competing Swedish textile and clothing industry approximately 25 percent of
the labour force are immigrants of which a vast majority comes from Finland.
A comparison with a Commonly Used Approach to Estimate the Impact ofIncreased Exports from Developing to Industrial Country Markets
It is common to assume that there is a close link between the volume
of production and employment. Assuming that home demand is unaffected by the
subsidies, one would expect a relationship between imports foregone and jobs
"saved". To check the robustness of our estimates for jobs "saved" we speci-
fied a simple relationship: the number of employees in the industry is

- 51 -
Figure 7 Regional distribution of the aggregated number of man years
"saved" 1973-77 (28,900 man years; see Table 7).
Counties of Sweden
880 ~ ~ ~ 3
10160
t aS ~590 5
t),~~ v 0
Alvsborgs 1100 702n(X°county V g

- 52 -
Figure S Increase in the counties' stocks of unemployed in the
absence of subsidies (per cent)
Alvsborgs county U
6.
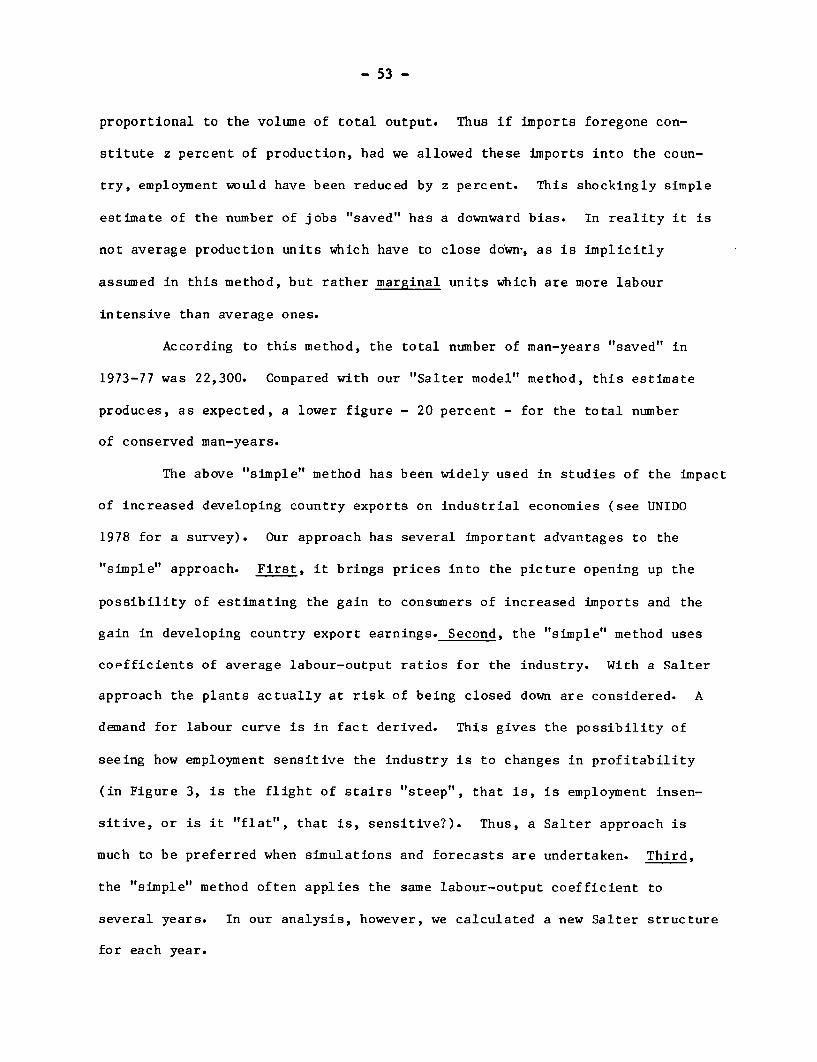
- 53 -
proportional to the volume of total output. Thus if imports foregone con-
stitute z percent of production, had we allowed these imports into the coun-
try, employment would have been reduced by z percent. This shockingly simple
estimate of the number of jobs "saved" has a downward bias. In reality it is
not average production units which have to close down', as is implicitly
assumed in this method, but rather marginal units which are more labour
intensive than average ones.
According to this method, the total number of man-years "saved" in
1973-77 was 22,300. Compared with our "Salter model" method, this estimate
produces, as expected, a lower figure - 20 percent - for the total number
of conserved man-years.
The above "simple" method has been widely used in studies of the impact
of increased developing country exports on industrial economies (see UNIDO
1978 for a survey). Our approach has several important advantages to the
"simple" approach. First, it brings prices into the picture opening up the
possibility of estimating the gain to consumers of increased imports and the
gain in developing country export earnings. Second, the "simple" method uses
copfficients of average labour-output ratios for the industry. With a Salter
approach the plants actually at risk of being closed down are considered. A
demand for labour curve is in fact derived. This gives the possibility of
seeing how employment sensitive the industry is to changes in profitability
(in Figure 3, is the flight of stairs "steep", that is, is employment insen-
sitive, or is it "flat", that is, sensitive?). Thus, a Salter approach is
much to be preferred when simulations and forecasts are undertaken. Third,
the "simple" method often applies the same labour-output coefficient to
several years. In our analysis, however, we calculated a new Salter structure
for each year.

- 54-
Appendix
The derivation of _
qF and qR are quantities supplied by the foreign country and the
rest of the world and q- is world demand. We want to investigate
n=- P pF. Supply equals demand,
- ap
ZqF qFqFqR F q R - + q w a
Define the demand elasticity dW = -P a We can then write
qR s aqR aq
_ R R- 1
The derivation of n
…~~~~~~
qSWE and q are the quantities supplied by the (foreign) VER-'F R ~~~~~~~~~~SWE
countries and domestic suppliers, respectively. (qH + qF ) is total
demand in Sweden which is equal to the world demand under our assumption
of non-substitutability in export markets. Supply equals demand,
SWE SlWEFp HU H qF)

_55-
-SWE3qH 3(q14+ qF
p qF _ ap _ ap-SWE a -SWE -SWEq F qF qF
-SVYE -SIWE1 _ qH ( p q qH qF p P / qF7. -SE H PD -SWE SWE qF ap q F HqF q + q F
-SWE
Define the home demand elasticity as edH =SWE a+H H+ -SW
and denote the domestic supply elasticity by eH. We can then write,
~~~~~1nu IH -SWEqH s qH +qF d
a e + e~-SWEeH -:SW-E eH
qF q
Derivation of a _rice change
To illustrate the method behind table 3 we derive
the price change in 1975 for "Blankets and travelling rugs"
(CCC 6201, SITC 65661, 65662, 65669). The price change is encircled
in table 3. The figure for domestic production we collect in the
industry statistics, qH = 14608. The figure for VER imports we collect
SWE d sfrom trade statistics, q = 987. By assumption eH = e
From Hamilton (1980) we take the import demand elasticity e d
for SITC 65, the group to which "Blankets and travelling rugs" belong.
By way of the formula given in footnote 1, p. 24, we calculate the
domestic demand elasticity, eH (SITC 65, 1975) to be 0.4. With these
pieces of information we can calculate n from the formula derived
above in the appendix,
1 114608 14608 + 987 0 .4(14.80 + 15.80) = 0.0817987 0.4 + 987 0.4

-- 56 -
The price change is then (in per cent)
-SWE
AP = -SWE n * 100 X 4.1.
qF

- 57 -
Appendix table 1
Total subsidies to the textile and clothing industry1974 Drices, 1000 Skr.
Distribution over timeYear Total subsidies (percent)
1971 23,435 3.8
1972 29,716 4.8
1973 102,438 16.6
1974 94,897 15.4
1975 429311 6.9
1976 82,668 13.4
1977 241,050 39.1
616,515 100
Source: Nyberg (1978).
Note: Fiscal years have been transformed into calender yearsby assigning half of the subsidies from each of twosuccessive fiscal years to the fully covered calendaryear in between.

Appendix table 2 Trade and employment in textile and clothing 1963-77
Number of man years
Actual iports Predicted imports Actual penetration Predicted penetration Actual !'saved" measured by(volume index) (volume index) ratio* (percent) ratio* (percent) employment the simple method**
1963 50.5 34.3: 92,000
.68 83,3 49.2 73,182
69 98.0 54.0 70,939
70 104.0 56.9 67,512
71 100.0 109.1 60.6 66.2 59,871
72 116.0 120.0 65.6 67.7 56,345
73 120,9 126.2 67.1 70.0 55,929 2,150
74 125.7 127.4 69.3 70.3 53,548 710
75 130.3 142.6 72.8 79.7 50,337 960
76 142.2 153.9 72.2 78.1 47,873 7,200
77 136.6 176.7 76.0 99.4 42,789 11,290
22,310
* Measured as share of imports in home demand (apparent consumption).
** Measured by the "proportion to output" method described in the text.

- 59 -
Appendix table 3 Commodity group shares of total VER import to Sweden 1973 and 1976(2)~~~~~~~~3
(2) Share of total VU:R(1) Correapondinv SLTC codc inmport to Sweden
C.CC Codt 0 (for descriptiov i',.e table 1) 1973 19775104 200 65 351 0
306-309 65 351 O.1406-600 65 351 0.4 0
165 361706-709 65 351 0906-909 65 351 0
5311 all 65 321 0.2 0
5405 903-906 65 331 0 0
5506 900 65 142 0 0
5508 900 165 212 0.1 0.1165 222
5509 203-209 65 229 1 3.5803-809 65 229 0.2
5607 106-606 65 352 0107+607 65 352 0103-108,609 65 352 0.3205-206-705 65 352 0.42077-07 65 352 7.4 0706-738 65 352 030i73Z2-O3 65 352 0.2306+3C7,9G7 65 352 0911+990 65 352 0
58C4 500 65 223 0.3 0.5
5s05 002-009 65 401 0 0
5308 580992) 65 404 0 0
5904 all 65 561 0.8 0.4
6003 003-109 84 142 1.8 1.3902-909 84 142 1
6004 all 84 143 5.4 6.2
60053)302-309 84 144 4.8 13.0602-609 84 144 1.0 0.7802-896 84 144 1.0 3.0
6101 all 84 111 23.3 27.0
6102 all 84 112 19.2 27.3
6103 102-209 184 113 13.2 10.5184 142
6104 102-109 84 114 0.4 0.2
6201 all 65 66165 662 0.3 0.265 669
6202 110+1090 65 691 1 4.1 3.81902) 65 691 ' 3.8311-3992) 65 691 )_ _
100.0 100.0
For footnotes, see Table 1.

- 60 -
Appendix Regional distribution of mian-years "saved" due to
Figure 1 government subsidies. Each county's percentage .of
the total number of man-years "saved", 1973-77.
Counties of 0Sweden
2
r*~~2<

- 61 -
BIBLIOGRAPHY
Bjorklund, A. and B. Holmlund (1980), "Erfarenheter av 70-taletsarbetsmarknadspolitik", Ekonomisk Debatt, No. 4, 1980.
Bhagwati, J.N. and Srinivasan, T.N. (1976), "Optimal Trade Policy andCompensation under Endogenous Uncertainty: The Phenomenon of Market
Disruption", Journal of International Economics, 6, pp. 317-336.
Hamilton, C. (1980), "Import Elasticities at a Disaggregated Level. TheCase of Sweden", Scandinavian Journal of Economics, No. 4.
Heikensten, L. (1979) "En metod att forutsaga industrinedlaggningar", in
Vagar till okad valfard Ds Ju 1979:1, Expertbilaga 1, Stockholm.
Jenkins, G.P. (1980), "Cost and Consequences of the New Protectionism,"Discussion Paper, The North South Institute, Canada.
Kreinin, M. (1973), "Disaggregated Import Demand Functions - FurtherResults", Southern Economic Journal, vol. 40, June, pp. 19-25.
Kreinin, M. (1975), International Economics, 2nd edition, Harcourt Brace
Javanovich, New York.
Lindbeck, A. (1975), Swedish Economic Policy, MacMillan, London.
Nyberg, P.G. (1978), "Selektiva naringspolitiska atgarder for TEKO-industrin", mimeo 1978-10-09, Statens Industriverk, Stockholm.
Salter, W.E.G. (1969), Productivity and Technical Change, Cambridge U.P.,Cambridge.
SOU:1971:5, Svensk industri under 70-talet. bilaga 2, Stockholm.
Stern, R.M., J. Francis and B. Schumacher (1976), Price Elasticities in
International Trade, MacMillan, London.
UNIDO (1978), "The Impact of Trade with Developing Countries on Employment
in Developed Countries", UNIDO Working Papers on Structural Changes,
No. 3, UNIDO/ICIS.85, Wien.
Webb, R. (1975), "Intra-Industry Differences in Input Coefficients and the
Effective Rate of Protection", unpublished mimeo, Melbourne University,Parkville, Victoria.

- 62 -
MARKET PENETRATION RESEARCH PROJECT--WORK-IN-PROGRESS REPORTS
425 Britain's Pattern of Specialization in Manufactured Goods Vincent Cable &with Developing Countries and Trade Protection Ivonia Rebelo
426 Worker Adjustment to Liberalized Trade: Costs and Graham GlendayAssistance Policies Glenn P. Jenkins
John C. Evans
427 On the Political Economy of Protection in Germany H.H. Glismann &F.D. Weiss
428 Italian Commercial Policies in the 1970s Enzo Grilli
429 Effects of Non-Tariff Barriers to Trade on Prices, Carl HamiltonEmployment, and Imports: The Case of the SwedishTextile and Clothing Industry
430 Output and Employment Changes in a "Trade John Mutti &Sensitive" Sector: Adjustment in the U.S. Malcolm BaleFootwear Industry
431 The Political Economy of Protection in Belgium P.K.M. Tharakan
432 European Community Protection Against Manufactured Eric Verreydt &Imports from Developing Countries: A Case Study Jean Waelbroeckin the Political Economy of Protection