effects of mining activities on consumer preference of ... · pdf fileeffects of mining...
TRANSCRIPT

INTERNATIONAL JOURNAL OF ADVANCE RESEARCH, IJOAR .ORG ISSN 2320-9127 1
IJOAR© 2014
http://www.ijoar.org
International Journal of Advance Research, IJOAR .org Volume 2, Issue 2, February 2014, Online: ISSN 2320-9127
EFFECTS OF MINING ACTIVITIES ON CONSUMER
PREFERENCE OF WATER SOURCES IN OBUASI 1 Collins Kankam-Kwarteng, 2 Jacob Donkor, 3Ayim-Nyarko Amanfo
1Ghana Baptist University College [email protected] 2Sikkim Manipal University, Kumasi Campus [email protected]
,
3PhD3
Ghana Baptist University College, Kumasi
ABSTRACT
This paper traces consumer preference of sources of water in the Obuasi municipality. The
general objective of the study is to critically examine consumer choice of the sources of water.
The study specifically exams the nature of influence mining activities have on the supply of
water and consumption patterns in the Obuasi municipality. Data was collected from the
residents of Obuasi municipality which is a mining community in the Ashanti Region. The
respondents were selected using non-probability sampling. A questionnaire design was used to
collect the data and the analysis performed using SPSS tools. It was found that sources of water
in the Obuasi municipality included Ghana Water Company; Community boles holes, private
water suppliers and well, but majority of consumers prefer water from the Ghana Water
Company Limited. Also, consumers are suspicious of water contamination because of the mining
activities. The study again found that the mining activities affect consumption pattern and
consumer preference of water sources in the Obuasi municipality. The study recommended that
INTERNATIONAL JOURNAL OF ADVANCE RESEARCH, IJOAR .ORG ISSN 2320-9127 2
IJOAR© 2014
http://www.ijoar.org
the Government and Environmental Protection Agency should monitor and implement policies
to regulate mining activities in order to reduce the impact of mining activities on the sources of
water in the Obuasi municipality.
Key words:
mining activities, water supply, consumption patterns, consumer preference
INTERNATIONAL JOURNAL OF ADVANCE RESEARCH, IJOAR .ORG ISSN 2320-9127 3
IJOAR© 2014
http://www.ijoar.org
1.1 INTRODUCTION
Consumption patterns and consumer preferences are influenced by many factors. What is likely
to cause harm to the consumer is a major concern in consumer behavior literature. The influence
factors such motivation, personality; learning and perception on consumer preference may also
depend on the nature and the source of the product. Water in many cases is unique among
consumer products and it has a number of attributes that mark it out as different from other
consumer goods or services. Access to clean water is now a human right. When the Universal
Declaration of Human Rights was first drafted water and air were omitted as they were regarded
as necessary preconditions for all other human rights and so were not explicitly mentioned. In
November 2002 the UN Committee on Economic, Social and Cultural Rights finally affirmed
that access to clean water was indeed a fundamental human right. Second, safe water supplies are
a prerequisite for stable healthy societies.
While wealthy consumers can choose to drink bottled waters to avoid health risks, this is not an
option for large portions of the citizens of Obuasi Municipality and even in the most developed
nations. The current large populations and the success of the growing economies of Europe are
fundamentally dependent on the existence of safe drinking water supplies and thus governments
are motivated to ensure their continued existence and success.
Over the past few decades, water consumption habits have changed immensely. In today‘s
society, it is common for both spouses to work outside of the home. Consequently, rising average
household incomes give consumers a broad range of choices for the basic choice of variety of
water be it for drinking or other usage. A health aware nation and a rising interest in maintaining
and improving human life are just a few reasons why source of water is an issue. Clean water is
recognized for its benefits toward healthy living (Cox et al., 1996).
Water is considered a very important attribute human survival. International community show
concerns on the quality of water people drink and use for other purposes. The seemly high alert
by the international community on water sources and usage is attributed to the rapidity with
which it can cause harm to the human health (Cox et al., 1996). In the mining communities
assess to portable water has been a matter for concern by the local people. Mining activities in
Obuasi is over a period of hundred years which obviously raises issues of environmental
INTERNATIONAL JOURNAL OF ADVANCE RESEARCH, IJOAR .ORG ISSN 2320-9127 4
IJOAR© 2014
http://www.ijoar.org
concerns. The underlying concern in most mining communities is the extent of environmental
pollution and its effect on the water bodies in the community. The life of the people of Obuasi
have is mixed with mining activities. It therefore raises obvious concern to study and understand
the various factors that contribute to consumer understanding and preference of a source of
water. This study therefore seeks to provide responses on the various sources of water to the
people of Obuasi, the factors that influence choice of water sources, residents‘ perception on the
influence mining activities have on water supply and consumption patterns.
LITERATURE REVIEW
2.0 CONSUMER PREFERENCES AND RELATED CONCEPTS
As with much research on consumers, and indeed social science in general, there is a lot of
terminological confusion and sometimes a lack of rigour. This is acknowledged within the
academic literature and steps are being taken to rectify this situation. The following definitions
of key terms are provided in the hope of clarifying the following discussion of the literature.
Consumer Satisfaction
Consumer satisfaction and acceptance are often considered in the literature to be closely linked
yet these are distinct concepts. Satisfaction is the fulfillment and gratification of the need for a
stated good or service, here, water.
Consumer Acceptance
Acceptance describes consumer willingness to receive and/or to tolerate. For example, a
customer might accept the occurrence of a certain number of yearly supply interruptions given a
certain price. Consumer acceptance and satisfaction are related, as the first is a precursor of the
latter. However, despite the fact that satisfaction and acceptance can be thought of as lying on a
continuum, acceptance does not automatically lead to satisfaction. Weighing needs or
preferences against provided product or service attributes results in the balance of satisfaction
pointing in a negative or positive direction, depending on whether interests are conflicting or
INTERNATIONAL JOURNAL OF ADVANCE RESEARCH, IJOAR .ORG ISSN 2320-9127 5
IJOAR© 2014
http://www.ijoar.org
corresponding. This determines the way in which people evaluate companies‘ or utilities‘
performance. Only when a consumer‘s needs for a stated good or service are met, i.e. when the
service provided corresponds with their preferences, will they feel satisfied. Customer
satisfaction can be enhanced when their needs are met (in terms of both quality and quantity) and
accord with their preferences. At the other end of this dimension, where the service provided
conflicts with the prevailing needs or preferences, customers may experience feelings of
dissatisfaction.
Acceptance is also used in the literature to mean an affirmative answer to a proposal. The
distinction is subtle but there are occasions where consumers might not agree to a proposal yet
accept the subsequent service in the sense of tolerating it.
Consumer Concerns of water sources
These are expressed anxieties or unease over an object broadly defined (e.g. discoloured tap
water or a proposal to change the water pricing structure).
Consumer Preferences of water sources
This is used primarily to mean an option that has the greatest anticipated value among a number
of options. This is an economic definition and does not tap into ‗wishes‘ or ‗dreams‘ (for e.g. that
safe drinking water was free, that there should be world peace) but for all practical purposes is an
appropriate definition. Preference and acceptance can in certain circumstances mean the same
thing but it is useful to keep the distinction in mind with preference tending to indicate choices
among neutral or more valued options with acceptance indicating a willingness to tolerate the
status quo or some less desirable option.
Consumer Expectations and preference of water sources
The distinction between expectations and preferences is often blurred though the concepts are
distinct. Expectation is used in three slightly differing senses in the literature. One is the act of
expecting or looking forward – a belief about what will happen in the future. Most consumers in
Europe expect that clean and safe water will come out of their taps the next time they turn them
on. A related but more technical use of expectation is to denote a more formal estimation of the
INTERNATIONAL JOURNAL OF ADVANCE RESEARCH, IJOAR .ORG ISSN 2320-9127 6
IJOAR© 2014
http://www.ijoar.org
probability of an event occurring. These first two definitions can be distinguished from
preference in that preferences refer to some desired state and, as in the above definition, imply
that more than one state is possible and that there are some options. Unfortunately expectation is
also used more loosely to mean a requirement or demand for something and in this sense is a
kind of strong preference. When reading the literature it is important to ascertain which
definition is being used.
Consumer Awareness of water sources
Consumer awareness is the level of knowledge about, in this case, water which includes the
water company, regulatory framework, supply system and service, or the water itself. In most
research the adequacy or otherwise of this awareness is anchored against the service provider or
regulator‘s perspective on the supply. Where consumer awareness does not equate with this
industry perspective this is often termed a consumer (mis)perception.
However, it should be noted that there is a distinction between holding factually incorrect
knowledge about the supply system (for e.g. that the water comes from a river when it comes
from an aquifer) and differing perspectives on, say, the safety of the supply. In the latter example
assessments of safety are judgments made under uncertainty about the future and thus have a
legitimately contestable truth status. What is acceptably safe is a matter of judgment (potentially
based on ‗good science‘ but a judgment under uncertainty nonetheless) and may or may not be a
‗mis-perception‘.
Risk Perception of water sources
This is a term used rather loosely in the literature to mean the level of risk associated with
exposure to a hazard. Unfortunately a ‗risk‘ is often used to mean the specific hazard itself rather
than a formal risk which is a combined assessment of the likelihood and magnitude of harm that
may occur as a result of exposure to the hazard.
Consumer Attitudes towards water sources
An attitude is a positive or negative evaluation of a social object or action. A ‗social object‘ in
the present context might mean the water company, water regulations, supply system and
INTERNATIONAL JOURNAL OF ADVANCE RESEARCH, IJOAR .ORG ISSN 2320-9127 7
IJOAR© 2014
http://www.ijoar.org
service, or the water itself. Many theories of attitudes (e.g. the well-known theory of planned
behaviour, Ajzen, 1985) have attitude as a factor involved in determining behavioural choices
however there is considerable continuing debate about when, and in what circumstances,
attitudes are important determinants of behaviour. An attitude toward something should thus not
be taken to imply that attitude consistent behaviour will automatically follow.
Consumers and the Public
While discussing definitional clarity it is worth acknowledging that ‗the consumer‘ is not a
representative of a single homogeneous group, ‗the public‘. Social scientists prefer to use the
term ‗publics‘ to reflect the idea that not all members of ‗the public‘ share the same goals and
values nor have the same relative power status within any society. A crude example we will
return to later is that the poor/unemployed are unable to pay for some services and it would be a
mistake to ignore the importance of this different status when studying preferences.
In the case of water consumption, all members of the population have to consume water from
some source but some are the direct payers of water bills (customers), some pay indirectly (e.g.
those living in care homes, or some forms of rented accommodation) and others are dependents
of customers. These differing groups will have differing relationships with suppliers and may
well have different preferences.
2.2 CONSUMER EXPECTATION AND PRIORITIES OF WATER SOURCES
A survey of European consumer responses to the major utilities (Candidate Countries Euro-
barometer, 2003) shows that satisfaction with water supplies is high compared with most other
utilities with only postal services performing better over a range of service features (price,
quality, access, contract conditions etc.). Across all countries (old EU15 and new accession
countries) the quality of water supplies is rated at 3.31 (new states) and 3.26 (old EU15) on a 4
point scale where 4 indicated ‗very good‘. Only 1% of all EU citizens regarded the quality as 1,
‗very poor‘. Across the whole of the EU 90% are satisfied with the quality of the water they
receive. Levels of satisfaction were particularly low, however, in Latvia, Lithuania and Estonia
INTERNATIONAL JOURNAL OF ADVANCE RESEARCH, IJOAR .ORG ISSN 2320-9127 8
IJOAR© 2014
http://www.ijoar.org
with between 18% and 23% of the populations of these countries feeling that the quality of their
supplies was ‗bad‘ or ‗very bad‘. People in these countries (and Slovakia) were the least happy
with customer services provided by suppliers with Cypriots and the Maltese being happiest with
them.
2.3 WATER QUALITY AND SAFETY
It will come as no surprise that most studies show that consumers‘ primary expectation is that
their supplier will provide safe, clean drinking water (Bates, 2000). Burn, Tucker, Rahilly et al
(2003) for example found that in the context of water companies‘ management of Australia‘s
state water resources, the main priorities set by the consumers were, a) quality of water supply
and b) continuity of water supply. In the UK, the Consumer Council for Water (2005) conducted
a series of focus groups in order to explore which water supply issues affected consumers the
most. They regarded the key responsibilities of water and sewerage companies to be: a) supply of
clean water (often mentioned as the most important issue); b) reliable service (involving
continuous uninterrupted supply, efficient sewerage services, and effective customer services); c)
value for money.
Research carried out by the UK‘s Drinking Water Inspectorate also explored consumer
preferences and issues of concern about drinking water. They found that consumers prioritized
safe clean drinking water before reliability of supply (DWI, Consumer Consultation, 1998).
In all studies we have seen that ask consumers about expectations and break these down into
specific aspects of the supply, safety always features strongly. What is less clear is precisely
what ‗safety‘ means to consumers.
General research on perceptions of risk and the notion of uncertainty suggests that consumers
would prefer the services provided to them to be 100% safe and present them with no probability
whatsoever of experiencing harm in either the short or the long term. The idea that there is
always some residual probability of harm from any system, however, small is not always
acknowledged and it is not clear that this is because consumers really do not acknowledge this
INTERNATIONAL JOURNAL OF ADVANCE RESEARCH, IJOAR .ORG ISSN 2320-9127 9
IJOAR© 2014
http://www.ijoar.org
or, more likely, the way the studies have been conducted has not been conducive to exploring
these issues.
Consumers undoubtedly prefer water supplies that are 100% safe but what is currently unclear is
what proportion of the population accept some uncertainty and thus expect less than 100%
safety, and what levels of risk are acceptable to which sets of consumers. Frewer, Miles and
Brennan et al. (2002) found uncertainties related to the knowledge limitations of science to be
more acceptable than those stemming from government regulatory activity – or lack of it. This is
an under-researched area but is a topic which is beginning to be addressed in the willingness-to-
pay literature.
2.4 WATER QUALITY – TASTE AND ODOUR
Immediate sensory perceptions of tap water are most likely to govern levels of concern,
satisfaction and trust in the water supply (in the sense of confidence in its quality and safety). In
general, research suggests that European consumers are relatively satisfied with their tap water.
For example, the UK‘s Drinking Water Inspectorate (DWI, 2000) demonstrated that most
respondents were relatively satisfied with their drinking water.
Similarly, Dutch research has demonstrated that consumers are not particularly concerned about
water quality issues (Martijn, de Rooy & Piriou, 1998) and this seems to be a general finding
across the EU (Candidate Countries Eurobarometer, 2003).
In cases where consumers have expressed concern or dissatisfaction it is clear that these concerns
emanate from two sources. In the UK Drinking Water Inspectorate‘s study (DWI, 2000),
concerns were firstly related to the physical properties of water - such as taste and odour,
appearance, hardness, freshness and temperature, and secondly in relation to the composition
and/or the provenance of the water. Here, concerns were often expressed as questions and doubts
about:
a) What drinking water contained (both ‗natural‘ ingredients and any additives)
b) What was done to the water before it arrived at their taps, and
c) Where it came from (for example, was it recycled waste water?).
Studies have found that concern tends to be raised when the physical qualities of water differ
from the norm (e.g. Martijn, de Rooy & Piriou, 1998).
INTERNATIONAL JOURNAL OF ADVANCE RESEARCH, IJOAR .ORG ISSN 2320-9127 10
IJOAR© 2014
http://www.ijoar.org
Consumers‘ sensory perceptions of their water are quite well tuned (cf. Falahee & MacRae,
1995) and thus aesthetic estimations of tap water quality (e.g. taste and odour and colour) will
have an impact upon judgements of apparent quality and safety. Taste and odour while being
interlinked, tend to relate to different factors, with the sense of taste being most attuned to the
inorganic constituents of water, with the sense of smell relating more to organic constituents of
water (Health Canada, 1995; WHO, 1997). Much lower concentrations of substances can be
detected by odour than can by taste, with taste, odour and temperature all contributing to
complex sensation of flavor (Health Canada, 1995).
Studies have also shown that chlorine is not effective at masking the odours in drinking water,
such as the earthy or musty odours that result from the presence of geosmin or 2-
methylisoborneol in drinking water (Oestman et al, 2004). Chlorine odour itself is of particular
concern to consumers (CSIRO Land and Water, 1999). The taste of chlorine in tap water is a
leading cause of customer complaints and dissatisfaction with drinking water although
perceptions are influenced by the chlorine practices of the customers‘ country of residence
(Piriou, et al, 2004).
The residual level of chlorine in water has been correlated with increased consumer
dissatisfaction with water quality and an increased perception of risk associated with drinking
water (Turgeon, et al, 2004). This perception occurs despite the fact that the real health risk
associated with drinking water may be inversely proportional to the residual level of chlorine in
tap water, with chlorine levels decreasing with increasing residence time of water in the
distribution system and the distance from the water treatment plant. Turgeon et al (2004) also
found that socio-economic factors influenced satisfaction with drinking water quality, with
younger respondents, those on lower incomes, and those without university education more
likely to be satisfied with their drinking water supply.
McGuire (1995) reported that, if consumers detect an ‗off-flavour‘ in their drinking water, they
are likely to believe that it is unsafe to drink. Thus changes in the system and/or water source can
have a large impact upon perceived water quality and resultant levels of expressed concern.
INTERNATIONAL JOURNAL OF ADVANCE RESEARCH, IJOAR .ORG ISSN 2320-9127 11
IJOAR© 2014
http://www.ijoar.org
Owen et al (1999), for example, describe an incident where a water company in the south east of
England changed one local water supply source and subsequently many customers noticed the
change and called the company for information.
It transpired that consumers had detected the change in water supply by seeing deposits in kettles
and ‗scum‘ on the surface of hot drinks. However, due to the company staff being ill prepared to
deal with questions about the source change, some customers became suspicious which in turn
lead to beliefs that the water was harmful even though it met all extant safety standards. This is a
case of consumer complaints/enquiries not being dealt with efficiently leaving doubts in
consumers‘ minds about the trustworthiness of their supplier and supplies.
Changes to the water system may thus have an impact upon perceptions and behaviour. Biswas,
Jayatilaka & Tortajada (2005) carried out research in Colombo, Sri Lanka, where nine towns
near Colombo had recently gained potable piped water as part of a programme to fulfil the
Millennium Development Goals. However, inhabitants continued to use polluted well water for
drinking and cooking purposes, while using the piped water for bathing and washing. Inhabitants
judged the water according to physical characteristics, such as taste and odour and colour. It was
found that the underlying basis for their behaviour was the disliked chlorine odour of the piped
water. Furthermore, in addition to not drinking the new ‗clean‘ water, after the introduction of
the pipes, more people complained about their health, suggesting heightened levels of perceived
risk in response to the change. Changes in taste and odour not surprisingly provide a signal and
act as a warning that care should be taken.
Sensory perceptions of tap water which may or may not relate to the underlying quality or safety
of the water, can lead to modifications in behaviour and in some cases individuals may seek
alternative sources. For example, in the DWI (2000) study some participants who felt concerned
about the physical properties of their tap water modified their behaviour by filtering their tap
water before drinking it. Others opted not to drink the water at all on the grounds that it looked,
smelt or tasted unpleasant.
INTERNATIONAL JOURNAL OF ADVANCE RESEARCH, IJOAR .ORG ISSN 2320-9127 12
IJOAR© 2014
http://www.ijoar.org
Many studies find that consumption of filtered or bottled water reflects aesthetic preferences
(e.g. taste and odour) rather than overt concern for risks associated with tap water (DEFRA,
2002; IFEN, 2000; Means et al, 2001; DWI, 2000), although some studies (Doria, 2006; Dupont,
2005) find both aesthetic preferences and health concerns can lead consumers to opt for bottled
water, with consumer trust in the water company also influencing consumption choices. Some
consumption of bottled water may also occur because of consumer preferences for water that is
chilled or sparkling. Certainly the growth in bottled water consumption in developed countries is
largely independent of objective tap water quality (UNDESA, 2006). A survey of 1846 people
across England and Wales found that, compared with the risk of consuming food items such as
chicken and beef, drinking tap water was perceived to be of low risk (DWI, 2000). The study
found that 69% of respondents were satisfied with their tap water quality. The main reasons cited
for dissatisfaction were related to aesthetic qualities of the water.
Eighty-six percent of those surveyed said they regularly drank tap water, whilst only 6% drank
bottled water only. Here, bottled water consumption was attributed to a dislike of the taste and
odour of tap water.
Consumers have a finely attuned sense of taste where water is concerned. Falahee & MacRae
(1995) carried out a study using untrained members of the public to evaluate preferences for
different types of drinking water. They found that bottled waters were preferred to distilled or tap
waters by the majority of assessors, with waters of higher mineral content being preferred.
Similarly Koseki and colleagues (Koseki, Nakagawa, Tanaka, Noguchi, & Omochi, 2003;
Koseki, Fujiki, Tanaka, Noguchi, & Nishikawa, 2005) found clear preferences for alkaline
electrolysed waters over tap waters (and, indeed, some bottled waters). These kinds of findings
lend some credence to consumers‘ claims to be choosing bottled waters because they can taste
the difference.
In slight contrast to the above, a survey conducted amongst 400 residents of Georgia, USA
(Adote Abrahams, Hubbell, & Jordan, 2000) found that consumers who were dissatisfied with
the taste, odour, and/or appearance of tap water were willing to pay for bottled water but claimed
that they were also doing so to avoid health risks from tap water. These authors found that use of
INTERNATIONAL JOURNAL OF ADVANCE RESEARCH, IJOAR .ORG ISSN 2320-9127 13
IJOAR© 2014
http://www.ijoar.org
water filters tends to be higher amongst consumers who had experienced problems with their
municipal tap water. People who felt their water was ‗unsafe‘ were also more likely to use
treatment devices, whereas the aesthetic qualities of water did not feature as significant
determinants of use of these devices though they were significant in the case of bottled water
use. They state that the use of water filters is an averting behaviour undertaken to reduce the
risks associated with drinking tap water. Bottled water use in this study seems to be both a risk
avoiding and taste enhancing behaviour.
2.5 INFORMATION ABOUT WATER QUALITY AND OTHER PERFORMANCE
INDICATORS
Although the idea that suppliers ought to provide information on their performance to consumers
is widely supported by consumer groups there is little clarity about what information consumers
actually want or whether the indicators deemed relevant by the industry address consumers‘
information needs. Given that the water supply is rarely a matter of concern for most consumers
simply providing information for the sake of it may serve very little purpose and indeed may
even create anxieties by making it clear that tap water contains more than merely H2O (cf.
McGregor, Slovic & Morgan, 1994).
Most suppliers define and monitor various indices of performance (e.g. Couibaly and Rodriguez,
2004; Marques and Montiero, 2001) but there is relatively little research on what this
information means to consumers.
Johnson (2003) reports a study of New Jersey customers who received different versions of a
water quality report ranging from a purely qualitative report, through a minimal quantitative one
that met USEPA guidelines to a more fulsome quantitative report. The findings suggest that
overall assessments of supply quality and supplier performance did not change as a result of
receiving the reports although the fulsome quantitative report was slightly more successful at
conveying information than the qualitative report.
Subsequent questioning of the participants suggested that some had not read the materials
particularly carefully and, generally, that prior general beliefs about risks dominated judgements
of performance irrespective of the content of the reports.
INTERNATIONAL JOURNAL OF ADVANCE RESEARCH, IJOAR .ORG ISSN 2320-9127 14
IJOAR© 2014
http://www.ijoar.org
This could be interpreted as suggesting that consumers do not really want or understand
information on supplier performance but this would probably miss the point. Southern California
Water Recycling Projects Initiative, (2004) report a number of cases where provision of timely
information has been crucial to the success or otherwise of proposals to change the nature of
supplies. The research shows that consumers do want this kind of information but they need it
when they want it and they should to be able to get it quickly in a format that can be readily
understood.
2.6 EXTERNAL INFLUENCES ON CONSUMER PREFERENCES
Turgeon et al (2004) argue that drinking water quality satisfaction and risk perception are closely
related. Their study, carried out in Quebec, demonstrated that consumers are able to perceive
known variations in water quality, and that variations in water quality and geographical location
have a strong impact on consumer perceptions and satisfaction. Consumers‘ perceptions of
drinking water risk result from a combination of objective information together with a
combination of social, cultural and psychological factors. Other factors, such as an aging
population also may influence risk tolerance in a society since perceptions of risk are known to
vary with age (Means, 2002). Risk perception amongst consumers who live nearer a water
treatment plant tends to be high, whilst satisfaction levels are lower than people living further
away from the plant (Turgeon, et al 2004).
Dissatisfaction may emanate from of lack of communication. Fessenden-Raden et al (1987)
suggested that customer dissatisfaction with drinking water may be due in part to the lack of
effective communication by water company experts during water pollution incidents, such as
chemical contamination of groundwater.
2.8 CONSUMER PERCEPTION OF WATER QUALITY
There exists relatively little information concerning consumer perceptions of drinking water
quality as compared to the vast amount of literature available on other aspects of drinking water
INTERNATIONAL JOURNAL OF ADVANCE RESEARCH, IJOAR .ORG ISSN 2320-9127 15
IJOAR© 2014
http://www.ijoar.org
quality, such as drinking water chemistry, treatment, distribution, and health effects. A document
which deals directly with the issue of consumer perception is a paper by Baumann and Dworkin
(1978). The authors discuss consumer attitudes toward drinking water, assess consumer
preferences and behavior, and identify the range of alternative point-of-use treatment
technologies available to the consumer who prefers a higher quality of drinking water than is
presently available.
Several findings of a 1974 Gallup Poll concerning public attitudes and behavior regarding
residential water quality can serve as benchmarks against which to measure future findings about
attitudes and behavior.
First, one survey revealed that there was "generally a high degree of satisfaction with the quality
of water." Only one in four of those interviewed believed that water can affect health although
the proportion was considerably higher among persons with a college background. A third
finding was that 27 percent of those interviewed (amounting to million people) who were not
presently using treatment equipment to modify their drinking water quality would have been
interested in doing so if price were not a problem (Gallup Organization, 1974).
In a review of consumer perceptions of taste and odor in drinking water (Bruvold, 1977) it was
concluded that as the amount of total dissolved solids (TDS) in drinking water increases,
consumers evaluate the water quality more and more negatively; that consumers perceive
drinking water containing more than 500 milligrams per liter of total dissolved solids to be
unacceptable; that the chemical composition of TDS is a factor in consumer acceptance of the
quality of the water; and that consumers are willing to pay for a significant improvement in the
quality of their drinking water.
2.9 MINING AND WATER POLLUTION IN MINING COMMUNITIES
Many mines have an active programme to reduce the water table or divert major watercourses
away from the mines. This exercise has disruptive outcomes for the quality and availability of
surface and ground water. The concentration of mining operations in Tarkwa has been a chief
INTERNATIONAL JOURNAL OF ADVANCE RESEARCH, IJOAR .ORG ISSN 2320-9127 16
IJOAR© 2014
http://www.ijoar.org
cause of both surface and groundwater pollution. Four main problems of water pollution have
been identified in Tarkwa mining areas. These are chemical pollution of ground water and
streams, siltation through increased sediment load, increased faecal matter and dewatering
effects (Akabzaa and Darimani, 2001).
DATA COLLECTION METHODS
DATA SOURCES
In this study the researchers collected responses from the 152 residents of the Obuasi
Municipality who patronize and use water from diverse sources. The researchers collected
primary data because the research is a case study, which demands that data is gathered from the
field.
SAMPLING ISSUES
The population of the study consists of the people living in the Obuasi Municipality in the
Ashanti Region. The number of people living in Obuasi is not readily available to the researcher
but the population of the people in Obuasi is estimated to be in the hundreds of thousands. This
therefore requires a sample. A sample of one hundred and fifty-two (152) was selected for the
study. The researcher decided to use 152 respondents from the Obuasi municipality because of
the scattered nature of the study area. Again, a sample size of 152 respondents was selected
because the researcher believes it can give a representation to the people living in the Obuasi
municipality. A convenient sampling technique sampling technique was used to the respondents
for the study. A convenient sampling is used where respondents are selected based on their
availability and willingness to participate in the study. Thus respondents used for the study were
people who were contacted and were willing participate in the study filled the questionnaire.
INSTRUMENTS FOR DATA COLLECTION
The study used questionnaire for the data collection. Structured questionnaires, which contained
mostly of closed ended questions was used to collect the data from the respondents. The
questionnaire was designed based on the research problem, research objectives and the research
questions. The questions were structured in order to present a standard pattern for editing,
categorization and effective analysis of the data. The questions provided a section for the
INTERNATIONAL JOURNAL OF ADVANCE RESEARCH, IJOAR .ORG ISSN 2320-9127 17
IJOAR© 2014
http://www.ijoar.org
respondents to present their personal data which included age of respondents, educational
background of respondents and gender of the respondents and years of living the Obuasi
Municipality. Other aspect of the question used Likert scale of 5=strongly agree, 4=Agree,
3=neutral, 2=disagree and 1=strongly disagree.
The data were subsequently tabulated and descriptive statistics such as frequencies and
percentages were employed for the analysis. These were put into histogram, bar charts and
frequency tables for effective presentation of the study findings and the analysis. SPSS was used
to analyzed and present the data.
EMPIRICAL RESULTS
DEMOGRAPHIC CHARACTERISTICS OF RESPONDENTS
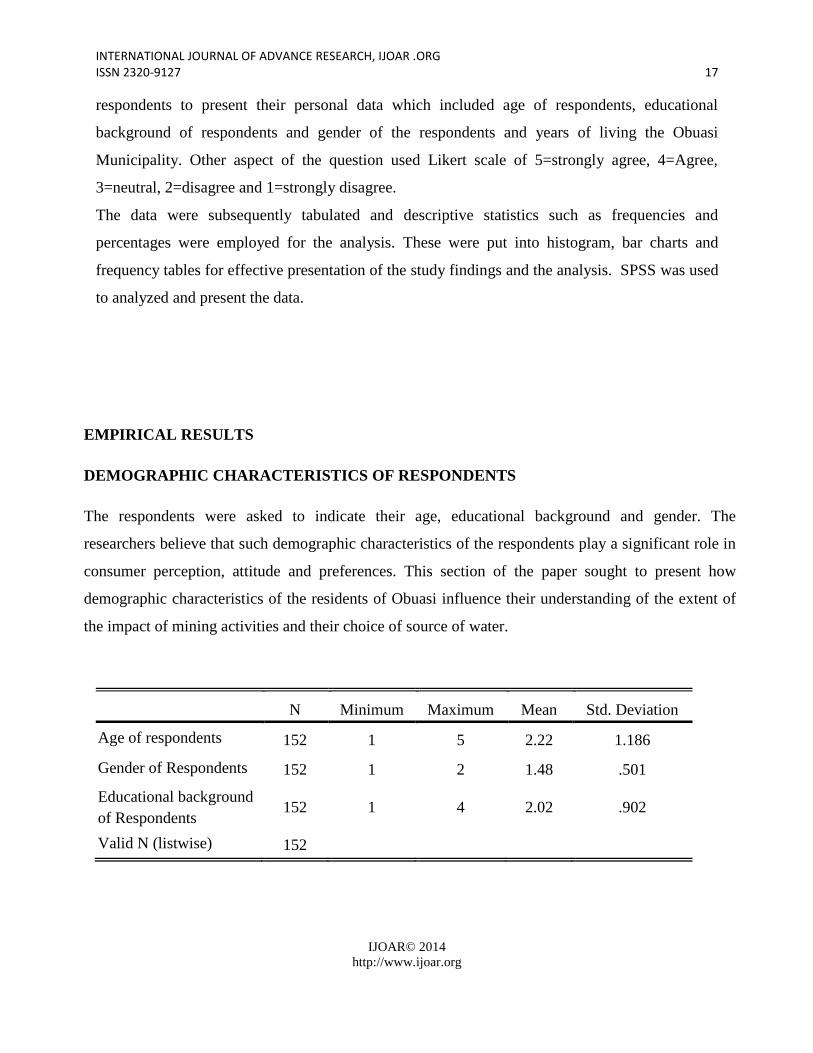
The respondents were asked to indicate their age, educational background and gender. The
researchers believe that such demographic characteristics of the respondents play a significant role in
consumer perception, attitude and preferences. This section of the paper sought to present how
demographic characteristics of the residents of Obuasi influence their understanding of the extent of
the impact of mining activities and their choice of source of water.
N Minimum Maximum Mean Std. Deviation
Age of respondents 152 1 5 2.22 1.186
Gender of Respondents 152 1 2 1.48 .501
Educational background
of Respondents 152 1 4 2.02 .902
Valid N (listwise) 152
INTERNATIONAL JOURNAL OF ADVANCE RESEARCH, IJOAR .ORG ISSN 2320-9127 18
IJOAR© 2014
http://www.ijoar.org
Age of Respondents: 54 respondents which account for 35.5% are within the age of 21 to 30
years, 40 respondents which account for 26.3% are within 31 to 40 years, 37 respondents
representing 24.3% are within age of 41 to 50years whereas12 of the respondents representing
7.9% are within the age of 51 to 60 year and 9 of the respondents representing 5.9% are above 60
year. Similarly, the average age recorded (mean 2.22, standard deviation 1.186).
Gender of respondents: out of the 152 customers sampled, 79 (52%) constituted male and 73
(48%) female, indicating a high proportion of males. The information obtained above with
regards to gender distribution indicates that male‘s response more than females.
Educational level of Respondents: 54 of the respondents were found to the tertiary holder which
represent 35.5%, 47 of the respondents were also found to the Senior high school holders/
vocational/technical which represent 30.9% while 45 of the respondents were found to be Junior
High school/MSLC holders which represent 29.6%, and 6 of the respondents have not been to
school which represent 3.9%. It shows that average educational background of the respondents
was (mean 2.02, standard deviation 0.902), this signifying that, most of the respondents were
tertiary and SHS graduate. However it implies that respondents have good educational
background are able to appreciate a research study of this nature.
RESIDENTS SOURCES OF WATER IN OBUASI
83 of the respondents which represent d 54.6%, said that ―Ghana water company limited‖was
sources of water for Obuasi, 18 of respondents which represents 11.8% said that private water
suppliers was sources of water for Obuasi, while 27 of the respondents 17.8% said that
―community borehole‖ was sources of water for Obuasi, 14 of the respondents which represents
9.2% said that ―well‖ was sources of water for Obuasi, 10 of the respondents rely on ―other
sources‖ of water in Obuasi.
FACTORS THAT INFLUENCE CHOICE OF A SOURCE OF WATER
The research sought to identify factors that influence individual consumer‘s choice of source of
water in the Obuasi municipality and assess the relative importance of the pertinent factors. The
factors include company cost, health and safety, convenience and easy access. Data was analyzed
using Mean Scores (MSc.) and Standard Deviations (Std. Dev.). Mean Scores were used to

INTERNATIONAL JOURNAL OF ADVANCE RESEARCH, IJOAR .ORG ISSN 2320-9127 19
IJOAR© 2014
http://www.ijoar.org
determine the extent to which the respondents considered each of the factors important in their
choice of a source of water. Scale ranging from ―strongly agree‖ (1) to ―strongly disagree‖ (5),
Standard deviations were used to assess the relative importance of the pertinent factors. However
the score of ―strongly agree‖ and ―agree‖ was equivalent to 1 to 2.5. The scores of ―neutral‖ was
equivalent to 2.6 to 3.5 and the scores ―disagree‖ and ―strongly disagree‖ is equivalent to 3.6 to
5.
The results indicates that the ability of cost influences consumers is considered to be neutralby
consumers when making a choice between different sources of water in Obuasi municipality
which shown a mean score of 2.72. However, the relative importance of this factor is
significantly among the users of water as reflected in the standard deviation of 0.767.In addition,
the ability of health and safety influence consumers also was strongly agreed by respondents in
Obuasi municipality as it shown a mean score of 1.32. However, their degree of considerationis
significantly among consumers (Std. Dev= 0.582). Lastly, the ability of convenience and easy
access influence consumers also was agreed by respondents in Obuasi municipality as it shown a
mean score of 2.34. However, their degree of consideration is significantly among consumers
(Std. Dev= 0.991).
MINING ACTIVITIES AND CONSUMER PREFERENCE OF WATER SOURCES
The study compares residents‘ perception of the mining activities in the community and their
preference of water sources in the Obuais municipality. The researchers assumed that the nature
of mining activities may influence consumer perception of quality of water supplied,
consumption patterns and finally preference of water sources. The mean score and standard
deviation derivatives were obtained from the questionnaire item of mining activities and
consumer preference of water sources.
The outcome indicates that respondents strongly agree that mining activities in Obuasi has
affected the water supply in the community which shown a mean score of 1.15. However, its
effects significantly affectthe citizen of communityas reflected a less standard deviation of
0.360. Moreover, respondents strongly agree that mining activities in Obuasi has affected the

INTERNATIONAL JOURNAL OF ADVANCE RESEARCH, IJOAR .ORG ISSN 2320-9127 20
IJOAR© 2014
http://www.ijoar.org
consumption pattern in the community as it shown a mean score of 1.18. Though, their degree of
consideration significantly affects citizen of community (Std. Dev= 0.400). Lastly, respondents
strongly agree that mining activities in Obuasi has affected consumer preference of portable
water in the community which shown a mean score of 1.16.Conversely, their degree of attention
does not significantly affects among consumers (Std. Dev= 0.389).
Residents’ perception of mining activities and sources of water supply
129 of the respondents which represents 84.9%, strongly agree that mining activities affects
water supply in the community, 23 of respondents which represents 15.1% agree that mining
activities affects water supply in the community and none of the respondents was remain neutral,
disagree and strongly disagreed that mining activities affects water supply in the community.
Mining activities affects consumption pattern.
126 of the respondents which represents 82.9%, strongly agree that mining activities affects the
consumption pattern of water supply in the community, 25 of respondents which represents
16.4% agree that mining activities affects the consumption pattern of water supply in the
community, 1 of the respondent remain neutral that mining activities affects the consumption
pattern of water supply in the community and none of the respondents was disagree and strongly
disagreed that mining activities affects the consumption pattern of water supply in the
community.
Consumer preference of water is influenced by mining activities
128 of the respondents which represents 84.2%, strongly agree that consumer preference of
portable water is influenced by mining activities, 23 of respondents which represents 15.1%
agree that consumer preference of portable water is influenced by mining activities, 1 of the
respondent remain neutral that consumer preference of portable water is influenced by mining
activities and none of the respondents was disagree and strongly disagreed that consumer
preference of portable water is influenced by mining activities.
The study compares residents‘ perception of the mining activities in the community and their
preference of water sources in the Obuasi municipality. The researchers assume that the nature of
INTERNATIONAL JOURNAL OF ADVANCE RESEARCH, IJOAR .ORG ISSN 2320-9127 21
IJOAR© 2014
http://www.ijoar.org
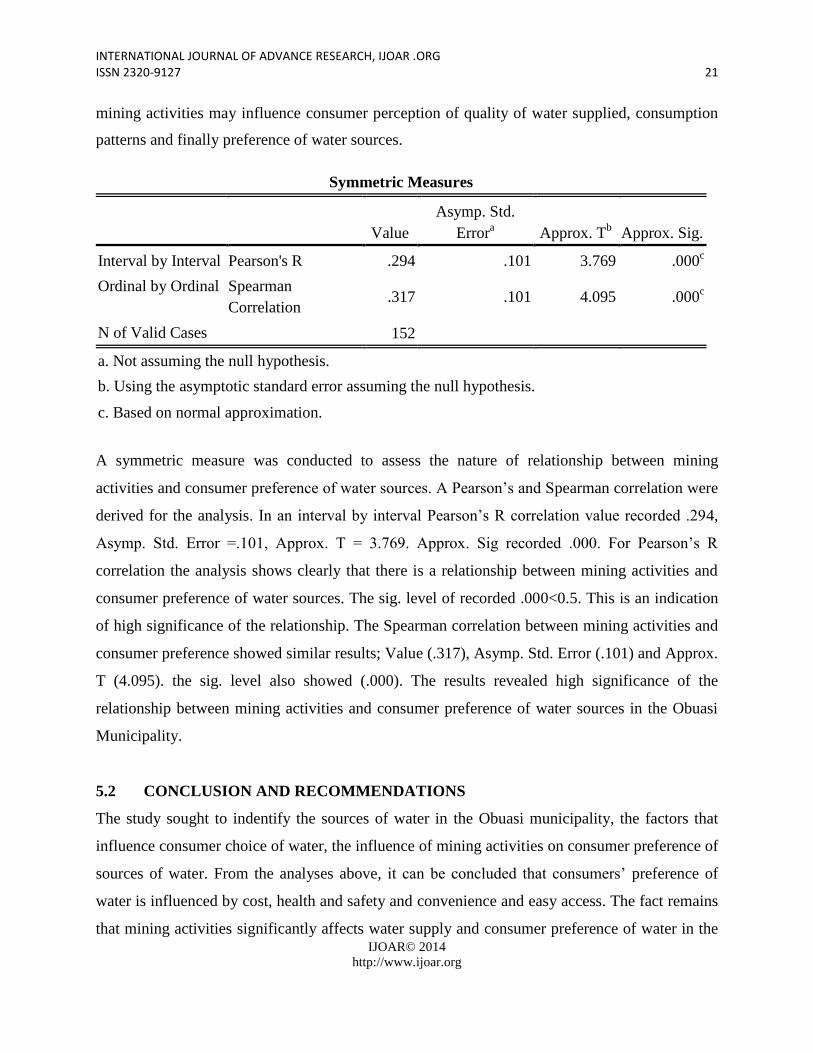
mining activities may influence consumer perception of quality of water supplied, consumption
patterns and finally preference of water sources.
Symmetric Measures
Value
Asymp. Std.
Errora Approx. T
b Approx. Sig.
Interval by Interval Pearson's R .294 .101 3.769 .000c
Ordinal by Ordinal Spearman
Correlation .317 .101 4.095 .000
c
N of Valid Cases 152
a. Not assuming the null hypothesis.
b. Using the asymptotic standard error assuming the null hypothesis.
c. Based on normal approximation.
A symmetric measure was conducted to assess the nature of relationship between mining
activities and consumer preference of water sources. A Pearson‘s and Spearman correlation were
derived for the analysis. In an interval by interval Pearson‘s R correlation value recorded .294,
Asymp. Std. Error =.101, Approx. T = 3.769. Approx. Sig recorded .000. For Pearson‘s R
correlation the analysis shows clearly that there is a relationship between mining activities and
consumer preference of water sources. The sig. level of recorded .000<0.5. This is an indication
of high significance of the relationship. The Spearman correlation between mining activities and
consumer preference showed similar results; Value (.317), Asymp. Std. Error (.101) and Approx.
T (4.095). the sig. level also showed (.000). The results revealed high significance of the
relationship between mining activities and consumer preference of water sources in the Obuasi
Municipality.
5.2 CONCLUSION AND RECOMMENDATIONS
The study sought to indentify the sources of water in the Obuasi municipality, the factors that
influence consumer choice of water, the influence of mining activities on consumer preference of
sources of water. From the analyses above, it can be concluded that consumers‘ preference of
water is influenced by cost, health and safety and convenience and easy access. The fact remains
that mining activities significantly affects water supply and consumer preference of water in the
INTERNATIONAL JOURNAL OF ADVANCE RESEARCH, IJOAR .ORG ISSN 2320-9127 22
IJOAR© 2014
http://www.ijoar.org
obuasi community. It can be confirmed that consumers of water in the Obuasi are not really
satisfied with the sources of water and consumption patterns in the municipality as the study
suggest.
This study clearly indicates that mining activities in Obuasi have affected the water supply in the
municipality, from the point view of the respondents and availability of information, the
following recommendation are outline below;
Government should make effort to support water consumption in Obuasi municipality by
providing more boreholes in affected communities.
Government should put measure in place to check mining in the municipality with regards to
water supply as respondents shown their suspicion of water contamination.
Mining companies around the communities should provide support to the people to help the
effort of Ghana Water Company on supply of water in the municipality.
Government should put measures in place to ensure that mining companies would not pollute the
water system in the municipality
It is also important to recommend that Environment Protection Agency should regularly monitor
the operation of mining companies on the extent of impact mining activities have on water sources.
REFERENCES
Abley, J. (2000). Stated preference techniques and consumer decision making: new challenges to old
assumptions. Cranfield School of Management Working Papers, 2/00, SWP;2/00.
Abou-Ali, H. (2003). Using stated preference methods to evaluate the impact of water on health: the case
of metropolitan Cairo. Scandinavian Working Papers in Economics, No 113.
Adote Abrahams, N., Hubbell, B.J. & Jordan, J.L. (2000). Joint production and averting expenditure
measures of willingness to pay: Water expenditures really measure avoidance costs? American Journal of
Agricultural Economics, 82 427-437.
Ajzen, I. (1985). From intentions to actions: A theory of planned behaviour. In Kuhl, J., and Beckmann,
J., (eds.) Action control: from cognition to behaviour. Springer, Berlin, 11-39.
Al-Ghuraiz, Y. & Enshassi, A. (2005). Ability and willingness to pay for water supply service in the Gaza
Strip. Building and Environment ,40, 1093-1102.
INTERNATIONAL JOURNAL OF ADVANCE RESEARCH, IJOAR .ORG ISSN 2320-9127 23
IJOAR© 2014
http://www.ijoar.org
Barnett, J., Timotijevic, L., Shepherd, R. & Senior V. (2009). Public responses to precautionary
information from the Department of Health about possible health risks from mobile phones. Health
Policy.
Bateman, I.J. et al (2002). Economic Valuation with Stated Preference Techniques: A Manual, Edward
Elgar, Cheltenham.
Bates, A.J., (2000) Water as consumed and its impact on the consumer – Do we understand the variables?
Food and Chemical Toxicology, 38, 29-36.
Biswas, A. K., Jayatilaka, R. & Tortajada C. (2005) Social perceptions of the impacts of Colombo water
supply projects. Ambio: A Journal of the Human Environment, 34(8), 639-644.
Boxall, P., Adamowicz, W., Swait, J., Williams, M. & Louviere, J. (1996). A comparison of stated
preference methods for environmental valuation. Ecological Economics, 18, 243-253.
Breakwell G M and Barnett J. (2001) The Impact of Social Amplification on Risk Communication,
Contract Research Report 322/2001, Health and Safety Executive London: Sudbury
Bronfman, N. C. & Cifuentes, L. A. (2003) Risk perception in a developing country: The case of Chile.
Risk Analysis, 23(6), 1271-1285.
Brouwer, R. (2004) Wat is schoon water u waard? - Beleving en betalingsbereidheid van Nederlanders
voor schoner water, RIZA rapport 2004.013, Lelystad.
Bruvold, W.H. (1981) Community evaluation of adopted uses of reclaimed water. Water Resources
Research, 17, 487-490.
Bruvold, W.H. (1985) Obtaining public support for reuse water. American Water Works Association
Journal, 77, 72-77.

INTERNATIONAL JOURNAL OF ADVANCE RESEARCH, IJOAR .ORG ISSN 2320-9127 24
IJOAR© 2014
http://www.ijoar.org
Bruvold, W.H. (1988) Public opinion on water reuse options. Journal of Water Pollution Control
Federation, 60, 45-49.
Burn, L. S., Tucker, S. N., Rahilly, M., Davis, P., Jarrett, R., and Po, M. (2003) Asset planning for water
reticulation systems - the PARMS model. Water Science & Technology: Water Supply, 3(1-2), 55-62.
Carmen, J.M. (1990). Consumer perceptions of service quality: an assessment of the SERVQUAL
dimensions. Journal of Retailing, 66, 33-55.
Cho, Y., Easter, K.W., McCann, L.M.J., Homans, F. (2005) Are rural residents willing to pay enough to
improve drinking water quality? Journal of the American Water Resources Association, 41(3), 729-740.
Coulibaly, H.D. & Rodriguez, M.J. (2004). Development of performance indicators for small Quebec
Falahee, M., & MacRae, A. W. (1995). Consumer Appraisal of Drinking Water: Multidimensional
Scaling Analysis. Food Quality and Preference, 6, 327-332.
Fessenden-Raden, J., Fitcten, J.M., & Heath, J.S. (1987). Providing risk information in communities:
Factors influencing what is heard and accepted. Science, Technology and Human Values, 12, 94-101.
Fischhoff B, Lichtenstein S, Slovic P, Keeney D. (1981). Acceptable Risk. Cambridge, Mass: Cambridge
University Press.
Fife-Schaw, C.R., Kelay, T., Vloerbergh, I., Ramaker, T., Chenoweth, J. Morrison, G. & Lundéhn, C.
(2007). Consumer Trust and Confidence: An Overview. TECHNEAU Report, http://www.techneau.org.
Flynn, J., Slovic, P., & Mertz, C. K. (1994). Gender, race, and perception of environmental health risks.
Risk Analysis, 14, 1101-1108.
Frewer L., Miles, S., Brennan, M., Kuznesof, S., Ness, M. & Ritson,C. (2002). Public preferences for
informed choice under conditions for risk uncertainty. Public Understanding of Science, 11, 363 – 372.

INTERNATIONAL JOURNAL OF ADVANCE RESEARCH, IJOAR .ORG ISSN 2320-9127 25
IJOAR© 2014
http://www.ijoar.org
Gleick, P. H. (2004). The myth and reality of bottled water. In P. H. Gleick (Ed.), The world's water
2004-2005 (pp. 17-43). Washington: Island Press.
Griffin, R.C., Mjelde, J.W. (2000), ‗Valuing Water Supply Reliability‘, American Journal of Agricultural
Economics, 82, 414–26.
Grönroos, C. (1984), A service quality model and its marketing implications. European Journal of
Marketing, 18, 36-44.
Hartley, T. W. (2006) Public perception and participation in water reuse. Desalination, 187, 115-126.
Hatton MacDonald, D., Barnes, M., Bennet, J., Morrison, M., and Young, M. (2003), What consumers
value regarding water supply disruptions: A discrete choice analysis?, CSIRO Australian Meeting of the
Econometric Society, 9-11 July 2003, Sydney, New South Wales.
Henscher, D., Shore, N. and Train, K. (2006). Water Supply Security and Willingness to Pay to Avoid
Drought Restrictions. The Economic Record, 82,56–66.
Dietrich, A.M. (2006) Aesthetic issues for drinking water, Journal of Water and Health, 4, 11-16.
Dolnicar S. & Saunders C., (2006): Recycled water for consumer markets — a marketing research review
and agenda. Desalination, 187, 203–214
Doria, M.F. (2006). Bottled water versus tap water: understanding consumerspreferences.
Journal of Water Health, 271-276.
Dupont, D. (2005) Tapping into consumers‘ perceptions of drinking water quality in Canada: Capturing
customer demand to assist in better management of water resources. Canadian Water Resources Journal,
30, 11-20.

INTERNATIONAL JOURNAL OF ADVANCE RESEARCH, IJOAR .ORG ISSN 2320-9127 26
IJOAR© 2014
http://www.ijoar.org