effects of methyl propionate on the performance of …
TRANSCRIPT
Francesca Muto, Emily TangAdvisors: Mingyu Yu, Zheng Chen
EFFECTS OF METHYL PROPIONATE ON THE PERFORMANCE OF LITHIUM ION BATTERIES
INTRODUCTION:• Lithium ion batteries are a viable option for a high powered, renewable energy source, but there are many
improvements that must be made to the current commercial lithium ion battery• As time passes, lithium ions are consumed during the lithiation and de-lithiation processes, and the internal
impedance increases, which decrease the discharge capacities of the cells• Additives in the electrolyte have the potential to positively impact the molecular interactions which can help
combat the decrease in discharge capability
BACKGROUND:• Inside the battery, negative charges in electrolytes are transported through the separator from cathode to anode, and the opposite
direction for positive charge; the movement of positive charges and electrons lead a current circuit• High charge rates and cyclability are important for adopting lithium ion batteries as a renewable energy source, for use in everything from
phones to electric vehicles• A commonly used commercial electrolyte that was used as the control group is LP40• Methyl propionate (MP) is an electrolyte additive used to improve the performance of lithium Ion batteries
OBJECTIVE:The goal of this experiment is to measure the impact of Methyl Propionate as an electrolyte additive on the performance of lithium Ion batteries, with regards to their charging rate and cyclability.
CONCLUSION• Battery performance is important for everyday life, especially with the rise
of electric vehicles• To test the performance and the effects that additives have, coin cell
batteries were made with different weight percent of Methyl Propionate• The control group of batteries only contained LP40 in the electrolyte
solution• The results of the experiment showed that all the MP weight percentages
cannot help improve the rate capability or cycling stability significantly• The 20wt% group seems to perform the best, achieving the highest
capacity in the cycling test, while the 40wt% and 60wt% groups performed worse than the control group performance
DISCUSSION• A study conducted by NASA JPL demonstrated that MP additives generally
increase the performance of lithium ion batteries when consideringtemperature power capabilities and battery life [1]
• The results of testing battery life in this experiment did not show enoughdegradation, which is something to investigate for future studies
• Another study suggests MP outperforms other ester co-solvents inimproving battery performance because of the low freezing points, highionic conductivity, and low viscosity [2]
• In the experiment, the 40wt% MP was able to charge more rapidly withoutunwanted lithium plating, and up to 20wt% MP was compatible with theelectrodes used
• This experiment presented several inconsistencies and does not point to alinear relationship between using MP as an electrolyte additive to LiPF6
• Possible explanation for the lack of a direct relation between the two arechemical reactions within the half cells, lithium plating, or compatibilitywith the electrodes
• Going forward, the goal is to find what variables affected our results, howto account for these variables, and further testing of other additives to findthe most effective solution
References:[1] Smart, Marshall C., and Ratnakumar V. Bugga. 2011. "Use Of Additives To Improve Performance Of Methyl Butyrate-Based Lithium-Ion Electrolytes". NASA Tech Brief 32(4), 56. https://ntrs.nasa.gov/search.jsp?R=20120006528.[2] Ma, X.; Arumugam, R. S.; Ma, L.; Logan, E.; Tonita, E.; Xia, J.; Petibon, R.; Kohn, S.; Dahn, J. R. A Study of Three Ester Co-Solvents in Lithium-Ion Cells. J. Electrochem. Soc. 2017, 164 (14), A3556–A3562. https://doi.org/10.1149/2.0411714jes.[3] Elahe Talaie, Patrick Bonnick, Xiaoqi Sun, Quan Pang, Xiao Liang, and Linda F. Nazar. 2017. “Methods and Protocols for Electrochemical Energy Storage Materials Research”. Chemistry of Materials 29 (1), 90-105. https://doi.org/10.1021/acs.chemmater.6b02726
ACKNOWLEDGEMENTS:Thank you to Dr. Zheng Chen and Mingyu Yu for their thoughtful guidance and mentorship. Additionally, thank you to Alejandra Arguelles, Lisa Trahan, Maritza Sanchez, and Dr. Katya Evdokimenko for their support.
SUMMARY OF METHODS
STEP 1: Cathode Fabrication
Weigh to find the mass of the active ingredients
Press the cathodes
Dry in vacuum for at least 8 hours
Cut into 12mm-diameter disks
Spread on Al foil, adjust thickness to ~10μm
Mix ingredientsCombine
NMP + PVDFMix until
homogenousAdd Super P
Mix until homogenous
Adjust for consistency
Measure for the composition ratio 8:1:1 (NMC111:PVDF:Super P)
Figure 1: Cathode slurry afterbeing mixed to a smoothconsistency
STEP 3: Half Cell Assembly• Assemble two half cells per group, a total of
eight half cells. See Figure 2 & 3 for assembly details
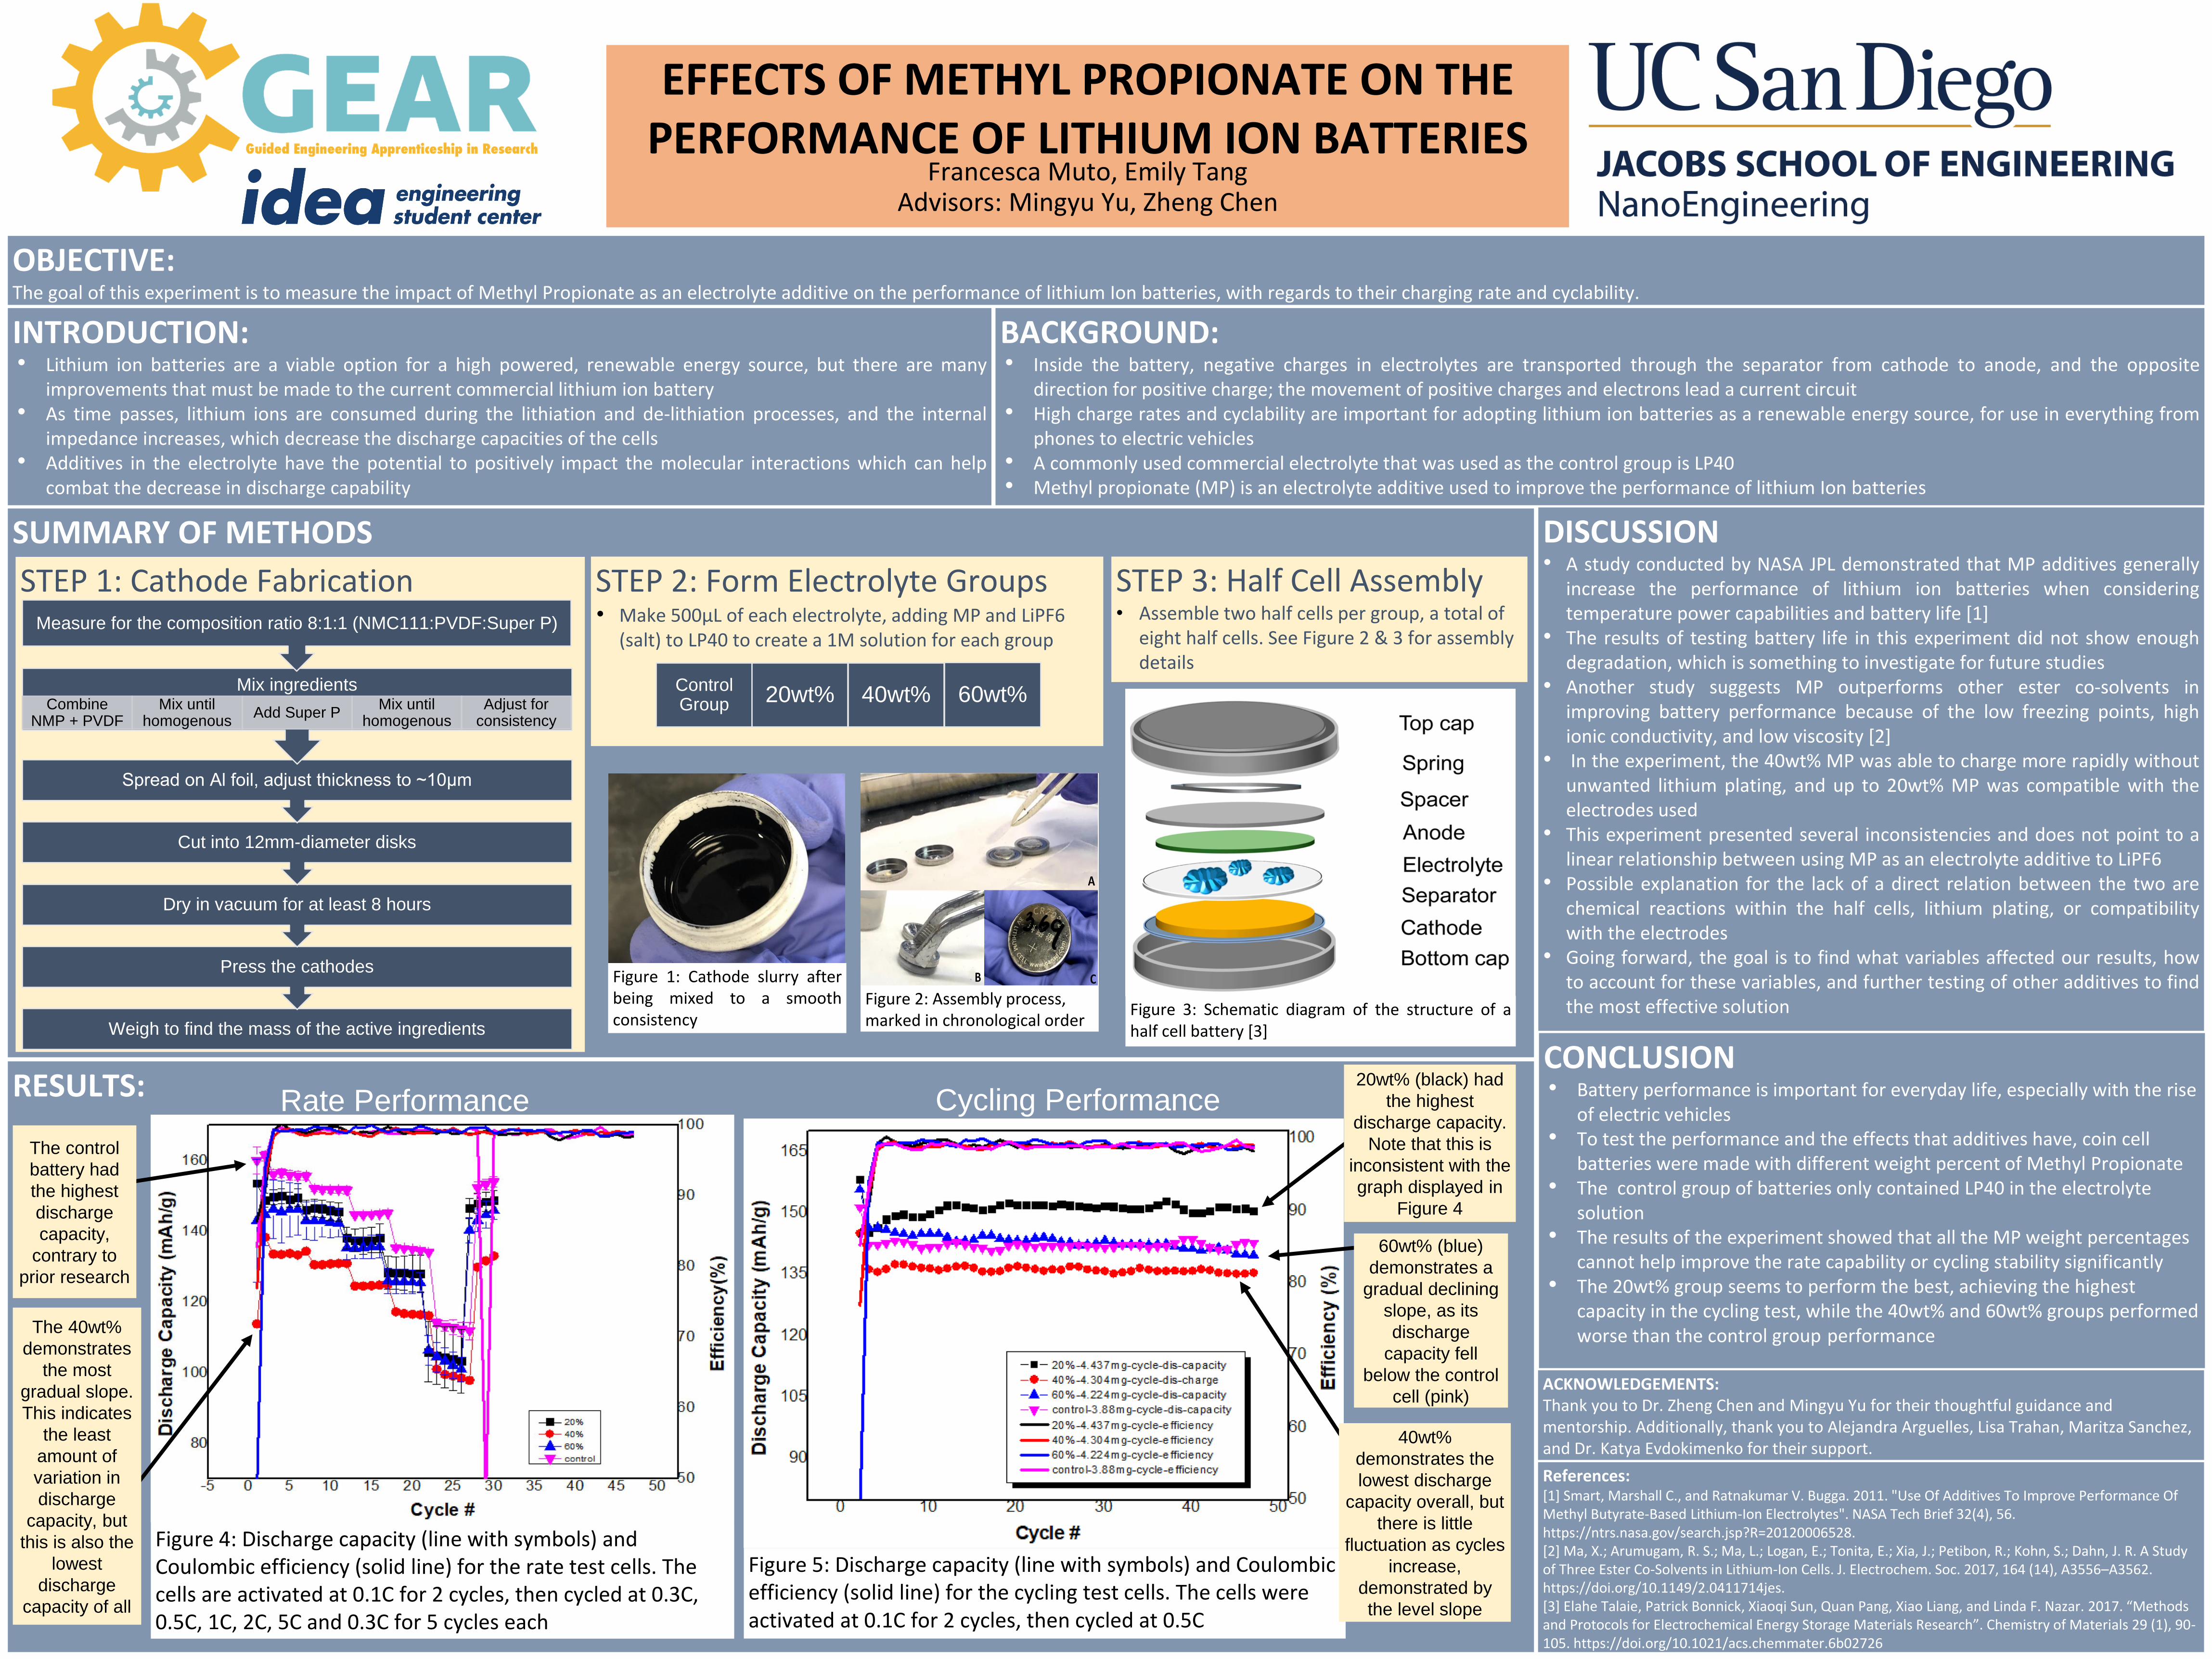
RESULTS:
Figure 4: Discharge capacity (line with symbols) and Coulombic efficiency (solid line) for the rate test cells. The cells are activated at 0.1C for 2 cycles, then cycled at 0.3C, 0.5C, 1C, 2C, 5C and 0.3C for 5 cycles each
The control
battery had
the highest
discharge
capacity,
contrary to
prior research
The 40wt%
demonstrates
the most
gradual slope.
This indicates
the least
amount of
variation in
discharge
capacity, but
this is also the
lowest
discharge
capacity of all
Rate Performance
Figure 5: Discharge capacity (line with symbols) and Coulombic efficiency (solid line) for the cycling test cells. The cells were activated at 0.1C for 2 cycles, then cycled at 0.5C
20wt% (black) had
the highest
discharge capacity.
Note that this is
inconsistent with the
graph displayed in
Figure 4
60wt% (blue)
demonstrates a
gradual declining
slope, as its
discharge
capacity fell
below the control
cell (pink)
40wt%
demonstrates the
lowest discharge
capacity overall, but
there is little
fluctuation as cycles
increase,
demonstrated by
the level slope
Cycling Performance
Figure 2: Assembly process, marked in chronological order
Figure 3: Schematic diagram of the structure of ahalf cell battery [3]
STEP 2: Form Electrolyte Groups• Make 500μL of each electrolyte, adding MP and LiPF6
(salt) to LP40 to create a 1M solution for each group
Control Group 20wt% 40wt% 60wt%