effects of magnetically treated water on water status ... · pdf fileit is highly important is...
TRANSCRIPT

African Journal of Environmental Science and Technology Vol. 5(9), pp. 722-731, September 2011 Available online at http://www.academicjournals.org/AJEST ISSN 1996-0786 ©2011 Academic Journals
Full Length Research Paper
Effects of magnetically treated water on water status, chlorophyll pigments and some elements content of Jojoba (Simmondsia chinensis L.) at different growth
stages
Mulook Al-Khazan, Batoul Mohamed Abdullatif* and Nabila Al-Assaf
Department of Biological Sciences , Girls' Faculty of Science , King Abdul Aziz University, P. O. Box 80324, Jeddah 21589, Saudi Arabia.
Accepted 1 August, 2011
In this study, the biological effects of magnetically treated water (MTW) under different water regimes (70, 50, and 30% SWHC) on water relations, photosynthetic pigments and nutrient contents of Jojoba plants has been studied under laboratory conditions. The results indicate that the magnetically treated water especially at 50 and 30% treatments has an enhancing effect on the photosynthetic pigments compared to the control. Also water use efficiency (WUE) (in term of biomass produced to amount of water consumed), was increased in the plants irrigated with MTW as compared to the control treatment, while relative water content (RWC) was increased with MTW under 30% soil water holding capacity (SWHC) to the highest levels only after both 6 and 8 months. The essential elements except sodium were increased significantly (P≤0.01) in plants irrigated with MTW compared to their control. Thus, the present results have shown that irrigation with MTW can be considered as one of the most valuable modern technologies that can assist in saving irrigation water and reducing salt accumulation in plants. Key words: Jojoba, magnetic water treatment (MTW), water use efficiency (WUE), relative water content (RWC).
INTRODUCTION Magnetic water treatment (MWT) remains a little known treatment in the field of plants metabolism and water relations. The literature contains very little on the effects of irrigating plants with magnetized water. In order to fully understand how magnetized magnetically treated water works it is important to know a little bit about the properties of the water that comes out of our taps. The original source of water is mountain streams, which flow into rivers and eventually out to seas. The water has had contact with both over ground and underground during the passage to the sea. As Through the water passes into underground (many rivers and streams pass underground) it comes into contact with the earth’s magnetic field, which magnetically treated water. The magnetic charge is passed into the water and it becomes *Corresponding author. E-mail: [email protected].
magnetized. Similarly as the water flows over ground it comes into contact with magnetic rock (lodestone) and water is treated again magnetized. Water which is destined for consumption, has to be treated and purified. Transportation to the treatment plant is done by underground metal pipes. The water loses its magnetic charge by the presence of the metallic lining of the pipes and when it is purified and comes out of the tap it is no longer magnetized (Coey and Cass, 2000; Amiri and Dadkhah, 2006).
It is highly important is to know how magnet affect water. The main use of the magnet is to pass the water through the magnets negative field for the water to be treated (Kronenberg, 1993; Nafalski and Andrzej, 1994; Davies, 1996).
Charan (2009) has reported that, a plant's metabolism contains 90 to 95% of water which is a diamagnetic compound and the rest contains several para, ferro and diamagnetic metals and non-metals in minute forms.

Al-Khazan et al. 723
The magnet
Magnetically
treated water
Normal water
Picture 1. The experimental design of static magnet apparatus. The normal water flow from the source to magnetic field in the apparatus for water treatment.
Thus, magnetized water treatment increases plant metabolism in terms of photosynthesis and water uptake (Yano et al., 2004). Magnetic water treatment has found to have a pronounced effect on plants productivity (Basant and Singh, 2009) who reported that their results indicated some beneficial effects of magnetically treated irrigation water, particularly for saline water and recycled water, on the yield and water productivity of celery and snow pea plants under controlled environmental conditions.
Concerning water use efficiency (WUE), no recent literature is available when plants are irrigated with magnetically treated water, this should not be the case since WUE normally associated with plant production.
Horst et al. (2005) and Loveys et al. (2004) stated that, increasing water use efficiency (WUE) associated with crop production is a way for arid and semi-arid areas to increase their agricultural production where there is little or no prospect for expansion of water resources.
Similarly, Chaves and Oliveira (2004) and Ayars et al. (2006) suggested that WUE is a mechanism underlying plant resilience to water deficits prospects for water-saving agriculture. MATERIALS AND METHODS
Treatment of water
Water was treated magnetically by using a small magnet (5000 Gous), which was designed especially for pots experiments. This system is easy to use and inexpensive. The magnet was connected to the water pipes, while the other part of the pipe was used for
normal water, so that, water for all treatments comes from the same source (Picture1). Experimental design Glasshouse experiments were conducted using plastic pots (40 cm height, 29 cm in diameter). Seeds were germinated in a sandy loam soil. Different water regimes had been applied according to soil water holding capacity (SWHC). These include: 70, 50 and 30% (SWHC). The pots were divided into two main water types
The first one was irrigated with tap water and the other one were irrigated with magnetically treated water under different water regimes. These experimental treatments were represented by C1 (70% tap water), C2 (70% MTW). T1 (50% tap water), T2 (30% tap water), T3 (50% MTW) and T4 (30% MTW). The experiments were then divided into four harvest times: ( 2, 4, 6 and 8 months after cultivation).These periods were taken to represent the most critical stages in Jojoba life cycle (Jojoba Growers Association, 1990). Measurements of plant parameters
Relative water content (RWC) Fresh Jojoba leaves discs were immediately weighed to obtain the fresh weight, they were then put in petri dishes over night in the dark to obtain the turgid weight, after which they were oven dried for their dry weight. RWC was calculated following Imtiaz et al. (1998). Photosynthetic pigments 5 upper most expanded leaves were randomly taken from each treatment to measure photosynthetic pigments (chlorophyll A, B and carotenoides) spectrophotometerically using method of Lichtenthaler (1987).

724 Afr. J. Environ. Sci. Technol.
0
10
20
30
40
50
60
70
80
90
100
2 month 4 month 6 month 8 month
RW
C (
%)
Time after cultivation
control 1 T1 T2 Control 2 T3 T4
a
2 4 6 8
Time after cultivation (month)
Figure 1. Changes in relative water content (RWC) with water stress and magnetic water treatments at different periods of time (2, 4 and 8 months after cultivation). (a) Statistically significant (P ≤ 0.01) compared to C1, (b) compared to C2.
Water use efficiency (WUE)
WUE efficiency was calculated following Larcher (1995). The total dry weight of the plant was related to the amount of water consumed during certain period (2, 4, 6 and 8 months). Mineral element in plants Elements were determined after digestion of a definite weight of dry ground leaves according to Stewart (1983). Atomic absorption spectrometer, model mettler DL55/ DR 2010/ WTW was used. Statistical analysis One way analysis of variance (ANOVA) was used to determine the significant differences between treatments. Standard error (SE) bars were included. The SPSS 10.0 software was used for such estimation. RESULTS In general, the highest value of RWC was recorded in T4 six months after cultivation (MAC), while the lowest value of RWC (74.8%) recorded in T2 two MAC (Figure 1). When following each cultivation period we noticed that, two MAC C2 had the highest RWC (84.0%) while T2 attained with 74.8% Eight MAC, plants irrigated with treated water continued to achieve high values even under water stress. This was noticed in T3 and T4 that achieved values of 88.7 and 88.2% respectively.
The result in Figure 2 reveals that the amount of photosynthetic pigments (chlorophyll a, b, and
carotenoides) increased significantly in all the plants irrigated with treated water as compared to those irrigated with normal water (P≤0.01). For instance, two MAC in control 2 (70 treated water) accomplished an increase of 59% of the value chlorophyll A, more than control 1 (70% normal water) (0.35 mg/g/fresh weight compared with 0.22 mg/g/fresh weight). Eight MAC in T4 (30% treated water) has the highest chlorophyll A value (0.40 mg/g/fresh weight) with increase of 90.5% more than its correspondence T2 (30% normal water) which attained 0.21 mg/g/fresh weight of chlorophyll A.
The content of chlorophyll B increased significantly (P≤0.01) with the irrigation by treated water as compared to normal water (Figure 3). Control 2 attained the highest value of chlorophyll B as a result of magnetic water. This appear clearly two MAC, when C 2 attained a value of 20 mg/g/fresh weight compared to 0.05 mg/g/fresh weight of control 1 (P≤0.01). Plants irrigated with treated water attained high content of chlorophyll B throughout the experimental period.
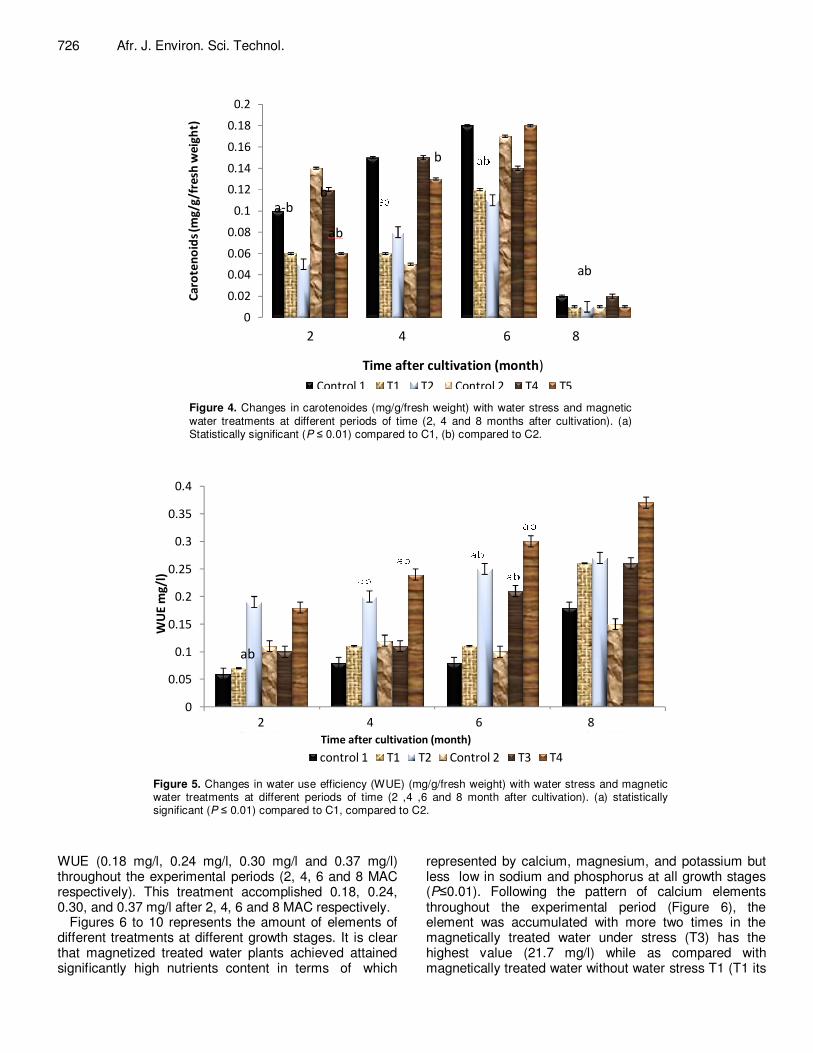
In general, the amount of carotenoides decreased in all plants under the two water type at eight MAC (Figure 4). However, results of carotenoides showed that the significant increase (P≤0.01) high rate content in plants irrigated with magnetized treated water as compared to their correspondence of normal water. The magnetic treatments under water stress (T3 and T4) achieved the highest values (0.16 and 0.18 mg/g/fresh weight) respectively among other treatments. The increase percentage of carotenoides (100%) to the normal water T1 was recorded in T3 at Two MAC. T3 achieved an increase of 100% compared to its correspondence of

Al-Khazan et al. 725
0
0.05
0.1
0.15
0.2
0.25
0.3
0.35
0.4
0.45
0.5
2 month 4 month 6 month 8 month
Ch
loro
ph
yll
a (m
g/g/
fre
sh w
eig
ht)
Time after cultivation
control 1 T1 T2 control 2 T3 T4
ab
abab
a
a
Time after cultivation (month)
2 4 6 8
Figure 2. Changes in chlorophyll a (mg/g/fresh weight) with water stress and magnetic water treatments at different periods of time (2, 4, 6 and 8 months after cultivation, (a) Statistically significant (P ≤ 0.01) compared to C1, (b) compared to C2.
0
0.05
0.1
0.15
0.2
0.25
0.3
2 months 4 months 6 months 8 months
Time after cultivation
Control 1 T1 T2 Control 2 T3 T4
a-b
a-b a-bb a-b ab
2 4 6 8
Time after cultivation (month)
Figure 3. Changes in chlorophyll b (mg/g/fresh weight) with water stress and magnetic water treatments at different periods of time (2,4,6 and 8 month after cultivation). (a) Statistically significant (P ≤ 0.01) compared to C1, (b) compared to C2.
normal water (T1) with amount of 0.12 mg/g/fresh weight compared to 0.06 mg/g/fresh weight.
Results in Figure 5 indicates the values of WUE. Magnetized treated water that led to an increase in plants
has the highest values of WUE as compared to their correspondence of normal water (Figure 5). Generally, it was noticed that in general, WUE of two MAC was lower and higher than eight MAC. T4 had the highest values of
ch
loro
ph
yll b
(m
g/g
/fre
sh
weig
ht)
726 Afr. J. Environ. Sci. Technol.
0
0.02
0.04
0.06
0.08
0.1
0.12
0.14
0.16
0.18
0.2
2 month 4 month 6 month 8 month
Ca
rote
no
ids
(mg
/g/f
resh
we
igh
t)
Time after cultivation
Control 1 T1 T2 Control 2 T4 T5
a-b b
ab
ab
b
2 4 6 8
Time after cultivation (month)
Figure 4. Changes in carotenoides (mg/g/fresh weight) with water stress and magnetic water treatments at different periods of time (2, 4 and 8 months after cultivation). (a) Statistically significant (P ≤ 0.01) compared to C1, (b) compared to C2.
0
0.05
0.1
0.15
0.2
0.25
0.3
0.35
0.4
2 month 4 month 6 month 8 month
WU
E m
g/l
)
Time after cultivation
control 1 T1 T2 Control 2 T3 T4
ab
2 4 6 8
Time after cultivation (month)
Figure 5. Changes in water use efficiency (WUE) (mg/g/fresh weight) with water stress and magnetic water treatments at different periods of time (2 ,4 ,6 and 8 month after cultivation). (a) statistically significant (P ≤ 0.01) compared to C1, compared to C2.
WUE (0.18 mg/l, 0.24 mg/l, 0.30 mg/l and 0.37 mg/l) throughout the experimental periods (2, 4, 6 and 8 MAC respectively). This treatment accomplished 0.18, 0.24, 0.30, and 0.37 mg/l after 2, 4, 6 and 8 MAC respectively.
Figures 6 to 10 represents the amount of elements of different treatments at different growth stages. It is clear that magnetized treated water plants achieved attained significantly high nutrients content in terms of which
represented by calcium, magnesium, and potassium but less low in sodium and phosphorus at all growth stages (P≤0.01). Following the pattern of calcium elements throughout the experimental period (Figure 6), the element was accumulated with more two times in the magnetically treated water under stress (T3) has the highest value (21.7 mg/l) while as compared with magnetically treated water without water stress T1 (T1 its

Al-Khazan et al. 727
2 4 6 8
Time after cultivation
Figure 6. Changes in calcium element Ca
2+ (mg/l) with water stress and magnetic water
treatments at different periods of time (2, 4, 6 and 8 month after cultivation). (a) Statistically significant (P ≤ 0.01) compared to C1, (b) compared to C2.
0
2
4
6
8
10
12
14
2 month 4 month 6 month 8 month
Mg
2(m
g/l
)
Time after cultivation
Control 1 T1 T2 Control 2 T3 T4
b
ab
b b
a
2 4 6 8
Time after cultivation (month)
Mg
2+ (
mg
/l)
Figure 7. Changes in magnesium element Mg
2+ (mg/l) with water stress and magnetic water
treatments at different periods of time (2, 4, 6 and 8 months after cultivation). (a) Statistically significant (P ≤ 0.01) compared to C1, (b) compared to C2.
correspondence of normal water) has the lowest value (10.0 mg/l) (Figure 6).
Concerning magnesium element, the magnetic treatments had negative effects on magnesium content in the plant (Figure 7), it was noticed that normal water plants has the highest values of magnesium during the first harvest (two MAC) and started to decrease significantly with age in the opposite magnesium content.
This was not true for magnetized treated water plants in which magnesium increased gradually reaching high values at eight MAC (from 3.6 mg/l two MAC to 12.4 mg/l, eight MAC and from 6.0 mg/l two MAC to 10.9 mg/l. eight MAC in control 2 and T4 respectively) respectively.
In regard to phosphorus (Figure 8), it was observed that water stress has no pronounce effect on the accumulation of phosphorus (Figure 8), T1, T2, T3 and
Ca
2+ (
mg
/l)

728 Afr. J. Environ. Sci. Technol.
Time after cultivation (month)
2 4 6 8
Figure 8. Changes in phosphorus element P (mg/l) with water stress and magnetic water treatments at different periods of time (2, 4, 6 and 8 months after cultivation). (a) Statistically significant (P ≤ 0.01) compared to C1, (b) compared to C2.
0
2
4
6
8
10
12
Na+
(m
g/l)
abab
b
a
2 month 4 month 6 month 8 month
Time after cultivationControl 1 T1 T2 Control 2 T3 T4
2 4 6 8
Time after cultivation (month)
Na
+ (
mg
/l)
12
10
8
6
4
2
0
Figure 9. Changes in sodium element Na
+ (mg/l) with water stress and magnetic water
treatments at different periods of time (2, 4, 6 and 8 months after cultivation). (a) Statistically significant (P ≤ 0.01) compared to C1, (b) compared to C2.
T4 have high phosphorous content than either control 1 and 2 throughout the experimental period. Generally speaking, magnetized magnetic treated plants achieved the highest values, especially T3 and T4 after six and eight months of cultivation (Figure 8).
Figure 9 shows the result of sodium elements of all treatments during the experimental period. It is worth mentioning that there are two MAC for all treatments. The accumulation of sodium content in the plants in all treatments at MAC was remarkable with a high amount of

Al-Khazan et al. 729
0
2
4
6
8
10
12
14
16
2 month 4 month 6 month 8 month
K+
(mg
/l)
Time after cultivation (month)
Control 1 T1 T2 Control 2 T3 T4
a
ab
a
b
2 4 6 8
Figure 10. Changes in potassium element K
+ (mg/l) with water stress and magnetic water treatments
at different periods of time (2, 4, 6 and 8 month after cultivation. (a) Statistically significant (P ≤ 0.01) compared to C1, (b) compared to C2.
sodium. Nonetheless, at eight MAC, this amount was significantly decreased in all treatments especially with magnetized magnetic treated water plant which showed more reduction more than their correspondence of normal water. For instance, sodium content (eight MAC) was 2.3, 2.5 and 5.1 mg/l in control 1, T1 and T2 compared to 1.1, 1.5 and 2.7 mg/l in control 2, T3 and T4, respectively.
Results of potassium as shown in Figure 10 revealed that, magnetized magnetic treated water plants acquired the highest amount of potassium throughout the experimental period. It was noticed that, the amount of potassium decreased significantly (P≤0.01) at eight MAC, which considered the most critical phase in jojoba life cycle. Nevertheless, magnetized magnetic treated water plants still reported almost double the amount of potassium compared to their correspondence of normal water. The amount of potassium eight MAC was 4.9, 4.8 and 5.0 mg/l in control 1, T1 and T2 compared to 9.1, 8.7 and 6.8 mg/l in control 2, T3 and T4. DISCUSSION Irrigation with magnetically treated water increased relative water content (RWC) of jojoba plants. RWC is the appropriate measure of plant water status in terms of the physiological consequence of cellular water deficit (Bassant et al., 2007). Perhaps the reason for this increase is the ability of these plants to absorb water, as
a result of increase in roots length of these plants (Khazan and Abdullatif, 2009). The relative decrease of RWC in normal water plants might be due to greater resistance to water flow at soil rate interface as a result of salt (mainly sodium accumulation).
The ability of treated water plants to have high content of photosynthetic pigments even under water stress (T3 and T4), considered a benefit point for these plants. Cho et al. (1996) has attributed the increase of photosynthetic pigments to the decrease of the amount of manganese in treated water compared to normal water (Khazan and Abdullatif, 2009). Similarly, Macfie and Taylor (1992) have reported that shortage in the amount of chlorophyll under the environmental stress is due to manganese toxicity which leads to a lack of chlorophyll between the veins of leaves leading to a decrease of photosynthesis as a whole.
The decrease of these pigments in plants irrigated with normal water (T I and T2), was due to water shortage. The low amount of photosynthetic pigments under water shortage (stress) was demonstrated by many researchers, for example, (Reina et al., 2002; Basant and Harsharn, 2009; Wilmer et al., 2011).
Moreover, results of carotenoides showed high rate in plants irrigated with magnetically treated water compared to their correspondence of normal water (P≤0.01). This is considered as a good adaptive factor under stress conditions. Maheshwari et al. (2009) have reported that, the increase in carotenoides is one of the adaptive responses that protect chlorophyll and enables plant to

730 Afr. J. Environ. Sci. Technol. complete its life cycle. The reduction of carotenoides in the plants of eight MAC may be is as a result of using products of photosynthesis in the steady growth of the plant at this stage (Yano et al., 2004; Elabsy, 2006).
The differences in WUE between the two water type treatments when subjected to water deficits, clearly indicates that the crops employ different mechanisms in response to drought conditions and require different approaches for irrigation. A mechanism that enables it to reduce its water consumption while maintaining high biomass. When less magnetized magnetic treated water (30% WHC) was applied to Jojoba plants, WUE increased as compared to the recommended irrigation amounts (70% WHC). High WUE was mentioned by many authors to be the most useful mechanism in arid regions (for example, Soo,1999; Davies et al., 2000; Basant et al., 2007; Sameera and Ansary, 2008).
It was noticed that, irrigation with magnetically treated water lead to an increase in all elements content except sodium. This is because sodium is paramagnetic element which has a small, positive susceptibility to magnetic fields (Nave, 2008), while other elements are diamagnetic which are slightly repelled by a magnetic field (Nave, 2008). The increase of essential elements aided treated water plants to increase their chlorophyll content. Magnesium ions are found in the centre of chlorophyll molecules, and as chlorophyll is an essential component in the reaction of photosynthesis, which produces energy for growth, magnesium ions are therefore essential (Bohn, et al., 2004).
On the other hand, potassium and phosphorous are needed for the plant cell's chemical reactions, in the formation and movement of carbohydrates, the development of roots which are necessary for the absorption of minerals and water, ATP, basically a molecule of energy and nucleic acids (Daniel et al., 1998; Yadav et al., 1999).
Conclusion
The present findings have shown that irrigation with MTW can be considered as one of the most valuable modern technologies that can assist in saving irrigation water and reducing salt accumulation in plants. However, the potential of magnetically treated water for crop production needs to be studied under field conditions to demonstrate its effects on yield production. REFERENCES Amiri MC, Dadkhah AA (2006). Reduction in the surface tension of
water due to magnetic treatment. Physiochem. Eng. Aspects, 278: 252-255.
Ayars E, Christen W, Soppe R, Meyer M (2006). The resource potential of in-situ shallow ground water use in irrigated agriculture: Review,
Irrig. Sci., 24: 147–160 Basant M, Bunce S, Harshan G (2007). Irrigation and water saving
potential of magnetic treated water in vegetable crops. Research Direction Office of Research Services, Sydney, Australia, pp. 12-22.
Basant LM, Harsharn SG (2009). Magnetic treatment of irrigation water:
Its effects on vegetable crop yield and water productivity. Agric. Water Manage., 96(8): 1229-1236.
Bohn T, Walczyk S, Leisibach R (2004). Chlorophyll-bound magnesium in Commonly Consumed Vegetables and Fruits: Relevance to Magnesium Nutrition. J. Food Sci., 69(9): 347-350.
Charan R (2009). Effect of stimulating magnetic field on plants. Indian J. Theor. Phys., 57: 15-20.
Chaves M, Oliveira M (2004). Mechanisms underlying plant resilience to water deficits: Prospects for water-saving agriculture. J. Exp. Bot., 55: 2365–2384.
Cho CH, Singh S, Robinson GW (1996). Liquid water and biological systems: The most important problem in science that hardly anyone wants to see solved. Faraday Discus, 103: 19-27.
Coey JM, Cass S (2000). Magnetic water treatment. J. Magnetism Magnetic Mater., 209: 71.
Daniel PS, Robert JR, Ayling SM (1998). Phosphorus uptake by plants: From soil to cell. Plant Physiol., 116: 447-453.
Davies M, Bacon M, Thompson D, Sobeih W, Gonzalez L (2000). Regulation of leaf and fruit growth in plants growing in drying soil: Exploitation of the plants’ chemical signaling system and hydraulic architecture to increase the efficiency of water use in agriculture. J. Exp. Bot., 51: 1617–1626.
Davies MS (1996). Effect of electromagnetic fields on early growth in three plants species and a replication of previous results. Bioelectromagnetics, 17(2): 154-161.
Elabsy KM (2006). Biochemical adjustment of Nitraria retusa Forssk. and Arthrocnemnm macrosta (Monic) to Saline Habitats. M. SC. Thesis, Botany. Department. Faculty of Science, Tanta University, Egypt.
Horst M, Shamutalov S, Pereira L, Gonçalves M (2005). Field assessment of the water saving potential with furrow irrigation in Fergana, Aral Sea Basin., Agric. Water Manage., 77: 210–231.
Imtiaz M, Zahoor A, Riaz A, Igbal M (1998). Evaluation of relative water content as a physiological index for drought tolerance. Sci. J., 11: 63-69.
Jojoba Growers Association (1990). Jojoba Happenings, Newsletter of the Association. Phoenix, Arizona.
Khazan MM, Abdullatif BM (2009). Effect of irrigation with magnetized water on growth, photosynthesis pigments and proline accumulation in jojoba [plants (Simmondsia chinensis L.) seedlings. Saudi J. Biol. Sci., 16(3): 107-113.
Kronenberg KJ (1993). Magnetized II: More alluring facts about treating water with magnets. Aqua Mag., Sept., pp. 20-23 .
Lichtenthaler HK (1987). Chlorophylls and carotenoids: Pigments of photosynthetic biomembranes. Methods Enzymol., 148: 350-382.
Larcher W (1995). Physiological Plant Ecology. Third Edition. Springer-Verlag Berlin Heidelberg, New York, pp. 50-75.
Loveys BR, Stoll M, Davies WJ (2004). Physiological approaches to enhance water use efficiency in agriculture: Exploiting plant signaling in novel irrigation practice. In: Bacon, Editor, Water Use Efficiency in Plant Biology, Blackwell Publishing Ltd., Victoria, Austr., pp. 113–141.
Macfie SM, Taylor GJ (1992). The effect of excess Manganese on Photosynthetic rate and concentration of chlorophyll in Triticum aestivum grown in solution culture. Physiol. Planetarium, 85: 467- 475.
Maheshwari M, Basant L, Grewal HS (2009). Magnetic treatment of irrigation water: Its effects on vegetable crop yield and water. Prod., 8: 1229-1236.
Nafalski L, Andrzej L (1994). Magnetic water treatment: Attempts of objective explanation. International Conference ELMECO '94. Electromagn. Devices Processes Environ. Prot., Proceedings, 1994, pp. 161-65.
Nave CL (2008). Magnetic Properties of Solids. Hyper Phys., 15: 11-23. Reina FG, Pascual LA, Fundura LA (2002). Influence of a stationary
magnetic field on water relations in lettuce seeds. Bioelectromagnetics, 32(7): 15-22.
Sameera O, Ansary E (2008). Physiological responses of Eggplants grown under different irrigation regimes to antitransplant treatments. Saudi J. Biol. Sci., 15(2): 259-267.
Soo YK (1999). Adaptation to Water Stress. Natl. Biotechnol., 17:

289-291. Stewart EA (1983). Chemical analysis of ecological materials. Black
Well Scientific, London, pp. 12-15. Wilmer T, Rita C, Llsa C, Oranys M (2011). Water relations and
photosynthetic capacity of two species of Calotropis in a tropical semi-arid ecosystem. Ann. Bot., 107(3): 397-405.
Yadav DS, Goyal AK, Vats BK (1999). Effect of potassium in Elusine coracana L. under moisture stress conditions. J. Potassium Res., 15(4): 131-134.
Al-Khazan et al. 731 Yano A, Ohashi Y, Hirasaki T, Fujiwara K (2004). Effects of 60 Hz
magnetic field on photosynthetic uptake and early growth of radish seedlings. Bioelectromagnetics, 25(8): 572-581.