effects of low-pass noise masking on auditory event ... · pdf fileeffects of low-pass noise...
TRANSCRIPT

Effects of Low-Pass Noise Masking on AuditoryEvent-Related Potentials to Speech
Brett A. Martin and David R. Stapells
Objective: This study investigated the effects of de-creased audibility in low-frequency spectral re-gions, produced by low-pass noise masking, on cor-tical event-related potentials (ERPs) to the speechsounds /ba/ and /da/.
Design: The speech sounds were presented to nor-mal-hearing adults (N � 10) at 65- and 80-dB peak-to-peak equivalent SPL while they were engaged inan active condition (pressing a button to deviantsounds) and a passive condition (ignoring the stim-uli and reading a book). Broadband masking noisewas simultaneously presented at an intensity suffi-cient to mask the response to the 65-dB speechsounds and subsequently low-pass filtered. The con-ditions were quiet (no masking), low-pass noisecutoff frequencies of 250, 500, 1000, 2000, and 4000Hz, and broadband noise.
Results: As the cutoff frequency of the low-passnoise masker was raised, ERP latencies increasedand amplitudes decreased. The low-pass noise af-fected N1 differently than the other ERP or behav-ioral measures, particularly for responses to 80-dBspeech stimuli. N1 showed a smaller decrease inamplitude and a smaller increase in latency com-pared with the other measures. Further, the cutofffrequency where changes first occurred was differ-ent for N1. For 80-dB stimuli, N1 amplitudes showedsignificant changes when the low-pass noise maskercutoff was raised to 4000 Hz. In contrast, d', MMN,N2, and P3 amplitudes did not change significantlyuntil the low-pass noise masker was raised to 2000Hz. N1 latencies showed significant changes whenthe low-pass noise masker was raised to 1000 Hz,whereas RT, MMN, N2, and P3 latencies did notchange significantly until the low-pass noisemasker was raised to 2000 Hz. No significant differ-ences in response amplitudes were seen across thehemispheres (electrode sites C3M versus C4M) inquiet, or in masking noise.
Conclusions: These results indicate that decreasedaudibility, resulting from the masking, affects N1 ina differential manner compared with MMN, N2, P3,and behavioral measures. N1 indexes the presenceof audible stimulus energy, being present whenspeech sounds are audible, whether or not they arediscriminable. MMN indexes stimulus discrimina-
tion at a pre-attentive level. It was present onlywhen behavioral measures indicated the ability todifferentiate the speech sounds. N2 and P3 alsowere present only when the speech sounds werebehaviorally discriminated. N2 and P3 index stimu-lus discrimination at a conscious level. These corti-cal ERP in low-pass noise studies provide insightinto the changes in brain processes and behavioralperformance that occur when audibility is reduced,such as with low frequency hearing loss.
(Ear & Hearing 2005;26;195–213)
Studies are emerging that examine the effects ofhearing loss on cortical auditory event-related po-tentials (ERPs) to speech stimuli (e.g., Oates,Kurtzberg, & Stapells, 2002; Polen, 1984; Tremblay,Piskosz, & Souza, 2003; Wall, Dalebout, Davidson,& Fox, 1991). Systematic examination of the effectsof decreased audibility is needed to provide insightinto changes in neural processing caused by de-creased audibility in specific spectral regions. It isdifficult to examine the effects of decreased audibil-ity in individuals with sensorineural hearing losssystematically because the effects of sensorineuralhearing loss are not limited solely to audibility.These individuals often have other problems inaddition to decreased audibility that are difficult tocontrol for such as decreased frequency or temporalresolution and abnormal loudness growth (e.g.,Fabry & Van Tasell, 1986; Festen & Plomp, 1983;Scharf, 1978; Thibodeau, 1991). As a result, use offiltering or masking of stimuli presented to normal-hearing listeners is often used to control for audibil-ity in a systematic manner (e.g., Dubno & Ahlstrom,1995; Dubno, Dirks & Ellison, 1989; Fabry & VanTasell, 1986; Humes, Dirks, Bell & Kincaid, 1987;Miller & Nicely, 1955; Sher & Owens, 1974; Walden,Schwartz, Montgomery & Prosek, 1981; Wang, Reed& Bilger, 1978). ERP results from these normal-hearing listeners may provide information on thebrain processes underlying auditory discriminationand possibly on factors relevant to the poor speechperception ability of many hearing-impaired listen-ers. Further, findings from these studies may lead toa useful clinical application of the ERPs as objectivemarkers of audibility and auditory discrimination.
Our three previous studies examined the effects
School of Graduate Medical Education, Seton Hall University,South Orange, New Jersey (B.A.M.); and School of Audiology andSpeech Sciences, University of British Columbia, Vancouver,British Columbia, Canada (D.R.S.).
0196/0202/05/2602-0195/0 • Ear & Hearing • Copyright © 2005 by Lippincott Williams & Wilkins • Printed in the U.S.A.
195

of decreased audibility produced by high-pass noisemasking (using 4000 Hz through 250 Hz filter cut-offs in octave steps) or broadband noise masking onERPs to speech sounds /ba/ and /da/ (Martin,Kurtzberg & Stapells, 1999; Martin, Sigal,Kurtzberg & Stapells, 1997; Whiting, Martin &Stapells, 1998). High-pass noise masking decreasesaudibility for spectral regions at and above themasker cutoff frequency and simulates, in part, theeffects of high frequency sensorineural hearing loss.Broadband noise masking (BBN), in contrast, pro-duces threshold elevations for all audiometric fre-quencies, and simulates, in part, the effects of flathearing loss.
The first of these studies examined the effects ofhigh-pass noise masking on N1, N2, and P3 ERPsusing an active paradigm, in which subjects at-tended to the stimuli and pressed a button in re-sponses to selected sounds (Martin, Sigal, Kurtzberg& Stapells, 1997), whereas the second used a passiveparadigm in which subjects ignored the stimuli toexamine the effects of high-pass noise maskers onN1 and the mismatch negativity (Martin, Kurtzberg& Stapells, 1999). The first study demonstrated thathigh-pass noise masking had a differential effect onN1 versus behavioral measures of discrimination[d-prime (d'), reaction time (RT)], P3, and N2 (Mar-tin, Sigal, Kurtzberg & Stapells, 1997). N1 waspresent for all conditions in which the speech stimuliwere audible, whether or not they were discrim-inable. P3 and N2 were present only when behav-ioral measures of discrimination indicated speechsounds were audible and discriminable. More specif-ically, when the high-pass noise was lowered below2000 Hz, P3, and N2 amplitudes decreased andlatencies increased significantly, and behavioralmeasures of discrimination showed significantchanges (Martin, Kurtzberg & Stapells, 1999; Mar-tin, Sigal, Kurtzberg & Stapells, 1997).
The second study showed, similarly, that N1changes systematically in amplitude and latencywith high-pass noise masking beginning with the4000 Hz condition, whereas mismatch negativityand behavioral measures (collected separately) showlarge changes beginning with approximately the1000 Hz high-pass noise masking condition (Martin,Kurtzberg & Stapells, 1999).
The third study demonstrated that BBN maskersproduce significant decreases in ERP amplitudesand behavioral discriminability (Whiting, Martin &Stapells, 1998) once speech-to-noise ratios were �0dB. N1 was present even after N2, P3, and behav-ioral discriminability were absent. ERP and behav-ioral RTs, in contrast to amplitudes, showed signif-icant decreases at higher speech-to-noise ratios.Latency increases occurred once the speech-to-noise
ratio was �20 dB. Significant latency increasesoccurred with less masking for N1 than for P3 orbehavioral RT, with N2 falling in-between. P3showed the largest total changes. Decreased audi-bility resulting from BBN masking therefore affectsthe various ERP peaks in a differential manner,with latencies being more sensitive indicators ofbroadband masking effects than are amplitudes(Whiting, Martin & Stapells, 1998). A similar studyby other investigators subsequently investigated theeffects of BBN maskers on the mismatch negativity(MMN) (Müller-Gass, Marcoux, Logan & Campbell,2001) and showed that MMN amplitudes decreasedand latencies increased as the intensity of the mask-ing increased. Additionally, a trend toward in-creased right hemispheric activity in the presence ofnoise was demonstrated. Another magnetoencepha-lography study showed that MMN amplitude to tonestimuli presented to the right ear is reduced whenBBN is presented ipsilaterally (but not contralater-ally) at a signal-to-noise ratio of �7 dB, and MMN isabsent when music is presented to either ear at asignal-to-noise ratio of �5 dB. N1, in contrast, wasreduced in amplitude when music was presented toeither ear and was further reduced in amplitudewhen BBN was delivered ipsilaterally comparedwith contralaterally (Levanen & Sams, 1997).
The present study completes our noise maskingseries. The purpose was to investigate the effects oflow-pass noise masking on ERPs N1, MMN, N2, andP3 to speech sounds /ba/ and /da/. Low-pass noisewas selected because hearing loss does not alwaysoccur in high-frequency spectral regions alone orjust with flat audiometric configurations but alsomay also occur only in low-frequency spectral re-gions. The use of low-pass noise raises thresholds forfrequencies at and below the filter cutoff settings,and to a lesser extent above, due to upward spread ofmasking (e.g., Dubno & Ahlstrom, 1995). Theselow-pass noise studies, considered together with theearlier high-pass noise studies, provide for a morecomplete understanding of the effects of decreasedaudibility for different spectral regions.
METHODS
Subjects
Ten adults (4 male, 6 female) aged 24 to 40 years(mean � 33 years), with no history of neurologicaldisorder, participated. All subjects had hearingthresholds of 20 dB HL (ANSI, 1989) or betterbilaterally, from 250 through 8000 Hz. Acousticimmittance testing was performed before each ses-sion to rule out abnormal middle-ear status. Allsubjects had a normal tympanogram and a presentipsilateral acoustic reflex (1000 Hz, 90 dB HL) in
196 EAR & HEARING / APRIL 2005

their test (right) ear. Subjects were tested over fourto five sessions and were paid for their participation.
Stimuli
The /ba/ and /da/ stimuli for these studies wereselected because discrimination of place of articula-tion is typically difficult for hearing-impaired listen-ers due to the high-frequency content and low inten-sity of the spectral energy necessary for placediscrimination. These are the same stimuli used inour studies of the effects of high-pass noise masking(Martin, Kurtzberg & Stapells, 1999; Martin, Sigal,Kurtzberg & Stapells, 1997) and BBN masking(Whiting, Martin & Stapells, 1998) on cortical ERPs.The stimuli were created by digitizing natural to-kens produced by a male talker. The tokens werethen processed using linear prediction coefficientanalysis, and synthesized tokens were regeneratedusing the linear prediction coefficient polynomialroots (Maiste, Wiens, Hunt, Scherg & Picton, 1995).The tokens were edited to 150-msec duration (byeliminating the final portion of the steady-statevowel and windowing the offset of the vowel) andcalibrated in peak-to-peak equivalent (ppe) SPL,relative to a 1000-Hz pure tone.
Spectrographic analysis was used to determinethe frequencies of the formants and formant transi-tions for both /ba/ and /da/. The frequencies of thesteady-state portion of the vowels were F0 � 108 Hz,F1 � 674 Hz, F2 � 1140 Hz, and F3 � 2350 Hz. Thetransitions for /ba/ began at 328 Hz for F1, 1071 Hzfor F2, and 2298 Hz for F3; the transitions for /da/began at 362 Hz for F1, 1832 Hz for F2, and 2540 Hzfor F3. Burst frequencies were similar for the twospeech sounds (1500 to 4800 Hz for /ba/; 1200 to4900 Hz for /da/). Thus, the primary differencesbetween the stimuli are in the 1000 to 2000 Hzrange. The stimuli were presented to the right ear ofthe subjects at 65 and 80 dB ppe SPL.
For the active discrimination conditions, 200stimuli were presented in a run, which was repli-cated, yielding a total of 400 stimuli per condition.For passive conditions, 1000 stimuli were presentedin a run, which was replicated, yielding a total of2000 stimuli per condition. The passive sessionsrequire a larger number of sweeps because of thesmall amplitude and large variability of the MMN(e.g., Kurtzberg, Vaughan, Kreuzer & Fleigler, 1995;Lang, Eerola, Korpilahti, Holopainen, Salo & Aal-tonen, 1995; Martin, Kurtzberg & Stapells, 1999).Stimuli presented as standards (i.e., the more fre-quently occurring stimulus in the run) had 0.90probability of occurrence and stimuli presented asdeviants (i.e., the infrequently occurring stimuluswithin the run) had 0.10 probability. The stimulus
onset asynchrony was 1100 msec for the activediscrimination sessions to obtain clear (in the quietcondition) N1 and P3 waves. The stimulus onsetasynchrony for the passive sessions was 610 msec toimprove the signal-to-noise ratio of the recording (byallowing more trials to be recorded) and therefore toobtain a clear MMN (in the quiet condition). Bothspeech sounds were presented as standards anddeviants in separate runs. Presentation order of thestandard-deviant stimuli within each run for thepassive sessions was not randomized (e.g., Scherg,Vajsar & Picton, 1989), and the deviant stimuluswas presented every 10th trial. Stimulus presenta-tion order within a run for the active discriminationsessions was pseudorandomized, with the provisionthat there were not two deviants in a row, and thefirst stimulus could not be a deviant.
The 65-dB ppe SPL intensity was selected be-cause of its similarity to conversational speech lev-els. The 80-dB ppe SPL intensity was selected be-cause this is a higher intensity and thereforemimics, in part, the effects of amplification. Inclu-sion of this intensity allows for examination ofwhether noise-masked stimuli that were inaudibleat 65 dB become audible at 80 dB and whetherstimuli not discriminable at the lower intensitybecome discriminable.
Maskers
The speech stimuli were presented in quiet (nonoise masking) and in conditions mixed with ipsilat-eral masking noise. The masking noise originatedfrom a broadband noise generator was filtered (96dB/octave slope), attenuated, and then mixed withthe stimulus (either the speech sounds for the ERPtesting or the pure tones for behavioral audiologicaltesting). The noise together with the stimulus wasfed to a series of passive attenuators, and then to aninsert earphone. The level of the BBN required tofully mask behavioral perception of the 65-dB ppeSPL speech sounds was determined for each subjectby the following procedure: The masking level wasincreased using 10-dB steps until the speech soundswere not heard. The masking level was then de-creased by 10 dB, and a bracketing approach wasinitiated using a 1-dB step size. Masked thresholdwas defined as the level at which the speech soundswere inaudible 50% of the time. The masking noisewas then increased by 7 dB above this level toensure adequate masking of the speech sounds, asthe threshold for masking ERPs is often a few dBhigher than the threshold for masking perception(Stapells, Picton & Durieux-Smith, 1994). The noisewas subsequently low-pass filtered using settings of4000, 2000, 1000, 500, and 250 Hz. These cutoff
EAR & HEARING, VOL. 26 NO. 2 197

settings were selected because they allow us tocontrol for audibility in the frequency regions mostimportant for speech perception, are commonly usedin behavioral studies, and are comparable to thoseused in our previous high-pass noise masking stud-ies. The same noise intensity was used for both the65- and 80-dB ppe SPL speech stimuli. The 80-dBstimuli, therefore, were not completely masked. Theintensity required to fully mask these 80-dB stimuliwould be potentially damaging. The masking noise(unfiltered) ranged from 77.5 to 85.5 dB SPL (mean� 80 dB).
EEG Recording
Seven EEG channels were recorded from elec-trodes placed at Fz, Cz, Pz, M1, M2, C3M (midwaybetween C3 and M1), and C4M (midway between C4and M2). The EEG channels were referenced to anelectrode at the tip of the nose (Vaughan & Ritter,1970). An eighth channel to monitor vertical eyemovements and eye blinks (EOG) was recorded fromelectrodes over the right supraorbital ridge of thefrontal bone and over the zygomatic bone under theright eye. An electrode placed on the neck served asground. The seven EEG channels were amplified(gain � 20,000), filtered (0.1 to 100 Hz, 6 dB/octaveslope), and digitized (568 Hz per channel, 512points), using either a 900-msec (active discrimina-tion) or 550-msec (passive condition) analysis time.The analysis time included 100-msec prestimulusbaseline for the active discrimination conditions anda 50-msec prestimulus baseline for the passive con-ditions. Amplitude measures were made relative tothe prestimulus baselines. The EOG channel wasfiltered and digitized as above, but the amplifiergain was set to 5000. Single-trial ERP waveformswere saved for offline baseline correction across thesweep duration, digital filtering (30-Hz low-passfilter, 12 dB/octave), artifact rejection (�100 �V inany of the channels, and � 75 �V in the EOGchannel), and averaging. ERPs were averaged sep-arately for each stimulus, and averages were base-line corrected using the prestimulus interval. Tworeplications of each condition were obtained.
Behavioral Measures
Behavioral pure-tone audiograms (in dB SPL) for250 to 4000 Hz were obtained in quiet (no masking)and in the presence of the noise maskers for all ofthe subjects using a GS 1701 audiometer.
Measures of RT and percent correct discrimina-tion were obtained simultaneously with the ERPmeasures using button-press responses to the devi-ant stimuli in the active conditions. Measures of asubject’s median RT, number of hit, false alarm,
correct rejection, and miss trials were obtained, andcriterion-free measures of sensitivity (d') were cal-culated for each active condition.
Procedure
The experiment consisted of EEG recordings ob-tained for active and passive conditions and theaudiograms. The experiment was run over four tofive sessions, for a total time of approximately 21hours per subject.
For the active discrimination conditions, subjectswere instructed to fixate on a small dot placedapproximately 1 meter in front of them at eye level,to minimize eye blinks, and to press a button as soonas they heard the deviant stimuli. They were ad-vised to place equal weight on the speed and accu-racy of their button presses. Subjects were pre-sented with two practice runs in the quiet condition,composed of 100 stimuli (one run where /ba/ was thedeviant sound and one run where /da/ was thedeviant sound). Only those subjects attaining accu-racy of 90% or better in these practice runs wereaccepted for the study. Based on this criterion, nosubject was rejected. In the passive conditions, sub-jects were instructed to ignore the stimuli and toconcentrate on reading a book of their choice. Theywere advised to hold the book at an arm’s length toreduce horizontal eye movement and to minimizeeye blinks.
All testing was performed in a double-walledsound booth. Responses to the speech sounds wereobtained in quiet (no masking), in BBN, and in250-, 500-, 1000-, 2000-, and 4000-Hz low-passnoise. The conditions were randomized, with theexception that one BBN condition for a 65-dBspeech stimulus was tested first, to ensure ade-quate masking of the ERPs to the speech sounds.Passive conditions were tested before the activediscrimination conditions, as it may be difficult forsubjects to ignore stimuli to which they had pre-viously been instructed to attend.
Data Analysis
After offline processing of baseline correction andartifact rejection, the single-trial responses wereaveraged so that responses to stimuli presented asstandards and deviants were grouped separately.Replications were averaged together for each condi-tion. Difference waveforms were obtained by sub-tracting responses to the stimuli presented as stan-dards from the responses to the same stimulipresented as deviants for each condition.
Response windows developed in our previoushigh-pass noise studies (Martin, Kurtzberg & Sta-pells, 1999; Martin, Sigal, Kurtzberg & Stapells,
198 EAR & HEARING / APRIL 2005

1997) were used to aid in response measurement fordata from individual subjects. Response windowswere 80 to 200 msec for N1, 200 to 420 msec for N2,285 to 800 msec for P3, and 80 to 400 msec for theMMN1. The noise-masked results from individualsubjects in the present experiment were first in-spected visually to ensure that the response win-dows were adequate.
N1 was measured in the waveforms to the stimulipresented as standards at Cz in the active condition;P3 was measured in the waveforms to the stimulipresented as deviants at Pz for active conditions; N2was measured in the difference waveforms at Cz forthe active conditions; and MMN was measured inthe difference waveforms at Cz for the passive con-ditions. These measurement locations were chosenbecause they are where the largest amplitudes wereseen in the grand mean waveforms in the previoushigh-pass noise masking studies (Martin, Kurtzberg& Stapells, 1999; Martin, Sigal, Kurtzberg & Sta-pells, 1997). Measurements were made on the aver-age of the two replicated waveforms for each condi-tion. Peak amplitude measures were determined atthe point of largest amplitude within a responsewindow. Latency measures were taken at the centerof the peak within the window. In cases in which awave was multipeaked, both amplitude and latencymeasures were taken at the point of largest ampli-tude within the response window. In cases of doublepeaks of equal amplitude, amplitude was measuredat either peak, and latency was measured at themidpoint of the waveform. For P3, latency measureswere obtained after digital low-pass filtering at 5 Hz(12 dB/octave in the frequency domain) to smooththe waveform (Martin, Sigal, Kurtzberg & Stapells,1997; Picton, 1992). In addition to peak amplitudeand latency measures, mean amplitude measure-ments within a 100-msec window were performedfor the MMN. The latency window began 20 msecpast the grand mean N1 latency for each noisecondition and lasted 100 msec. This measure wasincluded to objectify the MMN measures from thesmall-amplitude, relatively noisy difference wave-forms that were obtained from individual subjects.
Determination of response presence required theagreement of two experienced and independentjudges. The presence of N1 was determined usingthe waveforms to the stimuli presented as stan-dards. To be considered present, N1 was required tobe larger in amplitude at frontocentral electrodesites than at parietal electrode sites. Inversion atthe mastoid electrode sites was used to indicateresponse presence, but lack of inversion was notused to indicate response absence. The presence of
N2 and MMN were determined using the differencewaveforms. N2 must be larger in amplitude atmidline-central electrode sites. When questionable,the waveforms to the stimuli presented as standardsand deviants were compared and larger negativityin the waveforms to the deviant stimuli than to thestandard stimuli in the N2 latency window wasrequired for response presence. The same rulesapply for the MMN, except that inversion at themastoids was used to indicate response presence,though lack of inversion alone was not enough toindicate response absence. “Mean-MMN” measures,by definition, were objective and did not involverating by judges. The presence of P3 was determinedusing the waveforms to the stimuli presented asdeviants. To be considered present, P3 was requiredto be larger at Pz than at frontocentral electrodesites. When questionable, the waveforms to thestimuli presented as standards and deviants werecompared, and larger positivity in the waveforms tothe deviant stimuli than to the standard stimuli inthe P3 latency window was required for responsepresence. When judgments were considered ques-tionable using the above rules, replicability of thewaveforms was examined. If the wave was replica-ble, then it was judged as present. When a wave wasjudged absent, it was given an amplitude of zero �V(Martin, Kurtzberg & Stapells, 1999; Martin, Sigal,Kurtzberg & Stapells, 1997; Whiting, Martin &Stapells, 1998).
Statistical Analyses
Three-way repeated-measures analyses of vari-ance (ANOVA) as a function of speech stimulus,stimulus intensity, and noise condition were carriedout on the amplitude and latency data. Four-wayANOVAs as a function of wave, intensity, stimulus,and condition were also carried out on normalizedamplitude and latency data. The data were normal-ized by conversion to percent of (d', amplitude) orchange from (RT, latency) the quiet (no noise) con-dition. Two-way ANOVAs were also carried out onamplitudes of each component as a function of elec-trode site (C3M versus C4M) and noise maskingcondition (quiet versus 1000-Hz LPN) to determineif the noise masking differentially affected the re-sponses from each hemisphere. For all of theseanalyses, main effects and interactions were consid-ered significant if p � 0.01. Greenhouse-Geisserepsilon correction factors (�) were applied to thedegrees of freedom and are reported where appro-priate (Greenhouse & Geisser, 1959). Reported prob-abilities reflect these adjustments. For latency mea-sures, the repeated-measures ANOVAs wereperformed in a manner to maximize the number of1 N2 in this paper refers to N2b; P3 refers to P3b.
EAR & HEARING, VOL. 26 NO. 2 199

conditions in the analysis. This required that somesubjects be eliminated (due to missing data fromconditions where their behavioral discriminationwas poor and latency could not be determined).Conditions were eliminated, however, if fewer thanfive subjects remained. In this case, two-way ANO-VAs were carried out on the data from the 80-dBconditions. Neuman-Keuls post hoc measures wereperformed when significant main effects or interac-tions were obtained. The post hoc results wereconsidered significant if p � 0.05. Pearson product-moment correlation coefficients were calculated be-tween the behavioral measures of discriminationand RT and N1, N2, MMN, and P3 latency andamplitude. Correlation results were considered sig-nificant at a level of p � 0.01.
RESULTS
Behavioral Results
Masked Audiograms • Behavioral masked andnonmasked pure-tone audiograms are displayedin Figure 1. Shown are the mean threshold data indB SPL for the 10 subjects (top) and the corre-sponding standard deviations (bottom). The mask-ing noise produced moderate threshold elevations
at and below the filter cutoff and small (5 to 10 dB)threshold elevations one octave above the filtercutoff. Across all cutoff frequencies, the low-passnoise increased thresholds by an average of 49 dBone octave below the low-pass cutoff, 44 dB at thelow-pass cutoff, and by 10 dB one octave above thecutoff.
Behavioral Measures (d', RT)
Table 1 (top) shows the behavioral d' results as afunction of noise masking condition calculated frombutton-press responses to deviant stimuli that wereobtained in the active discrimination condition. Sta-tistical analyses of the data indicate a main effect ofintensity [F(1,9) � 31.98; p � 0.001], where d' scoreswere higher in response to 80-dB stimuli than to65-dB stimuli, even in the quiet condition. There is amain effect of low-pass noise condition [F(6,54) �299.49; p � 0.001; � � 0.296], such that discrim-inability decreases as the low-pass noise cutoff israised. Post hoc testing indicates that this decreaseis not significant until the noise cutoff frequency israised to 2000 Hz. With 2000-Hz low-pass noise,discriminability drops sharply and continues to dropto near-zero levels as the low-pass noise cutoff israised. There are also significant intensity � stim-ulus [F(1,9) � 10.87; p � .009] and intensity �condition [F(6,54) � 4.05; p � .004; � � 0.341]interactions. Post hoc testing of the intensity �stimulus interaction indicates that across all condi-tions, d' scores to /ba/ are smaller than are those to/da/ at 65 dB but not at 80 dB. Post hoc testing of theintensity � condition interaction indicates thatnoise condition has a differential effect on the re-sponses to the 65- versus the 80-dB speech sounds.The decrease in d' scores as the low-pass noise cutoffis raised begins with the 1000-Hz low-pass conditionfor the 65-dB speech sounds, whereas the decreasebegins with the 2000-Hz low-pass condition for the80-dB speech sounds. In other words, the effects ofthe low-pass noise masking are greater on the re-sponses to the 65-dB stimuli. There is a trendtoward an intensity � stimulus � condition interac-tion [F(6,54) � 4.27; p � 0.013; � � 0.507]. Exami-nation of the data suggests that changes in d' scoresin response to /ba/ presented at 65 dB begin with the500-Hz low-pass noise condition, whereas changesfor /da/ begin with the 1000-Hz low-pass noise con-dition. Changes in d' scores in response to the 80-dBstimuli do not begin until the 2000-Hz low-passnoise condition.
Table 2 shows RT measures to the deviant stim-uli. For both behavioral and ERP measures of la-tency, only those conditions where at least five of thesubjects had responses are shown (RTs associated
Fig. 1. Mean (top) and standard deviation (bottom) behavioralpure-tone masked and nonmasked audiograms across the 10subjects are displayed in dB SPL as a function of pure-tonefrequency. Audiograms are shown for the quiet (nonmasked)condition, 250-Hz through 4000-Hz low-pass noise maskedconditions, and the broadband noise (BBN) condition.
200 EAR & HEARING / APRIL 2005

with a d’ score �1.0; ERPs judged as present). Thereis a trend for a main effect of intensity [F(1,9) �5.57; p � 0.043], such that RTs to 65-dB stimuli arelonger than are RTs to 80-dB stimuli. There is also atrend for a main effect of speech stimulus [F(1,9) �7.87; p � 0.021], whereby RTs to /ba/ are longer thanare those to /da/. No main effect for condition ispresent [F(3,27) � 2.16; p � 0.167; � � 0.438],probably due to the conditions removed as a result ofmissing data. Therefore, results for 65 and 80 dBwere analyzed separately (see next paragraph).There is a significant intensity � condition interac-tion [F(3,27) � 7.23; p � 0.008]. Post hoc testing
indicates that RT increases significantly when themasking cutoff for the 65-dB speech sounds is raisedto 1000 Hz, whereas RTs for the 80-dB stimuli do notshow significant increases when the masking cutoffwas raised to 1000 Hz. There were not enoughresponses in the 2000-Hz low-pass noise conditionfor 65-dB speech sounds, however, to allow a com-parison at 2000 Hz. There is a trend toward astimulus � condition interaction [F(3,27) � 4.58; p� 0.021; � � 0.727]. RTs are longer for /ba/ than for/da/, even in the quiet condition, and in general thedifferences become greater as the noise cutoff fre-quency is raised.
TABLE 1. Mean d� values and ERP amplitudes (in microvolts) across subjects are shown along with standard deviations for responsesto /ba/ and /da/ stimuli presented at 65- and 80-dB ppeSPL
65 dB 80 dB
ba da ba da
Mean SD Mean SD Mean SD Mean SD
d� valuesQuiet 4.31 0.25 4.46 0.37 4.58 0.22 4.42 0.42250 Hz 4.19 0.38 4.49 0.27 4.33 0.58 4.51 0.43500 Hz 4.04 0.62 4.45 0.33 4.52 0.29 4.45 0.331000 Hz 3.40 1.01 3.85 1.15 4.38 0.52 4.41 0.472000 Hz 0.40 0.90 0.20 0.48 2.04 1.20 2.23 1.094000 Hz 0.00 0.00 0.00 0.00 0.38 0.69 0.08 0.19BBN 0.00 0.00 0.00 0.00 0.16 0.32 0.23 0.42
N1 amplitudeQuiet �3.83 1.78 �4.03 2.10 �3.88 1.60 �3.67 2.19250 Hz �3.79 1.85 �3.64 2.04 �3.92 2.03 �3.43 1.86500 Hz �3.58 2.12 �3.60 1.58 �3.51 1.84 �3.73 1.571000 Hz �3.15 1.45 �3.36 1.31 �3.23 1.48 �3.91 2.052000 Hz �1.04 1.15 �0.84 0.65 �3.24 2.40 �3.02 1.724000 Hz �0.27 0.60 �0.11 0.23 �1.97 1.72 �1.37 1.05BBN 0.00 0.00 0.00 0.00 �0.98 1.28 �1.30 1.13
N2 amplitudeQuiet �9.94 7.47 �9.72 6.49 �11.19 5.17 �8.55 6.03250 Hz �9.66 3.88 �8.43 5.81 �10.31 5.59 �10.25 6.98500 Hz �8.31 5.08 �9.59 4.30 �9.18 3.89 �10.10 7.581000 Hz �7.51 3.86 �8.82 3.91 �10.71 5.78 �11.37 6.652000 Hz �1.83 3.07 �1.40 2.11 �3.30 2.99 �6.96 4.954000 Hz �0.51 1.61 0.00 0.00 �2.58 3.35 �0.38 0.98BBN 0.00 0.00 0.00 0.00 0.00 0.00 0.00 0.00
P3 amplitudeQuiet 11.53 6.77 12.11 5.92 12.75 5.37 15.13 5.21250 Hz 13.19 6.18 12.49 7.01 12.19 6.29 14.66 7.00500 Hz 12.62 5.27 14.17 7.70 11.93 6.58 12.99 6.931000 Hz 9.63 4.35 11.75 5.58 12.79 3.98 13.75 5.882000 Hz 1.35 2.25 2.41 3.56 5.99 4.34 7.51 5.214000 Hz 0.00 0.00 0.00 0.00 1.36 2.20 1.76 2.32BBN 0.00 0.00 0.00 0.00 0.88 1.86 0.00 0.00
MMN amplitudeQuiet �2.24 1.28 �1.96 1.43 �1.99 1.19 �2.62 0.92250 Hz �1.97 0.46 �2.15 1.16 �1.78 1.56 �2.72 1.56500 Hz �1.73 1.16 �2.38 1.93 �3.11 0.99 �2.86 1.111000 Hz �1.34 1.00 �2.13 1.36 �1.46 0.90 �2.21 1.642000 Hz �0.39 0.68 �0.64 0.94 �1.16 0.90 �1.05 0.984000 Hz 0.00 0.00 0.00 0.00 �0.01 0.03 �0.30 0.50BBN 0.00 0.00 0.00 0.00 0.00 0.00 0.00 0.00
Values are shown as a function of component and low-pass noise condition.
EAR & HEARING, VOL. 26 NO. 2 201

In contrast to d' scores, there is no main effect oflow-pass noise condition on RT [F(3,27) � 2.16; p� 0.167; � � 0.438], probably due to missing dataand the resulting smaller number of subjects in-cluded in the analysis (Figure 2 bottom, Table 2).Therefore, data in response to the 80-dB stimuliwere analyzed separately from data in response tothe 65-dB stimuli (allowing for statistical analysisof more low-pass cutoff conditions than for the 65-and 80-dB data combined, due to missing data at2000 Hz for the 65 dB intensity). These separateanalyses indicate a significant effect of low-passnoise masking condition [F(4,24) � 22.73; p �0.001; � � 0.336] for 80-dB stimuli. Post hoctesting indicates that RTs increase significantly
when the low-pass noise masking cutoff is raisedto 2000 Hz. There is also a significant effect ofspeech stimulus [F(1,6) � 19.91; p � 0.004], withRTs to /da/ being shorter than those to /ba/.
Event-Related Potentials
Grand Mean Waveforms in the Active Discrim-ination Condition • The grand mean waveformsto /ba/ and /da/ from all 10 subjects recorded to the65-dB and 80-dB stimuli in the active discriminationcondition are shown as a function of noise conditionin Figure 2. Responses recorded from Cz are dis-played for N1 and responses recorded from Pz are
TABLE 2. Mean reaction time (RT) values and ERP latencies (in milliseconds) across subjects are shown along with standarddeviations for responses to /ba/ and /da/ stimuli presented at 65- and 80-dB ppeSPL
65 dB 80 dB
ba da ba da
Mean SD Mean SD Mean SD Mean SD
RT valuesQuiet 400.15 71.47 396.90 79.95 389.10 77.21 388.10 93.36250 Hz 390.90 67.51 399.50 78.63 397.35 79.38 379.60 73.48500 Hz 404.20 61.06 395.75 75.09 403.20 77.35 392.90 68.971000 Hz 464.70 84.88 428.45 67.14 396.75 63.17 374.85 68.292000 Hz 488.71 46.48 498.67 89.874000 HzBBN
N1 latencyQuiet 114.45 13.72 110.59 18.26 106.19 11.69 104.79 14.26250 Hz 117.09 16.03 109.36 18.01 104.61 7.47 100.22 7.15500 Hz 123.77 14.64 111.82 12.66 114.27 12.63 109.53 16.931000 Hz 134.32 12.40 126.05 18.34 124.29 18.55 115.51 17.952000 Hz 186.52 25.43 157.52 23.95 140.64 13.37 145.56 18.974000 Hz 179.14 10.24 164.26 17.49BBN 170.70 13.00
N2 latencyQuiet 247.52 25.04 231.17 30.76 245.94 19.16 246.99 33.03250 Hz 241.19 22.96 233.11 25.66 239.61 22.19 217.41 16.20500 Hz 253.50 16.44 233.63 17.61 249.45 29.78 225.55 10.181000 Hz 273.71 38.00 259.30 32.48 275.29 44.22 243.65 35.622000 Hz 304.30 36.44 293.75 42.734000 Hz 331.72 23.70BBN
P3 latencyQuiet 403.66 23.22 400.63 35.69 393.47 23.26 416.97 81.78250 Hz 418.38 68.17 404.84 55.28 412.63 64.61 399.92 56.45500 Hz 420.14 57.43 401.33 35.50 416.79 47.44 404.67 61.031000 Hz 520.86 113.96 500.99 90.41 456.17 57.36 400.09 33.152000 Hz 531.49 75.05 552.15 110.084000 HzBBN
MMN latencyQuiet 191.68 58.25 181.47 38.89 166.22 58.64 167.94 41.12250 Hz 205.42 50.53 157.52 39.47 210.90 48.80 169.98 52.31500 Hz 219.28 40.64 192.99 55.64 212.62 44.02 181.15 47.641000 Hz 250.11 57.72 245.60 63.09 209.34 36.91 209.29 75.302000 Hz 291.97 74.64 221.48 69.784000 HzBBN
Values are shown as a function of component and low-pass noise condition.
202 EAR & HEARING / APRIL 2005

displayed for P3 because the grand mean responseswere largest in amplitude at these electrode sites.2
For 65-dB stimuli, N1 is clearly present in theresponses to stimuli presented as standards in thequiet, 250-, 500-, and 1000-Hz low-pass noise condi-tions and absent in the 4000-Hz and BBN condi-tions. The amplitude of N1 decreases and its latencyincreases as the low-pass cutoff frequency is raised.P3 is clearly present in the quiet, 250-, 500-, and1000-Hz conditions, and is clearly absent in the4000-Hz through BBN conditions. The amplitude ofP3 decreases and latency increases as the low-passnoise cutoff is raised to 1000 Hz, and P3 disappearsas the low-pass noise cutoff is raised further. N2 isthe negativity preceding the P3 response. N2 ampli-tudes decrease and latencies increase as the low-pass noise cutoff is raised to 1000 Hz. N2 then
disappears when the masker cutoff frequency israised further.
For 80-dB stimuli, N1 is present in quiet and inall of the noise masking conditions. Its amplitudedecreases and latency increases as the low-passnoise cutoff is raised. P3 is clearly present in thequiet through 2000-Hz low-pass noise conditions butis absent in the 4000-Hz and BBN conditions. N2 isclearly present in the quiet, 250-, 500-, 1000-, and2000-Hz conditions. Its amplitude decreases andlatency increases as the low-pass noise masker cut-off is raised to 2000 Hz. N2 is absent in the BBNcondition.
Grand Mean Waveforms in the PassiveCondition
Figure 3 shows grand mean waveforms recordedin response to the 65-dB and 80-dB stimuli pre-sented as standards and as deviants in the passivecondition.
For 65-dB stimuli, N1 appears to be present in atleast the quiet through 1000-Hz low-pass noise con-
2 Although N2 is labeled on Figure 2 to identify the component,all N2 measurements were taken from electrode site Cz in thedifference waveforms obtained by subtracting responses to stan-dards from responses to deviants.
Fig. 2. Grand mean waveforms recorded in all of the noiseconditions to the /ba/ and /da/ stimuli are displayed for the65 dB and 80 dB ppe SPL active discrimination conditions.Responses to stimuli presented as standards are displayed forCz (thin line); responses to stimuli presented as deviants aredisplayed for Pz (thick line). N1, N2, and P3 are indicated.
Fig. 3. Grand mean waveforms recorded in all of the noiseconditions to the /ba/ and /da/ stimuli are displayed for the65 dB and 80 dB ppe SPL passive conditions. Responses tostimuli presented as standards (thin line) and deviants (thickline) are displayed for Cz. N1 and MMN are indicated.
EAR & HEARING, VOL. 26 NO. 2 203

ditions. For 80-dB stimuli, N1 was clearly present inall of the conditions. N1 latencies and amplitudes,however, were not measured in the passive condi-tion. Due to the rapid stimulus presentation rate,the generators of N1 probably were refractory inmany subjects (e.g., Davis, 1976; Näätänen & Pic-ton, 1987). As a result of this, and perhaps sometemporal overlapping, N1 was not always negativein voltage (relative to the prestimulus baseline) andwas often difficult to identify. The MMN follows andpartially overlaps the N1. It is better seen in differ-ence waveforms.
Figure 4 displays the MMN in grand mean differ-ence waveforms, recorded from Cz in the passivecondition at 65 and 80 dB. For 65-dB stimuli, theMMN appears to be present in the quiet through atleast the 1000-Hz conditions for /ba/ and /da/ andquestionably present in the 2000-Hz low-pass noisecondition for both speech sounds. The MMN appearsto be absent in 4000-Hz low-pass noise condition. Itis clearly absent in the BBN conditions, as indicatedby no activity below the pre-stimulus baseline (i.e.,no negativity). The MMN increased in latency and
decreased in amplitude as the low-pass noisemasker cutoff was raised.
For 80-dB stimuli, the MMN is clearly present inthe quiet through 1000-Hz low-pass noise maskingconditions, and clearly absent in the 4000-Hz andBBN conditions. MMN amplitudes decrease andlatencies increase as the low-pass noise masker israised.
Amplitude and Latency Measures
The mean amplitude and latency data across the10 subjects are shown in Tables 1 and 2 (lowerportion) and are summarized in Figure 5. Table 1shows mean amplitudes along with standard devia-tions for responses to /ba/ and /da/ presented at 65-and 80-dB ppe SPL in all of the low-pass noisemasking conditions. Table 2 is similar to Table 1,except that mean latencies are shown rather thanamplitudes. Figure 5 summarizes the results of thestudy for behavioral measures (d', RT) and for ERPmeasures N1, MMN, and P3. N2 was eliminated tosimplify the figure. Data in this figure are expressed
Fig. 4. Grand mean difference waveforms in all of the noiseconditions to the /ba/ and /da/ stimuli are displayed for the65 dB and 80 dB ppe SPL passive condition. Responses aredisplayed for Cz. MMN is indicated.
Fig. 5. Response strength (top) and latency change (bottom),normalized to the quiet condition, are displayed as a functionof low-pass noise masking condition for 65- and 80-dB ppeSPL speech sounds. N1 is indicated by squares, MMN isindicated by circles, P3 is indicated by diamonds, and behav-ioral results are indicated by the letter B. Data are pooledacross /ba/ and /da/. Results for N2 are not shown.
204 EAR & HEARING / APRIL 2005

in terms of response strength (percent of quietcondition) or latency change (millisecond changefrom the quiet condition). The data in Figure 5 arecollapsed across /ba/ and /da/, as there were fewinteractions involving speech stimulus.N1 • Figure 5 and Tables 1 and 2 display the effectsof the noise condition on N1 amplitude (top) andlatency (bottom). There is a main effect of intensity[F(1,9) � 18.32; p � 0.002] whereby N1 amplitudesin response to 80-dB speech sounds are larger thanthose to 65-dB speech sounds. There is a main effectof low-pass noise condition [F(6,54) � 34.34; p �0.001; � � 0.318]. There is also an interactionbetween stimulus intensity and low-pass noise con-dition [F(6,24) � 8.00; p � 0.001; � � 0.449]. Post hocanalyses indicate that N1 amplitudes in response to65-dB speech sounds decrease when the low-passnoise cutoff is raised, with changes reaching signif-icance only when the low-pass noise cutoff is raisedto 2000 Hz and higher. In contrast, N1 amplitudesin response to speech sounds presented at 80 dB aresignificantly reduced only when the low-pass noisecutoff is raised to 4000 Hz. There is no main effect ofspeech stimulus on N1 amplitude [F(1,9) � 0.03; p �0.872].
There are significant main effects of intensity[F(1,4) � 31.96; p � 0.005], stimulus [F(1,4) � 26.31;p � 0.007], and noise condition [F(4,16) � 78.91; p �0.001; � � 0.380] on N1 latency. Responses to 80-dBspeech sounds are shorter in latency than are thoseto 65-dB speech sounds and responses to /da/ areearlier than those to /ba/. Both of these effects areseen even in the quiet condition. Post hoc analysesindicate that N1 latencies are significantly in-creased when the low-pass noise cutoff is raised to1000 Hz. An ANOVA on only the responses to the80-dB speech sounds also shows significant maineffects of stimulus [F(1,8) � 16.03; p � 0.004], withlatencies for /da/ being earlier than those for /ba/.Additionally, there is a main effect of condition[F(5,40) � 63.76; p � 0.001; � � 0.468], with signif-icant latency increases occurring when the low-passnoise is raised to 1000 Hz and above.P3 • The effects of noise condition on P3 amplitudesand latencies are displayed in Figure 5 and Tables 1and 2. As the low-pass noise cutoff is raised, P3amplitudes decrease [F(6,54) � 41.73; p � 0.001; � �0.325]. Post hoc analyses indicate that the decreasein amplitude is significant when the noise cutoff israised to 2000 Hz and above. There is a trend for P3amplitudes to /da/ to be larger than to /ba/ [F(1,9) �5.43; p � 0.045], even in the quiet condition. There isno main effect of stimulus intensity [F(1,9) � 4.19; p� 0.071].
P3 latencies increase as the low-pass noise cutoffis raised [F(3,27) � 9.71; p � 0.003; � � 0.535].
These increases, however, are not significant untilthe noise cutoff is raised to 1000 Hz and above.There is no main effect of stimulus intensity [F(1,9)� 3.90; p � 0.080]. There is a trend for an intensity� condition interaction [F(3,27) � 3.87; p � 0.044; �� 0.626]. Examination of the data indicates that thelatency changes begin at the 1000-Hz noise cutoff for65 dB, but that changes occur at higher noise cutofffrequencies for 80-dB stimuli. As a result, a two-wayANOVA was performed on the data from the 80-dBcondition. Results indicate a significant effect ofnoise condition for the responses to 80-dB stimuli[F(4,24) � 17.12; p � 0.001; � � 0.532] that is firstsignificant in the 2000-Hz low-pass noise condition.N2 • The effects of noise condition on N2 amplitudeare displayed in Table 1. There is a main effect ofintensity [F(1,9) � 11.94; p � 0.007] whereby N2amplitudes are larger in response to 80-dB speechsounds than to 65-dB speech sounds. As the low-pass noise cutoff is raised, N2 amplitudes drop,indicated by a significant main effect of condition[F(6,54) � 28.17; p � 0.001; � � 0.269]. Thesechanges are significant when the noise cutoff israised to 2000 Hz and above. There is no main effectof speech stimulus [F(1,9) � 0.01; p � 0.924].
N2 latencies were longer in response to /ba/ thanto /da/ [F(1,9) � 72.00; p � 0.001], even in the quietcondition. There was a trend for a significant effectof noise condition [F(3,27) � 6.42; p � 0.012; � �0.571]. Examination of the data (Table 2) suggeststhat this is due to longer latencies when the noisecutoff is raised to 1000 Hz. There was no main effectof stimulus intensity [F(1,9) � 0.51; p � 0.495].When data for responses to the 80-dB stimuli areexamined alone, there is a significant main effect oflow-pass noise condition [F(4,24) � 17.61; p � 0.001;� � 0.544]. Post hoc testing indicates that N2 laten-cies increase significantly when the noise cutoff israised to 2000 Hz.MMN • Figure 5 (top) and Table 1 display the ef-fects of low-pass noise conditions on MMN peakamplitudes. MMN peak amplitude decreases as thelow-pass noise cutoff is raised [F(6,54) � 36.03; p �0.001], beginning with the 2000-Hz low-pass condi-tion. There are no significant main effects of speechstimulus [F(1,9) � 2.40; p � 0.156] or stimulusintensity [F(1,9) � 4.59; p � 0.061].
MMN latency increases as the low-pass noisecutoff is raised [F(3,21) � 10.26; p � 0.003; � �0.599]. These changes are shown in Figure 5 (bot-tom) and Table 2 and are first significant when thenoise cutoff is raised to 1000 Hz and above. There isalso a significant effect of speech stimulus [F(1,7) �14.60; p � 0.007], with responses to /da/ havingshorter latency than those to /ba/, even in the quietcondition. There is no significant main effect of
EAR & HEARING, VOL. 26 NO. 2 205
stimulus intensity [F(1,7) � 3.15; p � 0.119]. Anal-ysis of the 80-dB results alone also indicates thatMMN latency increases significantly when the noisecutoff is raised to 1000 Hz [F(4,28) � 8.92; p � 0.006;� � 0.413]. Additionally, there is a trend for laten-cies to in response to /da/ to be earlier compared withresponses to /ba/ [F(1,7) � 6.25; p � 0.041].
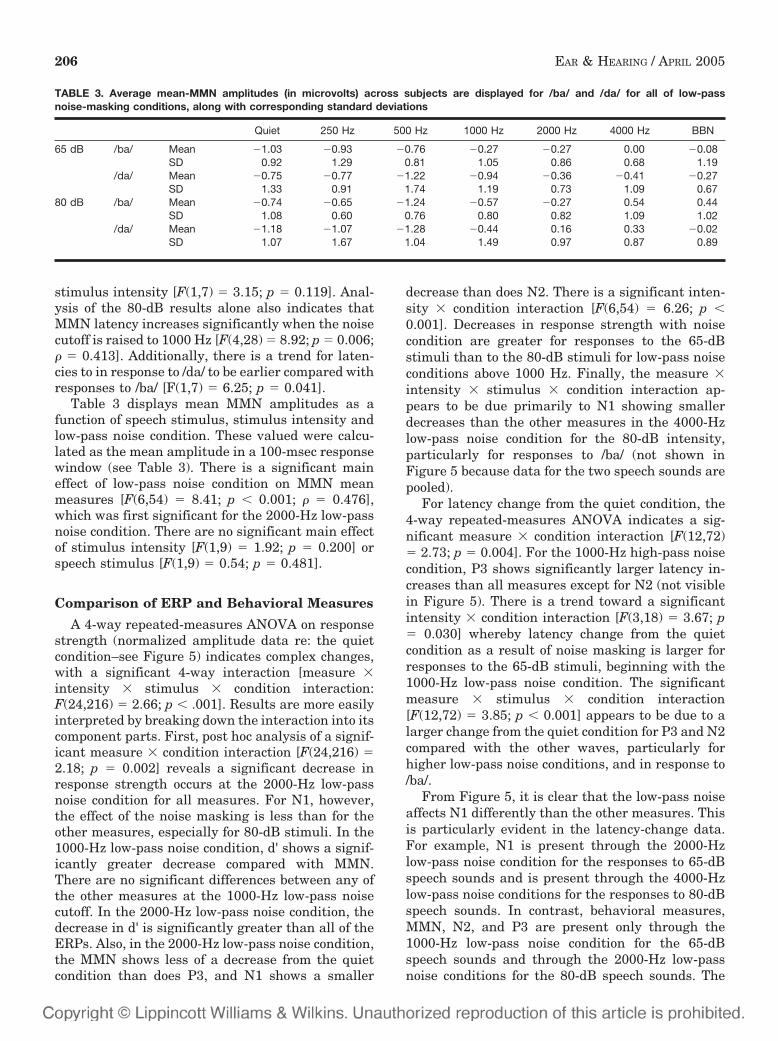
Table 3 displays mean MMN amplitudes as afunction of speech stimulus, stimulus intensity andlow-pass noise condition. These valued were calcu-lated as the mean amplitude in a 100-msec responsewindow (see Table 3). There is a significant maineffect of low-pass noise condition on MMN meanmeasures [F(6,54) � 8.41; p � 0.001; � � 0.476],which was first significant for the 2000-Hz low-passnoise condition. There are no significant main effectof stimulus intensity [F(1,9) � 1.92; p � 0.200] orspeech stimulus [F(1,9) � 0.54; p � 0.481].
Comparison of ERP and Behavioral Measures
A 4-way repeated-measures ANOVA on responsestrength (normalized amplitude data re: the quietcondition–see Figure 5) indicates complex changes,with a significant 4-way interaction [measure �intensity � stimulus � condition interaction:F(24,216) � 2.66; p � .001]. Results are more easilyinterpreted by breaking down the interaction into itscomponent parts. First, post hoc analysis of a signif-icant measure � condition interaction [F(24,216) �2.18; p � 0.002] reveals a significant decrease inresponse strength occurs at the 2000-Hz low-passnoise condition for all measures. For N1, however,the effect of the noise masking is less than for theother measures, especially for 80-dB stimuli. In the1000-Hz low-pass noise condition, d' shows a signif-icantly greater decrease compared with MMN.There are no significant differences between any ofthe other measures at the 1000-Hz low-pass noisecutoff. In the 2000-Hz low-pass noise condition, thedecrease in d' is significantly greater than all of theERPs. Also, in the 2000-Hz low-pass noise condition,the MMN shows less of a decrease from the quietcondition than does P3, and N1 shows a smaller
decrease than does N2. There is a significant inten-sity � condition interaction [F(6,54) � 6.26; p �0.001]. Decreases in response strength with noisecondition are greater for responses to the 65-dBstimuli than to the 80-dB stimuli for low-pass noiseconditions above 1000 Hz. Finally, the measure �intensity � stimulus � condition interaction ap-pears to be due primarily to N1 showing smallerdecreases than the other measures in the 4000-Hzlow-pass noise condition for the 80-dB intensity,particularly for responses to /ba/ (not shown inFigure 5 because data for the two speech sounds arepooled).
For latency change from the quiet condition, the4-way repeated-measures ANOVA indicates a sig-nificant measure � condition interaction [F(12,72)� 2.73; p � 0.004]. For the 1000-Hz high-pass noisecondition, P3 shows significantly larger latency in-creases than all measures except for N2 (not visiblein Figure 5). There is a trend toward a significantintensity � condition interaction [F(3,18) � 3.67; p� 0.030] whereby latency change from the quietcondition as a result of noise masking is larger forresponses to the 65-dB stimuli, beginning with the1000-Hz low-pass noise condition. The significantmeasure � stimulus � condition interaction[F(12,72) � 3.85; p � 0.001] appears to be due to alarger change from the quiet condition for P3 and N2compared with the other waves, particularly forhigher low-pass noise conditions, and in response to/ba/.
From Figure 5, it is clear that the low-pass noiseaffects N1 differently than the other measures. Thisis particularly evident in the latency-change data.For example, N1 is present through the 2000-Hzlow-pass noise condition for the responses to 65-dBspeech sounds and is present through the 4000-Hzlow-pass noise conditions for the responses to 80-dBspeech sounds. In contrast, behavioral measures,MMN, N2, and P3 are present only through the1000-Hz low-pass noise condition for the 65-dBspeech sounds and through the 2000-Hz low-passnoise conditions for the 80-dB speech sounds. The
TABLE 3. Average mean-MMN amplitudes (in microvolts) across subjects are displayed for /ba/ and /da/ for all of low-passnoise-masking conditions, along with corresponding standard deviations
Quiet 250 Hz 500 Hz 1000 Hz 2000 Hz 4000 Hz BBN
65 dB /ba/ Mean �1.03 �0.93 �0.76 �0.27 �0.27 0.00 �0.08SD 0.92 1.29 0.81 1.05 0.86 0.68 1.19
/da/ Mean �0.75 �0.77 �1.22 �0.94 �0.36 �0.41 �0.27SD 1.33 0.91 1.74 1.19 0.73 1.09 0.67
80 dB /ba/ Mean �0.74 �0.65 �1.24 �0.57 �0.27 0.54 0.44SD 1.08 0.60 0.76 0.80 0.82 1.09 1.02
/da/ Mean �1.18 �1.07 �1.28 �0.44 0.16 0.33 �0.02SD 1.07 1.67 1.04 1.49 0.97 0.87 0.89
206 EAR & HEARING / APRIL 2005

amount of latency change from the quiet condition issmaller for N1 than for the other measures. P3shows the greatest latency change, N2, MMN, andRT show intermediate changes, and N1 shows thesmallest changes in latency from the quiet conditionas the low-pass noise masker is raised. In terms ofchanges in response strength, there is little differ-ence across the various measures as the low-passnoise cutoff was raised for 65-dB speech sounds. Forthe 80-dB speech sounds, however, N1 shows asmaller decrease than the other measures as thelow-pass noise cutoff was raised above 1000 Hz.
Hemisphere Comparison
An additional series of ANOVAs were completedto determine whether the noise masking differen-tially affected response amplitudes across the hemi-spheres, as has previously been reported (Müller-Gass, Marcoux, Logan, & Campbell, 2001). Theseanalyses were completed for responses to 80-dBstimuli (amplitudes were collapsed across /ba/ and/da/) in the quiet versus 1000 Hz low-pass noiseconditions, for electrodes C3M versus C4M and forcomponents N1, N2, P3, and MMN. Table 4 showsmean amplitude and standard deviation for thesecomponents in the two noise masking conditions. Incontrast to Müller-Gass et al. (2001), the noisemasking did not differentially affect amplitudesacross the two hemispheres, as reflected by nosignificant electrode � noise condition interactions(p � 0.12 to 0.84).
DISCUSSION
The low-pass noise maskers resulted in decreasedaudibility similar to that seen with moderate low-frequency hearing losses. As the noise cutoff fre-quency was raised, the portion of the audiogramshowing decreased audibility changed systemati-cally from including only low-frequency regions, tolow-, mid-, and high-frequency regions. As would beexpected, this pattern is different from that obtainedwith high-pass noise masking (Martin, Kurtzberg, &Stapells, 1999; Martin, Sigal, Kurtzberg, & Stapells,
1997). High-pass noise masking results in decreasedaudibility, which changed systematically from in-cluding high-frequency regions, to high-, mid-, andlow-frequency regions. The pattern of decreasedaudibility also differs somewhat from that obtainedwith BBN masking (Whiting, Martin, & Stapells,1998). With BBN masking, audibility is decreasedfor all of the frequency regions. The low-pass noisemasking in the present study resulted in smallthreshold elevations above the masker cutoff fre-quency, perhaps due to upward spread of masking(Egan & Hake, 1950). This upward spread of mask-ing may thus result in a different effective cutofffrequency for low-pass noise masking comparedwith high-pass noise masking.
Decreased audibility results in decreased ERPamplitudes, and increased ERP latencies, alongwith lower behavioral d' values and increased RTs.For the stimuli used in this study (/ba/, /da/), theeffects of the low-pass noise are greatest beginningwhen the 1000- to 2000-Hz spectral region ismasked. This is the frequency region containing theprimary acoustic cues differentiating /ba/ from /da/(i.e., second formant transition frequency).
Behavioral Measures
The mild/moderate threshold elevations producedby low-pass noise masking in this study result indecreased d' scores. Changes in d' first begin withthe 1000-Hz low-pass noise condition for 65-dBspeech sounds, and with the 2000-Hz low-pass noisecondition for 80-dB speech sounds. The d' scoreswere significantly smaller for responses to /ba/ thanfor /da/ at 65 dB, though not at 80 dB.
The moderate threshold elevations produced bythe low-pass noise masking also result in increasedRTs. As with d', changes in RT first begin with the1000-Hz low-pass noise condition at 65 dB and withthe 2000-Hz condition at 80 dB. Additionally, RTs to/ba/ are longer than those to /da/, even in the quietcondition, though this effect increases as the low-pass noise cutoff is raised.
Behavioral results with low-pass noise maskingdiffer from our previous high-pass noise studies
TABLE 4. Mean amplitudes (and corresponding standard deviations) computed across subjects are displayed for responses to 80-dBstimuli at electrode sites C3M and C4M in quiet and 1000 Hz low-pass noise-masking conditions
Quiet 1000 Hz LPN
C3 C4 C3 C4
N1 �0.46 (0.48) 0.38 (0.52) �0.47 (0.48) 0.20 (0.50)N2 �3.86 (2.95) �4.14 (2.92) �4.41 (2.63) �4.59 (2.95)MMN �0.55 (0.51) �0.44 (0.97) �0.515 (0.55) �0.70 (0.60)P3 8.67 (3.92) 8.30 (2.49) 7.95 (4.04) 7.05 (1.99)
Data are collapsed across stimulus and are shown in microvolts.
EAR & HEARING, VOL. 26 NO. 2 207

(Martin, Kurtzberg, & Stapells, 1999; Martin, Sigal,Kurtzberg, & Stapells, 1997), in that, in the presentstudy, changes in behavioral measures begin as themasker cutoff is raised, whereas changes in theprevious studies begin as the masker cutoff is low-ered. The similarity between the studies is thatwhen spectral energy in frequency regions impor-tant for the discrimination of /ba/ and /da/ aremasked, behavioral measures are affected. Thepresent study shows differences in behavioral re-sponses to the two stimulus intensities. For 80-dBstimuli in the 1000-Hz low-pass condition, most orall of the spectral cues for /ba/ were masked,whereas some of the spectral cues for discriminationof /da/ (some of the second formant transition, andperhaps some burst frequency information) werestill available. Therefore, subjects could differenti-ate the stimuli. When the low-pass noise cutoff wasraised to 2000 Hz, the second and third formanttransitions for /da/ were also masked, and subjectscould not differentiate the stimuli. For 65-dB stim-uli, less masking was required to mask spectralenergy in the region of the second formant transi-tion. The low-pass noise had a greater effect on RTfor /ba/ than for /da/. The second formant transitionfor /ba/ is about 1100 Hz, whereas for /da/ the F2transition is higher, at about 1800 Hz. Therefore,the second formant transition for /da/ remainedaudible for more low-pass noise conditions than didthe second formant transition for /ba/.
Dubno & Ahlstrom have also found that speechrecognition improves with increased speech inten-sity for normal subjects listening to low-passmasked speech stimuli. As the low-pass maskercutoff frequency is raised, consonant recognitiondecreases, particularly when the filter slope of themasker is steep (Dubno & Ahlstrom, 1995). Dubno,Dirks, & Ellison found that high-pass filtering ofspeech presented to normal listeners (similar tolow-pass masking) results in decreased consonantrecognition. Recognition results for /b/ show system-atic decreases as the filter cutoff is raised in octave-steps, especially when it is raised to 1400 Hz andabove. Results for /da/ show large changes when thefilter is raised to 2800 Hz and above (Dubno, Dirks,& Ellison, 1989). Given the different task and type ofstimuli used, their results are reasonably consistentwith those of the present study. In the presentstudy, changes in recognition are seen when thelow-pass noise masker is raised to 1000 Hz andabove and also when stimulus intensity is raised.
A number of additional studies have used filter-ing of stimuli and/or masking of stimuli to examinethe effects of decreased audibility on behavioralspeech recognition (e.g., Bell, Dirks, & Carterette,1989; Fabry & Van Tasell, 1986; French & Stein-
berg, 1947; Humes, Dirks, Bell, & Kincaid, 1987;Kryter, 1960; Miller & Nicely, 1955; Milner, 1982;Owens, Benedict, & Schubert, 1972; Pollack, 1948;Sher & Owens, 1974; Thornton & Abbas, 1980;Walden, Schwartz, Montgomery, & Prosek, 1981;Wang, Reed, & Bilger, 1978). In general, resultsindicate that these techniques reasonably, thoughnot perfectly, simulate the effects of sensorineuralhearing loss on speech recognition, which justifiestheir use. For example, Fabry & Van Tasell (1986)directly compared the filtering and noise maskingtechniques in terms of their ability to adequatelysimulate the effects of sensorineural hearing loss onspeech perception and more specifically on the errorpatterns obtained. Their results indicated for threesubjects, both the filtering and noise masking tech-niques were adequate, for one subject, only filteringwas adequate, and for two subjects, neither tech-nique was adequate. Both techniques havestrengths and weaknesses in terms of their ability tosimulate the effects of sensorineural hearing loss.Filtering is simpler, because it deletes the spectralenergy above the filter cutoff. Filtering however,simulates only decreased audibility. There is risk,particularly with steep analog filtering, of alteringtemporal resolution with this technique. Maskingproduces primarily cochlear threshold elevationsand simulates the loudness recruitment typicallyfound with sensorineural hearing loss (Humes,Dirks, Bell, & Kincaid, 1987; Humes & Roberts,1990). However, this technique has the drawback ofintroducing an additional signal that is not presentfor listeners with sensorineural hearing loss. Thus,whereas neither technique perfectly simulates theeffects of sensorineural hearing loss, each allow forthe effects of decreased audibility to be systemati-cally controlled.
ERP Measures: Active Conditions
Decreased audibility of the speech sounds pro-duced by low-pass noise masking results in in-creased latencies and decreased amplitudes of theERP peaks. No studies examining the effects oflow-pass noise masking on ERPs have previouslybeen published. N1 amplitudes dropped off rapidlywhen the low-pass noise cutoff was raised to 2000Hz and above for 65-dB speech sounds and to 4000Hz and above for 80-dB speech sounds. Changes inN1 latency began with the 1000-Hz noise for both65- and 80-dB speech sounds. As would be expected,latencies were longer for 65-dB speech sounds thanfor 80-dB speech sounds. Latencies for N1 werelonger for /ba/ than for /da/, perhaps due to the lowerfrequency content of /ba/ relative to /da/. This findingis consistent with results of our previous high-pass
208 EAR & HEARING / APRIL 2005

noise studies (Martin, Kurtzberg, & Stapells, 1999;Martin, Sigal, Kurtzberg, & Stapells, 1997) andBBN studies (Whiting, Martin, & Stapells, 1998).Although N1 was present in all conditions wherespeech sounds were audible, the drop off in N1amplitude as the low-pass masker was raised wassharper than seen with changes in the high-passnoise maskers (Martin, Kurtzberg, & Stapells, 1999;Martin, Sigal, Kurtzberg, & Stapells, 1997), partic-ularly in response to 65-dB speech sounds. This maybe due upward spread of masking or to a largercontribution of low-frequency spectral regions on N1amplitude (Martin, Kurtzberg, & Stapells, 1999).That is, N1 amplitude is smaller in response tohigh-frequency tones than to low-frequency tones(e.g., Picton, Woods, & Proulx, 1978), which maycarry over into smaller N1 amplitudes for speechsounds with higher frequency formant transitions(/da/) compared with speech sounds with a lowerfrequency formant transitions (/ba/). When the low-frequency content of the speech sounds was maskedby the noise, only a small N1 could be elicited wherestimuli were audible because most of the energycontributing to N1 was masked. The pattern ofresults seen for N1 reflects its function as an oblig-atory potential. It reflects the presence of audiblespeech energy, being present when speech soundswere audible, whether or not they werediscriminable.
Changes in N2 amplitude resulting from thelow-pass noise masking begin with the 2000-Hzlow-pass noise masking, and amplitudes in responseto the 65-dB speech sounds were smaller than werethose in response to the 80-dB speech sounds.Changes in N2 latency begin with the 1000- to2000-Hz low-pass noise conditions. Latencies werelonger for /ba/ than for /da/.
As with N2, changes in P3 amplitude begin withthe 2000-Hz low-pass noise condition. Changes in P3latency begin at 1000-Hz for responses to the 65-dBspeech sounds and 2000-Hz for responses to the80-dB speech sounds.
The pattern of results seen for N2 and P3 reflecttheir function as “discriminative” potentials. Themasking first affected the spectral region containingthe second formant transitions for the stimuli whenthe low-pass cutoff was raised to 1000 Hz for the 65dB speech sounds. The transitions were not com-pletely masked, however, and subjects were able todifferentiate between the stimuli, though not withthe accuracy (d', amplitude) or speed (RT, latency)seen for lower low-pass noise cutoffs. Most subjectsreported perceiving the sounds as /ba/ and /da/, or /a/and /da/ in this condition, though they reported thatdistinguishing the sounds was difficult. For the80-dB speech sounds, subjects reported that distin-
guishing between /ba/ and /da/ was easy in the1000-Hz low-pass noise condition but reported diffi-culty distinguishing the speech sounds in the2000-Hz low-pass noise condition. In this condition,most subjects reported that the speech sounds were/ba/ and /da/, or /a/ and /da/ but also mentioned thatthe sounds seemed quite distorted. When the low-pass noise masker cutoff was raised further, sub-jects that reported hearing the stimuli indicatedthey heard “/a/” and “/a/” or reported that they heardsomething repetitive but that the stimuli were nolonger speech-like nor distinguishable.
ERP Measures: Passive Conditions
A shorter ISI was used for the passive conditionsin the present study compared with our previousstudies (Martin, Kurtzberg, & Stapells, 1999; Oates,Kurtzberg, & Stapells, 2002). Due to increased effi-ciency of averaging in this study (a larger number oftrials was presented in a given time period evenwith the decreased deviant probability comparedwith the previous study), the MMN obtained ap-peared larger and had clearer morphology than inour previous study (Martin, Kurtzberg, & Stapells,1999). The signal-to-noise ratios of the recordingswere also improved (i.e., quieter recordings andlarger amplitude responses) because a larger num-ber of deviant trials was collected within in a giventime period, whereas MMN amplitude did not showa large decrease with the change in ISI. As with d'and N2 and P3 amplitudes, significant changes inMMN amplitude begin with the 2000-Hz low-passnoise. Changes in MMN latency begin with 1000-Hzlow-pass noise and latencies in response to /ba/ arelonger than MMN latencies in response to /da/.These results are consistent with our previous study(Martin, Kurtzberg, & Stapells, 1999) in whichchanges in MMN amplitude and latency with high-pass noise masking began with the 1000-Hz high-pass noise condition. In other words, when thespectral energy important for differentiating /ba/and /da/ was masked, changes in MMN amplitudeand latency are seen. The pattern of results for theMMN, like N2 and P3, reflect its discriminativefunction. MMN changes occurred even though sub-jects were not paying attention to the stimuli, indi-cating much of the change seen with noise maskingis pre-attentive.
ERP Measures: Hemisphere Comparison
In this study, noise masking did not differentiallyaffect response amplitudes across the hemispheres,as has been previously reported (Müller-Gass, Mar-coux, Logan, & Campbell, 2001; Shtyrov, Kujala,Ahveninen, Tervaniemi, Alku, Ilmoniemi, & Naa-
EAR & HEARING, VOL. 26 NO. 2 209
tanen, 1998). Müller-Gass & colleagues (2001) ex-amined MMN amplitudes in response to a /ba/-/da/contrast presented in quiet and in BBN presented atthree levels (65 to 75 dB). No significant differencein MMN amplitudes across the hemispheres wasobtained in the quiet condition, similar to thepresent study. In the most intense noise maskingcondition, MMN amplitude was reduced over the lefthemisphere. Shtyrov & colleagues (1998) examinedmagnetic MMN amplitude in response to a /pa/-/ka/contrast in quiet, and in BBN presented at a signal-to-noise ratio of 10 and 15 dB. In the quiet condition,the MMN response was larger in the left hemispherecompared with the right, whereas in BBN, the MMNresponse decreased in amplitude in the left hemi-sphere, while it increased in the right. Differencesbetween this study and the others may be due to thespecific acoustic characteristics of the speech soundsused, use of filtered masking versus BBN masking,and differences in stimulus rate, presentation levels,and masking levels. Another possibility is a flooreffect, caused by the small amplitudes of the MMN,especially in noise-masked conditions. Lack of ahemisphere effect for the other components is con-sistent with the results of Shtyrov, Kujala, Lyyti-nen, Ilmoniemi, & Naatanen (2000), who found nohemispheric difference in P1, N1, and P2 in responseto both speech and nonspeech stimuli.
Implications
Cortical ERP and behavioral measures provideinsight into the brain processing resulting in theperception of speech. N1 indexes speech sound au-dibility, being present when speech sounds are au-dible, whether or not they are discriminable. TheMMN indexes pre-attentive speech sound discrimi-nation, being present when audible speech soundsare discriminable, whether or not the subject ispaying attention. At least in the present paradigm,N2, P3, and behavioral measures index consciousspeech sound discrimination, being present whenaudible speech sounds are discriminable, but onlywhen the subject is paying attention.
These results have a number of implications forthe study of patient populations. A high percentcorrect or d' score does not guarantee that the timingof brain processes is unchanged. As shown by thisstudy, and by our previous study (Whiting, Martin,& Stapells, 1998), noise maskers resulted in slowingof brain processes associated with the discrimina-tion of the stimuli. In some cases, this slowingoccurred before changes in d' scores (or percentcorrect).
ERP measures might be considered for thosepatients who cannot or will not provide accurate
behavioral measures of speech audibility and dis-criminability (e.g., infants, difficult-to-test popula-tions). N1 may be used to index speech sound audi-bility. The strong correlations between behavioralperformance and discriminative ERPs (MMN, N2,P3) suggest that these discriminative ERPs may beused to index speech sound discrimination. If MMN,N2, or P3 is elicited, then evidence is available thata patient’s brain was able to differentiate, at acortical level, between two speech sounds. There are,however, some limitations to these measures. First,N2 and P3 paradigms typically require the subject topay attention to the sounds and to count or press abutton to the deviant sounds. This is not possible forall subject populations, particularly those that weare more likely to assess using these potentials.Further, infants do not show “P3,” although they doshow P3-like cortical discriminative responses (e.g.,Kurtzberg, 1989), appearing as a negative wavepeaking between 700 to 800 msec after stimulusonset. The cortical discriminative response ispresent in young infants but is less prominent witholder infants. Additionally, these responses are sen-sitive to subject state and attention, which limit itsuse for clinical populations (Kurtzberg, Vaughan,Kreuzer, & Fliegler, 1995). The MMN may providean alternative index that, at a cortical level, thebrain has differentiated between two speech sounds.Recordings of the MMN do not require subjects topay attention, and the MMN can be elicited ininfants and young children (e.g., Alho, Saino, Sajani-emi, Reinikainen, & Näätänen, 1990; Cheour-Lu-htanen, Alho, Kujala, Sainio, Reinikainen, Renlund,Aaltonen, Eerola, & Näätänen, 1995; Kraus, McGee,Micco, Sharma, Carrell, & Nicol, 1993). There re-main problems, however, with response presenceand variability in infants and young children(Kurtzberg, Vaughan, Kreuzer, & Fliegler, 1995).Further research is needed to determine the mostefficient ERP measures of speech sound discrimina-tion in difficult-to-test populations.
ERPs may prove to be particularly useful fordifficult-to-test populations with hearing loss. Elec-trophysiologic measures may be the only informa-tion available on an infant’s hearing and speechperception capacity. Hearing aid fittings on theseinfants, therefore, are sometimes based on limitedinformation. ERPs may provide us with more infor-mation on the effectiveness of the amplification, andprovide ways to monitor changes with amplificationand aural (re)habilitation (Oates, Kurtzberg, & Sta-pells, 2002).
The acoustic cues differentiating certain speechsounds are not always available to listeners withhearing loss. The cues may be inaudible, degraded,or distorted. The present study provides more infor-
210 EAR & HEARING / APRIL 2005

mation on changes in neural processing that occurwhen acoustic cues are clearly audible (e.g., quietcondition), degraded (e.g., 1000 to 2000 Hz low-passnoise conditions), or inaudible (e.g., BBN condition).When the acoustic cues differentiating /ba/ from /da/were degraded using low-pass noise masking, laten-cies (and RT) increased and amplitudes (and percentcorrect) decreased. This suggests that persons withhearing loss may show similar changes in neuralprocessing. If true, ERPs may be used to examinethese changes as well as to examine the extent towhich amplification remediates these changes(Korczak, Kurtz, & Stapells, Reference Note 1). Inthis study, for example, increases in discriminativeERP latencies occurred for 65-dB speech soundswhen the low-pass noise masking was raised to 1000Hz. When the speech sounds were amplified by 15dB, to an 80-dB presentation level, the latencyincreases did not occur until the noise maskingcutoff was raised to 2000 Hz. Further researchexamining changes in neural processing with hear-ing loss and with amplification are clearly needed.
Cortical ERP studies in individuals with sensori-neural hearing loss are beginning to emerge (e.g.,Firszt, Chambers, & Kraus, 2002; Gravel,Kurtzberg, Stapells, & Vaughan, 1989; Oates,Kurtzberg, & Stapells, 2002; Ponton, Eggermont,Don, Waring, Kwong, Cunningham, & Trautwein,2000; Ponton, Vasama, Tremblay, Khosla, Kwong, &Don, 2001; Tremblay, Piskosz, & Souza, 2003; Va-sama & Makela, 1997). The most relevant to thisstudy is a direct follow-up. Oates, Kurtzberg, &Stapells (2002) recently examined ERPs to /ba/ and/da/ presented at 65- and 80-dB ppeSPL in 20 adultswith sensorineural hearing loss and compared theresults with a control group with normal hearingsensitivity. Although a detailed analysis of hearingloss configuration was not completed, results werein general agreement with our noise masking stud-ies. The exception was that listeners with sensori-neural hearing loss show decreases in ERP ampli-tudes and increases in ERP latencies at highersignal-to-noise ratios compared with subjects in thenoise-masking studies.
ERPs have been used to predict emerging lan-guage function (Kurtzberg, 1989; Kurtzberg, Sta-pells, & Wallace, 1988). It would be useful to exam-ine whether ERPs could be used, with or withoutamplification, to predict the acoustic cues that areavailable to a child with hearing loss and perhaps topredict the language skills that a child with hearingloss will develop.
The results seen with decreased audibility due tolow-pass noise masking may be applicable to pa-tients with peripheral hearing loss. The maskedaudiograms are similar to those seen in patients
with low- and mid-frequency sensorineural hearingloss, and similar in configuration, though not neces-sarily degree, to those seen with conductive losssuch as otitis media. If this is true, even moderatelow-frequency hearing loss produces slowing ofbrain processes and decreases in the amplitude ofthose processes involved in the evaluation of speechstimuli. A number of factors may contribute to thesechanges, and these may vary, depending on whichcomponent is examined. These factors may includesensory processing, neural processing, decision-making, and/or response implementation. This al-teration in brain processing of speech sounds con-ceivably could result in difficulties with speechperception. Persons with low-frequency hearing lossnot only have difficulty discriminating /ba/ and /da/but may show difficulty with vowel perception, tim-ing cues, prosody, and so on. Further studies withsubjects with hearing loss are needed to determinewhether the amplitude and latency changes seen inthis study are comparable to those seen with hear-ing loss, whether hearing loss has further effects onneural processes or whether the effects of maskingon the neural processing of speech is different fromthe effects of hearing loss.
ACKNOWLEDGMENTS
This work was supported by NIDCD Clinical Center Grant P50DC00223 (Stapells), by NIDCD K23 DC05386 (Martin), and byNSERC-Canada (Stapells). In the early portion of this work BrettMartin was partially supported by an NIDCD Predoctoral Train-eeship. Diane Kurtzberg and Larry Raphael provided helpfulcomments on this work.
Address correspondence to: Brett A. Martin, Ph.D., School ofGraduate Medical Education, Seton Hall University, 400 SouthOrange Avenue, South Orange, NJ 07079.
Received January 30, 2004; accepted November 10, 2004
REFERENCES
Alho, K., Sainio, K., Sajaniemi, N., Reinikainen, K., & Näätänen,R. (1990). Event-related brain potential of human newborns topitch change of an acoustic stimulus. Electroencephalographyand Clinical Neurophysiology, 77, 151–155.
American National Standards Institute (ANSI) (1989). Specifica-tions for Audiometers (ANSI S3.6–1989). New York: ANSI.
Bell, T. S., Dirks, D. D., & Carterette, E. C. (1989). Interactivefactors in consonant confusion patterns. Journal of the Acous-tical Society of America, 85, 339–346.
Cheour-Luhtanen, M., Alho, K., Kujala, T., Sainio, K., Reini-kainen, K., Renlund, M., Aaltonen, O., Eerola, O., & Näätänen,R. (1995). Mismatch negativity indicates vowel discriminationin newborns. Hearing Research, 82, 53–58.
Davis, H. (1976). Principles of electric response audiometry.Annals of Otology, Rhinology and Laryngology, 85 (Suppl. 28),1–96.
Dubno, J. R., & Ahlstrom, J. B. (1995). Growth of low-passmasking of pure tones and speech for hearing-impaired andnormal-hearing listeners. Journal of the Acoustical Society ofAmerica, 98, 3113–3124.
EAR & HEARING, VOL. 26 NO. 2 211

Dubno, J. R., Dirks, D. D., & Ellison, D. E. (1989). Stop-consonantrecognition for normal-hearing listeners and listeners withhigh-frequency hearing loss. I: The contributions of selectedfrequency regions. Journal of the Acoustical Society of America,1, 347–354.
Egan, J. P., & Hake, H. W. (1950). On the masking pattern of asimple auditory stimulus. Journal of the Acoustical Society ofAmerica, 22, 622–630.
Fabry, D. A., & Van Tasell, D. J. (1986). Masked and filteredsimulation of hearing loss: Effects on consonant recognition.Journal of Speech and Hearing Research, 29, 170–178.
Festen, J. M., & Plomp, R. (1983). Relations between auditoryfunctions in impaired hearing. Journal of the Acoustical Societyof America, 73, 652–662.
Firszt, J. B., Chambers, R. D., & Kraus, N. (2002). Neurophysi-ology of cochlear implant users II: Comparison among speechperception, dynamic range, and physiologic measures. Ear andHearing, 23, 516–31.
French, N. R., & Steinberg, J. C. (1947). Factors governing theintelligibility of speech sounds. Journal of the Acoustical Soci-ety of America, 19, 90–119.
Gravel, J. S., Kurtzberg, D., Stapells, D. R., Vaughan, H. G., &Wallace, I. F. (1989). Case studies. Seminars in Hearing, 19,272–287.
Greenhouse, S. W., & Geisser, S. (1959). On methods in theanalysis of profile data. Psychometrika, 24, 95–112.
Humes, L., Dirks, D. D., Bell, T. S., & Kincaid, G. E. (1987).Recognition of nonsense syllables by hearing-impaired listen-ers and by noise-masked normal hearers. Journal of the Acous-tical Society of America, 81, 765–773.
Humes, L. E., & Roberts, L. (1990). Speech-recognition difficultiesof the hearing-impaired elderly: The contributions of audibil-ity. Journal of Speech and Hearing Research, 33, 726–735.
Kraus, N., McGee, T., Micco, A., Sharma, A., Carrell, T., & Nicol,T. (1993). Mismatch negativity in school-age children to speechstimuli that are just perceptibly different. Electroencephalog-raphy and Clinical Neurophysiology, 88, 123–130.
Kryter, K. D. (1960). Speech bandwidth compression throughspectrum selection. Journal of the Acoustical Society of Amer-ica, 32, 547–556.
Kurtzberg, D. (1989). Cortical event-related potential assessmentof auditory system function. Seminars in Hearing, 10, 252–261.
Kurtzberg, D., Stapells, D.R., & Wallace, I. F. (1988). Event-related potential assessment of auditory system integrity:Implications for language development. In P.M. Vietze, & H.G.Vaughan (Eds.), Early Identification of Infants with Develop-mental Disabilities (pp. 160–180). Philadelphia: Grune andStratton.
Kurtzberg, D., Vaughan, H. G., Kreuzer, J., & Fliegler, K. (1995).Developmental studies and clinical application of mismatchnegativity: Problems and Prospects. Ear and Hearing, 16,104–116.
Lang, A., Eerola, O., Korpilahti, P. I., Holopainen, I., Salo, S., &Aaltonen, O. (1995). Practical issues in the clinical applicationof mismatch negativity. Ear and Hearing, 16, 117–129.
Levanen, S., & Sams, M. (1997). Disrupting human auditorychange detection: Chopin is superior to white noise. Psycho-physiology, 34, 258–265.
Maiste, A., Wiens, A. S., Hunt, M. J., Scherg, M., & Picton, T. W.(1995). Event-related potentials and the catergorical percep-tion of speech sounds. Ear and Hearing, 16, 68–90.
Martin, B. A., Kurtzberg, D., & Stapells, D. R. (1999). The effectsof decreased audibility produced by high-pass noise masking onN1 and the mismatch negativity to speech sounds /ba/ and /da/.Journal of Speech, Language, and Hearing Research, 42, 271–286.
Martin, B. A., Sigal, A., Kurtzberg, D., & Stapells, D. R. (1997).The effects of decreased audibility produced by high-pass noisemasking on cortical event-related potentials to speech sounds/ba/ and /da/. Journal of the Acoustical Society of America, 101,1585–1599.
Miller, G. A., & Nicely, P. E. (1955). An analysis of perceptualconfusions among some English consonants. Journal of theAcoustical Society of America, 27, 338–352.
Milner, P. (1982). Perception of filtered speech by hearing-impaired listeners and by normally-hearing listeners withsimulated hearing loss. Unpublished doctoral dissertation.New York: City University of New York.
Müller-Gass, A., Marcoux, A., Logan, J., & Campbell, K. B.(2001). The intensity of masking noise affects the mismatchnegativity to speech sounds in human subjects. NeuroscienceLetters, 299, 197–200.
Näätänen, R., & Picton, T. W. (1987). The N1 wave of the humanelectric and magnetic response to sound: A review and ananalysis of the component structure. Psychophysiology, 24,375–425.
Oates, P. A., Kurtzberg, D., & Stapells, D. (2002). Effects ofsensorineural hearing loss on cortical event-related potentialsand behavioral measures of speech-sound processing. Ear andHearing, 23, 399–415.
Owens, E., Benedict, M., & Schubert, E. D. (1972). Consonantphonemic errors associated with pure-tone configurations andcertain kinds of hearing-impairment. Journal of Speech andHearing Research, 15, 308–322.
Picton, T. W. (1992). The P300 wave of the human event-relatedpotential. Journal of Clinical Neurophysiology, 9, 456–479.
Picton, T. W., Woods, D. L., & Proulx, G. B. (1978). Human auditorysustained potentials. II. Stimulus relationships. Electroencepha-lography and Clinical Neurophysiology, 45, 198–210.
Polen, S. B. (1984). Auditory event related potentials. Seminarsin Hearing, 5, 127–141.
Pollack, I. (1948). Effects of high pass and low pass filtering onthe intelligibility of speech in noise. Journal of the AcousticalSociety of America, 20, 259–266.
Ponton, C. W., Eggermont, J. J., Don, M., Waring, M. D., Kwong,B., Cunningham, J., and Trautwein, P. (2000). Maturation ofmismatch negativity: Effects of profound deafness and cochlearimplant use. Audiology and Neurootology, 5, 167–185.
Ponton, C. W., Vasama, J. P., Tremblay, K., Khosla, D., Kwong,B., & Don, M. (2001). Plasticity in the human central auditorysystem: Evidence from late-onset profound unilateral deafness.Hearing Research, 154, 32–44.
Scharf, B. (1978). Comparison of normal and impaired hearing II.Frequency analysis, speech perception. Scandinavian Audiol-ogy, Supple, 81–106.
Scherg, M., Vajsar, J., & Picton, T. W. (1989). A source analysis ofthe late human auditory evoked potentials. Journal of Cogni-tive Neuroscience, 1, 336–355.
Sher, A. E., & Owens, E. (1974). Consonant confusions associatedwith hearing loss above 2000 Hz. Journal of Speech andHearing Research, 17, 669–681.
Shtyrov, Y., Kujala, T., Ahveninen, J., Tervaniemi, M., Alku, P.,Ilmoniemi, R., & Naatanen, R. (1998). Background acousticnoise and the hemispheric lateralization of speech processingin the human brain: Magnetic mismatch negativity study.Neuroscience Letters, 251, 141–144.
Shtyrov, Y., Kujala, T., Lyytinen, H., Ilmoniemi, R. J., & Naatanen,R. (2000). Auditory cortex evoked magnetic fields and lateraliza-tion of speech processing. Neuroreport, 11, 2893–2896.
Stapells, D. R., Picton, T. W., & Durieux-Smith, A. (1994).Electrophysiologic measures of frequency-specific auditoryfunction. In J.T. Jacobson (Ed.), Principles and Applications in
212 EAR & HEARING / APRIL 2005

Auditory Evoked Potentials. Boston: Allyn and Bacon, pp.251–284.
Thibodeau, L. M. (1991). Exploration of factors beyond audibilitythat may influence speech recognition. Ear and Hearing,12:109S–115S.
Thornton, A. R., & Abbas, P. J. (1980). Low-frequency hearingloss: Perception of filtered speech, psychophysical tuningcurves, and masking. Journal of the Acoustical Society ofAmerica, 67, 638–643.
Tremblay, K. L., Piskosz, M., & Souza, P. (2003). Effects of ageand age-related hearing loss on the neural representation ofspeech cues. Clinical Neurophysiology, 114, 1332–1343.
Vasama, J. P., & Makela, J. P. (1997). Auditory cortical responsesin humans with profound unilateral sensorineural hearing lossfrom early childhood. Hearing Research, 104, 183–90.
Vaughan, H. G., & Ritter, W. (1970). The sources of auditoryevoked responses recorded from the human scalp. Electroen-cephalography and Clinical Neurophysiology, 28, 360–367.
Walden, B. E., Schwartz, D. M., Montgomery, A. A., & Prosek,R. A. (1981). A comparison of the effects of hearing impairment
and acoustic filtering on consonant recognition. Journal ofSpeech and Hearing Research, 46, 32–43.
Wall, L., Dalebout, S. D., Davidson, S. A., & Fox, R. A. (1991).Effect of hearing impairment on event-related potentials fortone and speech distinctions. Folia Phoniatrica, 43, 265–274.
Wang, M. D., Reed, C. M., & Bilger, R. C. (1978). A comparison ofthe effects of filtering and sensorineural hearing loss on pat-terns of consonant confusions. Journal of Speech and HearingResearch, 21, 5–36.
Whiting, K. A., Martin, B. A., & Stapells, D. R. (1998). The effectsof BBN masking on cortical event-related potentials to speechsounds /ba/ and /da/. Ear and Hearing, 19, 218–231.
REFERENCE NOTE1 Korczak, P.A., Kurtzberg, D. and Stapells, D.R. (in press).
Effects of sensorineural hearing loss and personal hearing aidson cortical event-related potential and behavioral measures ofspeech-sound processing. Ear and Hearing.
EAR & HEARING, VOL. 26 NO. 2 213