effects of low-dose ionizing radiation among the … · report covers the data collected at kaiga...
TRANSCRIPT

*
• ! •
EFFECTS OFLOW-DOSE IONIZING RADIATIONAMONG THE EMPLOYEES AT THE
KAIGA GENERATING STATION:A CROSS-SECTIONAL STUDY
Tata Memorial Centre"Tata Memorial Hospital
Dr. E. Borges Marg, ParelMumbai -400 012
(DECEMBER 200t)
•I*

EFFECTS OFLOW-DOSE IONIZING RADIATIONAMONG THE EMPLOYEES AT THE
KAIGA GENERATING STATION:A CROSS-SECTIONAL STUDY
"6SEABCH
Tata Memorial CentreTata Memorial Hospital
Dr. E. Borges Marg, Parel,Mumbai-400 012.
December 2000

EFFECTS OFLOW-DOSE IONIZING RADIATION AMONG
THE EMPLOYEES AT THEKAIGA GENERATING STATION :
A CROSS-SECTIONAL STUDY
A ReportPrepared
Under the Consultancy Service Contract of NPCILwith
Tata Memorial Centreby
The Epidemiological Studies CellTata Memorial Hospital
Mumbai
December 2000

TATA MEMORIAL CENTRE
Director, : Dr.(Ms.) K.A.DinshawTata Memorial Centre
Epidemiological : Mrs. P.N.NotaniStudies Cell Hon.ConsultantTata Memorial Hospital Epidemiologist
Mr.S.D.TaloleScientific Officer

PREFACE
In January 1992, the Nuclear Power Corporation of India Ltd. (NPCIL)
entered into a Consultancy Service Contract (No.CSC-92-l-TMC) with the Tata
Memorial Centre (TMC) to carry out epidemiological studies in the employees and
their families. The aim of the study was to investigate whether any health hazards
were associated with exposure, if any, to low-dose ionizing radiation. The contract
was to undertake the studies at 6 power stations or project sites. These were
located at Tarapur, Maharashtra; Rawatbhata, Rajasthan; Kalpakam, Tamilnadu;
Narora, Uttar Pradesh; Kakrapar, Gujarat and Kaiga, Karnataka.
NPCIL set up a Corporate Committee for Epidemiological Studies (COCES).
The first meeting of COCES was held on 6th April 1992. Two additional
committees were also constituted viz. Senior Technical Advisory Group (STAG)
and Planning and Implementation Supervisory Committee for Epidemiological
Studies (PISCES), and their functions and terms of references were laid down.
Member-Secretary PISCES was designated to be officer incharge of
Epidemiological Surveys. These committees met periodically. In the initial phase of
the study, several issues were debated and decisions taken regarding the target
population, the controls, the types of health indicators to be studied, the instrument
for data collection and several technical issues.
Tarapur Atomic Power Station was the first site selected for the survey,
because of its proximity to Tata Memorial Hospital (TMH), which allowed
enumerators, statistician and doctors from TMH to visit the site regularly to carry
out the work. This was followed by Kakrapar Atomic Power Station. Besides these
two power stations, the data at other power stations were collected by the local
IV

academic/medical Institutes as per the guidelines provided by TMH and the data
transported to the Epidemiological Studies Cell at TMH for processing and analysis.
Todate four reports of surveys carried out at Atomic Power Stations located
at Tarapur, Kakrapar, Rawatbhata and Narora have been generated. The present
report covers the data collected at Kaiga Generating Station. The Department of
Community Medicine, Kasturba Medical College, Manipal, was responsible for
collection of data at the Kaiga Generating Station.
One of the important results yielded by all these surveys carried out upto
now, at various power stations, is that there is no increase in the prevalence of
malignancies in the radiation workers as compared to non-radiation workers. At
Kaiga Generating Station, understandably no cancer cases were seen as the
employee group was small and largely (80%) below the age of 40. The project has
provided useful indicators and generated reliable baseline data for carrying out
farther work.
The Tata Memorial Centre has been privileged to undertake this research
project to address a problem which is not only scientifically important but also
socially relevant. This report, I am sure, will be of interest to a wide range of
readers from epidemiologists, scientists, physicians as well as physicists concerned
with these issues.
LdX—-—<>
- Dr.K.A.DinshawDirector, TMC

CONTENTSPage
Preface iv
Summary 1
1. Introduction 3
2. Objectives 4
3. Operational Methodology 4
3.1 Questionnaire 4
3.2 Field Survey, Data Collection and Processing 5
4. Population Coverage 6
5. Health Outcomes for Study ; 7
6. Selection of Comparison Group 7
6.1 Comparison Group for Evaluating Cancer Prevalence in Employees 8
6.2 Comparison Group for Evaluating Cancer Prevalence in Spouses andOffspring of Employees 9
6.3 Controls for Congenital Anoma lies in Offspring of Employees 9
7. Radiation Exposure : Definition and Measurement 9
8. Characterization of Eznployee Population : Univariate Description 11
9. Statistical Methods ... 13
10. Observations and Discussion 14
10.1 Cancer Prevalence 15
VI

Page
10.2 Prevalence of Congenital Anomalies in the Offspring 15
11. Conclusion 18
12. References 21
Acknowledgements 22
Appendix A : Radiation Exposure Data of Kaiga Generating Station 23
Appendix B : Kaiga Study Population Distribution by Age, Sex and
Radiation Status 25
Appendix C : BARC (Mumbai) Data 27
Appendix D : Annual Age-Adjusted Cancer Incidence Rate Per 100,000
Population from 6 Population-Based Indian Registries, 1989 34
Appendix E : Glossary of Terms Used 37
Appendix F : Abbreviations 37
Appendix G : Composition of Committees 40
VII

EFFECTS OF LOW-DOSE IONIZING RADIATION AMONG THEEMPLOYEES AT THE KAIGA GENERATING STATION :
A CROSS-SECTIONAL STUDY
SUMMARY:
The potential effect of ionizing radiation on human population has been a
concern to the scientific community and to the public at large, for a long time. The
Nuclear Power Corporation of India Limited (NPCIL) recognised the need for
more precise information on the biological effects of low dose radiation on human
population. In response to this concern, NPCIL awarded a Consultancy Service
Contract to the Tata Memorial Centre (TMC) Mumbai, to carry out epidemiological
studies in radiation occupational workers and their families at various power
station/project sites. At Tarapur and Kakrapar Power Stations TMC undertook the
survey. The surveys at other sites have been conducted by local academic/medical
institutions as per the procedures standardised by TMC, and the data are
transported for processing and analysis to its Epidemiological Studies Cell
especially set up for the purpose.
The present document reports the results of the cross-sectional survey
carried out at Kaiga Generating Station during the year 1998 by the Department of
Community Medicine, Kasturba Medical College, Manipal, and covers 1553
employees, 1162 spouses of employees and 1343 offspring of employees. The
prevalence of malignancies in these three groups has been studied and the
prevalence of congenital anomalies in the offspring of employees has also been
reported on.

The primary interest was to study prevalence of malignancies in the study
group, in particular to see if the prevalence was higher in radiation workers as
compared to that in non-radiation workers. There were, however, no cases of
cancer reported in all the three groups studied i.e. the employees, their spouses and
their offspring. This was not surprising since the study groups were small, all being
less than 1600 individuals. Furthermore, incidence of cancer is known to increase
with age, while in the present study 80% of the employees and their spouses were
below 40 years of age. Secondly working personnel and their families are usually
healthier than the general population.
There were 6 cases of congenital anomalies (major and minor) among 1343
offspring of employees, giving a prevalence of 0.45% (0.45% in males and 0.44%
in females). The prevalence of congenital anomalies in a comparable cross-section
of the population was not available with which the present data could be compared.
However, an earlier exhaustive study at a large maternity hospital in Mumbai, had
reported the prevalence of congenital anomalies in the new born, on clinical
examination only, to be 1.4% (Master-Notani et al, 1968). None of the anomalies,
in the present study, occurred in the offspring of radiation workers.
Finally, the study population at Kaiga is quite small and the cohort is also
young and no cancers were observed. However, the information collected will help
augment the base when analysis of pooled data, from all power stations, is
undertaken.

EFFECTS OF LOW-DOSE IONIZING RADIATION AMONG THEEMPLOYEES AT THE KAIGA GENERATING STATION :
A CROSS-SECTIONAL STUDY
1. INTRODUCTION
The potential effect of ionizing radiation on human population has been a
concern to the scientific community and the public at large, for a long time. The
Nuclear Power Corporation of India Limited (NPC1L) recognized the need for more
precise information on the biological effects of low dose radiation on human
population. In response to this concern the NPCIL initiated an epidemiological
survey in the employees and their families at its various sites and awarded a
Consultancy Service Contract to Tata Memorial Centre (TMC), Mumbai. NPCIL
also constituted various committees (composition giveii in Appendix G); one was
the Corporate Committee for Epidemiological Studies (COCES) for ensuring
suitable organizational arrangements and budgetary deployment. The other two
committees were Senior Technical Advisory Group (STAG) to give guidelines on
the conduct of the study and review the reports prepared by the other committee
viz. Planning and Implementation Supervisory Committee for Epidemiological
Studies (PISCES), which actually planned detailed methodology of carrying out the
epidemiological survey. TMC conducted the survey at 2 sites viz. Tarapur DAE
Centre and Kakrapar Atomic Power Station. For surveys at other stations, TMC
provides guidelines regarding the format for data collection, the questionnaire, and
the software for data entry. This data is then transferred to TMC for processing and
analysis at its Epidemiological Studies Cell especially set up for the purpose.

This report deals with data collected at Kaiga Generating Station (KGS),
Kaiga. Both the units of KGS were under construction and became operational by
December 1999.
2. OBJECTIVES
The general aim of the project was to conduct health survey in employees
and their families residing with them and assess morbidity due to various
diseases and evaluate the impact, if any, of low-dose radiation.
Specific aims, for this report, are to compute morbidity (prevalence) of
cancer and compare with suitable controls; for 3 groups viz. the employee group,
their spouses and their offspring. Additionally, for the offspring group prevalence
of congenital anomalies is also to be studied.
3. OPERATIONAL METHODOLOGY
Department Of Community Medicine, Kasturba Medical College (KMC),
Manipal, conducted the survey at Kaiga Generating Station during the year 1998.
The survey involved filling a questionnaire with respect to demographic and
medical data and other relevant details as well as undertaking medical examination.
3.1 Questionnaire
A detailed questionnaire was designed for collection of information on
demographic characteristics and medical and health history and radiation exposure
history. Besides, data were also obtained on lifestyle factors like tobacco use,

alcohol consumption, dietary intake and other occupational exposures. This was
necessary, since environmental/lifestyle factors determine a large fraction of cancer
rates. Thus, the confounding/modifying effects of these factors could be taken
into account, if required. Occupational history including the type of occupational
radiation exposure and period of exposure prior to and after joining the power
station was obtained. Radiation exposure history, occupational as well as medical
exposures were noted. Medical history giving details of past and/or present illness,
if any, and details of clinical examinations, reproductive history, congenital
anomalies, if any, among offspring, were also recorded.
The questionnaire was field-tested earlier at Tarapur DAE Centre, and was
used in the present survey also.
3.2 Field Survey, Data Collection and Processing
The employees and their families were invited by the local authorities of
Kaiga Generating Station (KGS) to participate in the survey and to come to the
hospital of Kaiga Generating Station, where clinical investigations were conducted
and data collected. For this survey, a team of doctors from Kasturba Medical
College, Manipal, visited the hospital at Kaiga. Doctors have examined each and
every participant as they presented themselves and filled the proforma. The
investigations that were carried out included testing of complete blood count
(C.B.C.), chest x-ray and cytology investigations.
Following criteria were set for carrying out these investigations :-
1. All adults above the age of 40 years and smokers 35 years and above had
to undergo a chest x-ray.

2. All females above the age of 35 years had to undergo pap-smear test.
3. All children had to undergo blood test (C.B.C.).
4. Adults had to undergo blood test (C.B.C.), only if it was not done for the
past one year.
The database was created from the completed proformas, with the software
installed at Kasturba Medical College by the Epidemio logical Studies Cell. The
floppies containing the database were then transported to this cell for processing
and analysis.
4. POPULATION COVERAGE
This report is based on information on 1553 employees, 1162 spouses of
employees and 1343 offspring of employees i.e. a total of 4058 individuals as seen
in Table 1. Of these 2546 members were individually examined and interviewed.
Table 1 : Population Covered i.e. Employees, their Spouses and Offspring (1998)
Groups
Employees
Spouses
Offspring
Total
Covered in the
Males Females
911 53
5 788
382 407
Survey
Total
964
793
789
2546(63%)
Information, obtained from the medicalrecords of KGS Hospital
Males
547
43
284
Females
42
326
270
Total
589(38%)
369(32%)
554(41%)
1512(37%)
Total
1553(100°/
1162(100°/
1343(100°/
4058(100°/
The information on health status with respect to malignancies and congenital

anomalies in the offspring, if any, in the group of 1512 individuals that was not
examined, was obtained by reviewing the medical records maintained at the
hospital of Kaiga Generating Station. Cancer and congenital anomalies are serious
enough conditions to be brought to the notice of the doctor and also recorded and
hence there is little likelihood of missing any case.
5. HEALTH OUTCOMES FOR STUDY
The basic study design was cross-sectional type with no follow-up. It was
simply a one time survey so that only prevalence of various conditions could be
assessed. Neither the incidence nor mortality were studied. The health outcomes
reported on here are
1. Malignant disease in three groups viz. employees, their spouses and
their offspring,
2. Congenital anomalies in the offspring.
Members of the surveyed group were given a thorough medical check-up.
However for the purposes of this report only thw above two conditions have been
considered.
6. SELECTION OF COMPARISON GROUP
Several options were available for selection of controls for the three groups
viz., the employees, their spouses and offspring that were to be surveyed. One was
to have internal comparison group i.e. compare radiation workers with non-
radiation workers of the power station. The othei was to have external comparison

group such as the general population. A third suggestion made by the
STAG/PISCES committee members was to obtain comparison group from
Bhabha Atomic Research Centre (BARC), Mumbai, employees and their family
members. Each of these groups carries both useful and restrictive elements.
6.1 Comparison Group for Evaluating Cancer Prevalence in Employees
General population groups are not ideal in studies evaluating occupational
exposures, because workers are usually healthier than the general population (the
healthy worker effect) - healthier people are more likely to get jobs and continue at
work. Hence the workers are generally expected to experience lower risks for
cancer and for other diseases than the general population. Furthermore, there are
no cancer prevalence data available for the general population and prevalence
estimated from available incidence rates by a fixed multiplier (1.5, 2 or 3) as an
estimate of average duration, would not be strictly proper.
The second alternative of comparing with BARC (Mumbai) employees and
their families, may also be questionable because in the perception of the lay public,
these employees also < come under the umbrella of radiation workers.
The better alternative is to have an internal comparison group i.e. compare
prevalence of cancer among those exposed to radiation with those who were not
exposed, within the same study group.
As for Kaiga Generating Station, there were no. malignancies reported in the
employees and the question of comparison therefore does not arise.
6.2 Comparison Group for Evaluating Cancer Prevalence in Spouses and
Offspring of Employees
Similarly no prevalent cancer cases were reported for the spouses and
offspring of employees and hence further discussion regarding the comparison
groups utilised, is not relevant, for this power station.
6.3 Controls For Congenital Anomalies in Offspring of Employees
It has not been possible to obtain the prevalence of congenital anomalies
in a comparable cross-section of the population independent of radiation-
occupational groups. The only data available from the country deals with
prevalence of congenital anomalies in the new born (Master-Notani et al;1968,
Agarwal et al;1991) and hence are not comparable with the present data. We have
compared the prevalence of conyenitpl anomalies in the offspring of employees of
Kaiga Generating Station with tiiose of BARC (Mumbai) employees. Internal
comparison i.e. comparing offspring of radiation workers versus those of non-
radiation workers though of limited value, could not be undertaken because no
congenital anomalies were observed in the offspring of radiation workers.
7. RADIATION EXPOSURE : DEFINITION AND MEASUREMENT
The details of annual radiation dose received by employees was provided by
Kaiga Generating Station. An employee who has been given a TLD number for
measuring radiation exposure is defined for the purposes of this study as a
radiation worker. The radiation exposure to an employee at a nuclear installation
can either be external and/or internal and is mainly due to gamma and beta
radiations.

External exposure is caused due to radioactive source external to the body
and is measured by means of personal dosimeters. These dosimeters can either be
thermoluminescent dosimeters or film badge type dosimeters. For day-to-day dose
management direct reading type dosimeters are also employed. For special
applications, some other types of rlosimetry devices are used.
Internal exposure is caused by radioactive materials entering the human
body through inhalation, ingestion and injection. This type of exposure is
monitored by bioassay and whole body counting techniques.
The external radiation exposure received by an employee is controlled by
suitable adjustment of distance, time and shielding, while the internal exposure is
controlled by protective equipment and clothing.
The dose received by the personnel is conti oiled and is kept well below the
stipulated exposure limits recommended by International Commission on
Radiological Protection (ICRP) and Atomic Energy Regulatory Board (AERB),
from time to time.
The distribution of cumulative radiation dose in mSv (external cum internal),
received by workers is given in Appendix A. In fact the workers had received this
dose at other power stations before joining Kaiga Generating Station which became
operational in 1999. The cumulative dose of an employee is measured by adding
annual doses from initial employment upto end-1998, when the survey ended.
The mean cumulative radiation dose per worker was 19.36 mSv in males.
10

Furthermore, not a single annual radiation dose exceeded 250 mSv, which is
considered to be a radiation incident of medical significance for the United
States population (Fry, 1980). Infact, almost all the annual radiation doses for 325
radiation workers were below 50 mSv; except two employees who received annual
doses of 62.5 mSv and 126.8 mSv.
8. CHARACTERIZATION OF EMPLOYEE POPULATION :
UNIVARIATE DESCRIPTION
Table 2 describes the age and sex distribution of the radiation and non-
radiation workers. It is seen that most of the employees are below 40 years of age.
The 5-year age group distribution is given in appendix B Table 1.
Table 2 : Age Distribution of Employees of KGS by Radiation Status(1998)
Age
Upto 39
40-49
50+
Total
RadiationWorkersNo.(%)
305(94)
10(3)
10(3)
325(100)
Males
Non-RadiationWorkersNo.(%)
887(78)
162(14)
84(8)
M33(100)
Females
RadiationWorkersNo.(%)
0
0
0
0
Non-RadiationWorkersNo.(%)
82(86)
12(13)
1(1)
95(100)
For age distribution by 5-year age interval see appendix B.
l ]

Table 3 : Profile of Male Employees of KGS by Radiation Status (1998)
Radiation Workers Non-Radiation TotalWorkers
Group No. % No. % No. %
• Marital StatusUnmarriedMarriedWidowed/Divorced/Separated
• EducationUpto primaryMiddle (V-VII std)Secondary andTechnical after SSC(VII-XII Std)Undergraduate andabove
• CommunityHinduMuslimsChristiansOthers
• HabitsNo habitChewers onlySmokers onlyAlcohol consumers onlyCombination of HabitsSnuff
• Cadre of WorkAdministrationScientificTechnicalSecurityLabour
(n=185)14540
-
(n=185)1-
15^
29
(n=325)297
9154
(n=325288
620380
(n=32l)1
122195
30
7822-
0.5-
84
16
i
91351
!)892612-
!• ' -
38611-
(n=726)151572
3
21790.4
(n=726)1326
514
173
23
71
24
(n=1133)992497713
88471
(u=1133)90248934445
1
804844-
(n=866)100293299
55119
1234346
14
(n=911)296612
3
(n=911)1426
669
202
3367-
23
73 .
22
(n=1458)1289
589217
89461
(n=1458)1190
541134753
1
(n=1187)101415494
58119
814834-
83542
510
12
Besides age and sex, it is also relevant to compare the profile of the radiation
and non-radiation workers with respect to other characteristics. This information
was available for 964 (911 males and 53 females) interviewed employees. For two
characteristics viz. community and habits additional self-reported information was
available from 589 non-interviewed employees (547 males and 42 females) and has
been incorporated in Table 3. The distribution of various characteristics is shown
for male employees only (Table 3), because there were very few female
employees. The radiation and non-radiation workers were found to be similar with
respect to community distribution (almost 90% belonged, as expected, to the
majority community), educational level (almost 73% had studied upto secondary
level or above) and aiso the habit pattern (over 80% had no habit). The radiation
and non-radiation workers were c!':ffersnt with respect to marital status which was
not surprising, since radiation workers were much younger (82% below 30)
compared to non-radiation workers (28% below 30). Expectedly, there was a
higher proportion of administrative staff and lower proportion of scientific/technical
staff in the group of non-radiation workers compared to radiation workers.
9. STATISTICAL METHODS
This is a cross-sectional survey with no follow-up, so that only the
prevalence of conditions of interest can be studied. The primary interest is to study
the prevalence of malignancies, particularly in the radiation workers and compare
with that in adequate control groups of non-radiation workers, after controlling for
environmental/life style factors, which determine a large fraction of cancer rates of
a population (Higginson and Muir, 1979; Doll and Peto, 1981).
13

As mentioned earlier, there were no prevalent cancer cases in the groups
studied. The other outcome of interest was congenital anomalies in the offspring of
the employees. The observed (O) number of anomalies was compared with the
expected (E) number arrived at from the corresponding control group, after
adjusting for age and sex differences. The observed number of cases is considered
to follow a Poisson distribution with mean E and under the null hypothesis, the
ratio O/E is unity. The confidence intervals were read from the tables prepared by
Bailar and Ederer for the ratio of an observed value of a Poisson variable to its
expectation. The ratio O/E with 95% confidence intervals are exhibited in the
relevant tables.
10. OBSERVATIONS AND DISCUSSION
The core question of the study concerns whether the employees of the
Nuclear Power Plants, if exposed to low doses of ionizing radiation, are at higher
risk for any disease condition; in particular cancer. The query is also extended to
the family members i.e. their spouses and offspring. The interest is focused on
cancer induction, since it is considered to be the most important long-term somatic
effect of radiation exposure. However, it is not possible to distinguish between
malignancies caused by ionizing radiation from those caused by other factors.
There is no radiation specific tumor pathobiology. In general, only the frequency of
an already prevalent tumor is expected to be elevated by radiation exposure. The
age-adjusted incidence rate of cancer of different sites reported from 6 population
based Indian registries is attached in Appendix D, for reference (ICMR, Biennial
Report, 1992).
14

10.1 Cancer Prevalence
This survey is a cross-sectional type. Neither benign nor malignant
conditions were observed in all the 3 groups: the employees, the spouses and the
offspring of employees.
This is not a surprising observation as all the 3 groups studied were small,
comprising less than 1600 individuals. Furthermore, cancer is known to increase
with age, while above 80% of employees of KGS and their spouses were below 40
years of age. The offspring group was also very small, 1343 in number, of whom
1091 were 14 years of age and under.
10.2 Prevalence of Congenital Anomalies in the Offspring
Among the somatic effects of radiation, other than cancer, developmental
effects in the unborn child are of great concern. Exposure to high doses of radiation
can cause death, anomaly, growth retardation and functional impairment depending
on the fetal stage at which exposures occur.
Several abnormalities have been reported in humans after in-utero
irradiation. The commonly reported ones are microcephaly, often combined
with mental retardation, some central nervous system defects and growth
retardation.
Because of large environmental and genetic variables encountered in
human populations, it is very difficult to measure any effect that might be produced
by low-dose radiation, on the developing fetus.
15

Table 4 : Prevalence of Congenital Anomalies (Major and Minor)in Offspring of Employees of KGS (1998)
Offspring of
Radiation Workers
Non-Radiation Workers
Total
No.
Cases(%)
No.
Cases(%)
No.
Cases(%)
Males
28
0
638
3(0.47)
666
3(0.45)
Females
28
0
649
3(0.46)
677
3(0.44)
Total
56
0
1287
6(0.47)
1343
6(0.45)
Table 4 gives the number of congenital anomalies both major and minor
observed in the offspring of the employees with details of anomalies given in
Table 5. The information on anomalies that might have occurred in the stillborn
fetuses or in neonatal deaths was not available.
Table 5: List of Prevalent Congenital Anomalies(Major and Minor) in Offspringof Employees of KGS (1998)
CONG.ANOMALIES(1CD 9TH :740-759)
l.Digestive System (749-751)Cleft Palate
IMusculo-SkeJetal System (754-756)
Bent Rt. Foot
3.CardiovascuIar System (745-747)
Cong. Heart Disease
{.Anomalies of Eyes (743)
•Squint (378)
TOTAL
Total Number of Offspring
No.(age)
1(8)
1(2)
-
1(6)
3(0.45%)
666
Males
(Parent/employeeRadiation Status)
NR
NR
NR
No.(age)
1(14)
-
1(1)
1(6)
3(0.44%)
677
Females
(Parent/employeeRadiation Status)
NR
NR
NR
Total
2
1
1
2
6(0.45%)
1343
* These anomalies fall outside the range of ICD-9th 740-759R : Radiation Worker, NR : Non-Radiation Worker
16

There are certain anomalies, indicated in Table 5 which fall outside the range
of anomalies classified as congenital by the International Classification of Diseases
(ICD) codes; 740 to 759. For the time being we have considered all the observed
anomalies for analysis.
Total number of congenital anomalies (major and minor) recorded were 6
in number, of which 3 were in male offspring and 3 in female offspring; giving an
overall prevalence of 0.45%. The prevalence of congenital anomalies in a
comparable cross-section of the population is not available with which the present
data could be compared. However, it has been compared with the prevalence in
offspring of BARC (Mumbai) employees, shown in Table 6. The detailed
description of anomalies in the offspring of BARC employees is given in Appendix
C, Table 5. No significant difference in the prevalence of congenital anomalies in
the 2 groups was observed [Males: 0=3, E=3.62, O/E=0.83, 95% CI=0.17-2.42;
Females: 0=3, E=2.92, O/E=1.03, 95% Cl=0.21-3.00].
Table 6 : Prevalence of Congenital Anomalies in Offspring ofEmployees of BARC, Mumbai (1994)
Males Females Total
No. of Offspring 14,446 12,645 27,091
No. of Congenital Anomalies 55 42 97
Prevalence (%) 0.38 0.33 0.36
Internal comparison of congenital anomalies in offspring of radiation
workers with that of non-radiation workers of KGS can not be undertaken. The
reason being, as seen from table 4, that there are no congenital anomalies
17

observed in both male and female offspring of radiation workers to compare with
that of non-radiation workers.
Questions of classificatory nature, nonetheless, still remain to be answered.
Whether one should include anomalies falling outside the ICD range. Overall, the
prevalence of congenital anomalies seen in the offspring of employees is only
0.45% (0.45% in males and 0.44% in females). An earlier exhaustive study at a
large maternity hospital catering to the Mumbai population, has reported the
prevalence of congenital anomalies in the new born on clinical examination only, to
be 1.4% (Master-Notani et al, 1968).
11. CONCLUSION
This survey was carried out among the employees of the Kaiga Generating
Station and their spouses and offspring. The study end points were prevalence of
malignancies in the above 3 groups as well as prevalence of congenital anomalies in
the offspring, to be compared with suitable controls. Prevalence, no doubt, is not
such a desirable study-end-point for evaluating etiological associations, and a
cohort follow-up study would be the method of choice. Nonetheless, cross-
sectional surveys do provide important indicators.
In the present survey, it was of interest to study if prevalence of malignancies
in radiation workers was different from that in non-radiation workers. However no
malignancies were observed m any employee. This was not surprising because,
besides the 'healthy worker' effect, the employee group was very small, less than
18

1600 individuals. Furthermore, cancer is a disease of old age, while over 80% of
employees were below 40 years of age.
Similarly, there were no malignancies seen in the spouses and offspring of
employees as well. Again, both these groups were small, less than 1600 individuals.
More than 80% of spouses also, expectedly, were below 40 years of age.
As regards congenital anomalies in the offspring of employees, the
prevalence in a comparable cross-section of the population was not available with
which the data of the present survey could be compared. Furthermore all the
congenital anomalies were reported in the offspring of non-radiation workers only.
The annual exposure of 2 mSv is a dose limit set by AERB/ICRP for a pregnant
employee. However, the question of in-utero work-related exposure also did not
arise as there were no female radiation workers in this survey. The prevalence of
congenital anomalies in the offspring in the present survey was only 0.45% which
did not seem to be high. An earlier exhaustive study at a large maternity hospital
catering to the Mumbai population, has reported the prevalence of congenital
anomalies in the new born on clinical examination only, to be 1.4% (Master-Notani
etal, 1968).
The cumulative dose distribution in the radiation workers provided by KGS
has been shown in Appendix A. Most of the radiation workers do not receive any
significant dose. Even the dose received is generally kept well within the upper-
bound of annual dose stipulated by ICRP/AERB and is thus not likely to cause any
health effects. The mean cumulative radiation dose per worker is 19.4 ±1.9 mSv
for males and there were no female radiation workers.
19

Undoubtedly, the study group is small and therefore no definitive conclusion
can be drawn. Nonetheless, these numbers would help augment the base, when the
analysis is done on the data pooled across all power stations.
20

12. REFERENCES
1. Agarwal SS, Singh U, Singh SS et al. Prevalence and spectrum of congenital
malformations in a prospective study at a teaching hospital, Indian J Med Res
[B], 1991;94:413-419.
2. Bailar J.C., Ederer F., Significance factors for the ratio of a poisson variable to
its expectation. Biometrics, 1964;20: 639-643.
3. Doll R and Peto R. The causes of cancer : Quantitative estimates of avoidable
risks of cancer in the United States today. JNCI,1981; 66:1191-1308.
4. Fry SA. The United States Radiation Accident and other Registries of the
REAC/TS Registry System : their function and current status. In the Medical
Basis for Radiation Accident Preparedness Eds:Hubner KF and Fry SA. pp 451-
468. Elsevier, Amsterdam, 1980.
5. Higginson J and Muir SC. Environmental carcinogenesis: misconceptions and
limitations to cancer control. JNCI, 1979; 63:1291 -1298
6. ICMR. Biennial Report 1988-1989. An Epidemiological study. Indian Council
of Medical Research, New Delhi, 1992.
7. Master-Notani P, Kolah PJ and Sanghvi LD. Congenital Malformations in the
New Born in Bombay Part-I and Part-II. Acta Genetica, Basel, 1968; 18:97-108
and 193-205.
21

ACKNOWLEDGEMENTS
We wish to acknowledge the help of the staff of the Nuclear Power Corporation ofIndia Limited (NPCIL) at Mumbai and Kaiga in providing us the data that we requiredfrom them. We wish to thank Shri. V. K. Chaturvedi, Chairman and Managing Director,NPCIL, and Dr. Y. S. R. Prasad, Ex-CMD and their staff; in particular Mr. B. K. Bhasin,Director, Operations, Mr. M. Das, Associate Director, Health, Safety and Environment,and Mr. M. R. Sachdev, Health Physicist, of Mumbai office for their never flaggingcooperation. Mr. V. K. Sharma, Project Director and Mr. A.C.R. Subba Reddy,Maintenance Superintendent, KGS and their staffs contribution need particular mention.We also thank Dr. R. S. P. Rao, Head, Department of Community Medicine, KasturbaMedical College, Manipal and his staff for collecting the data for the survey.
We wish to thank Dr. (Mrs.) U. Desai, Ex-Head of Medical Division andDr. (Mrs.) A. Sheshan, Statistician of the Hospital ofBhabha Atomic Research Centre(BARC) for providing us the BARC (Mumbai) data, for comparison purposes.
Finally, we wish to acknowledge with gratitude the leadership role and strategicplanning of this consultancy contract by the Ex-Directors of TMC; Dr. P. B. Desai andDr. R. S. Rao.
22

APPENDIX A
Radiation Exposure Dataof Kaiga Generating Station Employees.
23

APPENDIX A
DOSE DISTRIBUTION OF KAIGA GENERATING STATION EMPLOYEES
Table 1: Cumulative Radiation Dose in mSv from Initial Employment upto December1998
of Kaiga Radiation Workers, by Age and Sex
A) MALES
Exposure(in mSv)0-1-10-20-50-100-200-Total
No.of Persons in Different Age Groups
18-5
1585845
100
220
30-09
1010531
30
40- 50+10102519
b0331309
Total~6
1677258
9112
325
%1.8
51.422.217.82.83.40.6
100.0
Mean Cumulative Radiation dose per worker =19.36 ± 1.86 mSv
B) FEMALES
There were no female radiation workers
24

APPENDIX B
Kaiga Study Population DistributionBy Age, Sex And Radiation Status
25

APPENDIX B
Table 1: Distribution by Age,Sex and Radiation status of Kaiga Study Population (1998)
A] Employees:
SexRadiation status
MalesRadiation WorkersNon-Radiation Workers
Total
FemalesRadiation WorkersNon-Radiation Workers
Total
<20
0
77
00
0
20-
11599214
0
1010
25-
152
218370
02929
30-
27354381
03232
Age
35-
11
209220
01111
40-
28789
0
55
45-
87583
077
50-
5
5459
01
. . .
55-
5303 5 "
000
60+
00
6"
000~
Total
325
11331458
095
B] Spouses of Employees :
Sex •MalesFemalesTotal
15-0
4949
20-0
228228
25-4
363367
30-20
215235
35-14
122136
Age40-
77986
45-1
4142
50-1
1617
55-112
60+000
Total48
11141162
C] Offspring of Employees :i) Offspring of Radiation Workers
SexMalesFemalesTotal
ii) Offspring
SexMales
FemalesTotal
0-4121325
5-97512
10-14224
Age15-19
145
of Non-Radiation Workers
0-4217227444
5-9180195375
10-14124107231
Age15-19
6457121
20-24235
20-24394685
25-29415
25-29141327
30-000
30-044
Total282856
Total638649
1287
26

APPENDIX C
BARC (Mumbai) Data
27

APPENDIX C
Table 1: Distribution of BARC(Mumbai) study population by Age, Sex and RadiationStatus (1994).
A] Employees:
AgeSex
Radiation status <20._ J20- 25 : 30- . 3 5 - 40- 45. 50- 55- 60+ TotalMales
Radiation 0 6 58 214 288 325 519 573 417 16 2416Workers
Non.Radiation 9 497 1826 2204 1896 1787 1926 2011 1479 101 13736Workers
Total 9
FemalesRadiation 0
WorkersNon.Radiation 2
WorkersTotal 2
503
0
163
163
B] Spouses of Employees :
Sex 15- 20-Males 0 3Females 70 851Total 70 854
25-48
21352183
C] Offspring of Employees :
SexRadiation status
MalesRad.Workers'Offspring
Non-Rad.Workers' Offspring
Total
FemalesRad.Workers'
OffspringNon-Rad.Workers' Offspring
Total
<1
24
313
337
33
299
332
1884
12
616
628
so-ng
21962335
1-4
171
1649
1820
174
1578
1752
2418
19
522
541
35-142
19922134
j
5-9
324
2293
2617
324
2210
2534
2184 21 12 244i
13 20 20
268 328 333
281 348 353
Age40-141
24432584
\ge
10-14
430
2281
2711
385
2075
2460
28
45-166
22872453
15-19
552
2462
3014
474
2163
2637
5 2584
21
243
264
50-168
11421310
20-24
546
2188
2734
441
1717
2158
1896 117
8 1
110 5
118 6
55- 60+145 95169 13314 108
25+
200
1013
1213
131
641
7-72
16152
114
2590
2704
Total1047
1329814345
Total
2247
12199
14446
1962
10683
1*2645"

APPENDIX C
Table 2: Prevalent Cases of Cancer in Employees of BARC(Mumbai ) by Age, Sex,Radiation status and Site (ICD 9th), 1994
AJ Radiation Workers ( M a l e s ) :
AGE G R O U P SICD 9 T H , SITE _ <20_ 20- 25 - 3 0 - 3 5 - 4 0 - _ 4 5 - 50- 55- 60+ Total152 SMALL INTESTINE "~~~154 COLON162 LUNG 1202 NON.HODGKIN'S
L Y M P H O M A205 LEUKEMIA 1
MYELOIDTOTAL 0 6 6 0 ~ 6 0 2 ~4 2 0
1111
21321
B\ Radiation Workers (Females):
AGE GROUPSICD9TH SITE <20 20- 25- 30- 35- 40- 45- 50- 55- 60+._Jota180 CERVIX 1 l"202 NORHODGKIN'S 1 1
LYMPHOMA ... .........TOTAL 0 0 0 0 0 0 2 0 0 0 2
29

Table 2 (BARC data) (Continued) APPENDIX C
C] Non-Radiation Workers (Males):
<20ICD 9TH143145150151154155157160161162162170171
172185188189191193195
201
202
204
205
SITEALVEOLUSPALATEESOPHAGUSSTOMACHRECTUMLIVERPANCREASETHMOIDLARYNXLUNGTRACHEABONECONNECTIVE
TISSUEMELANOMAPROSTATEBLADDERURETERBRAINTHYROIDILL DEFINED
SITESHODGKIN'S
LYMPHOMAOTHER
LYMPHOMALEUKEMIA
LYMPHOIDLEUKEMIA
MYELOID
AGE GROUPS20- 25- 30- 35- 40-
1
11
1
1
11
21
45-
1
11
11
21
50-
1
3
12
111
55- 60+
2
11
11
Tota1116112212111
1132132
TOTAL 0 2 0 2 2 7 8 11 8 0 40
D] Non-Radiation Workers (Females):
AGE GROUPSICD9TH SITE <20 20- 25- 30- 35- 40- 45- 50- 55- 60+ Tota174 BREAST 2 1 1 1 5183 OVARY 1 1_TOTAL " ~ ~ " ~ 1 2 1 1 1 ~6
30

APPENDIX C
Table 3: Prevalent cases of cancer in Spouses of Employees of BARC(Mumbai)by age,sex and site (ICD 9th), 1994
A) MALES
ICD 9TH SITE191 BRAINTOTAL
<20 20- 25-AGE
30-11
GROUPS35- 40- 45- 50- 55- 60+ Tota" r.. ...
B) FEMALES
ICD 9TH SITE151153154162171
174179180183184191193205
STOMACHCOLONRECTUMLUNGCONNECTIVE/
SOFT TISSUEBREASTUTERUSCERVIXOVARYVAGINABRAINTHYROIDLEUKEMIA
MYELOID
AGE GROUPS<20 20- 25- 30-
1
2
1
1 1
35-
11
1
31
40-
1
1
6
121
1
45-1
11
2
1
50"
71
1
1
- -
55- 60+ Total" " 1
31 2
11
1 302
1 251132
TOTAL 0 0 7 13 15 10 0 54
31

APPENDIX C
Table 4: Prevalent Cases of Cancer in Offspring of Employees of BARC(Mumbai)+by Age,Sex and Site (ICD 9th), 1994
A) MALES
ICD 9TH
171
173186191202
205
SITE
CONNECTIVE/SOFT TISSUE
SKIN OTHERTESTISBRAINNON.HODGKIN'S
LYMPHOMALEUKEMIA
MYELOIDTOTAL
B) FEMALES
ICD 9TH
191
SITE
BRAINTOTAL
<5
0
<5
0
5-
1
... ._....
5-
0
AGE GROUPS10- 15- 20-
1 1
25-12
1121
1
AGE10-
0
GROUPS15-
0
20-
0
25-
11
Tota111
+Note: All cases were in offspring of the Non-Radiation Workers.
32

APPENDIX C
Table 5: CONGENITAL ANOMALIES OBSERVED IN OFFSPRING OF EMPLOYEES OF BARCfMiimba(1994)
CONG.ANOMALIES(ICD 9TH : 740-759)
1 .Central Nervous System(740-742)MicrocephalusHydrocephalusMen ingomyelocele
total
2.Cardio-Vascular System(745-747)Pulm.Valvotomy
Atrial SeptalDefect(ASD)
Ventricular SeptalDefect(VSD)
ASD + VSD
Fal lot's Tetrology
Cong. Heart
Patent DuctusArteriosus
total
3.Musculo-skeletal System(754-756)Talipes
Talipes equinovarus
Polydactyly
total
4. Digestive System(749-751)Cleft Lip + Palate
Cleft Palate
total
5.Genito-Urinary System(752-753)Hypospadias
Undescended Testis
Cong.Hydronephrosis
total
6.Syndrome
Down's Syndrome(758)
7.Hereditary Condition
•Thalassemia (282)
Total
Total no. of offspring
MalesNo.(Age)(Parent/Employee'sRad.Status)
1(12) (NR)
5( 1,2,5,14,15)(NR,NR,NR,NR,NR)
1(4) (NR)7
1(1) (NR)
6(2,2,4,6,16,19)(NR,NR,NR,NR,NR,NR)9(1,9,12,12,17,18,24,27,20)(NR,NR,NR,NR,NR,NR,NR,NR,R)
3(3,14,16) (NR,NR,NR)
5(3,4,13,20,4)(NR,NR,NR)NR,R)
3(8,13,16) (NR,NR,Mt)
28
2(3,26) (NR,NR)
1(9) (NR)
1(1) (NR)
1(8) (NR)
2
1(19) (NR)
1(20) (NR)
10(2,3,7,8,10,14,18,19,20,21)(NR,NR,NR,NR,NR,NR,NR,NR,NR,R)
FemalesNo.(Age)(Parent/Employee's Rad. Status)
3(2,7,14) (NR,NR,R)
1(8) (NR)
2(4,15) (NR.NR)
6 ' :
11(1,2,4,46,12,15,20,29,22,25)(NR,NR,NR,NR,NR,NR,NR,NR,NR,R,R)7(1,2,5,19,8,12,17)(NR,NR,NR,NR,R,R,R)
2(10,10) (NR.NR)
3(0,6,18) (NR,NR,NR)
2 3 "•
Total
3(1,8,10) (NR,NR,NR)
55(0.4%)
14446
* This anomaly falls outside the range of ICD-9th 740-33
3(11,20,2) (NR,NR,R)
2(11,26) (NR,NR)
42(0.3%)
12645
759
4
6
3
"IF
I
17
16
1
3
7
6
If
1(4) (NR)
r;"
2(21,26) (NR,NR)
4(3,5,7,7) (NR,NR,NR,R)
6
1(4) (NR)
1
2
1
1
4"
3
5
1
1
1
3
13
5
97(6.4<
27091

APPENDIX DAnnual Age-Adjusted Cancer Incidence
Rate Per 100,000 Population From 6Population-Based Indian Registries, 1989
34

APPENDIX DTable :Annual Age-Adjusted (World Population) Cancer Incidence Rate per 100,000 persons, India. Males; 1989
ICO9th140141142143144145146147148149150151152153154155156157158159160161162163164165170171172173175185186187188189190191192193194195196197198199200201202203204205206207208
SITELIPTONGUESALIVARY GLANDGUMFLOOR OF MOUTHOTHER MOUTHOROPHARYNXNASOPHARYNXHYPOPHARYNXPHARYNXOESOPHAGUSSTOMACHSMALL INTESTINECOLONRECTUMLIVERGALLBLADDERPANCREASRETROPERITONEUMOTHER DIGESTIVENASAL CAVITYLARYNXLUNGPLEURATHYMUSOTHER RESPIRATORYBONECONNECTIVE TISSUESKIN MELANOMASKIN OTHERBREAST MALEPROSTATETEST1SPENISURINARY BLADDERKIDNEYEYEBRAINNERVOUS SYSTEMTHYROIDOTHER ENDOCRINEILL DEFINEDSECONDARY LYMPHSECONDARY RESPISECONDARY OTHERPRIM UNKNOWMLYMPHOSARCOMAHODGKINSOTHER LYMPHOIDMULTIPLE MYELOMALEUKEMIA LYMPHOIDLEUKEMIA MYELO1DLEUKEMI MONOCYTICLEUKEMIA OTHERLEUK UNSPECIFIEDALL SITES
BANGALORE0.44.70.80.60.32.11.90.65.90.29.49.50.02.74.33.20.51,70.90.80.34.18.60.6
0,10.01.30.60.12.00.27.10.61.82.71.10.23.80.20.90.11.11.91.70.79.00.42.42.70.61.62.30.10.00.7
112.2
BOMBAY0.36.50.41.50.63.73.20.68.21.811.57.00.54.03.93.51.62.50.30.71.48.814.60.20.10.00.81.50.31.30.36.90.91.64.21.40.43.00.10.70.20.33.52.6
:
1.5l.l.3.2
U.3.6.9
0.00.20.3
130.4
REGISTRYMADRAS
0.65.30.40.90.16.31.90.66.51.0
10.216.50.12.04.51.90.31.40.10.00.65.5
11.10.20.20.00.91.00.32.20.73.61.12.83.80.90.3•1.80.00.90.10.92.03.30.93.30.61.73.30.51.51.40,20.00.3
118.5
DELHI""• 0.5
7.70.81.10.22.43.20.62.30.66.43.40.22.03.02.21.92.30.30.60.58.6
11.90.20.10.01.21.50.21.40.76.30.71.75.61.80.23.40.10.80.31.80.00.40.111.60.01.65.12.72.52.50.00.01.3
118.8
BHOPAL0.2 "13.20.51.31.08.13.80.08.42.37.73.70.01.45.52.12.62.40.00.01.62.9
14.10.40.00.00.60.80.00.70.05.60.10.60.60.70.23.20.00.30.00.01.32.80.70.00.01.50.50.31.50.70.00.00.2
106.2
BARSHI" 0~0
2.10.51.40.02.00.00.03.51.36.71.20.02.04.02.60.00.02.10.00.01.32.00.00.00.00.01.00.02.70.01.90.85.10.80.40.00.00.00.50.00.71.91.40.02.10.71.01.20.00.81.90.00.00.057.6
35
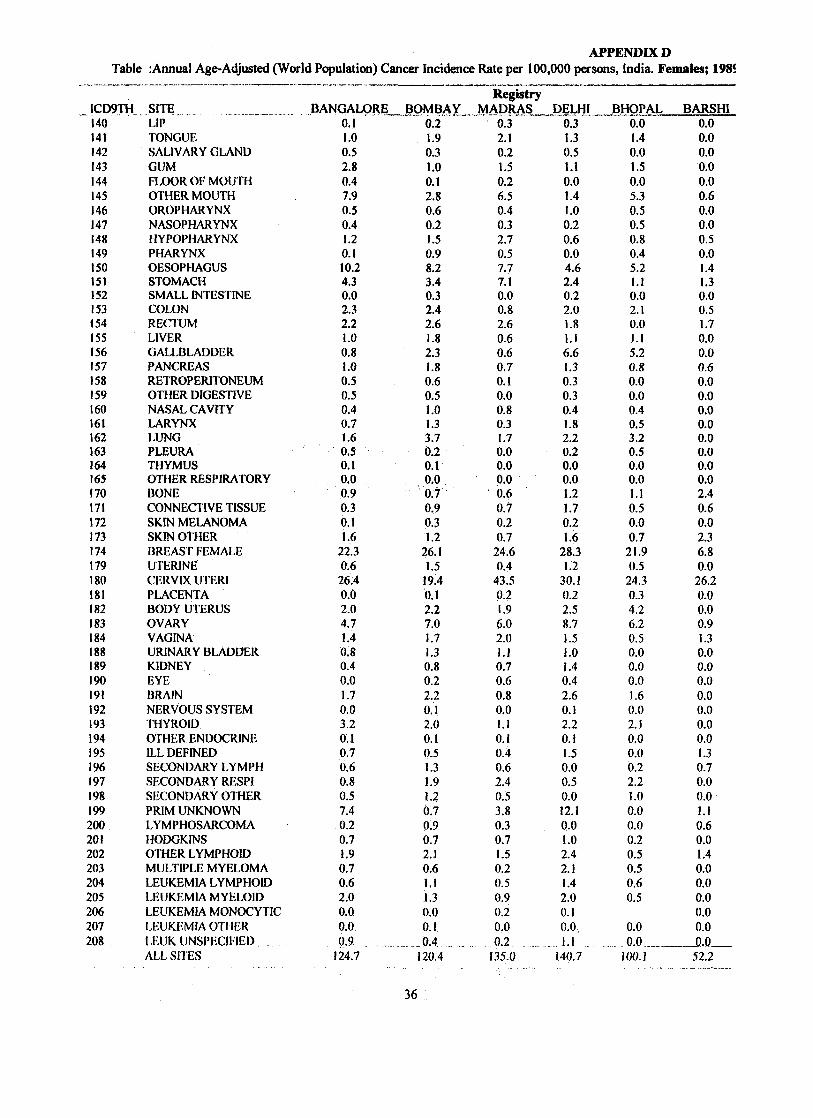
APPENDIX DTable :Annual Age-Adjusted (World Population) Cancer Incidence Rate per 100,000 persons, India. Females; 1981
ICD9TH140141142143144145146147148149150151152153154155156157158159160161162163164165170171172173174179180181182183184188189190191192193194195196197198199200201202203204205206207208
SITELIPTONGUESALIVARY GLANDGUMFLOOR OF MOUTHOTHER MOUTHOROPHARYNXNASOPHARYNXHYPOPHARYNXPHARYNXOESOPHAGUSSTOMACHSMALL INTESTINECOLONRECTUMLIVERGALLBLADDERPANCREASRETROPERITONEUMOTHER DIGESTIVENASAL CAVITYLARYNXLUNGPLEURATHYMUSOTHER RESPIRATORYBONECONNECTIVE TISSUESKIN MELANOMASKIN OTHERBREAST FEMALEUTERINECERVIX UTERIPLACENTABODY UTERUSOVARYVAGINAURINARY BLADDERKIDNEYEYEBRAINNERVOUS SYSTEMTHYROIDOTHER ENDOCRINEILL DEFINEDSECONDARY LYMPHSECONDARY RESPISECONDARY OTHERPRIM UNKNOWNLYMPHOSARCOMAHODGKINSOTHER LYMPHOIDMULTIPLE MYELOMALEUKEMIA LYMPHOIDLEUKEMIA MYELOIDLEUKEMIA MONOCYTICLEUKEMIA OTHERLEUK UNSPECIFIEDALL SITES
BANGALORE0.11.00.52.80.47.90.50.41.20.110.24.30.02.32.21.00.81.00.50.50.40.71.60.50.10.00.90.30.11.6
22.30.626.40.02.04.71.40.80.40.01.70.03.20.10.70.60.80.57.40.20.71.90.70.62.00.00.00.9 .._.
124.7
BOMBAY0.21.90.31.00.12.80.60.21.50.98.23.40.32.42.61.82.31.80.60.51.01.33.70.20.10.00.70.90.31.2
26.11.5
19.40.12.27.01.71.30.80.22.20.12.00.10.51.31.91.20.70.90.72.10.61.11.30.00.1
.0.4120.4
RegistryMADRAS
0.32.10.21.50.26.50.40.32.70.57.77.10.00.82.60.60.60.70.10.00.80.31.70.00.00.00.60.70.20.7
24.60.4
43.50.21.96.02.01.10.70.60.80.01.10.10.40.62.40.53.80.30.71.50.20.50.90.20.00.2 _
135.0
DELHI0.31.30.51.10.01.41.00.20.60.04.62.40.22.01.81.16.61.30.30.30.41.82.20.20.00.01.21.70.21.6
28.31.2
30.10.22.58.71.51.01.40.42.60.12.20.11.50.00.50.012.10.01.02.42.11.42.00.10.01.1 .
140.7
BHOPAL0.01.40.01.50.05.30.50.50.80.45.21.10.02.10.01.15.20.80.00.00.40.53.20.50.00.01.10.50.00.7
21.90.5
24.30.34.26.20.50.00.00.01.60.02.10.00.00.22.21.00.00.00.20.50.50.60.5
0.00.0
100.1
BARSHI0.00.00.00.00.00.60.00.00.50.01.41.30.00.51.70.00.00.60.00.00.00.00.00.00.00.02.40.60.02.36.80.026.20.00.00.91.30.00.00.00.00.00.00.01.30.70.00.01.10.60.01.40.00.00.00.00.00.0
52.2
36

APPENDIX E
Glossary Of Terms Used
APPENDIX F
Abbreviations
37

APPENDIX E
Cross-Sectional Study
Incidence Rate
Ionizing Radiation
Morbidity
Mortality Rate
Prevalence
Relative Risk
Sievert (Sv)
TLD
GLOSSARY OF TERMS USED
One of the observational analytical epidemiological methods toexamine relationship between disease and other variables ofinterest as they exist in a defined population at a particular time.(The other two well-known methods in this category are Cohortstudies and Case-Control studies).
The rate of occurrence of a disease within a specified period;expressed as number of cases per unit of population per unit oftime. In particular, cancer incidence rate is conventionallyexpressed per 100,000 population, per year.
Any electromagnetic or particulate radiation capable ofproducing ions, directly or indirectly, in its passage throughmatter.
1. The condition of being diseased.2. The incidence, or prevalence, of illness in a group.
Is analogous to incidence rate but refers to the occurrence ofdeath rather than the occurrence of disease and is expressed asnumber of deaths per unit of population per unit of time.
The number of cases of a disease in existence at a given timeper unit of population.
Expression of risk due to exposure, as a ratio of the risk amongthe exposed to that among those not exposed.
SI unit of radiation dose equivalent. It is equal to absorbed dosein Gray, times a quality factor, times other modifying factors.
Thermo luminescent Dosimeter.
38

APPENDIX F
ABBREVIATIONS
AERB : Atomic Energy Regulatory Board
BARC : Bhabha Atomic Research Centre, Mumbai
COCES : Corporate Committee for the Epidemiological Studies
(Constituted by NPCIL)
DAE : Department of Atomic Energy
ICRP : International Commission on Radiological Protection
NPCIL : Nuclear Power Corporation of India Limited
PISCES : Planning and Implementation Supervisory Committee for
Epidemiological Studies (Constituted by NPCIL)
STAG : Senior Technical Advisory Group (Constituted by NPCIL)
TMC : Tata Memorial Centre, MumbaiTMH : Tata Memorial Hospital, Mumbai
39

APPENDIX G
Composition of Comraittees(COCES, STAG, PISCES)
40

APPENDIX
COMPOSITION OF COMMITTEESCORPORATE COMMITTEE FOR THE EPIDEMIOLOGICAL STUDIES
(COCES) (1992-)
1. C.M.D.,NPCIL -ChairmanMr. V.K.ChaturvediDr.Y.S.R.PrasadM.D., NPCILMr. S.L. KatiMr. S.K. ChattarjeeMr. Y.S.R.Prasad
2. ED(F),NPCIL -MemberMr. C.K.KoshyMr. R.C. JoshiMr. S.B. Kulkami
3. ED(O),NPCIL -MemberMr. K. NanjundeswaranMr. C.H. SurendarMr. B.K. Bhasin
4. Director,NIOH -MemberDr. S.K. KashyapDr. H.N..Saiyed
5. Director,(HSE),BARC -MemberDr. D.V. GopinathDr. U.C. MishraDr. V. Venkat Raj
6. Director, TMC - MemberDr. P.B. DesaiDr. K.A. Dinshaw
7. Director,Bk)medical Group, BARC, Mumbai - MemberDr. C.R. BhatiaDr. P.C. KesavanDr.(Mrs) A.M. Samuel
8. Director (E & PA), NPCIL -MemberMr. B.N. JayramMr. M.L. Mittra
9. Director (Health & Safety), NPCIL - Member SecretaryDr. L.G.K. MurthyMr. G.R. SrinivasanMr. B.K.BhasinMr. S. Krishnan, ED(CPHSE)Mr. M. Das, Chief Engineer
10. Director, TMH -MemberDr. R.S. RaoDr. K.A. Dinshaw
11. Director, CRI - MemberDr. M.G. DeoDr. A.N. Bhisey
41

APPENDIX G
INVITEES TOCORPORATE COMMITTEE FOR THE EPIDEMIOLOGICAL STUDIES
(COCES) (1992-)
1. Dr. K. A. Dinshaw, Head, Radiation Oncology, TMH2. Dr. L.D. Sanghvi, Consultant, TMH3. Mr. K. Muthuswamy, CAO, TMC4. Mr. G.V. Nadkarni, Consultant E&PA, NPCIL5. Mr. B.M.L. San, Head, Health Physics Group, NPCIL6. Mr. V. Rangarajan, Director(O), NPCIL7. Dr. I.S. Bhatt, Head, EG, Directorate of E&PA, NPCIL8. Dr. S.A. Pradhan, Surgeon, TMH9. Mrs. P.N. Notani, Consultant, TMH10. Dr.B.S.Arya, Medical Officer, TAPS Hospital, Tarapur11. Dr.P.K.Sinha, Medical Supdt, KAPS Hospital, Kakrapar.12. Mr. M.R.Sachdev, Health Physicist, NPCIL13. Dr. S.K. Dave, Dy.Director, NIOH
42

APPENDIX G
SENIOR TECHNICAL ADVISORY GROUP (STAG) FOREPIDEMIOLOGICAL STUDIES (1992-95)
1. Dr. M.G. Deo, Director, CRI - Chairman2. Dr. R.S. Rao, Director, TMH - Member3. Dr. (Ms) Usha Desai, Head
Medical Division, BARC - Member4. Dr. ICC. Pillai, Head
Health Physics Division,B ARC - Member5. Dr. L.D. Sanghvi, TMH - Member6. Dr. Chattopadhyay, NIOH, Ahmedabad - Member7. Dr. D.B. Mendhekar, Medical Officer,TAPS - Member8. Dr. (Ms) K.A. Dinshaw, Head,
Radiation oncology, TMH - Member9. Dr. P.S.S. Sundar Rao
Prof, and Head, Dept. of BiostatisticsChristian Medical College, Vellore - Member
10. Dr. S.S. AgarwalProf.& Head, Dept. of GeneticsSanjay Gandhi Post GraduateInstitute of Medical Sciences, Lucknow - Member
ll.Dr.I.C.VermaProf, of PediatricsDept. of Genetics,All India Institute of Medical Sciences,Ansari Nagar, New Delhi - Member
12. Sri. B.MX. Sah, HeadHealth Physics Group, NPCIL - Member Secretary
43

APPENDIX G
RECONSTITUTED
1.2.3.
4.
5.
6.
7.
8.
9.
10.11.12.
SENIOR TECHNICAL ADVISORY GROUP (STAG) FOREPIDEMIOLOGICAL STUDIES
Dr.(Ms) K.A.Dinshaw, Director, TMHDr.A.N.Bhisey, Director, CRIDr. (Ms) Usha Desai,Dr. B.J. ShankarHead, Medical Division, BARCMr. S. KrishnamonyMr. V.K.GuptaMr. G.S. JauhriHead, Health Physics Division,BARCDr. Chattopadhyay,Dy.Director ,NIOH, AhmedabadDr. S.K.Dave, Dy.Director, NIOHDr. P.S.S. Sundar RaoDirector, Schieffelin Leprosy Researchand Training Centre, KarigiriDr. S.S. AgarwalProf.& Head, Dept. of GeneticsSanjay Gandhi Post GraduateInstitute of Medical Sciences, LucknowDr. I.C. VermaProf, of PediatricsDept. of Genetics,All India Institute of Medical Sciences,Ansari Nagar, New DelhiDr.B.S.Arya, Medical Supdt. TAPS Hospital,Tarapur <Mrs. P.N.Notani, Honorary Consultant, TMHDr.S.APradhan, Surgeon, TMHMr. B.M.L. SahMr. M.R.SachdevHealth Physics Group, NPCIL
T1996- )
ChairpersonMember
Member
MemberMember
Member
Member
Member
MemberMemberMember
Member Secretary
44
APPENDIX G
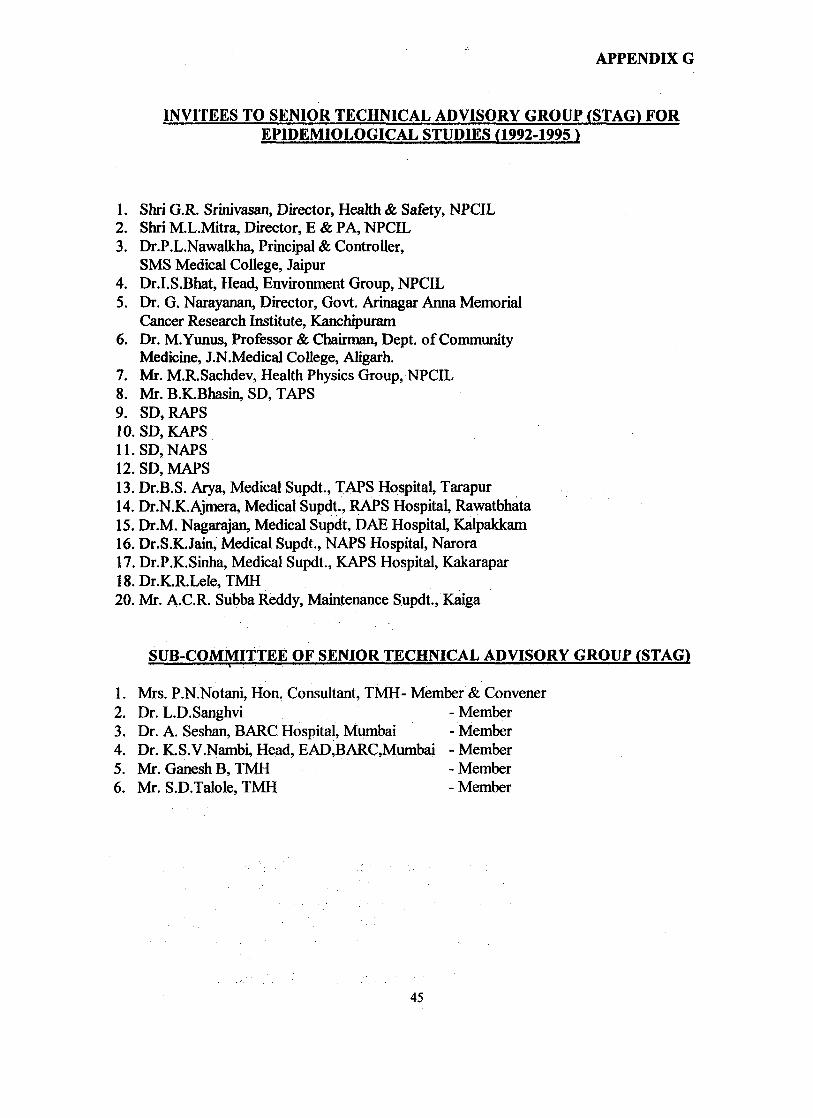
INVITEES TO SENIOR TECHNICAL ADVISORY GROUP (STAG) FOREP1DEMIOLOGICAL STUDIES (1992-1995)
1. Shri G.R. Srinivasan, Director, Health & Safety, NPCIL2. Shri MX.Mitra, Director, E & PA, NPCIL3. Dr.P.L.Nawalkha, Principal & Controller,
SMS Medical College, Jaipur4. Dr.I.S.Bhat, Head, Environment Group, NPCIL5. Dr. G. Narayanan, Director, Govt. Arinagar Anna Memorial
Cancer Research Institute, Kanchipuram6. Dr. M.Yunus, Professor & Chairman, Dept. of Community
Medicine, J.N.Medical College, Aligarh.7. Mr. M.R.Sachdev, Health Physics Group, NPCIL8. Mr. B.K.Bhasin, SD, TAPS9. SD,RAPS10. SD, KAPS11. SD, NAPS12. SD, MAPS13. Dr.B.S. Arya, Medical Supdt., TAPS Hospital, Tarapur14. Dr.N.K.Ajmera, Medical Supdt., RAPS Hospital, Rawatbhata15. Dr.M. Nagarajan, Medical Supdt, DAE Hospital, Kalpakkam16. Dr.S.KJain, Medical Supdt., NAPS Hospital, Narora17. Dr.P.K.Sinha, Medical Supdt., KAPS Hospital, Kakarapar18.Dr.K.R.Lele,TMH20. Mr. A.C.R. Subba Reddy, Maintenance Supdt., Kaiga
SUB-COMMITTEE OF SENIOR TECHNICAL ADVISORY GROUP (STAG)
1. Mrs. P.N.Notani, Hon. Consultant, TMH- Member & Convener2. Dr. L.D.Sanghvi -Member3. Dr. A. Seshan, BARC Hospital, Mumbai - Member4. Dr. K.S.V.Nambi, Head, EAD,BARC,Mumbai -Member5. Mr. GaneshB, TMH -Member6. Mr. S.D.Talole, TMH -Member
45

APPENDIX G
PLANNING AND IMPLEMENTATION SUPERVISORY COMMITTEE FOREPIDEMIOLOGICAL STUDIES (PISCES) (1992-1995)
1. Dr. R.S.Rao,Director, TMH -Chairman2. Dr.(Ms.) K.A.Dinshaw, Head,
Radiation Oncology, TMH - Member3. Dr. L.D.Sanghvi,TMH -Member -—74. Dr. S.H.Advani, Head,Medical Oncology, TMH - Member5. Dr.(Ms.) M.P.Desai,
Consulting Pediatrician, TMH - Member6. Shri. P.Vishwanathan, Head,
Health Physics Dept. TMH - Member7. Dr. A.N.Bhise, CRI -Member8. Dr. K.S.V.Nambi, Head,
Environment Assessment Division, BARC - Member9. Mrs. P.N.Notani, Epidemiologist, CRI - Member Secretary
INVITEES TO PLANNING AND IMPLEMENTATION SUPERVISORYCOMMITTEE FOR EPIDEMIOLOGICAL STUDIES (PISCES) (1992-1995)
1. Dr.S.A.Pradhan, TMH2. Dr.B.S.Vachharajani, TAPS3. Dr.S.K.Dave, Dy.Director, NIOH, Ahmedabad4. Mr.M.S.Mangralkar, TMH5. Dr.M.Bhansali, TMH6. Dr.B. Wared, TMH7. Mr.S.D.Talole, TMH
46