effects of lecture attendance, aptitude, individual heterogeneity, and pedagogic … ·...
TRANSCRIPT
University of KwaZulu-Natal
College of Law and Management Studies
School of Accounting, Economics & Finance
Effects of lecture attendance, aptitude, individual
heterogeneity, and pedagogic intervention on
student performance: a probability model approach
Phocenah Nyatanga and Sophia Mukorera
SAEF Working Paper No. 2017/02/02
January 2017
2
Effects of lecture attendance, aptitude, individual heterogeneity, and pedagogic
intervention on student performance: a probability model approach
Phocenah Nyatanga, and Sophia Mukorera
School of Accounting, Economics and Finance, University of KwaZulu Natal, South Africa.
ABSRACT
This article uses a logistic probability distribution approach to examine the effect of lecture attendance,
aptitude test results, individual heterogeneity, and pedagogic intervention on student performance (pass rates)
for first-year microeconomics and second-year macroeconomics modules at one of the leading South African
universities. The research was motivated by the throughput concerns in South African institutions of higher
education, where approximately one in four of the students enrolled complete their degrees in the minimum
regulated time. Using secondary data of 630 and 360 first- and second-year students respectively, the findings
revealed that lecture attendance, aptitude score and having received a foreign high school education have a
positive and statistically significant effect on academic performance for both modules. Male students
outperformed their female counterparts only at first-year level. Students who received intervention and those
using English at home performed better than others at second-year level. Based on these findings,
recommendations were made.
Key words: Academic performance, attendance, logistic regression, heterogeneity, pedagogic
intervention.
JEL codes A22
Biography
Phocenah Nyatanga is a lecturer of Quantitative Economics at the University of KwaZulu Natal.
Her research interest includes consumer behavior, demand analysis and international
development.
Sophia Mukorera is a lecture of Quantitative Economics at the University of KwaZulu Natal. Her
research interest is in developmental economics, specifically Entrepreneurial Activity analysis.
Corresponding author, E-mail: [email protected]
3
Introduction
Student performance and throughput are on the decline in South Africa, regardless of the vast
resources made available to the students, ostensibly to improve their performance.1 According to
the 2011/2012 annual report of the South African Council on Higher Education (CHE), only one
in four students enrolled in contact higher education institutions complete their degrees in the
minimum regulated time, 48% within five years, and 55% never graduate due to both academic
and socio-economic factors. According to the South African labor force statistics, the national
unemployment rate is estimated to be 25%, and only 5% of university graduate are unemployed,
pointing to the fact that the labor market is in need of skilled workers. Thus, the low throughput,
to a great extent, explains the shortage of a skilled workforce in the country, which is necessary
for economic growth and development. It has therefore become a national challenge to enhance
throughput and strengthen the quality of educational offerings and practices of higher education
institutions (HEIs) in South Africa. In response to this challenge, the CHE launched a quality
enhancement program in 2014, which focuses on improving teaching and learning, student
success and capacity development. The goals of the CHE will be difficult to achieve unless better
understanding of factors determining student performance, specifically in South African
universities, is established.
Using first- and second-year data of students enrolled in the principles of microeconomics
and macroeconomics modules at one of the leading universities in South Africa, the study seeks
to predict the probability of a student passing these modules, taking into account lecture
attendance, high school scholastic aptitude test (SAT) scores, individual heterogeneity, and
pedagogic intervention. The two broad research questions this study seeks to answer are; What
1 The term “throughput” in this paper refers to progression and the timely completion of degrees.

4
role do these variables play in determining whether a student passes or fails? and, what policy
recommendations can be drawn from these findings to enhance throughput? To the best of the
authors’ knowledge, this study is the first in South Africa to collectively measure the controlled
effects of these variables on student performance; hence shedding more light on the determinants
of student performance for policy making.
The rest of the article is structured as follows: the next section reviews literature; followed by
a discussion of the dataset and methodology; the paper then discusses the empirical findings, and
lastly, concluding remarks.
Literature review
Several determinants of academic achievement have been identified and received
considerable attention in scholarship. These include lecture attendance, SAT scores, English
language proficiency, individual heterogeneity, pedagogic intervention in the form of bridging
modules, quality of lectures, and socio-economic factors.2
a) Lecture attendance
Lecture attendance has been widely accepted to have a positive and statistically significant
effect on student performance. Romer (1993), Durden and Ellis (1995), Chen and Lin (2008), as
well as Horn et al (2011) found that there is a positive and statistically significant relationship
between lecture attendance and academic performance. However, recent technological
developments have changed the way the students currently learn. The recent use of eLearning at
this university to disseminate lecture notes and other learning resources before or after each
2 Due to data limitations, this study excludes from its analysis the impact of lecture quality and socio-economic
variables on academic performance and leaves this to future research.

5
lecture, without a stringent lecture attendance policy in place, seems to have created an
impression among students that nothing much is missed by not attending lectures and that they
can always catch up at their own leisure. Studies on the importance of the traditional face-to-face
lectures, in light of web-based learning resources, have come up with conflicting conclusions.
Bennett and Maniar (2007) and Gysbers et al. (2011) concluded that online delivery of lecture
notes does not only reduce lecture attendance, but also undermines performance. Williams et al.
(2012) also found that students who substituted face-to-face lectures with online lecture
recordings did not perform as well as those who attended lectures and used the online resources
as a supplementary tool. Brotherton and Abowd (2004), however, found no significant difference
in student performance between those who attended face-to-face lectures and those who relied on
online resources alone.
b) Scholastic aptitude test scores
Numerous studies, among them Park and Kerr’s (1990), Birch and Miller (2005), and Bokana
and Tewari (2014), support the argument that there is a positive correlation between SAT scores
and university academic performance. However, Vars and Bowen (1998) and Conard (2006)
found a relatively weak relationship between the two. Horn et al. (2011) also observed that,
though the SAT score is an important determinant of performance, there is no wide variation on
its effect on the probability of passing at second year.
c) Pedagogic intervention
Academic intervention has been used by universities to enable students from academically
and socially disadvantaged backgrounds with low SAT scores to achieve a higher education
qualification. Vars and Bowen (1998), as well as Smith and Edwards (2007), using first year

6
data, found such intervention to have a positive impact on the academic performance of such
students relative to the mainstream students. However, to be best of the authors’ knowledge,
little is known about the impact of such intervention on higher level modules.
d) individual heterogeneity,
The effect of gender, home language and whether one is an international or local student
on academic performance were considered. Smith and Naylor (2001), as well as McKenzie and
Schweitzer (2001), found females students to significantly outperform their male counterparts, a
contradiction to Parker’s (2006) findings that male students outperform their female
counterparts. Snowball and Boughey (2012) further found that male students perform better at
multiple-choice questions, while female students perform better at created response questions.
Van der Merwe (2006) however found no gender difference in academic performance among
economics students.
The same inconclusiveness applies to the effect of home language on academic
performance. According to Parker (1996), as well as Smith and Edwards (2007), the use of
English as a home language is positively related to academic performance. This finding was
challenged by Gee (1990), Garcia and Pearson (1994), as well as Snowball and Boughey (2012)
who found no difference in academic performance between those who use English at home and
those who use other languages, especially where a multiple choice based assessment method was
utilized.
In as far as the effect of being an international student has on academic performance is
concerned, Li et al. (2010), using data from a Chinese university, found that international
students, as well as Chinese students who had studied abroad, outperformed local students. The
7
authors attributed the international students’ success to pressure of learning success by their
families as well as superior English writing abilities. Rienties (2012), using data from five
business schools in the Netherlands, found that international students with a western ethnic
background perform better compared to those with a non-western background. However Mann et
al. (2010) found that local students outperformed their international counterparts, and attributes it
to cultural and psychological shock. Little is known about this in the African context.
Data set
This study, which is cross sectional in nature, used secondary data of all 630 first-year
students and 360 second-year students who took the principles of microeconomics and
intermediate macroeconomics modules, respectively, from February 2014 to June 2014.
a) Dependent variable
Academic performance is the dependent variable, and is categorical in nature, where 1 is
assigned to students who passed these modules with 50% and above, and 0 if they failed. For
both modules, results from three tests and a final examination, respectively accounting for 40%
and 60% to the final mark, were used as the evaluation criteria for academic performance. Data
on this variable were obtained from the university’s official student records.3
b) Independent variable
Lecture attendance for each student was randomly tracked throughout the semester. Out of
one double and two single weekly sessions, a sign in sheet was circulated randomly in one and
3 Consent to use official student records data was obtained from the registrar’s office. Students were also informed on data collected throughout the semester and their consent obtained.

8
sometimes two of the sessions (totaling thirty-two out of forty-eight lecture sessions), where
students were asked to write their student number and signature in-front of enumerators, who
would tally the signed sheets with a heard count to minimize the problem of students signing for
their absent friends. It is important to note that lecture attendance is not mandatory and there is
no penalty for not attending. To further explore the impact of attendance on performance, the
attendance variable was transformed to a five categorical variable according to a 10% increment,
with the below 50% attendance category being the reference category. This was done to
determine the minimum attendance threshold a typical student should have to pass the modules.
To capture the effect of SAT scores on academic performance, the matriculation (matric)
score was utilized. Heterogeneous variables used in this study are gender, language used at home
(mother tongue), and educational background (foreign versus local,). Data on all these variables
were obtained from the university’s official student records.
For the effect of pedagogic intervention on academic performance, the performance of
students in the mainstream program, a three year program, was compared to that of students in
the Alternative Access Program (AAP), a four year program. The AAP, unlike the mainstream,
offers students from academically disadvantaged backgrounds bridge modules and extra
academic support to be able to compete with mainstream students. Thus, the intervention
variable is categorical, with students belonging to the mainstream program being the reference
category. Table 1 summarizes these variables. Table 2 present descriptive statistics of the data
analyzed. The difference between first and second year percentages are defined by the less than
(<) and greater than (>) signs.

9
Table 1. Definition of variables analyzed
Table 2. Descriptive statistics
Note: i) The standard deviation for the class average grade at 1st and 2nd year is 16.26 and 12.36 respectively.
ii) The standard deviation for the average martric score at 1st and 2nd year is 7.76 and 10.66 respectively.
Data analysis
Taking into account that the dependent variable is categorical in nature, a logistic probability
distribution model was adopted. While other studies have used ordinary least square (OLS)
regression, this approach has been proven to be less ideal in analyzing dichotomous outcomes as
Variables Definition of variables
Performance 1 if student passed with a 50% or more, and 0 otherwise
Attendance 5 categories dummy variable
: rank1 = if student attended less than 50% of the lectures (Base Category)
: rank2 = student attended between 50 and 59% of the lectures
: rank3 = student attended between 60 and 69% of the lectures
: rank4 = student attended between 70 and 79% of the lectures
: rank5 = student attended 80% and above of the lectures
Matric Matriculation score
Language 1 if English is main language at home, and 0 if another language
Pedagogic intervention1 if student belonged to the Alternative Access Program , and 0 if student belonged
to the mainstream program
Male 1 if male, and 0 if female
Foreign 1 if student is foreign educated, and 0 if South African educated
Variables 1st
-Year Students Difference 2nd
-Year Students
Class average grade (Percentage) 53.25 < 54.26
Percentage of student with a pass mark 66.03 < 73.89
Percentage of student with aless than 50% attendance record 32.06 < 42.54
Percentage of student with a 50% attendance record 8.25 < 12.39
Percentage of student with a 60% attendance record 20.32 > 11.55
Percentage of student with a 70% attendance record 17.14 > 14.93
Percentage of student with a 80%+ attendance record 22.22 > 18.59
Average matric score 32.2 > 30.59
Percentage of students in the AAP program 2.86 < 13.23
Percentage of students who are male 45.87 > 42.53
Percentage of students who had a foreign educational background 3.97 < 9.58
Percentage of students who use English as their home language 32.7 < 33.24

10
it violates one of the OLS regression assumptions that the variance of the error is constant for all
independent variables (homoscedasticity). OLS also assumes constant marginal effects of
independent variables on the dependent variable, and nothing constrains the OLS regression
predicted probabilities to lie between 0 and 1 (Peng et al. 2002). The logit model is also
advantageous compared to other models as it is less sensitive to outliers (Copas 1988). Our
estimated conditional probability (p) of a student passing (Y), given the values of the independent
variables (Xk) is expressed in (1) as:
𝑝(𝑌 = 1|𝑋𝑘) = 𝑓(𝑎𝑡𝑡𝑒𝑛𝑑𝑎𝑛𝑐𝑒, 𝑚𝑎𝑡𝑟𝑖𝑐, 𝑚𝑎𝑙𝑒, 𝑓𝑜𝑟𝑒𝑖𝑔𝑛, 𝑙𝑎𝑛𝑔𝑢𝑎𝑔𝑒, 𝑝𝑒𝑑𝑎𝑔𝑜𝑔𝑖𝑐 𝑖𝑛𝑡𝑒𝑟𝑣𝑒𝑛𝑡𝑖𝑜𝑛) (1)
where the marginal effect of Xk on Y varies as the value of Xk increases. The logit model is based
on the cumulative logistic probability distribution and estimates the log of the odds that our
outcome of interest, passing, would occur (Y=1). This is expressed in (2) as:
𝜋 = 𝑝𝑟(𝑌 = 1|𝑋𝑘) =exp (𝛼+ 𝛽1𝑋1+𝛽2𝑋2+⋯+𝛽𝑘𝑋𝑘)
1+exp(𝛼+ 𝛽1𝑋1+𝛽2𝑋2+⋯+𝛽𝑘𝑋𝑘) (2)
where 𝜋 (0 ≤ 𝜋 ≤ 1) is the probability of the outcome of interest (passing) , α is the Y intercept,
and the βs are the slope parameter to be estimated, measuring the effect of a unit change in the
weighted log of the odds ratio of passing per unit increase in the Xs (dependent variables). Since
the logit model is non-linear, equation (3) enables us to estimate the marginal effect of a
particular predictor (Xk), on the probability that Y=1.
ln{𝑜𝑑𝑑𝑠(𝑌 = 1|𝑋𝑘)} = 100(𝑒𝛽𝑘 − 1) (3)
11
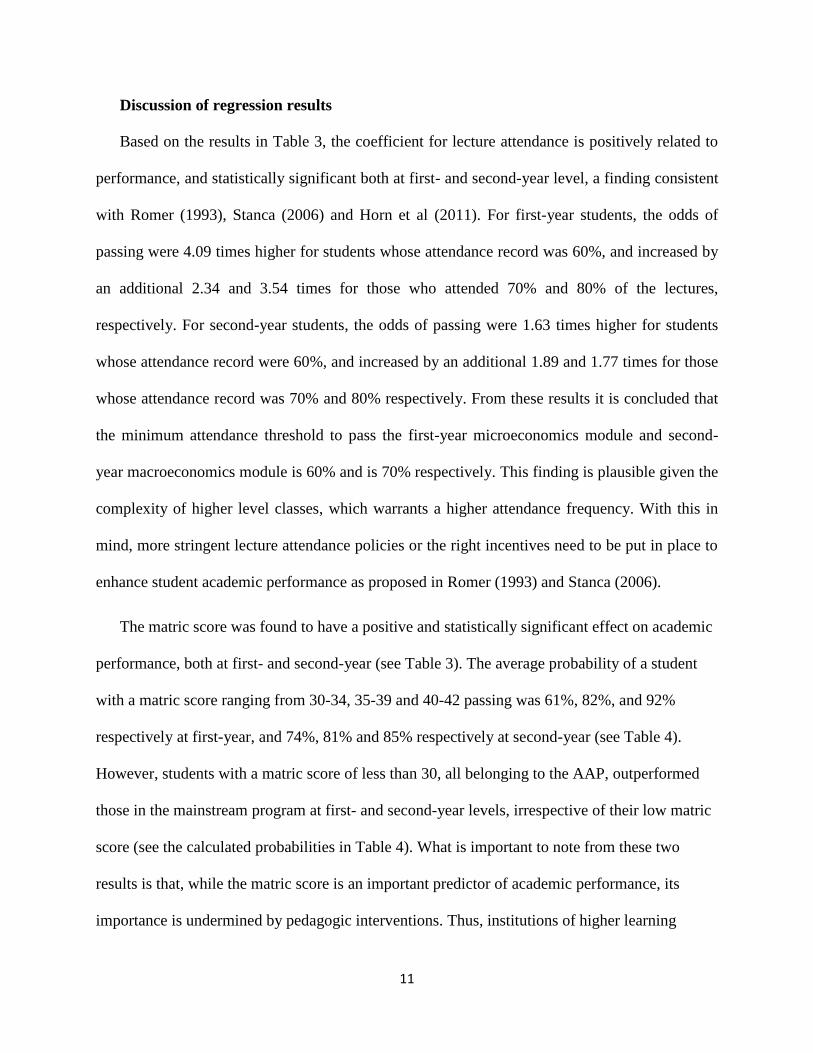
Discussion of regression results
Based on the results in Table 3, the coefficient for lecture attendance is positively related to
performance, and statistically significant both at first- and second-year level, a finding consistent
with Romer (1993), Stanca (2006) and Horn et al (2011). For first-year students, the odds of
passing were 4.09 times higher for students whose attendance record was 60%, and increased by
an additional 2.34 and 3.54 times for those who attended 70% and 80% of the lectures,
respectively. For second-year students, the odds of passing were 1.63 times higher for students
whose attendance record were 60%, and increased by an additional 1.89 and 1.77 times for those
whose attendance record was 70% and 80% respectively. From these results it is concluded that
the minimum attendance threshold to pass the first-year microeconomics module and second-
year macroeconomics module is 60% and is 70% respectively. This finding is plausible given the
complexity of higher level classes, which warrants a higher attendance frequency. With this in
mind, more stringent lecture attendance policies or the right incentives need to be put in place to
enhance student academic performance as proposed in Romer (1993) and Stanca (2006).
The matric score was found to have a positive and statistically significant effect on academic
performance, both at first- and second-year (see Table 3). The average probability of a student
with a matric score ranging from 30-34, 35-39 and 40-42 passing was 61%, 82%, and 92%
respectively at first-year, and 74%, 81% and 85% respectively at second-year (see Table 4).
However, students with a matric score of less than 30, all belonging to the AAP, outperformed
those in the mainstream program at first- and second-year levels, irrespective of their low matric
score (see the calculated probabilities in Table 4). What is important to note from these two
results is that, while the matric score is an important predictor of academic performance, its
importance is undermined by pedagogic interventions. Thus, institutions of higher learning

12
should not rely solely on SAT scores for university admission, but consider other factor in their
recruitment processes, so that society is not deprived of potentially exceptional students who
have the capacity, but less prior support, excel.
Table 3. Results of variables in the equation
Note: i) Numbers in square brackets [ ] are t ratios.
ii) ∗∗5% level of significance; ∗∗∗1% level of significance
Coefficient Odds Ratio Coefficient Odds Ratio
50% Attendance 0.167 1.18 0.069 1.07
[0.50] [0.17]
60% Attendance 1.408*** 4.09 0.487 1.63
[5.01] [1.14]
70% Attendance 0.849*** 2.34 0.639** 1.89
[3.14] [2.09]
80% Attendance 1.264*** 3.54 0.57 1.77
[4.78] [1.51]
Pedagogic intervention 0.953 2.6 1.213*** 3.36
[1.63] [2.65]
Matric 0.193*** 1.213 0.092** 1.1
[6.55] [2.46]
Male 0.406** 1.5 -0.171 0.84
[2.15] [-0.65]
Foreign 6.37*** 585.67 2.18** 8.84
[5.95] [2.19]
English language 0.257 1.293 0.645** 1.91
[1.58] [2.32]
constant -6.651*** 0.001 -2.436887 0.09
[-6.79] [-1.90]
Likelihood Ratio (LR) 125.260 27.87
Log likelihood -344.457 -188.738
Variable 1st
-Year 2nd
-Year

13
Table 4. Probability of passing
Male students outperformed their female counterparts at first-year level, but not at second-
year level (see Tables 3 and 4). This gender bias can be explained by the use of multiple-choice
questions (MCQs) in all tests and examinations at first-year level, an assessment technique found
to be more favorable to male than female students by Snowball and Boughey (2012), while at
second-year level they are a combination of multiple-choice and created response questions, also
known as ‘open–ended’ questions. On the basis of these findings, a more balanced form of
assessment, with multiple-choice and open-ended questions, may need to be considered at the
first-year level.
Students who use English as their home language outperformed those who use other
languages, especially at second-year (see Tables 3 and 4). This can be attributed to the different
forms of assessment used at first-year level (MCQs) and second-year level (both MCQs and
1st
-Year Students 2nd
-Year Students
Probability of Passing Probability of Passing
Local Student 0.632 0.703
Foreign Student 0.987 0.925
Mainstream Students 0.655 0.716
AAP Student 0.809 0.888
Female Students 0.626 0.757
Male Students 0.701 0.726
Students using English at home 0.694 0.814
Students using non-English at home 0.646 0.705
30 -34 0.61 0.74
35 -39 0.82 0.81
40 - 42 0.92 0.85
Variable
By Gender
By Home Language
By Matric Score Ranges

14
open-ended questions). The need to incorporating local languages and literacy skills in first-year
mainstream programs, and not only as stand-alone programs, has recently been advocated by
some local universities. Such a move is projected to improve understanding of the subject matter,
which in turn is believed to improve student performance and throughput. However, it is too
early to test such a hypothesis as this project is in its infant stage.
Students who received a foreign high school education performed better than students who
received a local high school education, both at first and second-year level. Based on the
calculated probabilities in Table 4, the probability of a foreign student passing was 98.7% and
92.5% at first- and second-year levels respectively, compared to 63.2% and 70.3% for a locally
educated student at first- and second-year level respectively. 4 Based on this result, it can be
inferred that, though the local high schools are producing students who meet the university
program requirements, their ability to compete with their internationally educated counterparts is
low. This inference is more plausible as it is in line with the Global Information Technology
Report (World Economic Forum, 2013), which ranked the quality of South Africa’s educational
system, as well as its quality of mathematics and science education, at number 140 and 143
respectively, out of 144 countries in the study. Going by the findings of this study as well as the
2013 Global Information Technology Report, there may be a need for the Department of
Education to take a relook at the high school curriculum with the aim of improving the quality of
South African high school graduates, so as to ensure that locally educated students are more
competitive with their international counterparts. The current quality enhancement project
launched in 2014 by the CHE, which suggests improved teacher training, could be a solution to
this problem, but this is also in its infant stages to assess its effectiveness.
4 Though the sample of foreign students is small and their socio-economic characteristics was not factored in this analysis, the
result is statistically significant and exceptional.
15
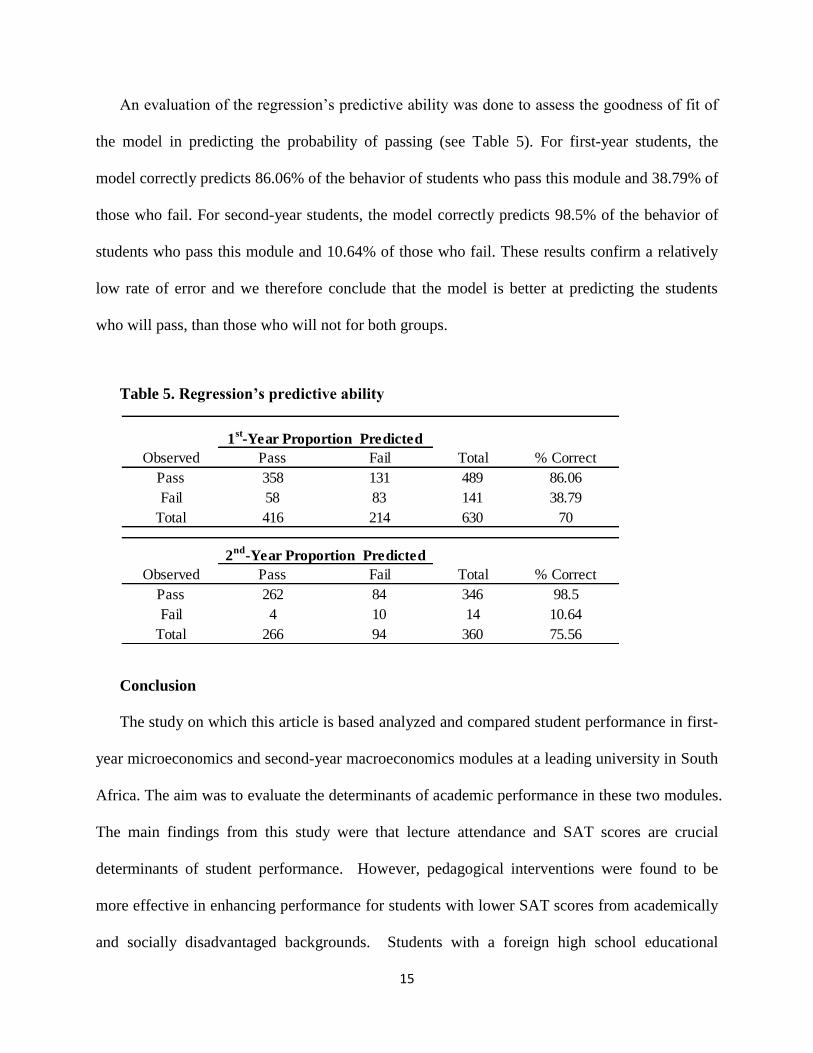
An evaluation of the regression’s predictive ability was done to assess the goodness of fit of
the model in predicting the probability of passing (see Table 5). For first-year students, the
model correctly predicts 86.06% of the behavior of students who pass this module and 38.79% of
those who fail. For second-year students, the model correctly predicts 98.5% of the behavior of
students who pass this module and 10.64% of those who fail. These results confirm a relatively
low rate of error and we therefore conclude that the model is better at predicting the students
who will pass, than those who will not for both groups.
Table 5. Regression’s predictive ability
Conclusion
The study on which this article is based analyzed and compared student performance in first-
year microeconomics and second-year macroeconomics modules at a leading university in South
Africa. The aim was to evaluate the determinants of academic performance in these two modules.
The main findings from this study were that lecture attendance and SAT scores are crucial
determinants of student performance. However, pedagogical interventions were found to be
more effective in enhancing performance for students with lower SAT scores from academically
and socially disadvantaged backgrounds. Students with a foreign high school educational
Observed Pass Fail Total % Correct
Pass 358 131 489 86.06
Fail 58 83 141 38.79
Total 416 214 630 70
Observed Pass Fail Total % Correct
Pass 262 84 346 98.5
Fail 4 10 14 10.64
Total 266 94 360 75.56
2nd
-Year Proportion Predicted
1st-Year Proportion Predicted

16
background were found to outperform those with a local one. Also, students who use English as
a home language were found to outperformance those who use other languages, especially for
higher level modules. Male gender bias on academic performance was recorded at first year level
but not at second year.
To improve on the probability of a student passing these modules and throughput, we
recommend the adoption of a compulsory attendance policy in the mainstream program of at
least 60% and 70% at first-year and second-year level respectively. Also, since pedagogical
interventions play an important role in ensuring students pass these modules, the matric score
should not be used as the sole criteria of acceptance into university. More educational
opportunities and support needs to be extended to students who are from disadvantaged
backgrounds, who do not meet the university entrance criteria, but have potential. Finally, there
is need to ensure that the quality enhancement project put in place is made a priority so that local
high schools produce students who are internationally competitive.
For future research, there is need to further interrogate the importance of local languages in
addressing throughput concerns in South African institutions of higher education, especially for
higher level modules. Further research is also needed to determine the reasons behind the
disparity in performance between students who obtained their high school qualifications locally
to those who obtained it abroad to ensure more effective policy formulation. Additional research
is also needed to ascertain whether the SAT scores and other individual characteristics, which are
statistically significant at first- and second-year, hold for higher and more complex modules.
17
References
Annual Report of the Council on Higher Education 2011/2012. 2012.
http://www.che.ac.za/sites/default/files/publications/che_ar_20121206.pdf (accessed 15 May
2014).
Bennett, E. and N. Maniar. 2007. Are videoed lectures an effective teaching tool?
http://podcastingforpp.pbworks.com/f/Bennett%20plymouth.pdf (accessed 27 November 2014).
Birch, E. R. and P.W. Miller. 2005. The determinants of students' tertiary academic success.
Business School, Economics, University of Western Australia.
Bokana, G.K. and D.D. Tewari. 2014. Determinants of student success at a South African
University: An Econometric Analysis, Anthropologist, 17 (1): 259–277.
Brotherton, J. A., and G. D. Abowd. 2004. Lessons learned from eClass: Assessing automated
capture and access in the classroom. ACM Transactions on Computer-Human Interaction -
TOCHI. 11 (2): 121–155.
Chen, J. and T. F. Lin. 2008. Class attendance and exam performance: A randomized experiment.
The Journal of Economic Education. 39 (3): 213–227.
Conard, M.A. 2006. Aptitude is not enough: How personality and behavior predict academic
performance. Journal of Research in Personality. 40(3): 339-346.

18
Copas, J. B. 1988. Binary regression models for contaminated data. Journal of the Royal
Statistical Society. Series B (Methodological). 50 (2): 225–265
Durden, G. C., and L. V. Ellis. 1995. The effects of attendance on student learning in principles
of economics. The American Economic Review. 85 (2): 343–346.
Garcia, G. and P. Pearson. 1994. Assessment and diversity. Review of Research in Education.
20: 337–391.
Gee, J. P. 1990. Social linguistics and literacies: Ideology in discourse. Basingstoke: Falmer.
Gysbers, V., J. Johnston, D. Hancock, and G. Denyer. 2011. Why do students still bother coming
to lectures, when everything is available online? International Journal of Innovation in Science
and Mathematics Education. 19 (2), 20–36.
Horn, P., A. Jansen, and D. Yu. 2011. Factors explaining the academic success of second-year
economics students: An exploratory analysis. South African Journal of Economics. 79 (2): 202–
210.
Li G., W. Chen, and J. Duanmu. 2010. Determinants of International Students' Academic
Performance: A Comparison between Chinese and Other International Students. Journal of
Studies in International Education, 14 (4): 389–405.
19
Mann, C., B. Canny, J. Lindley, and R. Rajan. 2010. The influence of language family on
academic performance in Year 1 and 2 MBBS students. Med Educ. 44 (8):786–794.
McKenzie, K. and R. Schweitzer. 2001. Who succeeds at university? Factors predicting
academic performance in first year Australian university. Higher Education Research and
Development. 20 (1): 21–31.
Park, K. H. and P. M. Kerr. 1990. Determinants of academic performance: a multinomial logit
approach. The Journal of Economics Education. 21 (2): 101–111.
Parker, K. 2006. The effect of student characteristics on achiement in introductory
microeconomics in South Africa. South African Journal of Economics. 74 (1): 137–149.
Peng, C. J., K. L. Lee, and G. Ingersoll. 2002. An introduction to logistic regression analysis and
reporting. The Journal of Educational Research. 96 (1): 3–14.
Rienties, B., S. Beausaert, T. Grohnert, S. Niemantsverdriet, and P. Kommers 2012.
Understanding academic performance of international students: the role of ethnicity, academic
and social integration. Higher Education. 63(6): 685–700.
Romer, D. 1993. Do students go to class? Should they? Journal of Economic Perspectives, 7 (2):
167–174.

20
Smith, L.C., and L. Edwards (2007). A multivariate evaluation of mainstream and academic
development courses in first-year microeconomics. South African Journal of Economics. 75(1):
99-117
Smith, J. and R. Naylor. 2001. Determinants of degree performance in UK universities: a
statistical analysis of the 1993 student cohort. Oxford Bulletin of Economics and Statistics, 6 (1):
29–60.
Snowball, J. D. and C. Boughey. 2012. Understanding student performance in a large class.
Innovations in Education and Teaching International. 49 (2): 195–205.
Stanca, L. 2006. The effects of attendance on academic performance: panel data evidence for
introductory microeconomics. The Journal of Economic Education. 37 (3): 251–266.
Van der Merwe, A.D. 2006. Identifying some constraints in first year economics teaching and
learning at a typical South African university of technology. South African Journal of Economics.
74(1), 150 – 159.
Vars, F.E. and Bowen, W.G. 1998. Scholastic aptitude test scores, race, and academic
performance in selective colleges and universities. The Black-White test score gap, pp.457–479.
21
Williams, A., E. Birch, and P. Hancock. 2012. The impact of online lecture recordings on student
performance. Australasian Journal of Education Technology. 28 (2):199–213.
World Economic Forum. 2013. Global information technology report. Osorio B.B, Dutta S. and
Lanvin B. (ed). http://www3.weforum.org/docs/WEF_GITR_Report_2013.pdf (accessed 5
December 2014)