effects of insulin on blood glucose … · effects of insulin on blood glucose entry and removal...
TRANSCRIPT

EFFECTS OF INSULIN ON BLOOD GLUCOSE ENTRY AND REMOVAL RATES IN NORMAL DOGS*
BY DORIS F. DUNN,t BERNICE FRIEDMANN, ALFRED R. MAASS, GEORGE A. REICHARD,$ AND SIDNEY WEINHOUSE
(From the Lankenau Hospital Research Institute and The Institute for Cancer Research, the Department of Chemistry, Temple University, and the Smith,
Kline and French Laboratories, Philadelphia, Pennsylvania)
(Received for publication, August 6, 1966)
Despite considerable efforts over many years, the sites and mechanisms of insulin action remain uncertain. Although almost every conceivable step in glucose catabolism has been implicated, from its initial entry into the cell to its terminal stages of oxidation, it has not yet been established which of these so called insulin effects are primary or secondary, or how closely they are related to the physiological functions of the hormone (W.
The most immediate and consistent known effect of insulin is the lower- ing of the blood sugar of the intact animal. The blood sugar of the post- absorptive animal is maintained constant by a balance between entry1 of new glucose molecules, presumably from the liver, and removal* by periph- eral tissues. When insulin lowers the blood sugar, it must do so either by stimulating removal of glucose or inhibiting its entry, or by doing both. At the time the present study was undertaken, no decisive information was available to indicate how much of the hypoglycemic action of insulin was due to either of these possible actions. In the present report we wish to describe experiments which clearly show that insulin exerts its hypogly- cemic action both by inhibiting the entry of new glucose molecules into the blood and by accelerating their removal.
*Aided by grants from the National Cancer Institute, National Institutes of Health, the United States Atomic Energy Commission, contract No. AT(39-1)777, and the American Cancer Society, recommended by the Committee on Growth of the Ns- tional Research Council. The technical assistance of Mr. Andrew Polk and Mr. Ed- ward Goodman is gratefully acknowledged.
t Present address, Sloan-Kettering Institute for Cancer Research, New York. 1 This work will be included in a thesis to be presented by George A. R&chard to
the Graduate Council of Temple University in partial fulfilment of the requirements for the degree of Doctor of Philosophy.
1 The term “entry,” as used in this paper, refers to the introduction of newly syn- thesized glucose molecules into the blood stream or such extracellular fluids aa are in rapid equilibrium therewith. No commitment is made regarding the source, but the assumption is made that the liver ia essentially the only organ which contributes glu- cose to the blood. The term “removal” refers to the glucose disappearing from the blood, again without commitment concerning the organs involved.
225
by guest on August 13, 2018
http://ww
w.jbc.org/
Dow
nloaded from

226 EFFECTS OF ISSULIN ON BLOOD GLUCOSE
The procedure used represents an extension of a familiar isotope tracer technique employed previously for studies of glucose “turnover” in normal, diabetic, and adrenalectomized rats (5-7), in normal and diabetic dogs (8, 9), and in normal and diabetic humans (10, 11). A “trace” dose of uniformly CY4-labeled glucose is injected and blood samples are removed at intervals for determination of blood sugar content and specific activity. The initial dilution of specific activity allows the calculation of the glucose pool size, and the logarithmic drop in specific activity, with time, allows the calculation of turnover rate from the first order reaction rate
R = 2,3(b/t) log &,/it (1)
where R = the turnover rate; b = the glucose level; and io and i, = the initial and final specific activities of glucose.
The departure from this conventional procedure in the present study consists in administering insulin after sufficient samples have been col- lected to calculate t,he turnover rate. It is well established that insulin injection will result in a rapid fall in the blood sugar level, followed by a variable hypoglycemic period and a slow rise to normal. If the initial fall in blood sugar arises primarily from an acceleration of removal, the specific activity will continue to fall as rapidly as before; however, if the drop is due in some part to an inhibition of entry, the specific activity will fall less rapidly, since the blood glucose will be more slowly diluted by new, un- labeled molecules. It was felt that this simple procedure could give a clear cut indication of the immediate action of insulin before it would be obscured by countereffects of other hormones. One requires only the rea- sonable assumption that any new glucose molecules entering the blood will be predominantly unlabeled.2
The principle of this procedure has already been applied by Searle and Chaikoff (12) in establishing that entry of glucose into the blood of normal dogs is completely inhibited during hyperglycemia.
The data obtained in such experiments are also amenable to quantita- tive evaluation. When the blood sugar is constant, rates of entry and re- moval are equal, and can be calculated from the fall in specific activity by using Equation 1. When the blood sugar level is changing, as during hypo- glycemia, the rates of entry and removal will be different; under these cir-
2 It isfelt that this assumption is a reasonable one. We have consistently observed a strictly linear drop in the logarithm of the specific activity of the blood glucose in the fasting dog, indicating a constant entry of unlabeled glucose. It is conceivable that some of the labeled glucose which disappears may be converted to glycogen and may subsequently reenter the blood. However, glycogen storage in the fasting animal would not be expected, and, even if this did occur, it seems likely t.hat insulin would enhance rather than reverse this process.
by guest on August 13, 2018
http://ww
w.jbc.org/
Dow
nloaded from

DUNN, FRIEDMANN, MAASS, REICHARD, WEINHOUSE 227
cumstances another set of equations, Equations 2 and 3, can be used,
Ra = (Bo - Bt) + RI (3)
where RI is the rate of entry, RP is the rate of removal, B. is the initial glucose level, Bt is the level at time t, and io and i, are the initial and final specific activities. These equations were originally applied to the calcula- tion of ketone body “turnover” rates in tissue slices (13,14). It was antic- ipated that these equations would be used for calculation of blood glucose entry and removal rates during the init,ial stages of insulin hypoglycemia when the level is changing rapidly. As it happened, during this initial hypoglycemia the entry rate, RI, was zero, thus obviating the necessity for using these equations. However, they were applied in calculating turn- over during the later stages of hypoglycemia and during recovery, so as to obtain a complete picture of entry and removal throughout the duration of hypoglycemia.
While this work was in progress, two somewhat similar investigations were published. Wrenshall (15) developed a method of computing rates of transfer of components in and out of a central body compartment such as the blood, and has applied this to a study of the action of insulin on blood glucose transfer in t,he depancreatized dog (16). With use of a method in- volving continuous intravenous infusion of glucose-CY4, Wall et al. (17) re- ported on the effects of insulin and other hormones on turnover rates of blood glucose in dogs.
Methods3
An initial 2 ml. blood sample was obtained from one of the external jugu- lar veins, and a trace dose of uniformly labeled Cl*-glucose, representing approximat,ely 1.5 to 2.0 per cent of the total body pool, was injected. Blood samples of 2 ml. each were collected at approximately 15 minute intervals for 45 to 60 minutes from the time of labeled glucose administra- tion. This represented the control period for each dog. At this time, 3 to 30 units of insulin were injected and blood samples were obtained at 5 to 10 minute intervals for the 1st hour and at 20 to 30 minute intervals thereafter for a total of approximately 4 hours. Usually sixteen to twenty
3 This procedure was originally applied to rabbits (18). To obt.ain sufficient blood at frequent intervals, it was necessary to anesthetize the animals and cannulate a fem- oral vein. Because of the hyperglycemic effects of the Ncmbutal used for anesthesia, the results were often obscured by pronounced rises in the blood sugar prior to insulin injection. In the successful experiments, however, exactly the same pattern of re- sponse was obtained as is reported in the present experiments with unanesthetized dogs.
by guest on August 13, 2018
http://ww
w.jbc.org/
Dow
nloaded from

228 EFFECTS OF INSULIN ON BLOOD GLUCOSE
samples were collected. The animals were accustomed to experiments of this type and at no time offered any resistance to venipuncture. During the length of the experiments the dogs were not restrained but were allowed to move about freely within the confines of a large hood, with access to water.
The blood samples were deproteinized by the method of Somogyi (19), and 1 to 2 ml. aliquots of the resulting protein-free filtrates were analyzed in duplicate for glucose by the anthrone method (20). The remainder of the filtrate was used for radioactivity assay.
Radioactivity Assay-The isolation of glucose carbon is based on the action of periodic acid on glucose to yield 5 molecules of formic acid and 1 of formaldehyde (21). The formic acid is oxidized to carbon dioxide by the specific action of mercuric ions in acid solution, and is recovered and counted as BaCOs. The formaldehyde may be precipitated with dimedon (22) and counted as formaldemethone. The stoichiometric nature of the reaction was established by quantitative recoveries of formic acid and form- aldehyde from standard glucose solutions, and the absence of appreciable quantities of interfering substances in the blood filtrates was established.
In the earlier experiments with rabbits (18), carbon 6 was obtained and assayed separately as formaldemethone. Since it invariably had the same activity as the formic acid derived from carbons 1 to 5, this step was omitted in subsequent experiments. However, both procedures are de- scribed.
Reage&--- 1. Periodic acid. 7 gm. of HcIOs (obtained from the G. Frederick
Smith Chemical Company, Columbus, Ohio) are dissolved in water and made up to 100 ml.
2. Standard glucose solution. Exactly 1.0 gm. of anhydrous glucose is dissolved in water and made up to 100 ml.
3. Sodium bicarbonate, 1 M.
4. Hydrochloric acid, 1 M.
5. Sodium arsenite, 1.2 M. 6. Sodium acetate, 1 M.
7. Dimedon, 80 mg. per ml. of 95 per cent ethanol. 8. Mercuric sulfate solution, 10 per cent. 73 gm. of red mercuric oxide
are dissolved in 1 liter of 4 N sulfuric acid. 9. Sulfuric acid, 50 per cent by volume. 10. Sodium hydroxide, 0.5 M COz-free. Oxidation of Glucose-5 ml. of the protein-free blood filtrate, represent-
ing 0.5 ml. of blood containing up to 100 pmoles of glucose, in a 125 ml. Erlenmeyer flask are mixed with 1 ml. of the standard glucose solution
by guest on August 13, 2018
http://ww
w.jbc.org/
Dow
nloaded from

DUNN, FRIEDMANN, MA.455, REICHARD, WEINHOUSE 229
containing 10 mg. per ml. 2 ml. of 7 per cent periodic acid solution and 2 ml. of 1 M NaHC03 solution are added, and the contents of the flask are mixed thoroughly and allowed to stand at room temperature for at least 1 hour. Excess periodate is then destroyed by addition of 3 ml. of 1 M HCl, followed by 2 ml. of 1.2 M sodium arsenite solution. The reaction mixture is then allowed to stand at room temperature until the precipitate and yellow color disappear.
Precipitation of Formaldehyde with Dimedon (Optional)-To the contents of the reaction flask are added 2 ml. of 1 M Na acetate solution and 1 ml. of dimedon solution. The flask is heated in a boiling water bath for 10 minutes, then allowed to stand at room temperature for 1 hour. The dimedon precipitate is then filtered, weighed, and counted as such. The product may be recryst,allized by dissolving in a small amount (approxi- mately 5 ml.) of acetone and reprecipitated by addition of water (m.p., 189-190”).
Oxidation of Formate-(If carbon 6 is not to be obtained as formalde- methone, this part is conducted directly on the periodate reaction mixture.) The apparatus used is similar to that described for oxidation of labeled compounds by persulfate (23). The contents of the reaction flask are washed into the persulfate flask, the volume is made up to 30 ml., and 2 ml. of 50 per cent H&04 are added. The apparatus is assembled as shown by Calvin et al. (23), and aeration with COz-free air is carried out for 10 minutes to insure removal of CO*. This is done by application of suction at the top of the bead t.ower. 10 ml. of 0.5 M COz-free h’aOH are then added to the Erlenmeyer flask attached as shown, below the bead tower, and 15 ml. of 10 per cent HgSOs are added to the formate solution. Air is then drawn through the flask and bead tower for 30 minutes while the solution is heated to boiling and allowed to reflux. The Erlenmeyer flask is disengaged, and the trapped CO2 in the bead tower is washed down into the flask with three 10 ml. portions of hot COz-free water. The carbonate is precipitated therefrom by addition of 3 ml. of 20 per cent BaClz solution, and counted by conventional procedures with a thin window Geiger tube. In the experiments reported here, all radioact.ivit,y measurements have been corrected for self-absorption to a layer of infinite thickness, and for the added carrier glucose, and are expressed as counts per minute per standard dish of 7.5 sq. cm. area. The values reported are averages of duplicate determinations which agree within 10 per cent.
The uniformly CY4-labeled glucose was obtained from the Nuclear In- strument and Chemical Corporation upon allocation by the United States Atomic Energy Commission. The insulin, free from hyperglycemic factor, was obtained through the kindness of Eli Lilly and Company.
by guest on August 13, 2018
http://ww
w.jbc.org/
Dow
nloaded from

230 EFFECTS OF INSULIN ON BLOOD GLUCOSE
Results
Fig. 1 shows the results of a typical experiment. 55 mg. (101 PC.) of glucose, with a specific activity of 1.1 X lo6 c.p.m., were injected into a male dog weighing 11.7 kilos. During the 30 minutes between injections of glucose and insulin, the blood sugar remained relatively constant be- tween 118 ‘and 127 mg. per 100 ml., while the specific activity fell from an extrapolated initial value of 12,300 to 8600 c.p.m. From the dilution of glucose specific activity, the glucose pool size is estimated to be l,lOO,- 000 X 55/12,300 = 4940 mg. From the average glucose concentration of
TIME, MIN. FIQ. 1. Time-course of blood glucose concentration; blood sugar level, broken line,
right ordinate; and specific activity, solid line, left ordinate, plotted on a logarithmic scale. The male dog (No. 74), weighing 11.7 kilos, was given 10 units of insulin 30 minutes after the dose of labeled glucose. The time of insulin administration is shown by the arrow.
122 mg. per 100 ml., we can calculate a glucose space of 4940/1.22 = 4030 ml., which is 4030/11,700 = 34 per cent of the body weight. From the drop in specific activity, the glucose turnover rate was calculated, from Equation 1, to be 1.4 mg. per 100 ml. per minute, or 4.8 mg. per kilo per minute. These values are in the range reported previously by other in- vestigators (8,9, 16).
Upon administration of 10 units of insulin, the blood sugar fell promptly. In 9 minutes it had dropped to 92 mg. per 100 ml., and in 20 minutes it reached the minimum of 64 mg. per 100 ml. During this period of maxi- mal blood sugar removal there was essentially no change in the specific activity of the blood glucose; this indicates that glucose was not entering the blood.
by guest on August 13, 2018
http://ww
w.jbc.org/
Dow
nloaded from
DUXS, FRIEDMANN, MAASS, REICHARD, WEINHOUSE 231
At the time coinciding with the “leveling off” of the blood sugar content, the specific activity resumed its downward trend, and while the blood sugar gradually rose to the normal level, its specific activity continued to drop, but at a gradually reduced rate.
$4-A :j $4-A :j I I 1 I 1 I
\ \ ’ 1 ’ 1 -i 3 - -i 3 - I I
,-: ;, ,-: ;, I I I I I I I I , ,
s-- ; ; s-- ; ; K .-----1 K .-----1 I_-----_---, I_-----_---, 9 - 9 - L- I ------ L- I ------ ----- -----
4. 4.
z z !z4 !z4 i3- C i3- C
:: : I :: : I 1 I : 1 I :
I ’ I ’
E2 E2 r-J ; r-J ; 1 1 I I I I
G G _ _ = , _ = , _ -- ----- 1 L-------- -- ----- 1 L--------
I I Ill I I I Ill I ___^----___ ___^----___
I I I I I I I I 20 20 40 60 80 100 120 140 40 60 80 100 120 140 160 180 160 180
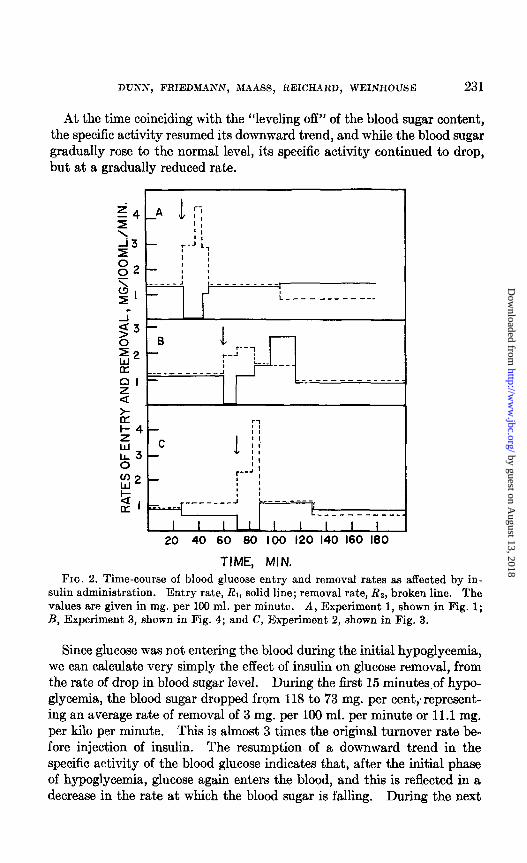
TIME, MIN. TIME, MIN. FIG. 2. Time-course of blood glucose entry and removal rates aa affected by in-
sulin administration. Entry rate, RI, solid line; removal rate, Rz, broken line. The values are given in mg. per 100 ml. per minute. A, Experiment 1, shown in Fig. 1; R, Experiment 3, shown in Fig. 4; and C, Experiment 2, shown in Fig. 3.
Since glucose was not entering the blood during the initial hypoglycemia, we can calculate very simply the effect of insulin on glucose removal, from the rate of drop in blood sugar level. During the first 15 minutes of hypo- glycemia, the blood sugar dropped from 118 to 73 mg. per cent;represent- ing an average rate of removal of 3 mg. per 100 ml. per minute or 11.1 mg. per kilo per minute. This is almost 3 times the original turnover rate be- fore injection of insulin. The resumption of a downward trend in the specific activity of the blood glucose indicates that, after the initial phase of hypoglycemia, glucose again enters the blood, and this is reflected in a decrease in the rate at which the blood sugar is falling. During the next
by guest on August 13, 2018
http://ww
w.jbc.org/
Dow
nloaded from

232 EFFECTS OF INSULIN OS BLOOD GLUCOSE
5 minutes, in which the blood sugar fell from 73 to 55 mg. per 100 ml., average rates of entry and removal were calculated from Equations 2 and 3. During the period of relative constancy in level, between 50 and 105 minutes, the blood sugar was assumed to be constant at the average value of 60 mg. per 100 ml., and “turnover” was calculated from Equation 1. During the recovery phase, from 105 to 180 minutes, Equations 2 and 3 were again used. The rates thus calculated are presented graphically in Fig. 2, A. Though they are regarded as only rough approximations, they
TIME, MIN. FIG. 3. Time-course of blood glucose concentration; blood sugar level, broken
line, right ordinate; and specific activity, solid line, left ordinate. This female dog (No. 81), weighing 11.0 kilos, was given 10 units of insulin 75 minut,es after glucose administration (denoted by arrow). The glucose pool was est,imat,ed at 4170 mg. and the glucose space at 3470 ml.
provide a clear insight into the immediate effects of insulin. The most pronounced effect is the rise in removal to twice the original rate. After 10 minutes it reached 3 times the original rate, but in 15 minutes it was back to the initial value and remained essentially constant throughout the hypoglycemia and recovery periods. The other immediate response was the complete inhibition of glucose output. This was reversed after 15 minutes and reached essentially the initial value after 20 minutes, at which it remained throughout the hypoglycemic interval. During the recovery period the entry rate was slightly higher than the removal rate; this small difference accounts for the gradual rise to normal glucose level between 105 and 180 minutes.
The data on a similar experiment with a female dog of similar weight are
by guest on August 13, 2018
http://ww
w.jbc.org/
Dow
nloaded from
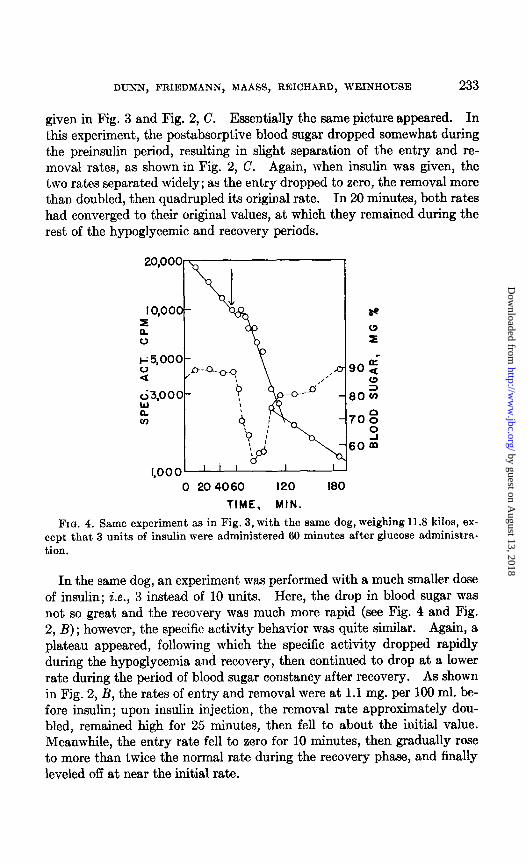
DUXN, FRIEDMANN, MAASS, REICHARD, WEINHOUSE 233
given in Fig. 3 and Fig. 2, C. Essentially the same picture appeared. In this experiment, the postabsorpt.ive blood sugar dropped somewhat during the preinsulin period, resulting in slight separation of the entry and re- moval rates, as shown in Fig. 2, C. Again, when insulin was given, the two rates separated widely; as t,he entry dropped to zero, the removal more than doubled, then quadrupled its original rate. In 20 minutes, both rates had converged to their original values, at which they remained during the rest of the hypoglycemic and recovery periods.
FIG. 4. cept that tion.
0 204060 120 180 TIME, MIN.
Same experiment aa in Fig. 3, with the same dog, weighing 11.8 kilos, ex- 3 units of insulin were administered 60 minutes after glucose administra-
In the same dog, an experiment was performed wiyith a much smaller dose of insulin; i.e., 3 instead of 10 units. Here, the drop in blood sugar was not, so great and the recovery was much more rapid (see Fig. 4 and Fig. 2, B); however, the specific activity behavior was quite similar. Again, a plateau appeared, following which the specific activity dropped rapidly during the hypoglycemia and recovery, then continued to drop at, a lower rate during the period of blood sugar constancy after recovery. As shown in Fig. 2, B, the rates of entry and removal were at 1.1 mg. per 100 ml. be- fore insulin; upon insulin injection, the removal rate approximately dou- bled, remained high for 25 minutes, then fell to about the initial value. Meanwhile, the entry rate fell to zero for 10 minutes, then gradually rose to more than twice the normal rate during the recovery phase, and finally leveled off at near the initial rate.
by guest on August 13, 2018
http://ww
w.jbc.org/
Dow
nloaded from

234 EFFECTS OF INSULIN ON BLOOD GLUCOSE
DISCUSSION
Using the technique of hepatic venous catheterization in normal and diabetic humans, Bearn, Billing, and Sherlock (24) found that insulin injection caused an immediate drop in the hepatic glucose output. The present results are in complete accord with these findings. While the work reported here was in progress, two other studies on glucose turnover in dogs appeared, which are essentially in agreement with our findings, and which also confirm and amplify the conclusions of Bearn et al. (24).
Henderson et al. (16), in experiments similar to those reported here, found that the depancreatized dog responded to insulin injection by mark- edly increasing its disappearance rate of plasma glucose, from about 5 mg. per kilo per minute to about 12 mg. per kilo per minute. At the same time t,here was a dimimuion of glucose output which, however, in contrast, with our results on normal dogs and with those of Bearn et al. in diabetic humans (24), was of minor magnitude and developed more slowly. In a report available in abstract form, Wall et al. (17) calculated plasma glucose inflow and outflow rates in dogs, using continuous intravenous infusion of glucose-C’“. They found, as we did, that insulin administration resulted in an initial decrease of inflow, but that the hypoglycemic response was primarily owing to increased outflow.
These isotope tracer studies, which clearly indicate an action of insulin in inhibiting hepatic glucose output, may be added to a growing body of information which is making it increasingly obvious that a major action of insulin is exerted on t,he liver. It is already well recognized, as a result of hepatic venous catheterization, that net hepatic glucose output is dimin- ished during hyperglycemia in dogs (25, 26) and in man (27, 28). In sub- sequent studies on glucose turnover in normal dogs with Cl4 labeling, Searle and Chaikoff (12) strikingly demonstrated that entry of glucose into the blood is completely inhibited during hyperglycemia. This observation has been confirmed in numerous as yet unpublished experiments from our laboratory.
On the other hand, the diabetic animal secretes glucose into the blood- stream during hyperglycemia. Despite the difference in blood glucose levels, the net hepatic glucose output in diabetic humans (2830) and in depancreatized dogs (26) is at least as high as in the normal counterparts. In glucose turnover studies, using Cl4 labeling, Searle et al. (8) and Feller et al. (9) found glucose turnover in depancreatized dogs to be somewhat higher than in normal ones, indicating a higher hepatic glucose output; similar observations were made in rats by Feller et al. (5) and Welt et al. (6). Henderson et al. (16) also reported values for glucose turnover in de- pancreatized dogs similar in magnitude to those reported in these previous studies and in the same range observed by us in the present study.
by guest on August 13, 2018
http://ww
w.jbc.org/
Dow
nloaded from

DUNN, FRIEDMANN, MAASS, REICHARD, WEINHOUSE 235
The fact that the diabetic animal adds glucose to the blood at hyper- glycemic levels has long been recognized by Soskin and Levine (( 1) p. 277) and is the keystone of their “overproduction theory” of diabetes. It ap- pears to us that our present observations, taken in conjunction with those of Bearn et al. (24)) Wall et al. (17)) and Henderson et al. (16)) confirm and extend these earlier findings by demonstrating that insulin does in fact act immediately t,o inhibit glucose production by liver. Since insulin exerts this action in both hyperglycemic and hypoglycemic states, it seems rea- sonable to assume t,hat the diabetic hyperglycemia is, in part at least, di- rectly due to inability of the animal lacking insulin to control hepatic glu- cose output.
It is interesting that the present study, as well as those of Henderson et al. (16) and Wall et al. (17)) also confirms what has hitherto been re- garded as an opposing theory of insulin action; namely, that it increases glucose utilization. The obvious answer seems to be that insulin does both. At present it is not entirely certain what are the relative roles of liver and peripheral tissues in the insulin-stimulated glucose utilization. Though classically the primary action has been assumed t,o be on the periph- ery, the recent reports by de Duve and his associates (31, 32) leave no doubt that the liver plays a major role in glucose utilization by the hyper- insulinized dog. Bearn et al. (24) also observed, under certain circum- st.ances, removal of glucose by liver under insulin action in humans. Thus, in at least one tissue, liver, insulin appears to cause an actual reversal in glucose flow.
An action of insulin in increasing the utilization of glucose by liver is becoming increasingly evident also from studies in vitro. The marked impairment of lipogenesis from glucose or its intermediary metabolites, such as lactate or acetate, in liver slices of the alloxan-diabetic rab, and its restoration by pretreatment of the animals with insulin (3335)) pointed to a role of glucose catabolism in fatty acid synthesis. Although a primary role of insulin was discounted, because of the necessity of pretreating for 24 hours or longer in order to observe this effect, Haft and Miller (36) re- cently reported an immediate effect of insulin on lipogenesis in the per- fused rat liver. More recently, Berthet et al. (37) clearly established an enhancement of glycogen formation from glucose-U4 in rabbit liver slices by direct addition of insulin in vitro.
At present no information is available to indicate precisely how insulin regulates the flow of glucose in and out of cells. It is becoming increas- ingly evident, from recent studies of Levine and Goldstein (3) and Park (38)) that insulin accelerates the entry of sugars into cells; the studies of Stadie (4) suggest that this occurs by way of a fixation of insulin to the cell membrane. The present study, in the light of t,he foregoing discussion,
by guest on August 13, 2018
http://ww
w.jbc.org/
Dow
nloaded from

236 EFFECTS OF INSULIN ON BLOOD GLUCOSE
suggests that such a combination of insulin with the cell membrane might also prevent the flow of glucose out of cells. Such a dual action of insulin at its site of binding to the cell membrane does not appear unreasonable, and would go far toward reconciling experimental data and theories hitherto regarded as controversial.
SUMMARY
An isotope tracer procedure was applied to determine how much of the hypoglycemic action of insulin is due to inhibition of entry and how much to stimulation of removal of blood glucose. Unanesthetized, fasting dogs were given a trace dose of glucose-CY4. Blood samples were then removed at frequent intervals before and after intravenous administration of insulin, and were assayed for glucose content and specific activity. Before insulin injection, the glucose level remained constant and its specific activity fell logarithmically, indicating a constant “turnover” of from 2 to 5 mg. per kilo per minute. Immediately after insulin, the specific activity reached a plateau and remained constant throughout the initial hypoglycemic phase lasting 10 to 20 minutes. As the blood sugar leveled and slowly rose, the specific activity resumed the downward trend. From one-fourth to one- half of the total drop in blood sugar was estimated to be due to inhibition of entry and the remainder to increased removal. It is suggested that the immediate inhibition of blood glucose entry and acceleration of removal may arise from a dual action of insulin, bound to the cell surface, in favor- ing the inward and preventing the outward flow of the sugar.
BIBLIOGRAPHY
1. Soskin, S., and Levine, R., Carbohydrate metabolism, Philadelphia (1952). 2. Thomas, C. C., in Haugaard, N., and Marsh, J. B., The action of insulin, Spring-
field (1953). 3. Levine, R., and Goldstein, M. S., Recent Progress Hormone Res., 11, 343 (1955). 4. Stadie, W. C., Physiol. Rev., 34, 52 (1954). 5. Feller, D. D., Strisower, E. H., and Chaikoff, I. L., J. Biol. Chem., 187,571 (1950). 6. Welt, I. D., Stetten, D., Jr., Ingle, D. J., and Morley, E. H., J. Biol. Chem., 197,
57 (1952). 7. Boutwell, R. K., and Chiang, R., Arch. Biochem. and Biophys., 50, 461 (1954). 8. Searle, G. L., Strisower, E. H., and Chaikoff, I. I,., Am. J. Physiol., 176, 190
(1954). 9. Feller, D. D., Chaikoff, I. I,., Strisower, E. H., and Searle, G. L., J. Biol. Chem.,
188, 865 (1951). 10. Baker, N., Shreeve, W. W., Shipley, R. A., Incefy, G. E., and Miller, M., J. Biol.
Chem., 211, 575 (1954). 11. Miller, M., Shipley, R. A., Shreeve, W. W., Baker, N., and Craig, J. W., TT.
Assn. Am. Phys., 68, 199 (1955). 12. Searle, G. L., and Chaikofi, I. L., Am. J. Physiol., 170, 456 (1952). 13. Medes, G., Floyd, N. F., and Weinhouse, S., J. Biol. Chem., 162, 1 (1946).
by guest on August 13, 2018
http://ww
w.jbc.org/
Dow
nloaded from

DUNN, FRIEDMANN, MAASS, REICHARD, WEINHOUSE 237
14. Weinhouse, S., and Millington, R. H., J. Biol. Chem., 193, 1 (1951). 15. Wrenshall, G. A., Canad. J. Biochem. and Physiol., 33, 909 (1955). 16. Henderson, M. J., Wrenshall, G. -4., and Odense, I’., Canad. J. Biochem. and
Physiol., 33, 926 (1955). 17. Wall, J. S., St.eele, R., de Bodo, It. C., and Altsauler, K., Federation Proc., 16.
196 (1956). 18. Dunn, D. F., Thesis, Temple University (1955). 19. Somogyi, M., J. Biol. Chem., 166, 69 (1945). 20. Seifter, S., Dayton, S., Novic, B., and Muntxyler, E., Arch. Biochem., 26, 191
(1956). 21. Reeves, It. E., J. Am. Chem. Sot., 63, 1476 (1941). 22. Vorliinder, D., 2. anal. Chem., 77, 241 (1929). 23. Calvin, M., Heidelberger, C., Reid, J. C., Tolbert, B. M., and Yankwich, I’. E.,
Isotopic carbon, New York, 94 (1949). 24. Bearn, A. G., Billing, B. H., and Sherlock, S., in Wolstenholme, G. E. W., Hor-
monal factors in carbohydrate metabolism, Boston (1953). 25. Soskin, S., Essex, H. E., Herrick, J. F., and Mann, F. C., Am. J. Physiol., 134,
558 (1938). 26. Crandall, 1,. A., Jr., and Lipscomb, A., Am. J. Physiol., 148, 312 (1947). 27. Bondy, P. K., Bloom, W. L., Whitner, V. S., and Farrar, U. W.! J. Clin. Invest.,
28, 1126 (1949). 28. Bearn, A. G., Billing, B. H., and Sherlock, S., Lancet, 1,698 (1951). 29. Myers, J. D., J. CZin. Invest., 29, 1421 (1950). 30. Bondy, P. K., J. Clin. Invest., 28, 1126 (1949). 31. de Duve, C., Ciba Foundation colloquia on endocrinology, London, 6, 22 (1953). 32. Bouckaert,, J. I’., and de Duve, C., Physiol. Rev., 27, 39 (1947). 33. Brady, R. O., and Gurin, S., J. Biol. Chem., 187, 589 (1950). 34. Chernick, S. S., Chaikoff, I. L., Masoro, E. J., and Isaeff, E., J. Biol. Chem., 186,
527 (1956). 35. Felts, J. M., Chaikoff, I. I,., and Osborn, M. J., J. Biol. Chem., 191, 683 (1961). 36. Haft, D. E., and Miller, L. L., Biochim. et biophys. acta, 19, 386 (1956). 37. Berthet, J., Jacques, I’., Hers, H. G., and de Duve, C., Biochim. et biophys. acta,
20, 190 (1956). 38. Park, C. R., J. C&n. Invest., 32, 593 (1953).
by guest on August 13, 2018
http://ww
w.jbc.org/
Dow
nloaded from
WeinhouseMaass, George A. Reichard and Sidney
Doris F. Dunn, Bernice Friedmann, Alfred R.RATES IN NORMAL DOGS
GLUCOSE ENTRY AND REMOVAL EFFECTS OF INSULIN ON BLOOD
1957, 225:225-238.J. Biol. Chem.
http://www.jbc.org/content/225/1/225.citation
Access the most updated version of this article at
Alerts:
When a correction for this article is posted•
When this article is cited•
to choose from all of JBC's e-mail alertsClick here
ml#ref-list-1
http://www.jbc.org/content/225/1/225.citation.full.htaccessed free atThis article cites 0 references, 0 of which can be by guest on A
ugust 13, 2018http://w
ww
.jbc.org/D
ownloaded from