effects of higher co2 and temperature on exopolymer particle...
TRANSCRIPT

fmars-05-00500 December 26, 2018 Time: 17:30 # 1
ORIGINAL RESEARCHpublished: 07 January 2019
doi: 10.3389/fmars.2018.00500
Edited by:Laura Anne Bristow,
University of Southern Denmark,Denmark
Reviewed by:Brivaela Moriceau,
UMR 6539, Laboratoire des Sciencesde l’Environnement Marin (LEMAR),
FranceDaniel Conrad Ogilvie Thornton,
Texas A&M University, United States
*Correspondence:Carolina Cisternas-Novoa
†Present address:Tiantian Tang,
State Key Laboratory of MarineEnvironmental Science, Xiamen
University, Xiamen, ChinaRoman de Jesus,
Earth Sciences Department, FullertonCollege, Fullerton, CA, United States
Specialty section:This article was submitted to
Marine Biogeochemistry,a section of the journal
Frontiers in Marine Science
Received: 06 July 2018Accepted: 12 December 2018
Published: 07 January 2019
Citation:Cisternas-Novoa C, Lee C,
Tang T, de Jesus R and Engel A(2019) Effects of Higher CO2
and Temperature on ExopolymerParticle Content and Physical
Properties of Marine Aggregates.Front. Mar. Sci. 5:500.
doi: 10.3389/fmars.2018.00500
Effects of Higher CO2 andTemperature on Exopolymer ParticleContent and Physical Properties ofMarine AggregatesCarolina Cisternas-Novoa1,2* , Cindy Lee1, Tiantian Tang1†, Roman de Jesus1† andAnja Engel2
1 School of Marine and Atmospheric Sciences, Stony Brook University, Stony Brook, NY, United States, 2 GEOMAR,Helmholtz Centre for Ocean Research Kiel, Kiel, Germany
We investigated how future ocean conditions, and specifically the interaction betweentemperature and CO2, might affect marine aggregate formation and physical properties.Initially, mesocosms filled with coastal seawater were subjected to three differenttreatments of CO2 concentration and temperature: (1) 750 ppm CO2, 16◦C, (2) 750 ppmCO2, 20◦C, and (3) 390 ppm CO2, 16◦C. Diatom-dominated phytoplankton bloomswere induced in the mesocosms by addition of nutrients. In aggregates producedin roller tanks using seawater taken from the mesocosms during different stagesof the bloom, we measured sinking velocity, size, chlorophyll a, particulate organiccarbon and nitrogen, and exopolymer particle content; excess density and mass werecalculated from the sinking velocity and size of the aggregates. As has been seen inprevious experiments, no discernable differences in overall nutrient uptake, chlorophyll-aconcentration, or exopolymer particle concentrations could be related to the acidificationtreatment in the mesocosms. In addition, in the aggregates formed during the rollertank experiments (RTEs), we observed no statistically significant differences in chemicalcomposition among the treatments during Pre-Bloom, Bloom, and Post-Bloom periods.However, physical characteristics were different and showed a synergistic effect ofwarmer temperature and higher CO2 during the Pre-Bloom period; at this time,temperature had a larger effect than CO2 on aggregate sinking velocity. In RTEs withwarmer and acidified treatment (future conditions), aggregates were larger, heavier, andsettled faster than aggregates formed at present-day or only acidified conditions. Duringthe Post-Bloom, however, aggregates formed under present and future conditions hadsimilar physical properties. In acidified tanks at ambient temperature, aggregates wereslower, smaller and less dense than those formed at the same temperature but underpresent CO2 or under warmer and acidified conditions. Thus, the sinking velocity ofaggregates formed in acidified tanks at ambient temperature was slower than the othertwo cases. Our findings point out the potential of ocean acidification and warming tomodify physical properties of sinking aggregates but also emphasize the need of futureexperiments investigating multiple environmental stressors to clarify the importance ofeach factor.
Keywords: phytoplankton aggregates, aggregate sinking velocity, mesocosm, roller tank, transparentexopolymeric particles, Coomassie stainable particles
Frontiers in Marine Science | www.frontiersin.org 1 January 2019 | Volume 5 | Article 500

fmars-05-00500 December 26, 2018 Time: 17:30 # 2
Cisternas-Novoa et al. Future Ocean Effects on Marine Aggregates
INTRODUCTION
The rise in atmospheric carbon dioxide (CO2) due toanthropogenic activities has led to increases in global temperatureand ocean acidification. CO2 has increased from 280 ppm in pre-industrial times to more than 400 ppm today. As a result of thisincrease, surface pH has decreased by 0.1 units and is expected todrop another 0.4 units by the year 2100 if the emissions continueas “business as usual” (IPCC, 2014). The ocean has absorbed onethird of the total CO2 emissions during the last century (Sabineet al., 2004). Globally, the temperature in the upper 75 m of thewater column has increased by 0.09–0.13◦C per decade between1971 and 2010 (IPCC, 2014). Elevated temperature and CO2conditions affect rates of key phytoplankton processes, such asprimary production (Rost et al., 2008; Egge et al., 2009; Engelet al., 2013), growth (Feng et al., 2008), calcification (Riebesellet al., 2000; Delille et al., 2005), nitrogen fixation (Karl et al., 2002;Rost et al., 2008), and production of extracellular material (Engel,2002; Kim et al., 2011; Engel et al., 2014).
Sinking particles, such as fecal pellets, aggregates, and othermarine detritus, are the main vehicles for vertical transportand sequestration of carbon to the deep ocean (Alldredge andJackson, 1995; Honjo et al., 2008; Turner, 2015). Aggregationof phytoplankton cells into sinking particles can be aided bythe presence of highly sticky polysaccharide-rich transparentexopolymeric particles, or TEP (Alldredge et al., 1993). Asoceanic CO2 levels rise and pH falls, calcium carbonate saturationlevels decrease (Doney et al., 2009). Lower CaCO3 saturationlevels may lower the sinking velocity of marine aggregates andthus the efficiency of export due to a decrease in the ballastcomponent (Armstrong et al., 2001; Klaas and Archer, 2002;Biermann and Engel, 2010). On the other hand, under elevatedCO2 conditions, both CO2 uptake (Riebesell et al., 2007) andDOC exudation by phytoplankton may increase (Borchard andEngel, 2012), leading to higher concentrations of TEP sincethey originate from dissolved precursors (Engel, 2002; Verdugo,2012). Higher abundances of exopolymer particles, such as TEPmight enhance aggregation and thus the particulate organiccarbon (POC) flux into the deep ocean (Arrigo, 2007; Engel et al.,2014; Bourdin et al., 2017). However, not all studies have showna direct relationship between elevated CO2 levels and higher TEPproduction (Egge et al., 2009; Passow, 2012), or between higherTEP and greater aggregation and particle sinking (Seebah et al.,2014). To date, it is still unclear how ocean acidification andwarming will affect TEP production and properties.
Another type of less studied exopolymer particles are theprotein-rich Coomassie Blue stainable particles (CSP) (Longand Azam, 1996). It has been suggested that the role of CSPin aggregate formation varies depending on the dominantphytoplankton species; they may be relatively important forcyanobacteria aggregates (Cisternas-Novoa et al., 2015), but seemto play a less important role than TEP in diatom aggregates(Prieto et al., 2002; Cisternas-Novoa et al., 2015). There are nostudies investigating how future ocean conditions may affectcharacteristics and concentrations of CSP and their role in thebiogeochemical cycling of POC and particulate nitrogen (PN).
Responses of plankton species to increases in CO2concentration (Riebesell et al., 2000, 2007; Eggers et al.,
2014; Schulz et al., 2017) and temperature (Claquin et al., 2008;Edwards Kyle et al., 2016) have been examined in numerousmanipulative experiments over the last two decades. Anincreasing number of studies have addressed the synergisticeffects of warming and acidification on phytoplanktonproduction (Borchard et al., 2011; Maugendre et al., 2015;Sommer et al., 2015; Paul et al., 2016) and on organic matterproduction (Schulz et al., 2008; Kim et al., 2011; Borchard andEngel, 2012; Chen et al., 2015). To date, the combined effect ofwarming and acidification on TEP concentration and marineaggregates has been studied only on aggregates formed fromThalassiosira weissflogii grown in batch cultures (Seebah et al.,2014).
Mesocosm experiments investigating effects of warming, oracidification and warming together, have shown an enhancedDOC: POC production ratio (Wohlers et al., 2009; Kim et al.,2011; Maugendre et al., 2017a), but how these findings relateto particle sinking and sequestration of organic carbon into thedeep ocean have only been inferred and not directly measured.Piontek et al. (2009) showed that elevated temperature increasednot only aggregation, probably due to higher TEP concentrations,but also bacterial activity and remineralization, which couldenhance carbon flux attenuation. Moreover, the effect of oceanacidification and warming on aggregation and carbon exportmay vary depending on the dominant phytoplankton groups(Eggers et al., 2014; Stange et al., 2018). Passow et al. (2014)showed that the effect of elevated CO2 on aggregation can benegligible in the absence of changes in biologically producedparticle concentration in diatom-dominated environments; onthe other hand, aggregates formed from calcifiers like Emilianiahuxleyi showed lower excess density (1ρ) in high CO2 treatmentsdue to the reduction of the ballasting mineral calcite (Biermannand Engel, 2010). Thus, the response of aggregation and exportprocesses to warming and acidification is highly variable andseems to be strongly dependent on the composition of thephytoplankton community and the concentration and propertiesof exopolymer particles.
Here, we studied the effects of ocean acidification andwarming on aggregates formed in roller tank aggregationexperiments conducted with coastal seawater where we addednutrients to induce diatom-dominated phytoplankton blooms.The phytoplankton grew in replicated mesocosms under differenttemperature and CO2 conditions, and aggregation experimentswere conducted at different stages of the bloom. We monitoredthe phytoplankton blooms in the mesocosms and measuredthe physical and chemical characteristics of the phytoplanktonaggregates formed in roller tanks, to investigate how warmingand acidification might impact aggregates formed during anatural coastal phytoplankton bloom dominated by diatoms.
MATERIALS AND METHODS
Mesocosm ExperimentsA controlled mesocosm experiment provided material for ouraggregation experiments (Figure 1). The mesocosm experimentwas conducted indoors at the Flax Pond Marine Laboratory ofStony Brook University during July 2011. Nine tanks (∼1 m3)
Frontiers in Marine Science | www.frontiersin.org 2 January 2019 | Volume 5 | Article 500

fmars-05-00500 December 26, 2018 Time: 17:30 # 3
Cisternas-Novoa et al. Future Ocean Effects on Marine Aggregates
FIGURE 1 | Experimental setup for the mesocosm (cubes) and aggregation (cylinders) experiments. There were three treatments: present CO2-cooler (PC, 380 ppmand 16◦C) in green; acidified-cooler (AC, 750 ppm and 16◦C) in blue; and acidified-warmer (AW, 750 ppm and 20◦C) in red. Water was removed from eachmesocosm four times (t1 to t4) during Pre-bloom (in yellow), Bloom (in green) and Post-bloom (in red) to start aggregation experiments. After 48 h, roller tanks thatformed aggregates were video recorded. Not all roller tanks formed aggregates; the number inside the roller tanks represent the number of aggregates analyzed inthe captured video, and roller tanks that did not form aggregates are marked with an “x”.
were filled simultaneously with seawater from Stony BrookHarbor, NY, United States, that was collected at approximately3 m depth using a submersible pump; water was collected duringthe day at high tide several days after a large storm (Salinity 29).The water was filtered through a 200-µm size mesh to removelarge detritus and zooplankton before filling the tanks. Threetreatments of variable CO2 and temperature where performedin triplicate: (1) acidified-cooler (AC, 750 ppm CO2, 16◦C), (2)acidified-warmer (AW, 750 ppm CO2, 20◦C), and (3) presentCO2-cooler (PC, 390 ppm CO2, 16◦C). The triplicate mesocosms
were designated A, B, and C (e.g., AC-A, AC-B, AC-C) (Figure 1).As a light source, pairs of fluorescent lights (F40T12, fullspectrum) were suspended above each tank, providing a surfaceirradiance of 190 µmol photons m−2 s−1 with a light: dark cycleof 14:10. Irradiance was set at the beginning the experimentwith a LICOR Model LI-2100 light meter. All mesocosms wereslowly stirred by mechanically-controlled paddles located in themiddle of the mesocosm. The desired future CO2 concentration(750 ppm) was achieved by initial addition of approximately5 L of high-CO2 seawater (pH 4.8) previously filtered through
Frontiers in Marine Science | www.frontiersin.org 3 January 2019 | Volume 5 | Article 500

fmars-05-00500 December 26, 2018 Time: 17:30 # 4
Cisternas-Novoa et al. Future Ocean Effects on Marine Aggregates
0.2 µm filters, rather than by bubbling with CO2, which risksformation of exopolymer particles. The pH corresponding to750 ppm was calculated using the program CO2SYS (Lewiset al., 1998); total alkalinity (TA) was measured at the beginningof each experiment to calculate the pH corresponding to thedesired CO2 concentration (Supplementary Table S1). The pHwas monitored once a day to determine the amount of high-CO2 seawater to add (between 1 and 2 L every 24 h) to maintainthe desired CO2 concentration. We added the high CO2 waterand monitored the pH simultaneously until the target pH wasachieved. The high CO2 water was added to the center of themesocosm and was quickly homogenized (<10 min) with thehelp of the mechanically controlled paddles. Room temperaturewas held relatively constant at 20 ± 1◦C; the tanks at 16◦C werecooled by circulating cold water (4◦C) through silicone tubesinstalled inside the tanks. We controlled the temperature gradientby adjusting the length of the silicon tube inside the mesocosm.The cooling system and the amount of high CO2 seawater neededdaily to maintain the temperature and pH at desired values weredetermined during the 5 days of stabilization before samplingcommenced.
The pH and temperature were measured at least once a dayin the mesocosm tanks using YSI Pro 1030 waterproof handheldmeters and standard DIN/NBS buffers (PL 4, PL 7, and PL 9)recalibrated using Tris-based reference material provided byA. Dickson (Nemzer and Dickson, 2005). TA was measured bytitration (Gran, 1952) with 0.1N HCl using a Gilmont micrometerburette and an Orion model 370 pH meter. Salinity was measuredwith a hand-held refractometer when the mesocosm tanks werefirst filled.
Conditions during the mesocosm experiments are shownin the Supplementary Material and summarized here briefly.Temperature and pH were monitored daily throughoutthe experiments (Supplementary Figure S1), and clearlyshow that the desired differences in pH and temperaturewere achieved. For acidified tanks, the target pH (7.7)corresponding to 750 ppm CO2 was calculated using themeasured initial values of temperature (16.8 ± 0.8 and 18.3◦Cfor AC and AW, respectively), and TA (1786.7 ± 46.2 and1840.0 ± 40.0 µmol kg−1) (Supplementary Table S1). After5 days of stabilization, the desired temperature and pH inthe mesocosm tanks were achieved; PC: pH 8.1 ± 0.1 and16.1 ± 0.5◦C; AC: pH 7.79 ± 0.10 and 16.2 ± 0.4◦C, and AW:pH 7.8 ± 0.10 and 20.1 ± 0.4◦C (Supplementary Figure S1).Nutrients were added on day five (final concentration: 20 µMnitrate, 20 µM silicate, and 1.5 µM phosphate) to initiate aphytoplankton bloom; the phytoplankton bloom started quickly24 h after the nutrients were added as seen by the immediateincrease in Chl a on day 7 (Supplementary Figure S2). Thebloom was monitored for 21 days; during this period themesocosm tanks were sampled six times, and four roller tankaggregation experiments were conducted to study aggregates atdifferent stages of the phytoplankton bloom (days 10, 13, 16, and19, Figure 1). The bloom stages were not reached at the sametime in all mesocosms (Figure 2 and Supplementary Table S2).The “Bloom Peak” of each tank is defined as the sampling pointwhen the Chl-a concentration was the highest; the sampling
points before the Bloom Peak are called “Pre-Bloom” and thoseafter the Bloom Peak are called “Post-Bloom” (SupplementaryTable S2).
Biological and Chemical AnalysesNutrient samples were filtered through 0.2-µm syringe filtersand stored in the refrigerator (4◦C) until analysis (no longerthan 2 weeks). Measurements of nitrate, phosphate and silicatewere made at the SoMAS Analytical Laboratory using a LachatInstruments QuickChem FIA5000 autoanalyzer and the standardspectrophotometric methods described by Parsons et al. (1984).Detection limits were 0.3 µM for nitrate, 0.2 µM for phosphate,and 0.1 µM for silicate.
The phytoplankton composition in each mesocosm wasexamined with a portable FlowCAM system (Fluid Imaging,Inc.). The FlowCAM enables measurement and imaging ofmicroscopic particles in two dimensions using a regularmicroscope objective lens as the particles pass through a glasschamber in a continuous flow (Sieracki et al., 1998). TheFlowCAM automatically counts, sizes, and obtains individualpictures of each particle. All the measurements in this study weremade using the automatic imaging mode and an objective lensof 10X, leading to an overall magnification of 100X. A 300-µm-deep flow cell allowed measurement of particle size between 2and 300 µm. A sample volume of 0.5 mL was analyzed, with aflow rate between 0.1 and 0.4 mL min−1 and a camera rate of 7.0frames s−1. Between samples, the system was flushed with Milli-Q water for 5 to 10 min at a flow rate of 0.5 mL min−1, and avisual inspection of the flow cell was performed between samplesto ensure cleanliness. During each run, samples were gentlymixed with a small stirring bar to prevent particle sedimentation,and were pumped through the flow cell using a peristaltic pump.Samples were diluted with 0.2 µm filtered artificial seawater whenneeded. Results were analyzed using Visual Spreadsheet Softwareversion 3.1.10 (Fluid Imaging, Inc.).
Total particulate carbon (TPC) and PN content werequantified at the SoMAS Analytical Laboratory using aCarlo Erba EA-1112 CNS analyzer (uncertainty ± 2% for Cand ± 5% for N analysis). Duplicate samples of 20–50 mLwere filtered onto combusted GF/F filters. PIC was not removedbecause preliminary analysis showed negligible differences incarbon between HCl-treated and non-treated samples. Themesocosm experiments were dominated by diatoms, with aminimal presence of calcifiers. Concentrations of chlorophylla (Chl a) were determined using high-performance liquidchromatography (HPLC) (Mantoura and Llewellyn, 1983;Bidigare et al., 1985), as a proxy for phytoplankton. Briefly, 20to 50-mL samples were filtered onto combusted GF/F filtersin duplicate and frozen until analysis. Pigments were extractedfrom filters and analyzed as described in Sun et al. (1991). TEPand CSP were analyzed spectrophotometrically after stainingwith a solution of 0.02% AB (Alcian Blue 8X, Sigma Aldrich)at pH 2.5 and a solution of 0.04% CBB (Coomassie BrilliantBlue G-250, SERVA electrophoresis) at pH 7.4, according toPassow and Alldredge (1995a) and Cisternas-Novoa et al. (2014),respectively. Blanks were prepared from Milli-Q water or 0.2-µmfiltered seawater (FSW) for each set of samples. Concentrations
Frontiers in Marine Science | www.frontiersin.org 4 January 2019 | Volume 5 | Article 500
fmars-05-00500 December 26, 2018 Time: 17:30 # 5
Cisternas-Novoa et al. Future Ocean Effects on Marine Aggregates
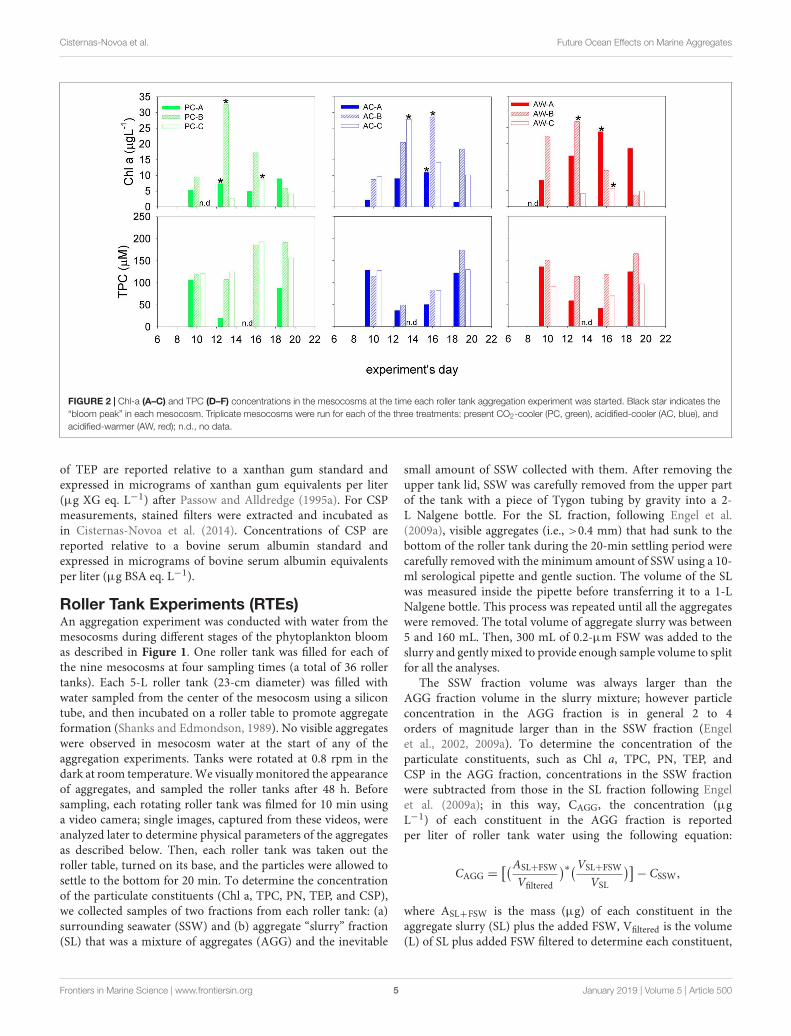
FIGURE 2 | Chl-a (A–C) and TPC (D–F) concentrations in the mesocosms at the time each roller tank aggregation experiment was started. Black star indicates the“bloom peak” in each mesocosm. Triplicate mesocosms were run for each of the three treatments: present CO2-cooler (PC, green), acidified-cooler (AC, blue), andacidified-warmer (AW, red); n.d., no data.
of TEP are reported relative to a xanthan gum standard andexpressed in micrograms of xanthan gum equivalents per liter(µg XG eq. L−1) after Passow and Alldredge (1995a). For CSPmeasurements, stained filters were extracted and incubated asin Cisternas-Novoa et al. (2014). Concentrations of CSP arereported relative to a bovine serum albumin standard andexpressed in micrograms of bovine serum albumin equivalentsper liter (µg BSA eq. L−1).
Roller Tank Experiments (RTEs)An aggregation experiment was conducted with water from themesocosms during different stages of the phytoplankton bloomas described in Figure 1. One roller tank was filled for each ofthe nine mesocosms at four sampling times (a total of 36 rollertanks). Each 5-L roller tank (23-cm diameter) was filled withwater sampled from the center of the mesocosm using a silicontube, and then incubated on a roller table to promote aggregateformation (Shanks and Edmondson, 1989). No visible aggregateswere observed in mesocosm water at the start of any of theaggregation experiments. Tanks were rotated at 0.8 rpm in thedark at room temperature. We visually monitored the appearanceof aggregates, and sampled the roller tanks after 48 h. Beforesampling, each rotating roller tank was filmed for 10 min usinga video camera; single images, captured from these videos, wereanalyzed later to determine physical parameters of the aggregatesas described below. Then, each roller tank was taken out theroller table, turned on its base, and the particles were allowed tosettle to the bottom for 20 min. To determine the concentrationof the particulate constituents (Chl a, TPC, PN, TEP, and CSP),we collected samples of two fractions from each roller tank: (a)surrounding seawater (SSW) and (b) aggregate “slurry” fraction(SL) that was a mixture of aggregates (AGG) and the inevitable
small amount of SSW collected with them. After removing theupper tank lid, SSW was carefully removed from the upper partof the tank with a piece of Tygon tubing by gravity into a 2-L Nalgene bottle. For the SL fraction, following Engel et al.(2009a), visible aggregates (i.e., >0.4 mm) that had sunk to thebottom of the roller tank during the 20-min settling period werecarefully removed with the minimum amount of SSW using a 10-ml serological pipette and gentle suction. The volume of the SLwas measured inside the pipette before transferring it to a 1-LNalgene bottle. This process was repeated until all the aggregateswere removed. The total volume of aggregate slurry was between5 and 160 mL. Then, 300 mL of 0.2-µm FSW was added to theslurry and gently mixed to provide enough sample volume to splitfor all the analyses.
The SSW fraction volume was always larger than theAGG fraction volume in the slurry mixture; however particleconcentration in the AGG fraction is in general 2 to 4orders of magnitude larger than in the SSW fraction (Engelet al., 2002, 2009a). To determine the concentration of theparticulate constituents, such as Chl a, TPC, PN, TEP, andCSP in the AGG fraction, concentrations in the SSW fractionwere subtracted from those in the SL fraction following Engelet al. (2009a); in this way, CAGG, the concentration (µgL−1) of each constituent in the AGG fraction is reportedper liter of roller tank water using the following equation:
CAGG =[(ASL+FSW
Vfiltered
)∗(VSL+FSW
VSL
)]− CSSW,
where ASL+FSW is the mass (µg) of each constituent in theaggregate slurry (SL) plus the added FSW, Vfiltered is the volume(L) of SL plus added FSW filtered to determine each constituent,
Frontiers in Marine Science | www.frontiersin.org 5 January 2019 | Volume 5 | Article 500

fmars-05-00500 December 26, 2018 Time: 17:30 # 6
Cisternas-Novoa et al. Future Ocean Effects on Marine Aggregates
VSL+FSW is the total volume (L) of SL plus the added FSW,VSL is the is the total volume (L) of the SL, and CSSW isthe concentration (µg L−1) of each constituent in the SSWfraction.
Determination of Aggregate Size (ESD),Sinking Velocity (U), Excess Density (1ρ),and MassDetermination of sinking velocity and aggregate size usingrolling tanks is non-invasive and does not require isolation ormanipulation of the aggregates, making this method suitable tostudy fragile marine aggregates. Rolling tank studies do haveissues related to the extrapolation and comparison of aggregatesformed in a closed system versus those naturally occurred inthe ocean (Engel and Schartau, 1999; Jackson, 2015). However,this approach is appropriate to investigate relative differences insinking velocity under different treatments, such as the presentstudy. There are several methods used to estimate sinking velocityusing rolling tanks (Engel and Schartau, 1999; Ploug et al., 2010;Jackson, 2015). In this study we measured sinking velocity andaggregate size using the two-point method proposed by Engeland Schartau (1999). This method is based on analysis of imagescaptured from a video recording of the aggregates. Then, 1ρ
was derived from the sinking velocity measurements (Engel andSchartau, 1999). This method was preferred for practical andtechnical considerations. At the time of our experiment thismethod had been successfully used in previous studies (Engelet al., 2009b; Biermann and Engel, 2010); moreover, it allowsthe determination of sinking velocity and size of aggregates evenwhen they are smaller than 0.5 mm. The equivalent sphericaldiameter (ESD) of aggregates measured in this study rangedbetween 0.39 and 9.16 mm. The relatively small size of aggregatesat the lower limit of the size range combined with technical issueslike the presence of visible scratches in some of our roller tanksrequired that the magnification needed for the observation andimaging was, in most cases, too high to include the whole orbit ofthe cylinder tank, a requirement to use the method of Ploug et al.(2010). To achieve accurate measurements, we chose to imageonly aggregates in the front of the roller tank, therefore ensuringthat the aggregates were in focus.
The size of aggregates and their sinking velocity within theroller tanks were determined from pictures captured from thevideo recording of aggregates in the roller tank. After rotatingfor 48 h in the dark, tanks were recorded for 10 min with aSony CCD-TRV338 Hi8 Handycam camcorder (3.2 megapixels).Since the aggregates formed in each roller tank were different innumber, size and compactness, the roller tanks were recordedat the optimal magnification, and the optical resolution of eachvideo was calibrated individually. The observation window variedbetween 3.5 and 8.0 cm in width and between 2.3 and 5.3 cmin height, and was always located in the horizontal axis thatintersected the center of the tank. Single pictures were capturedfrom the video and analyzed as in Engel and Schartau (1999) andEngel et al. (2009b). Images were captured with the software “FreeVideo to JPG Converter” (DVD Video Soft Limited). Between10 and 20 randomly-chosen aggregates from each roller tank
were analyzed (when there were less than 10 aggregates in theroller tank, the maximum possible number was analyzed). Toensure the accuracy of the calculation of the vertical velocitycomponent of the fluid, we only analyzed aggregates in theircircular trajectory i.e., the displacement in the horizontal planewas 5% or smaller than displacement in the vertical plane,for more details about the method to determine the sinkingvelocity of an aggregate inside a roller tank, please see Engeland Schartau (1999). Aggregate parameters such as area, lengthof the major axis, length of the minor axis, the x-feret diameterand position in the x–y plane, were measured semi-automaticallyusing public domain ImageJ software, and were used to estimateaggregate dimensions and settling velocity. The visible volume(V), ESD, and the area of the aggregates perpendicular to the falldirection were calculated. The aggregate sinking velocity (U) wasdetermined from its apparent velocity, which can be estimatedfrom the vertical displacement of the aggregate with time. Theexcess density of individual aggregates (1ρ) was calculated fromtheir sinking velocity and size using the equation presentedin Iversen and Ploug (2010). Aggregate mass was determinedby multiplying 1ρ times the aggregate volume (V) and fittingthe data to a power curve. The median U, ESD, and 1ρ ofthe measured aggregates were calculated for each roller tankor treatment at different stages of the phytoplankton bloom.The median of those parameters was also compared to thebiogeochemical particulate components of aggregates (TPC, PN,TEP, CSP, and Chl a) that were measured on the bulk aggregatefraction as described above.
Statistical AnalysisThe linear correlation between any two physical andbiogeochemical characteristics of the aggregates was evaluatedusing the Spearman’s coefficient (r). Statistical significancewas accepted for p < 0.05. Multivariate analyses of variance(MANOVA), based on aggregate sinking velocity and physicalproperties (ESD, mass, and 1ρ), were used to evaluate whetherthese properties were significantly different in aggregates formedunder different CO2 and temperature conditions. In addition,the influence of the treatments on each physical parameter (U,ESD, mass, and 1ρ) of the aggregates was tested by Kruskal–Wallis tests, followed by multiple comparison analyses for eachparameter mean (ESD, U, 1ρ, and mass) to determine whetherthe medians of those parameters were significantly different forany pair of treatments. Power law curves fit to the data wereused to determine the relationship between aggregate physicalproperties (U and ESD). An r2 and p-value was calculated as ameasure of goodness and significance, respectively, of the curvefit. All the calculations and statistical tests were run using MatLabR2014a.
RESULTS
Mesocosm Experiment and StartingConditions for Aggregation ExperimentsThe Bloom intensity was variable and the Bloom Peak wasreached at different times in each mesocosm (Figure 2A).
Frontiers in Marine Science | www.frontiersin.org 6 January 2019 | Volume 5 | Article 500

fmars-05-00500 December 26, 2018 Time: 17:30 # 7
Cisternas-Novoa et al. Future Ocean Effects on Marine Aggregates
Diatoms dominated the phytoplankton community in all themesocosms; qualitative analysis of FlowCAM data revealed thatthe phytoplankton blooms were mainly composed of smallcentric diatoms and larger chain-forming diatoms such asNitzschia closterium, Ditylum brightwellii, Eucampia zodiacus,Leptocylindrus sp., and Pseudo-nitzschia sp.
Although the Bloom Peak was reached at different times ineach mesocosm, we observed no measurable difference in thetime, magnitude, or phytoplankton composition of the bloomthat could be attributed to the acidification and/or temperaturetreatments. The concentration of the biogeochemical parameters(TPC, PN, Chl a, TEP, CSP, and nutrients) were alsonot significantly different among treatments (SupplementaryFigures S2, S4, S5).
Particle concentrations measured in the mesocosmexperiments were considered to be starting conditions forthe aggregation experiments. Chl a varied between 1.5 and33 µ L−1 (Figure 2) and the maximum concentrations were att2 and t3. TPC concentrations ranged between 20 and 193 µM,and were relatively higher during t1 and t4 in treatments ACand AW, but increased from t1 to t4 in treatment PC (Figure 2).Highest concentrations of exopolymeric particles normalized toTPC were measured during the bloom peak and coincided withthe Chl-a maximum (t2 and t3).
Aggregate FormationNo visible (>0.4 mm) particles were observed when theroller tanks were initially filled with seawater taken from themesocosms at any stage of the phytoplankton bloom. Aggregatesdid not form in every roller tank experiment (RTE). Three rollertanks (t1 AC-B, t4 PC-B, and t4 AC-B) did form aggregates,but due to their small size and problems with the rollertanks, we only analyzed the concentration of the particulateconstituents in the SL fraction and not the physical parameters(ESD and U; Figure 1). However, we did measure physicalproperties in aggregates that formed in seven roller tanks beforethe Bloom Peak, five during the Bloom Peak and six afterthe Bloom Peak (Supplementary Table S3). No aggregatesformed in any of the PC-A and AW-C RTEs. There was nosignificant correlation between aggregate formation and theCO2/temperature treatment of the mesocosm tanks. Consideringall treatments and bloom times, there was a correlation betweenaggregate formation (as the volume of aggregate slurry) in theRTE and the concentration of TPC (r = 0.36, p < 0.05), PN(r = 0.60, p < 0.001), TEP (r = 0.49, p < 0.01), and CSP (r = 0.60,p < 0.0001) in the mesocosm at the starting time of the RTE.The volume of aggregate slurry fraction collected in each rollertank and the number of aggregates analyzed for determination ofphysical properties are shown in Supplementary Table S3.
Aggregate CompositionWe did not observe statistically significant differences inaggregate composition among different CO2 or temperaturetreatments. However, the chemical composition of aggregateschanged during the course of the experiment, and thosechanges were not equally evident or statistically significant inall treatments. All aggregates were enriched in exopolymer
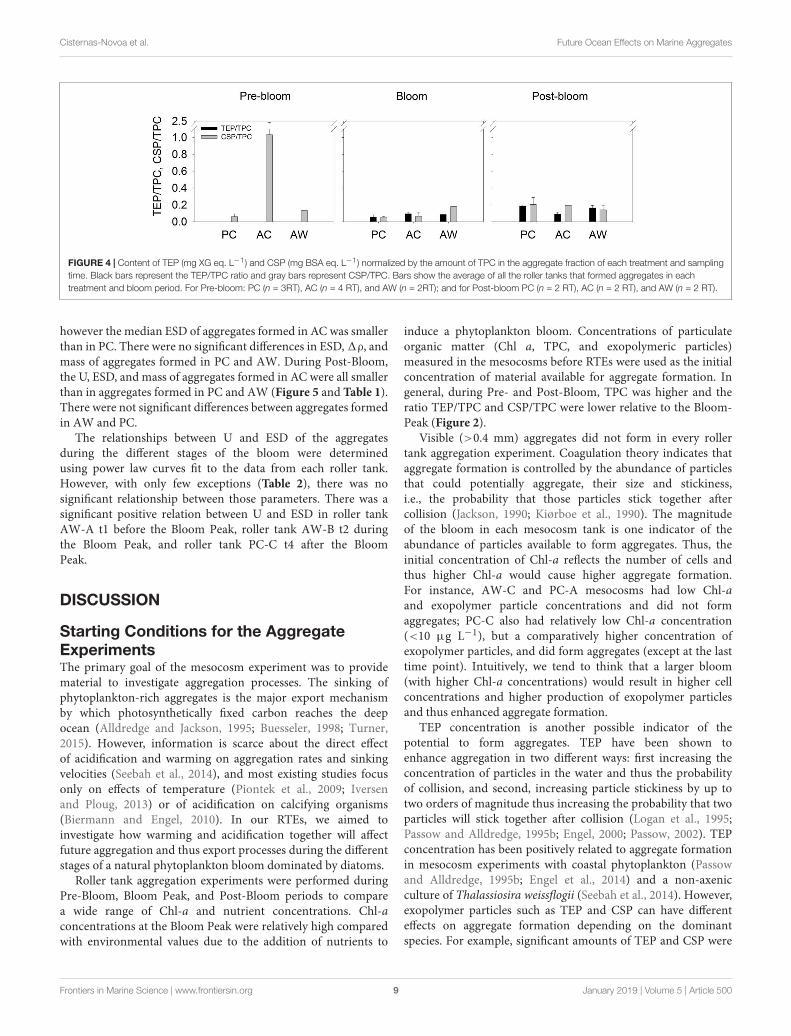
particles (TEP and CSP), TPC, PN, and Chl a relative tothe SSW and independently of the treatment or bloom time(Figure 3). Exopolymer particle contents of aggregates increasedwith bloom stage in the PC (TEP: r = 0.78, p < 0.05 andCSP: r = 0.86, p < 0.05) and AW (TEP: r = 0.75, p = 0.13)treatments. No significant difference in the Chl a, TPC, or PNcontent of the aggregates was observed at different bloom stages.Exopolymer particles normalized to TPC concentration showedthat TEP/TPC and CSP/TPC ratios appeared to be particularlyhigher in aggregates formed in AC treatment during Pre-Bloom(Figure 4), but those differences were not statistically significant.If we consider the composition of all aggregate fractions together,independent of treatment or bloom time, there was a positivecorrelation between TEP and CSP content (r = 0.62, p < 0.05,Supplementary Table S4). The concentrations of TEP and CSPincreased with bloom stage (r = 0.60, p < 0.05, and r = 0.63,p < 0.01, respectively), and CSP was positively correlated withTPC (r = 0.80, p < 0.001) and PN (r = 0.57, p < 0.01).
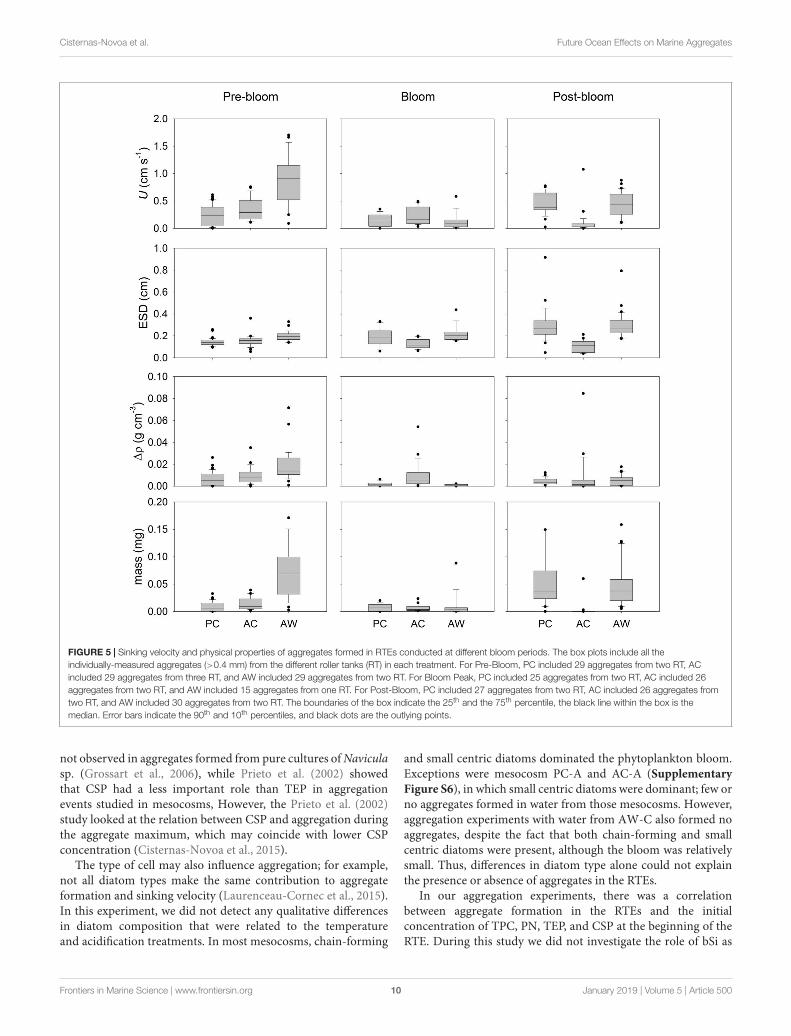
Aggregate Size (ESD), Sinking Velocity(U), Excess Density (1ρ), and MassConsidering all the aggregates formed in the four aggregationexperiments together, independently of treatment, we observedthat the ESD, U, and 1ρ changed throughout the bloomdevelopment. The ESD of aggregates formed in roller tanksat different bloom stages ranged between 0.04 and 0.92 cm(Figure 5). Smaller aggregates (0.06 to 0.18 cm) were observedduring Pre-Bloom (median: 0.16 cm) and Bloom Peak (median:0.17 cm); after the Bloom Peak the maximum ESD of aggregatesin each tank was larger (median: 0.34 cm). Sinking velocity, U,ranged between 0 and 1.7 cm s−1 (Figure 5) and opposite towhat might be expected from aggregate size, U measured beforethe bloom peak was faster (median: 0.37 cm s−1) than duringthe bloom (median: 0.15 cm s−1) and after the bloom peak(median: 0.34 cm s−1). 1ρ of aggregates, calculated from U(Figure 5), ranged over four orders of magnitude (from 5× 10⁻⁶
to 8 × 10⁻² g cm−3) and did not significantly changed withbloom time if we consider all treatments together, the median1ρ was 8.5 × 10⁻³ g cm−3 during Pre-Bloom, 2.1 × 10⁻³ gcm−3 during Bloom Peak, and 3.1 × 10⁻³ g cm−3 during Post-Bloom. The calculated aggregate mass (Figure 5) varied between1 × 10−5 and 2 × 10⁻¹ mg without a clear relationship with thebloom stage.
An initial multivariate analyses of variance (MANOVA, datanot shown), comparing aggregate physical properties (ESD, U,1ρ and mass), showed that aggregates formed from mesocosmseawater subjected to different CO2 and temperature conditions,were significantly different from each other. During Pre-Bloom,the physical properties of the aggregates formed in PC andAC treatments overlapped, but properties of aggregates fromAW treatments were different. During and after the BloomPeak, properties of aggregates formed in the AC treatment weresignificantly different from those of aggregates formed in PC andAW treatments. Since physical properties of aggregates formedin different treatments were significantly different from eachother, aggregates from the same treatment and bloom period
Frontiers in Marine Science | www.frontiersin.org 7 January 2019 | Volume 5 | Article 500

fmars-05-00500 December 26, 2018 Time: 17:30 # 8
Cisternas-Novoa et al. Future Ocean Effects on Marine Aggregates
FIGURE 3 | TEP (mg XG eq. L−1), CSP (mg BSA eq. L−1), Chl-a (mg L−1), TPC (mg L−1), and PN (mg L−1) contents of the aggregate fraction (AGG, gray) andsurrounding seawater fraction (SSW, white) formed during RTEs. The bars represent the average of all the roller tanks that formed aggregates in each treatment andbloom period. For Pre-bloom: PC (n = 3RT), AC (n = 4 RT), and AW (n = 2RT); and for Post-bloom PC (n = 2 RT), AC (n = 2 RT), and AW (n = 2 RT).
were analyzed together and the three treatments were compared(Figure 5 and Table 1).
The Kruskal–Wallis test with posterior mean rank multiplecomparisons revealed specifically in which cases the analyzedparameters (ESD, U, 1ρ, and mass) were significantly differentbetween treatments (Table 1). The median U, ESD, 1ρ, and
mass of the aggregates formed in Pre- Bloom in AW treatmentwere significantly larger than aggregates formed in PC and ACtreatments (Table 1). During the Bloom Peak, the U of aggregatesformed in AW was not significantly different than in the othertwo treatments. The median U, 1ρ, and mass of aggregatesformed in AC were larger than in aggregates formed in PC,
Frontiers in Marine Science | www.frontiersin.org 8 January 2019 | Volume 5 | Article 500
fmars-05-00500 December 26, 2018 Time: 17:30 # 9
Cisternas-Novoa et al. Future Ocean Effects on Marine Aggregates
FIGURE 4 | Content of TEP (mg XG eq. L−1) and CSP (mg BSA eq. L−1) normalized by the amount of TPC in the aggregate fraction of each treatment and samplingtime. Black bars represent the TEP/TPC ratio and gray bars represent CSP/TPC. Bars show the average of all the roller tanks that formed aggregates in eachtreatment and bloom period. For Pre-bloom: PC (n = 3RT), AC (n = 4 RT), and AW (n = 2RT); and for Post-bloom PC (n = 2 RT), AC (n = 2 RT), and AW (n = 2 RT).
however the median ESD of aggregates formed in AC was smallerthan in PC. There were no significant differences in ESD, 1ρ, andmass of aggregates formed in PC and AW. During Post-Bloom,the U, ESD, and mass of aggregates formed in AC were all smallerthan in aggregates formed in PC and AW (Figure 5 and Table 1).There were not significant differences between aggregates formedin AW and PC.
The relationships between U and ESD of the aggregatesduring the different stages of the bloom were determinedusing power law curves fit to the data from each roller tank.However, with only few exceptions (Table 2), there was nosignificant relationship between those parameters. There was asignificant positive relation between U and ESD in roller tankAW-A t1 before the Bloom Peak, roller tank AW-B t2 duringthe Bloom Peak, and roller tank PC-C t4 after the BloomPeak.
DISCUSSION
Starting Conditions for the AggregateExperimentsThe primary goal of the mesocosm experiment was to providematerial to investigate aggregation processes. The sinking ofphytoplankton-rich aggregates is the major export mechanismby which photosynthetically fixed carbon reaches the deepocean (Alldredge and Jackson, 1995; Buesseler, 1998; Turner,2015). However, information is scarce about the direct effectof acidification and warming on aggregation rates and sinkingvelocities (Seebah et al., 2014), and most existing studies focusonly on effects of temperature (Piontek et al., 2009; Iversenand Ploug, 2013) or of acidification on calcifying organisms(Biermann and Engel, 2010). In our RTEs, we aimed toinvestigate how warming and acidification together will affectfuture aggregation and thus export processes during the differentstages of a natural phytoplankton bloom dominated by diatoms.
Roller tank aggregation experiments were performed duringPre-Bloom, Bloom Peak, and Post-Bloom periods to comparea wide range of Chl-a and nutrient concentrations. Chl-aconcentrations at the Bloom Peak were relatively high comparedwith environmental values due to the addition of nutrients to
induce a phytoplankton bloom. Concentrations of particulateorganic matter (Chl a, TPC, and exopolymeric particles)measured in the mesocosms before RTEs were used as the initialconcentration of material available for aggregate formation. Ingeneral, during Pre- and Post-Bloom, TPC was higher and theratio TEP/TPC and CSP/TPC were lower relative to the Bloom-Peak (Figure 2).
Visible (>0.4 mm) aggregates did not form in every rollertank aggregation experiment. Coagulation theory indicates thataggregate formation is controlled by the abundance of particlesthat could potentially aggregate, their size and stickiness,i.e., the probability that those particles stick together aftercollision (Jackson, 1990; Kiørboe et al., 1990). The magnitudeof the bloom in each mesocosm tank is one indicator of theabundance of particles available to form aggregates. Thus, theinitial concentration of Chl-a reflects the number of cells andthus higher Chl-a would cause higher aggregate formation.For instance, AW-C and PC-A mesocosms had low Chl-aand exopolymer particle concentrations and did not formaggregates; PC-C also had relatively low Chl-a concentration(<10 µg L−1), but a comparatively higher concentration ofexopolymer particles, and did form aggregates (except at the lasttime point). Intuitively, we tend to think that a larger bloom(with higher Chl-a concentrations) would result in higher cellconcentrations and higher production of exopolymer particlesand thus enhanced aggregate formation.
TEP concentration is another possible indicator of thepotential to form aggregates. TEP have been shown toenhance aggregation in two different ways: first increasing theconcentration of particles in the water and thus the probabilityof collision, and second, increasing particle stickiness by up totwo orders of magnitude thus increasing the probability that twoparticles will stick together after collision (Logan et al., 1995;Passow and Alldredge, 1995b; Engel, 2000; Passow, 2002). TEPconcentration has been positively related to aggregate formationin mesocosm experiments with coastal phytoplankton (Passowand Alldredge, 1995b; Engel et al., 2014) and a non-axenicculture of Thalassiosira weissflogii (Seebah et al., 2014). However,exopolymer particles such as TEP and CSP can have differenteffects on aggregate formation depending on the dominantspecies. For example, significant amounts of TEP and CSP were
Frontiers in Marine Science | www.frontiersin.org 9 January 2019 | Volume 5 | Article 500
fmars-05-00500 December 26, 2018 Time: 17:30 # 10
Cisternas-Novoa et al. Future Ocean Effects on Marine Aggregates
FIGURE 5 | Sinking velocity and physical properties of aggregates formed in RTEs conducted at different bloom periods. The box plots include all theindividually-measured aggregates (>0.4 mm) from the different roller tanks (RT) in each treatment. For Pre-Bloom, PC included 29 aggregates from two RT, ACincluded 29 aggregates from three RT, and AW included 29 aggregates from two RT. For Bloom Peak, PC included 25 aggregates from two RT, AC included 26aggregates from two RT, and AW included 15 aggregates from one RT. For Post-Bloom, PC included 27 aggregates from two RT, AC included 26 aggregates fromtwo RT, and AW included 30 aggregates from two RT. The boundaries of the box indicate the 25th and the 75th percentile, the black line within the box is themedian. Error bars indicate the 90th and 10th percentiles, and black dots are the outlying points.
not observed in aggregates formed from pure cultures of Naviculasp. (Grossart et al., 2006), while Prieto et al. (2002) showedthat CSP had a less important role than TEP in aggregationevents studied in mesocosms, However, the Prieto et al. (2002)study looked at the relation between CSP and aggregation duringthe aggregate maximum, which may coincide with lower CSPconcentration (Cisternas-Novoa et al., 2015).
The type of cell may also influence aggregation; for example,not all diatom types make the same contribution to aggregateformation and sinking velocity (Laurenceau-Cornec et al., 2015).In this experiment, we did not detect any qualitative differencesin diatom composition that were related to the temperatureand acidification treatments. In most mesocosms, chain-forming
and small centric diatoms dominated the phytoplankton bloom.Exceptions were mesocosm PC-A and AC-A (SupplementaryFigure S6), in which small centric diatoms were dominant; few orno aggregates formed in water from those mesocosms. However,aggregation experiments with water from AW-C also formed noaggregates, despite the fact that both chain-forming and smallcentric diatoms were present, although the bloom was relativelysmall. Thus, differences in diatom type alone could not explainthe presence or absence of aggregates in the RTEs.
In our aggregation experiments, there was a correlationbetween aggregate formation in the RTEs and the initialconcentration of TPC, PN, TEP, and CSP at the beginning of theRTE. During this study we did not investigate the role of bSi as
Frontiers in Marine Science | www.frontiersin.org 10 January 2019 | Volume 5 | Article 500

fmars-05-00500 December 26, 2018 Time: 17:30 # 11
Cisternas-Novoa et al. Future Ocean Effects on Marine Aggregates
TABLE 1 | Median and results of the Kruskal–Wallis test with posterior multiple comparisons analysis for the RTEs.
Time Parameter PC AC AW Multiple comparison test results
Pre-bloom n 29 (2) 29 (3) 29 (2)
U [c ms−1] 0.34 0.29 0.90 Aggregates formed in treatment AW sank faster than in PC (p < 0.01) and AC(p < 0.01)
ESD [cm] 0.14 0.16 0.20 Aggregates formed in treatment AW were larger than in PC (p < 0.01) and AC(p < 0.01)
1ρ [g cm−3] 0.007 0.008 0.014 Aggregates formed in treatment AW were denser than in PC (p < 0.01) andAC (p < 0.01)
Mass [mg] 0.012 0.009 0.069 Aggregates formed in treatment AW were heavier than in PC (p < 0.01) andAC (p < 0.01)
Bloom peak n 25 (2) 26 (2) 15 (1)
U [cm s−1] 0.05 0.17 0.09 U of aggregates formed in AW were not significantly different from the othertwo treatments. Aggregates formed in AC sank faster than in PC (p < 0.01)
ESD [cm] 0.17 0.12 0.20 Aggregates formed in treatment AC were smaller than in AW and PC(p < 0.01 and p < 0.05)
1ρ [g cm−3] 0.001 0.006 0.001 Aggregates formed in treatment AC were more dense than in AW and PC(p < 0.01)
Mass [mg] 0.001 0.088 0.003 Aggregates formed in treatment AC were heavier than in AW and PC(p < 0.01)
Post-bloom n 27 (2) 26 (2) 30 (2)
U [cm s−1] 0.38 0.04 0.44 Aggregates formed in treatment AC sank slower than in AW and PC (p < 0.01)
ESD [cm] 0.26 0.11 0.26 Aggregates formed in treatment AC were smaller than in AW and PC(p < 0.01)
1ρ [g cm−3] 0.004 0.002 0.005 The 1ρ of the aggregates formed in the three treatments was not significantlydifferent
Mass [mg] 0.036 0.001 0.037 Aggregates formed in treatment AC were lighter than in AW and PC (p < 0.01)
“n” indicates the number of aggregates analyzed, and the number between parentheses indicates how many roller tanks they came from. Parameters compared wereexcess density (1ρ, g cm−3) and mass (mg) of the aggregates calculated from measured values of sinking velocity (U, cm s−1), and equivalent spherical diameter(ESD, cm).
a ballast; further studies should incorporate this measurementto obtain a complete, and ideally, a more robust idea of howdifferent particulate components interact to form aggregates. Ourresults do show that the abundances of cells, TEP, and CSP maybe important for aggregate formation, but they also suggest thatthe ratio of cells to exopolymer particles could be a determinantin aggregate formation.
Sinking Velocity (U) and Aggregate Size(ESD) Determination in Roller Tank UsingImage AnalysisObtaining accurate measurements of sinking velocity andphysical properties of aggregates and relating them tocompositional changes is a major challenge, but one that iscritical to determining how climate change will affect aggregateproperties and carbon export in the future ocean. The sizeand sinking velocity of aggregates measured in this study(43.2–380.1 m d−1) were comparable to values reported byLaurenceau-Cornec et al. (2015), between 13 and 260 m d−1
in RTEs with natural phytoplankton, and by Iversen and Ploug(2010) between 113 and 246 m d−1 in RTEs with Emilianiahuxleyi and Skeletonema costatum. During the Pre-bloom intreatment AW, we measured higher sinking velocities (median:
777.6 m d−1); this relatively high value was in the range reportedby Engel and Schartau (1999), between 544.3 and 622.08 m d−1
in RTEs with Nitzschia closterium.
Relation Between Chemical Compositionand Physical Properties of AggregatesWe observed significant relationships between chemicalcomposition and physical properties of aggregates; however,it is important to keep in mind that chemical and physicalparameters were measured differently. The chemical compositionof aggregates was measured in the aggregate slurry fraction, andthe actual concentration of the particulate components wascalculated after subtracting the concentration in the SSW(see section “Materials and Methods” for details). U and ESDwere measured in 10 to 20 randomly chosen aggregates, and1ρ and mass were calculated from U and ESD. Thus, onlyrelationships between the median of the directly measuredphysical parameters (U and ESD) and the chemical compositionof aggregates will be discussed. Considering each bloom stageseparately, we found a weak correlation between TEP and ESD(r = 0.78, p = 0.07) during Pre-Bloom and between CSP and ESD(r = 0.82, p = 0.08) during Bloom-Peak. During Post-Bloom,however, there was a significant correlation between TEP: TPCratio and ESD (r = 0.94, p < 0.005). When we compare all the
Frontiers in Marine Science | www.frontiersin.org 11 January 2019 | Volume 5 | Article 500

fmars-05-00500 December 26, 2018 Time: 17:30 # 12
Cisternas-Novoa et al. Future Ocean Effects on Marine Aggregates
TABLE 2 | Relationship between sinking velocity (U, cm s−1) and size asequivalent spherical diameter (ESD, cm) in each roller tank and bloom period.
Time Treatment Power law curve fitting N r2 p
Pre-bloom t1- PC-B U = 3.04 ESD1.1 14 0.16 0.16
t1- PC-C U = 0.32 ESD5.5E−17 15 0 1
t1- AC-A U = 0.47 ESD3.3E−17 11 0 1
t2- AC-A U = 0.53ESD4.8E−17 5 0 1
t2- AC-B U = 0.19 ESD1.3E−13 13 0 1
t1- AW-A U = 8.15 ESD1.62 14 0.37 <0.05
t1- AW-B U = 2.47 ESD0.46 15 0.11 0.23
PC U = 0.25 ESD5.8E−18 29 (2) – 1
AC U = 0.59 ESD0.26 29 (3) 0.18 0.34
AW U = 2.73 ESD0.69 29 (2) 0.29 0.13
Bloom t2- PC-B U = 0.061 ESD0.43 15 0.08 0.30
t3- PC-C U = 0.20 ESD1.6E−16 10 −4.4E-15 1
t2- AC-C U = 0.80 ESD0.43 16 0.06 0.35
t3- AC-B U = 1.0 ESD1.1E−16 10 −2.2E-16 1
t2- AW-B U = 3.9 ESD2.3 15 0.75 <0.01
PC U = 0.42 ESD0.36 25 (2) 0.43 0.12
AC U = 0.23 ESD9.9E−8 26 (2) – 1
AW U = 3.9 ESD2.3 15 (1) 0.75 <0.01
Post-bloom t3- PC-B U = 0.57 ESD2.3E−17 14 −2.2E-17 1
t4- PC-C U = 0.83 ESD0.63 13 0.75 <0.01
t3-AC-C U = 3.7 ESD1.8 16 0.04 0.45
t4-AC-C U = 0.84 ESD8.6E−17 10 −2.2E-16 1
t3-AW-B U = 0.54 ESD0.03 15 5E-4 0.94
t4-AW-B U = 0.35 ESD6.9E−17 15 −2.2E-16 1
PC U = 0.72 ESD0.34 27 (2) 0.45 <0.05
AC U = 0.06 ESD1.4E−16 26 (2) – 1
AW U = 0.44 ESD3.7E−17 30 (2) – 1
To show the fit of the power law curve, the total number of aggregates analyzedin each roller tank (n), r2 and the p-value (p) are shown. Significant relationships(<0.05) are shown in bold.
treatments and blooms stages, the median ESD of aggregateswas positively related to their TEP (r = 0.76, p < 0.005) andCSP (r = 0.74, p < 0.005) contents (Supplementary Table S5).Previous studies had shown that TEP are important in promotingthe formation of larger aggregates as their stickiness enhancesthe coagulation of particles (Passow, 2002). The role of CSP incoagulation and aggregate formation still needs to be furtherinvestigated; diatom aggregates are depleted in CSP relativeto TEP, while CSP seems to be an important component ofcyanobacteria aggregates (Cisternas-Novoa et al., 2015). Inour experiment, particle size was positively correlated withboth TEP and CSP. However, this strong correlation betweenexopolymer particle content and ESD did not translate intoa significant relationship between aggregate size (ESD) andU (Table 2). This discrepancy between aggregate size and Uhas been described before (Stemmann et al., 2004). Previousstudies have shown that size influences U in specific cases,for instance, when aggregates are formed from homogeneousparticles (Iversen and Ploug, 2010), or are highly compact(Laurenceau-Cornec et al., 2015). However, with increasingporosity (Iversen and Ploug, 2010) and TEP content (Engel andSchartau, 1999), the relationship between size and U becomes
weaker. TEP are less dense than seawater (Azetsu-Scott andPassow, 2004), which may explain why higher TEP contentmay decrease the U of aggregates (Engel and Schartau, 1999;Mari et al., 2017). Our results (Table 2) agree with theseprevious findings that ESD is not always a good predictor ofU for aggregates formed from natural plankton communitiesdominated by diatoms, and showed that an increment in size dueto a higher content of exopolymer particles does not directly leadto higher U.
Particle size, density, and porosity have been proposed as thefactors that control U of aggregates (De La Rocha and Passow,2007); this implies that chemical composition of the particlesforming the aggregate has an indirect role determining the U ofthe aggregate. During this study we found a direct correlationbetween aggregate size and exopolymer particle content, but notbetween the chemical composition of aggregates and U.
Previous studies have shown that the TEP- U relationshipis not straightforward (Seebah et al., 2014). On one hand, TEPcontent may decrease sinking velocity by adding low-densitymass to an aggregate (Azetsu-Scott and Passow, 2004; Mariet al., 2017). On the other hand, TEP content may enhancesinking velocity by enhancing the formation of large, particle-loaded, and fast-sinking aggregates. TEP could also reduce theporosity of aggregates by filling pore spaces (Ploug et al., 2002);this process may alter the U versus size relationship. In thisstudy, the phytoplankton community was dominated by diatomscells, which are denser than TEP. Solid matter density of largeaggregates formed from a diatom culture ranges from 1.26to 1.36 g cm−3 (Azetsu-Scott and Johnson, 1992), while thecalculated density of TEP ranges from 0.70 to 0.84 g cm−3
(Azetsu-Scott and Passow, 2004). Therefore, if cells are embeddedin a large TEP matrix, the more loaded with cells the matrix is,the denser the aggregate would be. Engel and Schartau (1999)previously showed that the higher the TEP content relative to cellvolume concentration, the lower the value of fractal dimension(D3) and U. Our results showing that there is no direct correlationbetween exopolymer particle content and U agree with thoseof Laurenceau-Cornec et al. (2015); they studied the chemicalcomposition and U of individual aggregates formed in rollertanks from natural seawater collected in the Kerguelen Plateauand suggested that chemical composition has no direct influenceon aggregate U. Moreover, our findings of a correlation betweenexopolymer particles and size show the need for further parallelmeasurements on chemical composition and physical propertiesof aggregates.
Effect of Temperature and CO2 onBiochemical Composition and PhysicalProperties of AggregatesIn the aggregation experiment presented here, we did not detect aclear effect of temperature and CO2 level on the biogeochemicalcomposition of the aggregates, except in one case, the TEPand CSP content normalized to TPC of aggregates formedin AC treatment during Pre-bloom. A previous study showedthat aggregates formed under high temperature (8.5 versus2.5◦C) at the end of the bloom were enriched in POC, PN,
Frontiers in Marine Science | www.frontiersin.org 12 January 2019 | Volume 5 | Article 500

fmars-05-00500 December 26, 2018 Time: 17:30 # 13
Cisternas-Novoa et al. Future Ocean Effects on Marine Aggregates
and POP (Piontek et al., 2009). Our results, however, are notdirectly comparable to the Piontek et al. (2009) study sincethe temperature range was different (16.5 to 20.5◦C), and themesocosms at warmer temperature were also exposed to elevatedCO2 levels.
Although we did not detect changes in aggregate compositionthat could be attributed to the temperature or CO2 treatments,changes in aggregate composition did occur over the course ofthe phytoplankton bloom. TEP and CSP content in the aggregatefraction formed at present CO2 and cooler temperature, and atelevated temperature and higher CO2, increased gradually fromPre-Bloom to Post-Bloom; this trend is not as clear at higher CO2and cooler temperature. The content of TEP and CSP relativeto TPC in the roller tank aggregates was also relatively higherduring the Pre- and Post-Bloom than during the Bloom Peak(Figure 4). During Pre and Post-Bloom, the concentration of TEPand CSP relative to TPC was also high in the mesocosm. Thus,the higher concentration of TEP and CSP in the mesocosm waterat the start of the roller tank aggregation experiment translatedinto elevated TEP and CSP content in the aggregate fraction.This observation may suggest that a significant fraction of theTEP and CSP produced in the mesocosm was later incorporatedin the aggregates, supporting the idea that TEP and CSP act asan “organic glue” enhancing aggregate formation (Engel, 2000;Passow, 2002). The Chl-a and TPC content of the aggregatefraction, on the other hand, did not show a significant trend withthe bloom stage.
Physical properties of the aggregates formed in the rollertanks were different under different CO2 and temperature levels.Aggregates varied significantly in size (measured as equivalentspherical diameter, ESD) and sinking velocity (U, Table 1).Before the Bloom Peak, aggregates formed in acidified andwarmer conditions were larger and sank faster than aggregatesformed under cooler temperature, independent of the CO2 levelof the treatment. This suggests that the warmer temperaturecombined with the higher CO2 level had a synergistic effect onaggregate size and that temperature had a larger effect than CO2level on aggregate sinking velocity. Previous mesocosm studieshave suggested that the effect of warming is more importantthan acidification for a Baltic Sea phytoplankton community(Paul et al., 2015), and showed no measurable synergistic, butantagonist, effect of warming and acidification on phytoplanktonbiomass, Chl a and POC (Sommer et al., 2015; Paul et al.,2016). However, these studies did not investigate the directeffect on aggregates, Paul et al. (2015) found that the elevatedtemperature may have impacted phytoplankton growth beforethe bloom, leading to an earlier bloom peak, and enhancing thegrazing pressure that controls the phytoplankton biomass. In ourstudy, aggregates formed under warmer, acidified conditions hadrelatively higher contents of Chl a during Pre-bloom (Figure 3).This agrees with the finding that the highest TEP/TPC andCSP/TPC ratio measured during this study was in aggregatesformed under acidified but present temperature conditionsduring Pre-Bloom. These results suggest that under higher CO2conditions at present temperature, the fraction of TEP and CSPrelative to the TPC content of aggregates formed during Pre-Bloom in a diatom-dominated system could increase, causing
the formation of relatively large, but slowly sinking aggregates.As mentioned earlier, higher TEP content might have decreasedthe U of aggregates (Engel and Schartau, 1999; Mari et al.,2017) since TEP are less dense than seawater (Azetsu-Scott andPassow, 2004). However, under higher CO2 conditions combinedwith warming, the Pre-Bloom fraction of exopolymeric particlesrelative to TPC was not as high, suggesting that in a futurewarmer, more acidic ocean, large and fast sinking aggregatesmight be more abundant. One factor we need to consider is thatwe do not know the amount of bSi content (ballast material)in the aggregate fraction. Although TEP and CSP may decreasethe U of aggregates, the 1ρ of the aggregates does not dependonly on TEP and CSP content but also on bSi content. If thestickiness of particles had decreased with bloom time (Dam andDrapeau, 1995), we could expect that the TEP and the bSi contentof aggregates were closely related during the Pre-Bloom. Thiscould explain why the highest U and the highest TEP and CSPcontent relative to TPC in treatment AC was during Pre-Bloomrather than Bloom peak and Post-Bloom. However, this was notobserved in the other two treatments and since we do not havedirect bSi measurements, this point is merely speculative.
During the Bloom Peak and Post- Bloom, physical propertiesof aggregates that formed at the same temperature but at differentCO2 levels were significantly different from each other (Table 1).During the Bloom Peak, in general, aggregate U was slower thanduring Pre- and Post-Bloom, except for aggregates formed underacidified conditions and ambient temperature that were relativelyfaster and smaller than aggregates formed under present CO2levels and ambient temperature or under more acidified andwarmer conditions. On the other hand, during Post-Bloom,aggregates that formed under acidified and ambient temperatureconditions were smaller and sank more slowly (Table 1). ThePost-Bloom situation in our experiment may be consideredanalogous to the culmination of a natural phytoplankton bloom.In natural diatom-dominated phytoplankton blooms, senescentcells aggregate and sink at the culmination of the bloom (Loganet al., 1995; Thornton, 2002). Our results showed that underhigher CO2 levels (without temperature change) conditions,slowly sinking aggregates would result in less POC export duringPost-Bloom since aggregates that sink slower spend more timein the water column and have more time to decay. However,U of aggregates formed under acidified and warmer oceanconditions was not significantly different than aggregates formedunder present conditions of CO2 and temperature, this suggeststhat the negative effect of elevated CO2 on U could have beencounteracted, and thus not detectable, by an opposite effect ofwarming.
Our study provides the first direct observations of the effectof temperature and acidification on aggregate sinking velocityand biogeochemical properties, highlighting the importance ofdirectly investigating effects on aggregates instead of indirectlyassuming them from effects on phytoplankton. The fact that wemeasure significant differences due to acidification and warmingin physical properties but no in the chemical composition ofaggregates could in part been explained by the different samplingstrategy and resolution of those two types of parameters. Toensure to have enough material to characterize the chemical
Frontiers in Marine Science | www.frontiersin.org 13 January 2019 | Volume 5 | Article 500

fmars-05-00500 December 26, 2018 Time: 17:30 # 14
Cisternas-Novoa et al. Future Ocean Effects on Marine Aggregates
composition of aggregates, those parameters were measured inthe bulk aggregate fraction, this means that we have one valueof each chemical parameter by each roller tank, on the otherhand, the physical properties were measured in 10 to 20 randomlychosen aggregates, allowing 10 to 20 independent measurementsof the physical properties in each roller tank, this provides moreobservations to perform statistical analysis.
Possible ImplicationsThe primary objective of this study was to investigate howfuture acidification and warming of the ocean may alter thebiogeochemical and physical properties of aggregates formedfrom a natural phytoplankton community. In our experiment,there were no detectable changes in the chemical compositionof aggregates formed under different CO2 and temperatureconditions. However, we found differences in size and sinkingvelocity of aggregates formed with water from differenttreatments, and those properties also changed during thedifferent bloom stages. Moreover, regardless the treatments; therewas a correlation between the content of exopolymer particlesof the aggregates and their size, however, during this study,either the chemical composition or the aggregate size were goodpredictors of aggregate sinking velocity.
Our findings show that future ocean conditions havethe potential to modify the sinking velocity and physicalproperties of aggregates and thus alter the biological carbonpump; however, the mechanisms causing those differences arenot clear from our results. To better understand this issue,additional studies focusing directly in measuring the effect ofacidification and warming in physical, chemical, and ecologicalcharacteristics of aggregates are required, since looking onlyat phytoplankton and organic matter stock is not enough tounderstand complex processes controlling aggregate properties.Most previous measurements of the effects of warming andacidification on exopolymer particles and the consequencesfor aggregation and carbon export come from experimentsthat studied only one stressor at a time (Piontek et al., 2009;Maugendre et al., 2017b; Stange et al., 2018), or only a singlespecies (Seebah et al., 2014; Passow and Laws, 2015; Taucher et al.,2015), and have focused only on TEP. Instead, our aggregationexperiment focused on the effects of acidification and warmingon physical and biogeochemical properties of aggregates formedfrom a natural phytoplankton community.
Further research on properties of TEP and CSP, e.g., porosityand stickiness, would help determine the possible importance
of these particles to the biological carbon pump and thesignificance of aggregate composition in modifying an aggregate’ssize and density. Understanding the magnitude of this effectis a start to improving our understanding of the size-sinkingvelocity relationship that is currently widely used in model-based predictions about the biological pump, and on estimates ofparticle flux based on measurements from autonomous systems.
AUTHOR CONTRIBUTIONS
CC-N, CL, and AE contributed to the design of the study.CC-N, CL, AE, RdJ, and TT set-up and sampled the ME andRT experiments. CC-N analyzed the samples from the ME andRT experiments and interpreted the data and wrote the first draftof the manuscript. CL and AE contributed to data interpretationand manuscript writing.
FUNDING
Funding was provided by a grant from the ChemicalOceanography Program (08-50904) of the U.S. NationalSciences Foundation to CL and AE. CC-N was additionallysupported by the Conicyt-Fulbright Fellowship Beca Igualdadde Oportunidades, Chile. This study was also supportedby the Helmholtz Association of German Research Centers(HGF) and is a contribution to the Collaborative ResearchCenter 754/SFB Sonderforschungsbereich 754 “Climate-Biogeochemistry Interactions in the Tropical Ocean.”
ACKNOWLEDGMENTS
We thank T. Dammrich for laboratory assistance, S. Abrams andJ. Soto-Neira for help setting up the mesocosms, D. Hirschbergfor nutrient and TPC/PN analyses, and J. Soto-Neira forsuggestions on image analysis.
SUPPLEMENTARY MATERIAL
The Supplementary Material for this article can be foundonline at: https://www.frontiersin.org/articles/10.3389/fmars.2018.00500/full#supplementary-material
REFERENCESAlldredge, A. L., and Jackson, G. A. (1995). Preface: aggregation in marine system.
Deep Sea Res. Part II Top. Stud. Oceanogr. 42, 1–7. doi: 10.1016/0967-0645(95)90003-9
Alldredge, A. L., Passow, U., and Logan, B. E. (1993). The abundance andsignificance of a class of large, transparent organic particles in the ocean. DeepSea Res. Part I Oceanogr. Res. Pap. 40, 1131–1140. doi: 10.1016/0967-0637(93)90129-Q
Armstrong, R. A., Lee, C., Hedges, J. I., Honjo, S., and Wakeham, S. G. (2001).A new, mechanistic model for organic carbon fluxes in the ocean basedon the quantitative association of POC with ballast minerals. Deep Sea
Res. Part II Top. Stud. Oceanogr. 49, 219–236. doi: 10.1016/S0967-0645(01)00101-1
Arrigo, K. R. (2007). Marine manipulations. Nature 450, 491–492. doi: 10.1038/450491a
Azetsu-Scott, K., and Johnson, B. D. (1992). Measuring physical characteristicsof particles: a new method of simultaneous measurement for size,settling velocity and density of constituent matter. Deep Sea Res.Part A Oceanogr. Res. Pap. 39, 1057–1066. doi: 10.1016/0198-0149(92)90039-V
Azetsu-Scott, K., and Passow, U. (2004). Ascending marine particles: significance oftransparent exopolymer particles (TEP) in the upper ocean. Limnol. Oceanogr.49, 741–748. doi: 10.4319/lo.2004.49.3.0741
Frontiers in Marine Science | www.frontiersin.org 14 January 2019 | Volume 5 | Article 500

fmars-05-00500 December 26, 2018 Time: 17:30 # 15
Cisternas-Novoa et al. Future Ocean Effects on Marine Aggregates
Bidigare, R., Kennicutt, M., and Brooks, J. (1985). Rapid determination ofchlorophylls and their degradation products by high-performance liquidchromatography. Limnol. Oceanogr. 30, 432–435. doi: 10.4319/lo.1985.30.2.0432
Biermann, A., and Engel, A. (2010). Effect of CO2 on the properties and sinkingvelocity of aggregates of the coccolithophore Emiliania huxleyi. Biogeosciences7, 1017–1029. doi: 10.5194/bg-7-1017-2010
Borchard, C., Borges, A. V., Händel, N., and Engel, A. (2011). Biogeochemicalresponse of Emiliania huxleyi (PML B92/11) to elevated CO2 and temperatureunder phosphorous limitation: a chemostat study. J. Exp. Mar. Biol. Ecol. 410,61–71. doi: 10.1016/j.jembe.2011.10.004
Borchard, C., and Engel, A. (2012). Organic matter exudation by Emiliania huxleyiunder simulated future ocean conditions. Biogeosciences 9, 3405–3423. doi:10.5194/bg-9-3405-2012
Bourdin, G., Gazeau, F., Kerros, M.-E., Marro, S., and Pedrotti, M. L. (2017).Dynamics of transparent exopolymeric particles and their precursors duringa mesocosm experiment: impact of ocean acidification. Estuar. Coast. Shelf Sci.186, 112–124. doi: 10.1016/j.ecss.2016.02.007
Buesseler, K. O. (1998). The decoupling of production and particulate export in thesurface ocean. Glob. Biogeochem. Cycles 12, 297–310. doi: 10.1029/97GB03366
Chen, C.-S., Anaya, J. M., Chen, E. Y. T., Farr, E., and Chin, W.-C. (2015).Ocean warming–acidification synergism undermines dissolved organic matterassembly. PLoS One 10:e0118300. doi: 10.1371/journal.pone.0118300
Cisternas-Novoa, C., Lee, C., and Engel, A. (2014). A semi-quantitativespectrophotometric, dye-binding assay for determination of Coomassie Bluestainable particles. Limnol. Oceanogr. Methods 12, 604–616. doi: 10.4319/lom.2014.12.604
Cisternas-Novoa, C., Lee, C., and Engel, A. (2015). Transparent exopolymerparticles (TEP) and Coomassie stainable particles (CSP): differences betweentheir origin and vertical distributions in the ocean. Mar. Chem. 175, 56–71.doi: 10.1016/j.marchem.2015.03.009
Claquin, P., Probert, I., Lefebvre, S., and Veron, B. (2008). Effects of temperatureon photosynthetic parameters and TEP production in eight species of marinemicroalgae. Aquat. Microb. Ecol. 51, 1–11. doi: 10.3354/ame01187
Dam, H. G., and Drapeau, D. T. (1995). Coagulation efficiency, organic-matterglues and the dynamics of particles during a phytoplankton bloom in amesocosm study. Deep Sea Res. Part II Top. Stud. Oceanogr. 42, 111–123.doi: 10.1016/0967-0645(95)00007-D
De La Rocha, C. L., and Passow, U. (2007). Factors influencing the sinking of POCand the efficiency of the biological carbon pump. Deep Sea Res. Part II Top. Stud.Oceanogr. 54, 639–658. doi: 10.1016/j.dsr2.2007.01.004
Delille, B., Harlay, J., Zondervan, I., Jacquet, S., Chou, L., Wollast, R., et al.(2005). Response of primary production and calcification to changes of pCO2during experimental blooms of the coccolithophorid Emiliania huxleyi. Glob.Biogeochem. Cycles 19:GB2023.
Doney, S. C., Fabry, V. J., Feely, R. A., and Kleypas, J. A. (2009). Ocean acidification:the other CO2 problem. Annu. Rev. Mar. Sci. 1, 169–192. doi: 10.1146/annurev.marine.010908.163834
Edwards Kyle, F., Thomas Mridul, K., Klausmeier Christopher, A., andLitchman, E. (2016). Phytoplankton growth and the interaction of light andtemperature: a synthesis at the species and community level. Limnol. Oceanogr.61, 1232–1244. doi: 10.1002/lno.10282
Egge, J. K., Thingstad, T. F., Larsen, A., Engel, A., Wohlers, J., Bellerby,R. G. J., et al. (2009). Primary production during nutrient-induced blooms atelevated CO2 concentrations. Biogeosciences 6, 877–885. doi: 10.5194/bg-6-877-2009
Eggers, S. L., Lewandowska, A. M., Barcelos, E. R. J., Blanco-Ameijeiras, S.,Gallo, F., and Matthiessen, B. (2014). Community composition has greaterimpact on the functioning of marine phytoplankton communities than oceanacidification. Glob. Change Biol. 20, 713–723. doi: 10.1111/gcb.12421
Engel, A. (2000). The role of transparent exopolymer particles (TEP) in the increasein apparent particle stickiness (α) during the decline of a diatom bloom.J. Plankton Res. 22, 485–497. doi: 10.1093/plankt/22.3.485
Engel, A. (2002). Direct relationship between CO2 uptake and transparentexopolymer particles production in natural phytoplankton. J. Plankton Res. 24,49–53. doi: 10.1093/plankt/24.1.49
Engel, A., Abramson, L., Szlosek, J., Liu, Z., Stewart, G., Hirschberg, D., et al.(2009a). Investigating the effect of ballasting by CaCO3 in Emiliania huxleyi,
II: decomposition of particulate organic matter. Deep Sea Res. Part II Top. Stud.Oceanogr. 56, 1408–1419. doi: 10.1016/j.dsr2.2008.11.028
Engel, A., Szlosek, J., Abramson, L., Liu, Z., and Lee, C. (2009b). Investigatingthe effect of ballasting by CaCO3 in Emiliania huxleyi: I. Formation, settlingvelocities and physical properties of aggregates. Deep Sea Res. Part II Top. Stud.Oceanogr. 56, 1396–1407. doi: 10.1016/j.dsr2.2008.11.027
Engel, A., Borchard, C., Piontek, J., Schulz, K. G., Riebesell, U., and Bellerby, R.(2013). CO2 increases 14 C primary production in an Arctic planktoncommunity. Biogeosciences 10, 1291–1308. doi: 10.5194/bg-10-1291-2013
Engel, A., Meyerhöfer, M., and Von Bröckel, K. (2002). Chemical and biologicalcomposition of suspended particles and aggregates in the Baltic sea in summer(1999). Estuar. Coast. Shelf Sci. 55, 729–741. doi: 10.1006/ecss.2001.0927
Engel, A., Piontek, J., Grossart, H.-P., Riebesell, U., Schulz, K. G., and Sperling, M.(2014). Impact of CO2 enrichment on organic matter dynamics during nutrientinduced coastal phytoplankton blooms. J. Plankton Res. 36, 641–657. doi: 10.1093/plankt/fbt125
Engel, A., and Schartau, M. (1999). Influence of transparent exopolymer particles(TEP) on sinking velocity of Nitzschia closterium aggregates. Mar. Ecol. Prog.Ser. 182, 69–76. doi: 10.3354/meps182069
Feng, Y., Warner, M. E., Zhang, Y., Sun, J., Fu, F.-X., Rose, J. M., et al. (2008).Interactive effects of increased pCO2, temperature and irradiance on the marinecoccolithophore Emiliania huxleyi (Prymnesiophyceae). Eur. J. Phycol. 43,87–98. doi: 10.1080/09670260701664674
Gran, G. (1952). Determination of the equivalence point in potentiometrictitrations, part II. Analyst 77, 661–671. doi: 10.1039/an9527700661
Grossart, H. P., Kiørboe, T., Tang, K. W., Allgaier, M., Yam, E. M., and Ploug, H.(2006). Interactions between marine snow and heterotrophic bacteria: aggregateformation and microbial dynamics. Aquat. Microb. Ecol. 42, 19–26. doi: 10.3354/ame042019
Honjo, S., Manganini, S. J., Krishfield, R. A., and Francois, R. (2008). Particulateorganic carbon fluxes to the ocean interior and factors controlling the biologicalpump: a synthesis of global sediment trap programs since 1983. Prog. Oceanogr.76, 217–285. doi: 10.1016/j.pocean.2007.11.003
IPCC (2014). Climate Change 2014: Synthesis Report. Contribution of WorkingGroups I, II and III to the Fifth Assessment Report of the Intergovernmental Panelon Climate Change, eds R. Pachauri and L. Meyer (Geneva: IPCC).
Iversen, M. H., and Ploug, H. (2010). Ballast minerals and the sinking carbon fluxin the ocean: carbon-specific respiration rates and sinking velocity of marinesnow aggregates. Biogeosciences 7, 2613–2624. doi: 10.5194/bg-7-2613-2010
Iversen, M. H., and Ploug, H. (2013). Temperature effects on carbon-specific respiration rate and sinking velocity of diatom aggregates–potentialimplications for deep ocean export processes. Biogeosciences 10, 4073–4085.doi: 10.5194/bg-10-4073-2013
Jackson, G. A. (1990). A model of the formation of marine algal flocs by physicalcoagulation processes. Deep Sea Res. Part A Oceanogr. Res. Pap. 37, 1197–1211.doi: 10.1016/0198-0149(90)90038-W
Jackson, G. A. (2015). Coagulation in a rotating cylinder. Limnol. Oceanogr.Methods 13:e10018. doi: 10.1002/lom3.10018
Karl, D., Michaels, A., Bergman, B., Capone, D., Carpenter, E., Letelier, R., et al.(2002). “Dinitrogen fixation in the world’s oceans,” in The Nitrogen Cycle atRegional to Global Scales, eds E. W. Boyer and R. W. Howarth (Dordrecht:Springer), 47–98. doi: 10.1007/978-94-017-3405-9_2
Kim, J. M., Lee, K., Shin, K., Yang, E. J., Engel, A., Karl, D. M., et al. (2011).Shifts in biogenic carbon flow from particulate to dissolved forms under highcarbon dioxide and warm ocean conditions. Geophys. Res. Lett. 38:L08612.doi: 10.1029/2011GL047346
Kiørboe, T., Andersen, K. P., and Dam, H. G. (1990). Coagulation efficiency andaggregate formation in marine phytoplankton. Mar. Biol. 107, 235–245. doi:10.1007/BF01319822
Klaas, C., and Archer, D. E. (2002). Association of sinking organic matter withvarious types of mineral ballast in the deep sea: implications for the rain ratio.Glob. Biogeochem. Cycles 16, 63-1–63-14. doi: 10.1029/2001GB001765
Laurenceau-Cornec, E. C., Trull, T. W., Davies, D. M., Bray, S. G., Doran, J.,Planchon, F., et al. (2015). The relative importance of phytoplanktonaggregates and zooplankton fecal pellets to carbon export: insights from free-drifting sediment trap deployments in naturally iron-fertilised waters nearthe Kerguelen Plateau. Biogeosciences 12, 1007–1027. doi: 10.5194/bg-12-1007-2015
Frontiers in Marine Science | www.frontiersin.org 15 January 2019 | Volume 5 | Article 500

fmars-05-00500 December 26, 2018 Time: 17:30 # 16
Cisternas-Novoa et al. Future Ocean Effects on Marine Aggregates
Lewis, E., Wallace, D., and Allison, L. J. (1998). Program Developed for CO2 SystemCalculations. Oak Ridge, TN: Oak Ridge National Laboratory. doi: 10.2172/639712
Logan, B. E., Passow, U., Alldredge, A. L., Grossartt, H.-P., and Simont, M. (1995).Rapid formation and sedimentation of large aggregates is predictable fromcoagulation rates (half-lives) of transparent exopolymer particles (TEP). DeepSea Res. Part II Top. Stud. Oceanogr. 42, 203–214. doi: 10.1016/0967-0645(95)00012-F
Long, R. A., and Azam, F. (1996). Abundant protein-containing particles in the sea.Aquat. Microb. Ecol. 10, 213–221. doi: 10.3354/ame010213
Mantoura, R. F. C., and Llewellyn, C. A. (1983). The rapid determination of algalchlorophyll and carotenoid pigments and their breakdown products in naturalwaters by reverse-phase high-performance liquid chromatography. Anal. Chim.Acta 151, 297–314. doi: 10.1016/S0003-2670(00)80092-6
Mari, X., Passow, U., Migon, C., Burd, A. B., and Legendre, L. (2017). Transparentexopolymer particles: effects on carbon cycling in the ocean. Prog. Oceanogr.151, 13–37. doi: 10.1016/j.pocean.2016.11.002
Maugendre, L., Gattuso, J. P., De Kluijver, A., Soetaert, K., Van Oevelen, D.,Middelburg, J. J., et al. (2017a). Carbon-13 labelling shows no effect of oceanacidification on carbon transfer in Mediterranean plankton communities.Estuar. Coast. Shelf Sci. 186, 100–111. doi: 10.1016/j.ecss.2015.12.018
Maugendre, L., Gattuso, J. P., Poulton, A. J., Dellisanti, W., Gaubert, M.,Guieu, C., et al. (2017b). No detectable effect of ocean acidification on planktonmetabolism in the NW oligotrophic Mediterranean Sea: results from twomesocosm studies. Estuar. Coast. Shelf Sci. 186(Part A), 89–99.
Maugendre, L., Gattuso, J.-P., Louis, J., De Kluijver, A., Marro, S., Soetaert, K., et al.(2015). Effect of ocean warming and acidification on a plankton community inthe NW Mediterranean Sea. ICES J. Mar. Sci. 72:fsu161. doi: 10.1093/icesjms/fsu161
Nemzer, B. V., and Dickson, A. G. (2005). The stability and reproducibility of Trisbuffers in synthetic seawater. Mar. Chem. 96, 237–242. doi: 10.1016/j.marchem.2005.01.004
Parsons, T. R., Maita, Y., and Lalli, C. M. (eds). (1984). “1.1 - determination ofnitrate,” in A Manual of Chemical & Biological Methods for Seawater Analysis,(Amsterdam: Pergamon Press), 3–7. doi: 10.1016/B978-0-08-030287-4.50010-4
Passow, U. (2002). Transparent exopolymer particles (TEP) in aquaticenvironments. Prog. Oceanogr. 55, 287–333. doi: 10.1016/S0079-6611(02)00138-6
Passow, U. (2012). The abiotic formation of TEP under different ocean acidificationscenarios. Mar. Chem. 128–129, 72–80. doi: 10.1371/journal.pone.0171980
Passow, U., and Alldredge, A. L. (1995a). A dye-binding assay for thespectrophotometric measurement of transparent exopolymer particles (TEP).Limnol. Oceanogr. 40, 1326–1335. doi: 10.1016/j.watres.2014.12.012
Passow, U., and Alldredge, A. L. (1995b). Aggregation of a diatom bloom ina mesocosm: the role of transparent exopolymer particles (TEP). Deep SeaRes. Part II Top. Stud. Oceanogr. 42, 99–109. doi: 10.1016/0967-0645(95)00006-C
Passow, U., De La Rocha, C. L., Fairfield, C., and Schmidt, K. (2014). Aggregationas a function of and mineral particles. Limnol. Oceanogr. 59, 532–547. doi:10.4319/lo.2014.59.2.0532
Passow, U., and Laws, E. A. (2015). Ocean acidification as one of multiple stressors:growth response of Thalassiosira weissflogii (diatom) under temperature andlight stress. Mar. Ecol. Prog. Ser. 541, 75–90. doi: 10.3354/meps11541
Paul, C., Matthiessen, B., and Sommer, U. (2015). Warming, but not enhanced CO2concentration, quantitatively and qualitatively affects phytoplankton biomass.Mar. Ecol. Prog. Ser. 528, 39–51. doi: 10.3354/meps11264
Paul, C., Sommer, U., Garzke, J., Moustaka-Gouni, M., Paul, A., and Matthiessen, B.(2016). Effects of increased CO2 concentration on nutrient limited coastalsummer plankton depend on temperature. Limnol. Oceanogr. 61, 853–868.doi: 10.1002/lno.10256
Piontek, J., Händel, N., Langer, G., Wohlers, J., Riebesell, U., and Engel, A. (2009).Effects of rising temperature on the formation and microbial degradation ofmarine diatom aggregates. Aquat. Microb. Ecol. 54, 305–318. doi: 10.1371/journal.pone.0090749
Ploug, H., Hietanen, S., and Kuparinen, J. (2002). Diffusion and advectionwithin and around sinking, porous diatom aggregates. Limnol. Oceanogr. 47,1129–1136. doi: 10.4319/lo.2002.47.4.1129
Ploug, H., Terbrüggen, A., Kaufmann, A., Wolf-Gladrow, D., and Passow, U.(2010). A novel method to measure particle sinking velocity in vitro, and itscomparison to three other in vitro methods. Limnol. Oceanogr. Methods 8,386–393. doi: 10.4319/lom.2010.8.386
Prieto, L., Ruiz, J., Echevarrı ìa, F., Garcı ìa, C. M., Bartual, A., Gálvez, J. A.,et al. (2002). Scales and processes in the aggregation of diatom blooms: hightime resolution and wide size range records in a mesocosm study. Deep SeaRes. Part I Oceanogr. Res. Pap. 49, 1233–1253. doi: 10.1016/S0967-0637(02)00024-9
Riebesell, U., Schulz, K. G., Bellerby, R. G. J., Botros, M., Fritsche, P.,Meyerhöfer, M., et al. (2007). Enhanced biological carbon consumptionin a high CO2 ocean. Nature 450, 545–548. doi: 10.1038/nature06267
Riebesell, U., Zondervan, I., Rost, B., Tortell, P. D., Zeebe, R. E., and Morel, F. M. M.(2000). Reduced calcification of marine plankton in response to increasedatmospheric CO2. Nature 407, 364–367. doi: 10.1038/35030078
Rost, B., Zondervan, I., and Wolf-Gladrow, D. (2008). Sensitivity of phytoplanktonto future changes in ocean carbonate chemistry current knowledge,contradictions, and research directions. Mar. Ecol. Prog. Ser. 373, 227–238.doi: 10.3354/meps07776
Sabine, C. L., Feely, R. A., Gruber, N., Key, R. M., Lee, K., Bullister, J. L., et al.(2004). The oceanic sink for anthropogenic CO2. Science 305, 367–371. doi:10.1126/science.1097403
Schulz, K. G., Bach, L. T., Bellerby, R. G. J., Bermúdez, R., Büdenbender, J.,Boxhammer, T., et al. (2017). Phytoplankton blooms at increasing levels ofatmospheric carbon dioxide: experimental evidence for negative effects onprymnesiophytes and positive on small picoeukaryotes. Front. Mar. Sci. 4:64.doi: 10.3389/fmars.2017.00064
Schulz, K. G., Riebesell, U., Bellerby, R. G. J., Biswas, H., Meyerhöfer, M., Müller,M. N., et al. (2008). Build-up and decline of organic matter during PeECE III.Biogeosciences 5, 707–718. doi: 10.5194/bg-5-707-2008
Seebah, S., Fairfield, C., Ullrich, M. S., and Passow, U. (2014). Aggregation andsedimentation of Thalassiosira weissflogii (diatom) in a warmer and moreacidified future ocean. PLoS One 9:e112379. doi: 10.1371/journal.pone.0112379
Shanks, A. L., and Edmondson, E. W. (1989). Laboratory-made artificial marinesnow: a biological model of the real thing. Mar. Biol. 101, 463–470. doi: 10.1007/BF00541648
Sieracki, C. K., Sieracki, M., and Yentsch, C. S. (1998). An imaging-in-flow systemfor automated analysis of marine microplankton. Mar. Ecol. Prog. Ser. 168,285–296. doi: 10.3354/meps168285
Sommer, U., Paul, C., and Moustaka-Gouni, M. (2015). Warming and oceanacidification effects on phytoplankton—from species shifts to size shifts withinspecies in a mesocosm experiment. PLoS One 10:e0125239. doi: 10.1371/journal.pone.0125239
Stange, P., Taucher, J., Bach, L. T., Algueró-Muñiz, M., Horn, H. G., Krebs, L.,et al. (2018). Ocean acidification-induced restructuring of the plankton foodweb can influence the degradation of sinking particles. Front. Mar. Sci. 5:140.doi: 10.3389/fmars.2018.00140
Stemmann, L., Jackson, G. A., and Ianson, D. (2004). A vertical model of particlesize distributions and fluxes in the midwater column that includes biologicaland physical processes—Part I: model formulation. Deep Sea Res. Part IOceanogr. Res. Pap. 51, 865–884. doi: 10.1016/j.dsr.2004.03.001
Sun, M., Aller, R. C., and Lee, C. (1991). Early diagenesis of chlorophyll-a inLong Island Sound sediments: a measure of carbon flux and particle reworking.J. Mar. Res. 49, 379–401. doi: 10.1357/002224091784995927
Taucher, J., Jones, J., James, A., Brzezinski, M. A., Carlson, C. A., Riebesell, U.,et al. (2015). Combined effects of CO2 and temperature on carbon uptake andpartitioning by the marine diatoms Thalassiosira weissflogii and Dactyliosolenfragilissimus. Limnol. Oceanogr. 60, 901–919. doi: 10.1002/lno.10063
Thornton, D. C. O. (2002). Diatom aggregation in the sea: mechanismsand ecological implications. Eur. J. Phycol. 37, 149–161. doi: 10.1017/S0967026202003657
Turner, J. T. (2015). Zooplankton fecal pellets, marine snow, phytodetritus and theocean’s biological pump. Prog. Oceanogr. 130, 205–248. doi: 10.1016/j.pocean.2014.08.005
Verdugo, P. (2012). Marine microgels. Annu. Rev. Mar. Sci. 4, 375–400. doi: 10.1146/annurev-marine-120709-142759
Frontiers in Marine Science | www.frontiersin.org 16 January 2019 | Volume 5 | Article 500

fmars-05-00500 December 26, 2018 Time: 17:30 # 17
Cisternas-Novoa et al. Future Ocean Effects on Marine Aggregates
Wohlers, J., Engel, A., Zöllner, E., Breithaupt, P., Jürgens, K., Hoppe, H.-G., et al.(2009). Changes in biogenic carbon flow in response to sea surface warming.Proc. Natl. Acad. Sci. U.S.A. 106, 7067–7072. doi: 10.1073/pnas.0812743106
Conflict of Interest Statement: The authors declare that the research wasconducted in the absence of any commercial or financial relationships that couldbe construed as a potential conflict of interest.
Copyright © 2019 Cisternas-Novoa, Lee, Tang, de Jesus and Engel. This is an open-access article distributed under the terms of the Creative Commons AttributionLicense (CC BY). The use, distribution or reproduction in other forums is permitted,provided the original author(s) and the copyright owner(s) are credited and that theoriginal publication in this journal is cited, in accordance with accepted academicpractice. No use, distribution or reproduction is permitted which does not complywith these terms.
Frontiers in Marine Science | www.frontiersin.org 17 January 2019 | Volume 5 | Article 500