effects of high pressure co 2 organic rock … · w ill d i tifi d i i if ti t tif bli ft how...
TRANSCRIPT

EFFECTS OF HIGH PRESSURE CO2-ORGANIC ROCK INTERACTIONS ON THEORGANIC ROCK INTERACTIONS ON THE
POTENTIAL SEQUESTRATION OF CO2
Richard D WestRichard D. WestGediminas Markevicius
Vivak (Vik) MalhotraSouthern Illinois University-Carbondale
Carbondale, Illinois

Our project, which was initiated in December 2009, is more directed towards evaluating potential risks, if any,
h hi h CO i i j t d i t d iwhen high pressure CO2 is injected into deep organic rocks
Equilibrium conditions(lots of published work)
Non-equilibrium conditions(not much published)
Who is supporting this research!!!
US-DOE (NETL)( )$300 K
Southern Illinois Universityt f VM’ ti d f iliti
Illinois Clean Coal Institute$25 Kpart of VM’s time and facilities $25 K

Background:Interactions between various ranked coals or organic shale with CO2 are complex and not well understoodPotential risks associated with CO2 storage in organic rocks are seldom evaluated under plausible but extreme transient conditions
Most risk assessments are typically accomplished under equilibrium conditionsMost risk assessments are typically accomplished under equilibrium conditionsHowever, under non-equilibrium conditions (whether natural, seismic, or manmade) there could be serious implications for the re-emission of CO2 storedin organic rocks
W ill d i tifi d i i i f ti t ti f bli f t
How Potential Outcomes Could Help in Evaluating Risk Assessment:
We will need scientific and engineering information to satisfy public safety concerns
How the interactions between organic rocks and CO2 affect the strength oforganic rocks Whether these interactions pose potential stability issues, especially under high CO2 pressure (< 27.6 MPa pr 4000 psi)Wh th CO t t d i k i di t i ifi t l k f COWhether CO2-saturated organic rocks indicate any significant leakage of CO2over time when placed under typical overburden stressesHow shock pressure waves in CO2-saturated organic rocks control theinteractions between adsorbed and/or absorbed CO2 and rocksinteractions between adsorbed and/or absorbed CO2 and rocks

OUR SAMPLE SOURCESIllinois State Geological Survey (Dr. David Morse):g y ( )
3” Houchin Creek Coal Core (~ 305.5 m or 1002.4 ft)3” Houchin Creek Coal Core (~ 305.2 m or 1001.4 ft)3” Danville Coal Core (232.4 m or 762.5 ft)3” Herrin Coal 4 Core (241 m or 792 5 ft)3 Herrin Coal-4 Core (241 m or 792.5 ft)3” Well A-2 Seeleyville Coal Core (349.2 m or 1145.7 ft)Mt. Simon Sandstone Peoples Energy Hazen #5 well (1233 m or 4046 ft)New Albany Shale Meadowlark
Knight Hawk Mining CompanyIllinois #2 (Murphysboro seam)
Indian State Geological Survey:Shale Shady (133.5 m or 438 ft)Springfield Gibson Co., IN (137.9 m or 452.5 ft)
Professor Satya HarpalaniSan Juan Coal (~ 137.2 m or 450 ft)
Argonne Premium SamplesArgonne Premium SamplesWyodak SubbituminousNorth Dakota Lignite

PresentationPresentation•Coal grabs CO2, diffuses, swells, etc. How fast CO2 is
itt d?re-emitted?
•Mechanical properties: Do we need to be concerned about p ponly fractures, cleats, defects, etc. coal is very inhomogenous what about coal’s chemical structure controlling the mechanical behavior?controlling the mechanical behavior?
•Are there any glass-transition(s) in coal and organic shale d bi t diti ?under ambient conditions?
•How pressurization with CO2 affects coal’s properties 2are there any potential concerns?

Re-emission of pressurized CO2

Some Baseline Data: How fast CO2 empties from Illinois Coal at ambienttemperature and pressure
3.0 {wt. loss (%) = - 0.097 + 1.604 (1 – e-0.077t) + 1.929 (1 – e-0.014t)}
oss
2.0
2.5
Houchin Creek (Illinois) coal pressurized with
Wei
ght L
o
1.5
Houchin Creek (Illinois) coal pressurized with 13.8 MPa (2000 psi) of CO2
% W
1.0 Illinois #2 seam coal pressurized withat 0.62 MPa (90 psi) of CO2
0 20 40 60 80 100 1200.0
0.5
Time (min.)0 20 40 60 80 100 120

3 Houchin Creek (~1000 ft depth)Coal: TGA results
Control Samplegh
t los
s (%
)
2
Coa G esu ts
Heated up to 300oC @ 5oC/min. (wt. loss = 3.1)
Wei
g
0
1
ambient temp. & pressure(wt. loss %= 0.1)
Time (min)0 20 40 60 80 100 120
0
5
6
Sample pressurized with 13.8 MPa of CO2
ht L
oss
(%)
3
4
2
ambient temp. & pressure(wt. loss % = 2.6)
Wei
gh
1
2
Heated up to 300oC @ 5oC/min.(wt. loss % = 3.3)
Time (min)0 20 40 60 80 100 120
0

Mechanical Properties: Flexural Mode
A large number of coal strips extracted with the help of a highA large number of coal strips extracted with the help of a high precision, programmable diamond rotatory saw strips generated from a single chunk of coal
Strips examined under optical microscope if visible cleats and fracture(s) observed samples rejected only visible defect -free samples subjected to mechanical properties analysesfree samples subjected to mechanical properties analyses

10
12
Coal Strip #2Coal Strip #3Coal Strip #7
12
Mechanical Behavior of Illinois #2 coalunder N2
ess
(MPa
)
6
8
Coal Strip #9
Flexural Strength: 6.5 ± 2.3 MPaFlexural Modulus: 1.9 ± 0.3 GPa
a) 8
10
12Coal Strip #1Coal Strip #6Coal Strip #10
Stre
2
4
Stre
ss (M
Pa
4
6
Strain (%)0.0 0.1 0.2 0.3 0.4 0.5
0
Strain (%)0.0 0.1 0.2 0.3 0.4 0.5
0
2 Flexural Strength: 10.7 ± 1.2 MPaFlexural Modulus: 3.0 ± 0.4 GPa
12Coal Strip #8
Strain (%)
(MPa
)6
8
10 Flexural Strength: 2.8 MPaFlexural Modulus: 0.7 GPa
Stre
ss
2
4
6
Strain (%)0.0 0.1 0.2 0.3 0.4 0.5
0

A
o
4(2991-2750)/(950-717)(1528-1360)/(950-717)(1316 1114)/(950 717)
FTIR results on the coal strips which underwent mechanical testing
Strip #2
B
nten
sity
Rat
io
2
3
(1316-1114)/(950-717)(589-441)/(950-717)(2991-2750)/(1766-1528)
Strip #8
C
Vibr
atio
nal I
n
1
2
Strip #10
Frequency (cm-1)Flexural Strength (MPa)
2 4 6 8 10 12
V
0
5(2991-2750)/(950-717)
ensi
ty R
atio
3
4
(1528-1360)/(950-717)(1316-1114)/(950-717)(589-441)/(950-717)(2991-2750)/(1766-1528)
Vibr
atio
nal I
nte
1
2
Modulus (GPa)0 1 2 3 4
V
0

Houchin Creek Coal Core (~ 1000 ft)
6
7
Coal Strip #4Coal Strip #5Coal Strip #6Coal Strip #7 D th l h th
s (M
Pa)
4
5
Coal Strip #7Coal Strip #8 Do other coals show the
same behavior?
Stre
ss
2
3
Strain (%)0.0 0.1 0.2 0.3 0.4
0
1
Strain (%)Sample
IDFlexural Strength
(MPa)
Modulus(GPa)
HC Strip #4 6.10 1.78HC Strip #5 5.14 1.94HC Strip #6 5 08 1 40HC Strip #6 5.08 1.40HC Strip #7 6.31 2.62HC Strip #8 5.74 2.67

Mechanical Behavior of Brown Coal: compressive mode
Figure from : Viete and Ranjith International Journal of Coal GeologyFigure from : Viete and Ranjith, International Journal of Coal Geology66, 204 (2006)
Effects of high pressure CO2 on Coalg p 2
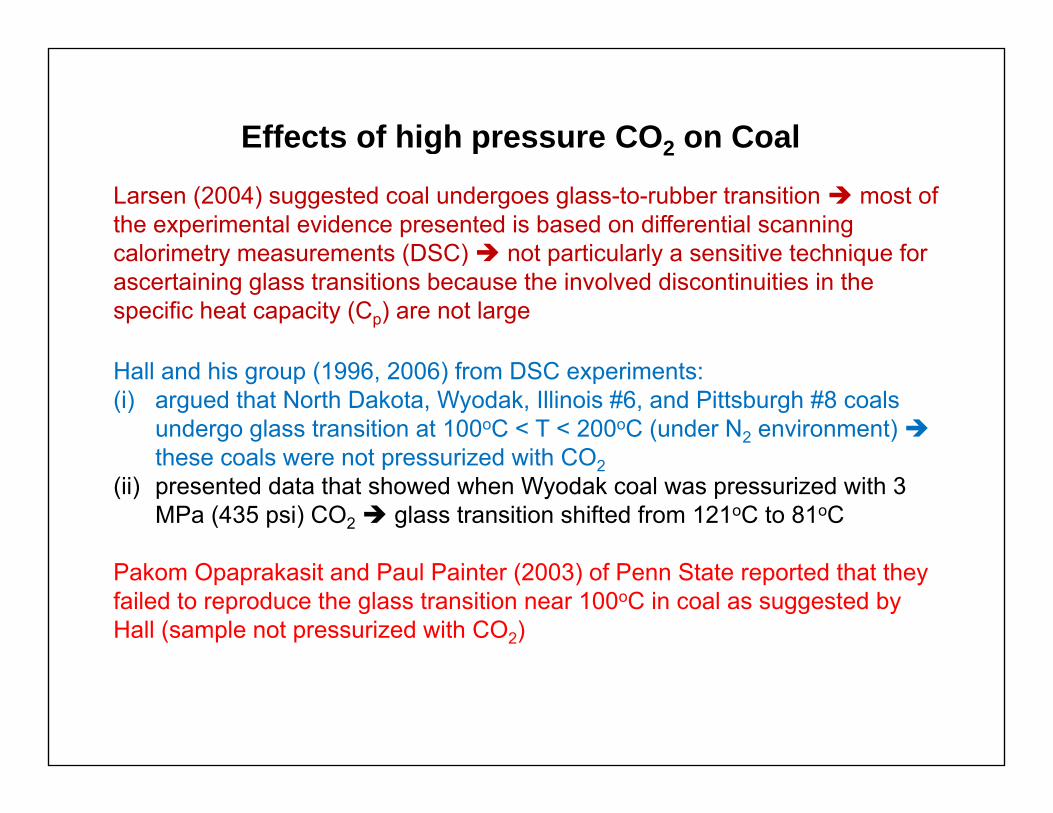
Larsen (2004) suggested coal undergoes glass-to-rubber transition most of the experimental evidence presented is based on differential scanning calorimetry measurements (DSC) not particularly a sensitive technique forcalorimetry measurements (DSC) not particularly a sensitive technique for ascertaining glass transitions because the involved discontinuities in the specific heat capacity (Cp) are not large
Hall and his group (1996, 2006) from DSC experiments:(i) argued that North Dakota, Wyodak, Illinois #6, and Pittsburgh #8 coals
undergo glass transition at 100oC < T < 200oC (under N2 environment) these coals were not pressurized with COthese coals were not pressurized with CO2
(ii) presented data that showed when Wyodak coal was pressurized with 3 MPa (435 psi) CO2 glass transition shifted from 121oC to 81oC
Pakom Opaprakasit and Paul Painter (2003) of Penn State reported that they failed to reproduce the glass transition near 100oC in coal as suggested by Hall (sample not pressurized with CO2)

Thermodynamic Transition
First‐Order Second‐order
Abrupt change inenthalpy (H) orvolume (V)t t iti
Change in the first derivative ofH or V at transition
at transition
Change in thespecific heat capacity (CP) and
th l i ffi i t ( )
VandHC
1
thermal expansion coefficient (), i.e.,
Glass‐Transition (Tg) can be considered as a second‐order
PPP TV
andT
C
considered as a second‐order transition, though it strictly does not meet the rigors of second‐order thermodynamic critique

Calorimetry is a technique for determining the quantity of heat that is either
What differential scanning calorimetry (DSC) can do for us?
y q g q yabsorbed or released by a substance undergoing a physical or chemical change. Such a change alters the internal energy of the substance. At constant pressure, the internal energy is known as enthalpy, H.
dTCH PThe change in enthalpy H between two states:
Melting, evaporation, or glass transition increases enthalpy endothermic reactions
Crystallization, progressive curing, or decomposition lowers enthalpy exothermic reactions
Thermal transitions as ascertained by a power compensated DSC system

Glass Transition
Data from Perkin‐Elmer Technical notes

Data from Perkin‐Elmer Technical notes

Mirzaeian and Hall {2006}: Glass transition in Coal [DSC Results]
N2 N2
COCO2CO2
2
Wyodak CoalIllinois #6 Coal

To Fume Hood
CO2 in
N2 in
Flow N2tank
Flow meter
Pressure CellExhaust CO2
tank
Pressure relief valve
tank
Our high pressure DSC system capable of thermal measurement under various gas environments at ambient pressure ≤ P ≤ 650 psi and at 25oC ≤ T ≤ 725oC.
( ) ( )s rs r
dQ dQ dTC Cdt dt dt
dt dt dt

Our DSC Results(not in-situ measurements)
(a)Illinois #2 seam coal {not exposed toCO2}: a first run;b re ran after run a;
H2O evaporation (bulk)
(b)
(c)
b re-ran after run a;c re-ran after run b
Temperature (oC)
Houchin Creek (Illinois) pressurizedwith 13.8 MPa (2000 psi) of CO2:a first run;a first run;b re-ran after run a (a)
(b)
Temperature (oC)

Our DSC Results: Wyodak Coal
(a) 1st run(b)(b) Re-ran after run a
(c) Re-ran after run b
(a)
(c)
Temperature (oC)
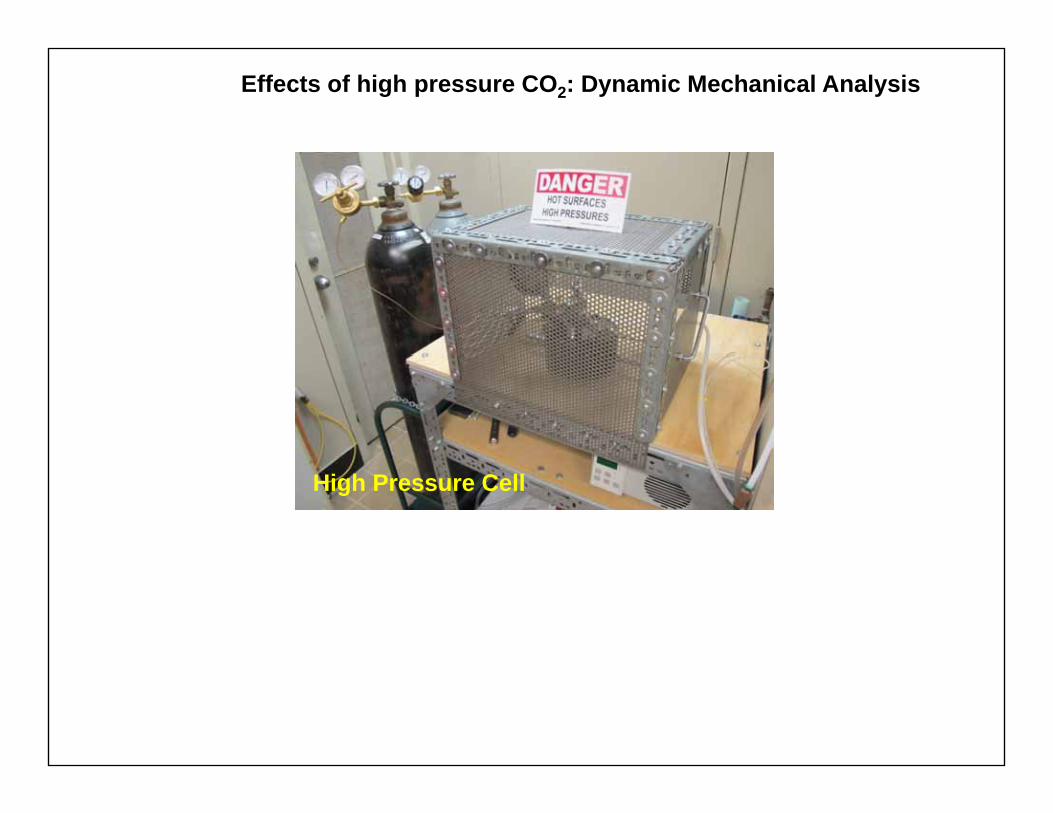
Effects of high pressure CO2: Dynamic Mechanical Analysis
High Pressure Cell

Applied ForceDYNAMIC MECHANICAL ANALYZER (DMA)
db
LSupport
Dynamic mechanical analysis (DMA) involves the measurement of theDynamic mechanical analysis (DMA) involves the measurement of the response of a material to a sinusoidally oscillating stress.
''')sin(cos* 0 iEEiE
)](exp[0 ti]exp[0 ti
)sin(cos0
iEEiE
( '')tan( ')
Loss Modulus EStorage Modulus E
( ')Storage Modulus E
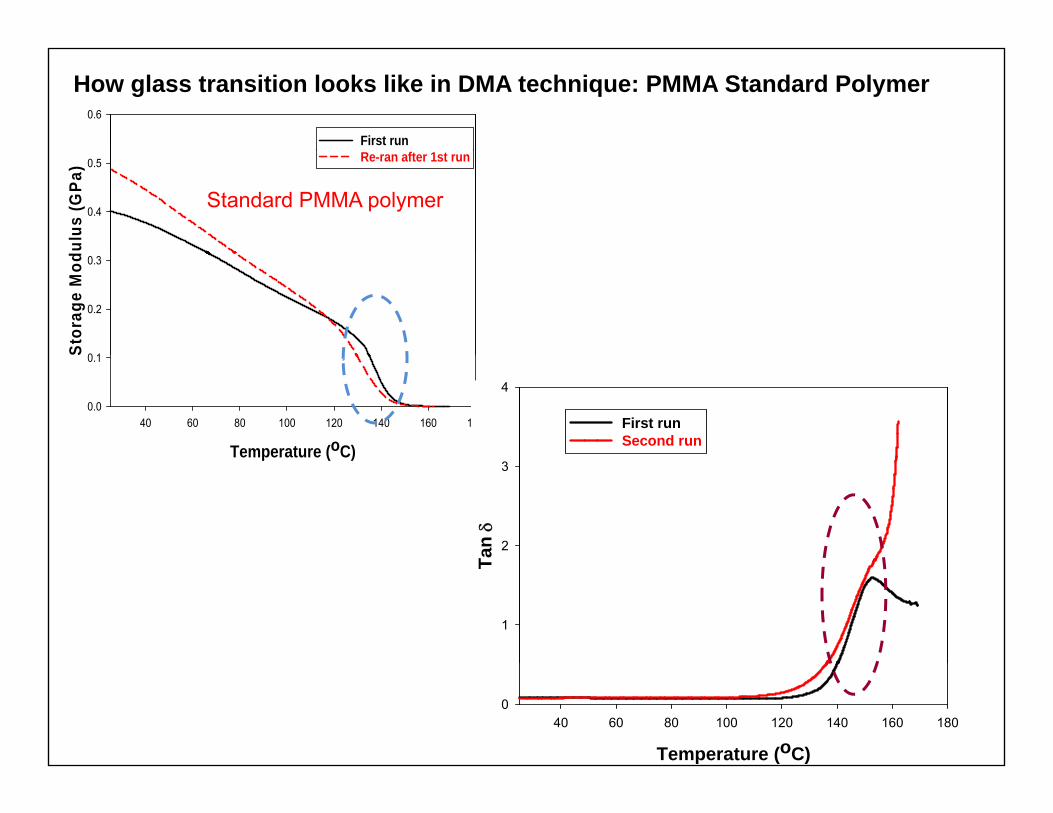
DMA 100 times more sensitive technique than DSC for glass transitions

DMA 7OUROURDMA
SYSTEMS
Seiko DMADMA 8000

0.6
First run
How glass transition looks like in DMA technique: PMMA Standard Polymerul
us (G
Pa)
0.4
0.5 Re-ran after 1st run
Standard PMMA polymer
Stor
age
Mod
0 1
0.2
0.3
Temperature (oC)
40 60 80 100 120 140 160 1800.0
0.1
4
First runSecond runp ( )
Tan
2
3T
1
Temperature (oC)
40 60 80 100 120 140 160 1800

Dynamic Mechanical Analysis (DMA) Results:Any Glass transition in unprocessed coal?
1.8
Illinois #2 Coal(coal strips were not vacuum dried
or pressurized with CO2)G
Pa) 1.7
1st runre-ran after 1st run
odul
us (G
1.5
1.6
Stor
age
M
1.4
50 100 150 200 250
S
1.2
1.3
Temperature (oC)50 100 150 200 250

Dynamic Mechanical Analysis (DMA) Results: CO2 effects
1 2
0 8
1.0
1.21st run2nd run after 1st run
Houchin Creek (Illinois) – 3.45 MPa (500 psi) CO2Ta
n
0.6
0.8
0.2
0.4
Temperature (oC)50 100 150 200 250 300 350
0.0

Dynamic Mechanical Analysis (DMA-8000) Results: CO2 effects
Houchin Creek Coal Core (~ 1000 ft) 0.012
Blank-No coalPressurized 13.8 MPa (2000 psi) CO2
Pressurized 20.7 MPa (3000 psi) CO2
0.010
( p ) 2
Tan
0.008
0.006
-100 -50 0 50 100 150 2000.004
Tg(2000 psi)
Tg(3000 psi)
Temperature (oC)Carbonated Pore water Mu and Malhotra: Phys. Rev. B
(1991 and 1992)

Dynamic Mechanical Analysis (DMA-7) Results: CO2 effects
Houchin Creek Coal Core (~ 1000 ft)
Temperature (oC)
0.2550 100 150 200
6.0
ouc C ee Coa Co e ( 000 t)
0.20
0.25
5.0
5.5
6.0Control Coal (No CO2)10.3 MPa (1500 psi) CO2
13.8 MPa (2000 psi) CO2
20.7 MPa (3000 psi) CO2
an 0.15
Tan 4.0
4.5
0 a (3000 ps ) CO2
Ta
0.10
3.0
3.5
0.05
2.0
2.5
50 100 150 200
Temperature (oC)

0.018
Dynamic Mechanical Analysis (DMA-8000) Results: CO2 effects
0.016Wyodak (CO2: 13.8 MPa or 2000 psi)Houchin Creek-IL (CO2: 13.8 MPa or 2000 psi)San Juan (CO2: 13.8 MPa or 2000 psi)
0 012
0.014
Tan
0.010
0.012
0.008
o-100 -50 0 50 100 150 200
0.006
Temperature (oC)

Are there variabilities (macro and micro) in the mechanical strength of
Highlightse t e e a ab t es ( ac o a d c o) t e ec a ca st e gt o
Illinois coal which may pose a problem with CO2 sequestration we did observe large variations independent of defects needs to be taken into accountUnder ambient conditions, i.e., when coal samples were not pressurized with CO2, we did not observe any glass transition in any of the coals (Houchin Creek, Illinois #2, Wyodak, or San Juan) contrary t th DSC lt f Mi i d H ll (2006)to the DSC results of Mirzaeian and Hall (2006)We also did not observe any glass transition when coals were pressurized with low pressure (< 3.45 or 500 psi) CO2 Mirzaeian & Hall reported a different outcomeHall reported a different outcomeOur DMA results show when Houchin Creek, Wyodak, and San Juan coals were pressurized with 10.3 MPa (1500 psi) ≤ P ≤ 20.7 MPa (3000 psi) CO2 all three coals showed glass transition at ~ 40oC (113oF) < Tpsi) CO2 all three coals showed glass transition at 40 C (113 F) < T < ~ 80oC (176oC) a lot of molecular mobility could be a potential risk

Contact Information
If you have any questions or would be interestedIf you have any questions or would be interested in collaboration, please contact:
Vik MalhotraVik Malhotra
phone: 618‐453‐5166
E‐mail: [email protected]

Mechanical Behavior of Brown Coal: compressive mode
Figure from : Viete and Ranjith International Journal of Coal GeologyFigure from : Viete and Ranjith, International Journal of Coal Geology66, 204 (2006)

Effects of high pressure CO2 on Coalg p 2
Larsen (2004) suggested coal undergoes glass-to-rubber transition most of the experimental evidence presented is based on differential scanning calorimetry measurements (DSC) not particularly a sensitive technique forcalorimetry measurements (DSC) not particularly a sensitive technique for ascertaining glass transitions because the involved discontinuities in the specific heat capacity (Cp) are not large
Hall and his group (1996, 2006) from DSC experiments:(i) argued that North Dakota, Wyodak, Illinois #6, and Pittsburgh #8 coals
undergo glass transition at 100oC < T < 200oC (under N2 environment) these coals were not pressurized with COthese coals were not pressurized with CO2
(ii) presented data that showed when Wyodak coal was pressurized with 3 MPa (435 psi) CO2 glass transition shifted from 121oC to 81oC
Pakom Opaprakasit and Paul Painter (2003) of Penn State reported that they failed to reproduce the glass transition near 100oC in coal as suggested by Hall (sample not pressurized with CO2)

Thermodynamic Transition
First‐Order Second‐order
Abrupt change inenthalpy (H) orvolume (V)t t iti
Change in the first derivative ofH or V at transition
at transition
Change in thespecific heat capacity (CP) and
th l i ffi i t ( )
VandHC
1
thermal expansion coefficient (), i.e.,
Glass‐Transition (Tg) can be considered as a second‐order
PPP TV
andT
C
considered as a second‐order transition, though it strictly does not meet the rigors of second‐order thermodynamic critique

Calorimetry is a technique for determining the quantity of heat that is either
What differential scanning calorimetry (DSC) can do for us?
y q g q yabsorbed or released by a substance undergoing a physical or chemical change. Such a change alters the internal energy of the substance. At constant pressure, the internal energy is known as enthalpy, H.
dTCH PThe change in enthalpy H between two states:
Melting, evaporation, or glass transition increases enthalpy endothermic reactions
Crystallization, progressive curing, or decomposition lowers enthalpy exothermic reactions
Thermal transitions as ascertained by a power compensated DSC system

Glass Transition
Data from Perkin‐Elmer Technical notes

Data from Perkin‐Elmer Technical notes

Mirzaeian and Hall {2006}: Glass transition in Coal [DSC Results]
N2 N2
COCO2CO2
2
Wyodak CoalIllinois #6 Coal

To Fume Hood
CO2 in
N2 in
Flow N2tank
Flow meter
Pressure CellExhaust CO2
tank
Pressure relief valve
tank
Our high pressure DSC system capable of thermal measurement under various gas environments at ambient pressure ≤ P ≤ 650 psi and at 25oC ≤ T ≤ 725oC.
( ) ( )s rs r
dQ dQ dTC Cdt dt dt
dt dt dt

Our DSC Results(not in-situ measurements)
(a)Illinois #2 seam coal {not exposed toCO2}: a first run;b re ran after run a;
H2O evaporation (bulk)
(b)
(c)
b re-ran after run a;c re-ran after run b
Temperature (oC)
Houchin Creek (Illinois) pressurizedwith 13.8 MPa (2000 psi) of CO2:a first run;a first run;b re-ran after run a (a)
(b)
Temperature (oC)

Our DSC Results: Wyodak Coal
(a) 1st run(b)(b) Re-ran after run a
(c) Re-ran after run b
(a)
(c)
Temperature (oC)

Effects of high pressure CO2: Dynamic Mechanical Analysis
High Pressure Cell

Applied ForceDYNAMIC MECHANICAL ANALYZER (DMA)
db
LSupport
Dynamic mechanical analysis (DMA) involves the measurement of theDynamic mechanical analysis (DMA) involves the measurement of the response of a material to a sinusoidally oscillating stress.
''')sin(cos* 0 iEEiE
)](exp[0 ti]exp[0 ti
)sin(cos0
iEEiE
( '')tan( ')
Loss Modulus EStorage Modulus E
( ')Storage Modulus E
DMA 100 times more sensitive technique than DSC for glass transitions

DMA 7OUROURDMA
SYSTEMS
Seiko DMADMA 8000
0.6
First run
How glass transition looks like in DMA technique: PMMA Standard Polymerul
us (G
Pa)
0.4
0.5 Re-ran after 1st run
Standard PMMA polymer
Stor
age
Mod
0 1
0.2
0.3
Temperature (oC)
40 60 80 100 120 140 160 1800.0
0.1
4
First runSecond runp ( )
Tan
2
3T
1
Temperature (oC)
40 60 80 100 120 140 160 1800

Dynamic Mechanical Analysis (DMA) Results:Any Glass transition in unprocessed coal?
1.8
Illinois #2 Coal(coal strips were not vacuum dried
or pressurized with CO2)G
Pa) 1.7
1st runre-ran after 1st run
odul
us (G
1.5
1.6
Stor
age
M
1.4
50 100 150 200 250
S
1.2
1.3
Temperature (oC)50 100 150 200 250

Dynamic Mechanical Analysis (DMA) Results: CO2 effects
1 2
0 8
1.0
1.21st run2nd run after 1st run
Houchin Creek (Illinois) – 3.45 MPa (500 psi) CO2Ta
n
0.6
0.8
0.2
0.4
Temperature (oC)50 100 150 200 250 300 350
0.0

Dynamic Mechanical Analysis (DMA-8000) Results: CO2 effects
Houchin Creek Coal Core (~ 1000 ft) 0.012
Blank-No coalPressurized 13.8 MPa (2000 psi) CO2
Pressurized 20.7 MPa (3000 psi) CO2
0.010
( p ) 2
Tan
0.008
0.006
-100 -50 0 50 100 150 2000.004
Tg(2000 psi)
Tg(3000 psi)
Temperature (oC)Carbonated Pore water Mu and Malhotra: Phys. Rev. B
(1991 and 1992)

Dynamic Mechanical Analysis (DMA-7) Results: CO2 effects
Houchin Creek Coal Core (~ 1000 ft)
Temperature (oC)
0.2550 100 150 200
6.0
ouc C ee Coa Co e ( 000 t)
0.20
0.25
5.0
5.5
6.0Control Coal (No CO2)10.3 MPa (1500 psi) CO2
13.8 MPa (2000 psi) CO2
20.7 MPa (3000 psi) CO2
an 0.15
Tan 4.0
4.5
0 a (3000 ps ) CO2
Ta
0.10
3.0
3.5
0.05
2.0
2.5
50 100 150 200
Temperature (oC)

0.018
Dynamic Mechanical Analysis (DMA-8000) Results: CO2 effects
0.016Wyodak (CO2: 13.8 MPa or 2000 psi)Houchin Creek-IL (CO2: 13.8 MPa or 2000 psi)San Juan (CO2: 13.8 MPa or 2000 psi)
0 012
0.014
Tan
0.010
0.012
0.008
o-100 -50 0 50 100 150 200
0.006
Temperature (oC)

Are there variabilities (macro and micro) in the mechanical strength of
Highlightse t e e a ab t es ( ac o a d c o) t e ec a ca st e gt o
Illinois coal which may pose a problem with CO2 sequestration we did observe large variations independent of defects needs to be taken into accountUnder ambient conditions, i.e., when coal samples were not pressurized with CO2, we did not observe any glass transition in any of the coals (Houchin Creek, Illinois #2, Wyodak, or San Juan) contrary t th DSC lt f Mi i d H ll (2006)to the DSC results of Mirzaeian and Hall (2006)We also did not observe any glass transition when coals were pressurized with low pressure (< 3.45 or 500 psi) CO2 Mirzaeian & Hall reported a different outcomeHall reported a different outcomeOur DMA results show when Houchin Creek, Wyodak, and San Juan coals were pressurized with 10.3 MPa (1500 psi) ≤ P ≤ 20.7 MPa (3000 psi) CO2 all three coals showed glass transition at ~ 40oC (113oF) < Tpsi) CO2 all three coals showed glass transition at 40 C (113 F) < T < ~ 80oC (176oC) a lot of molecular mobility could be a potential risk

Contact Information
If you have any questions or would be interestedIf you have any questions or would be interested in collaboration, please contact:
Vik MalhotraVik Malhotra
phone: 618‐453‐5166
E‐mail: [email protected]