effects of gamification on participation and data quality...
TRANSCRIPT

- 1 -
Effects of Gamification on Participation and Data Quality in a Real-World Market Research Domain
Jared Cechanowicz1, Carl Gutwin1, Briana Brownell2, and Larry Goodfellow2 1University of Saskatchewan
Saskatoon, Saskatchewan, Canada {firstname.lastname}@usask.ca
2Insightrix Research Saskatoon, Saskatchewan, Canada
{firstname.lastname}@insightrix.com
ABSTRACT Gamification has become an increasingly popular way to improve user engagement and motivation, but there is currently a lack of empirical research to demonstrate that increased gamification provides these benefits. To help address this problem we designed three versions of a gamified market research survey and tested them alongside the established industry standard in a study of over 600 participants. We also highlight examples where game elements compromise respondent data, and provide design solutions that correct the problem without losing the motivational benefits of gamification.
Author Keywords Market research; games; gamification
ACM Classification Keywords H.5.m. Information interfaces (e.g., HCI): Miscellaneous.
INTRODUCTION Gamification, the use of game elements in non-game contexts [7], has become an increasingly popular way to improve user engagement and motivation in work-like tasks [34,28,9]. Some research indicates that gamification improves the intrinsic motivation of users [31,35], increases user participation [15,39,37], and provides a better user experience [11,13,26]. Such benefits are desirable to designers because the ultimate goal of gamification is often to get more from a user: more data (or any data at all), higher quality data, or increased frequency and duration of participation. Attempts have been made to identify game design patterns that result in increased motivation [9,18,34], but there is currently a lack of empirical research to determine what elements of gamification really work in the real world to increase user motivation or participation [22].
In some cases this lack of empirical analysis is the result of the novelty of the gamified system; that is, there are no versions of the system with different gamified elements, and thus no way to compare the effects of different approaches. In such cases studying the effect of gamification has been limited to design analysis [6,21,32], comparisons made to similar non-gamified systems [17,24],
or anecdotal evidence of non-gamified versions of the system which performed poorly [27,38]. While some work has been done to compare the effects of different game elements on motivation [13,15,22], there is much still to be done, since only a limited number of game-like elements and system domains have been tested, and since previous results are often limited to small groups and laboratory contexts [13]. This lack of empirical research presents a problem for designers, as it can be difficult to attribute the success of a gamified system to the inclusion of additional game elements or to any specific part of the gamification process. A number of questions related to the gamification of work-like tasks remain unanswered, such as: • does an increased level of gamification result in
increased motivation? • do the effects of gamification hold with real-world
participants who are experienced with the domain? • do demographic factors like age and gender affect the
motivational gains of gamification? • does experience with games change the effects? • does gamification compromise the quality of data
produced by users?
In order to examine these questions, we developed and studied a gamified system in a domain where non-gamified data-gathering instruments are well established: online market research surveys. A great deal of research in the area of advertising and branding allows for more standardized comparisons with existing survey questions [16,25], and industry respondent panels provide broad access to users who have varying levels of survey experience. We designed gamified versions of three question types typically used in market research surveys (image identification, slogan matching, and a five-second memory quiz), and then carried out a comparative study of three systems with different levels of gamification (the plain survey, a partially-gamified version with interactive game mechanics, and a fully-gamified version with theme, reward, challenge, and progress elements). The study involved more than 600 respondents from a real-world market-research participant panel.
Our study showed that both of the gamification approaches led to significantly higher levels of participation. People completed significantly more questions with the partially-gamified system (with interactive game mechanics) than with the plain survey, and significantly more questions with the full game than with the partial game. These results are
Permission to make digital or hard copies of all or part of this work for personal or classroom use is granted without fee provided that copies are not made or distributed for profit or commercial advantage and that copies bear this notice and the full citation on the first page. To copy otherwise, or republish, to post on servers or to redistribute to lists, requires prior specific permission and/or a fee. Gamification’13, October 2 – 4, 2013, Stratford, ON, Canada. Copyright 2013 ACM 978-1-XXXX-XXXX-X/XX/XX...$10.00.

- 2 -
the first to demonstrate the different and additive effects of different game elements on motivation and participation. In addition, the study showed that the positive effects of gamification on motivation were consistent across age, gender, tenure on the participant panel, and prior game experience. Furthermore, the data gathered from the three different versions of the system were similar (although with some important differences), suggesting that gamified data can be as good as what is collected from traditional surveys.
Our work makes three contributions. First, we provide real-world empirical evidence of the effects of two gamification approaches: we show that the addition of both simple interactive game mechanics and other game elements have positive, consistent, and additive effects on participation rates. Second, we demonstrate three gamified market-research question types that were designed using previously published gamification frameworks and methodologies. Third, we provide evidence about how the data gathered from the system changes because of gamification. Our work provides designers with new understanding of the value of gamification, and provides practical information about using gamification for improved market research.
RELATED WORK
Gamification of Work-Like Tasks Game elements have been utilized in a number of non-gaming contexts to improve user motivation and performance [7,38]. The gamification of work has been addressed in several projects [34,28,9], and many work tasks have been successfully gamified in the past, including calibration [11], office tasks and interactions [24], protein folding [4], image identification [21,22], industrial assembly tasks [17], and Unix process management [5]. In addition to improvements in engagement or user preference, gamified tasks like Digitalkoot [6], CAPTCHINO [32], the ESP Game [37], and calibration games [11] were also able to produce useful data from users.
Mekler et al. [22] studied the effect of a point scoring system and meaningful framing of the task on motivation and performance in an image tagging system. Their results show that points increased the number of tags entered, while meaningful framing increased the quality of the tags; the combination of the two resulted in the best performance. Jung et al. [15] performed two studies to analyze the effect of performance goals and feedback on a groupware idea generation system. The authors found that providing goals and no feedback resulted in a small decrease in both idea quality and quantity, while providing only feedback and no goals provided a significant increase in both quality and quantity. A combination of challenging goals and feedback resulted in the best overall performance.
Gamification of Surveys Online surveys are the dominant data collection method in the market research industry [23]. In addition to gamification, factors such as survey length [12], answering
device (slider, textbox, etc.) [13,19], and social motivation [36] have been studied.
Reeves et al. [28] describe ten elements of great games, several of which have been utilized in surveys: self-representation with avatars [1,13], 3D environments [26,30], narrative context [13,29], feedback and behavior reinforcement [13,26], reputations [30,26], and time pressure [26]. These game elements have been shown to have positive effects in gamified surveys, but the results are mixed, and the limitations of these game elements have not been thoroughly examined.
Guin et al. [13] empirically compared four survey presentation styles including a ‘gamified’ style which included avatars, an in-game narrative quest, and the collection of in-game assets. Their results showed that respondents preferred the gamified version, although there was no apparent improvement in engagement or survey data quality [13]. Previous researchers have also found that the addition of game elements to a survey had a positive effect on data quality, while also increasing respondent completion times [20], although they did not determine which specific game elements rendered these effects.
Puleston and Sleep [26] tested several market research survey questions with game elements such as time pressure, points, narrative quest, and 3D environments. They also tested survey answering devices that were similar to shooting and movement mechanics from 2D and 3D games. They found that respondents produced more responses and longer responses in the gamified versions, and preferred the gamified versions in all cases. However, they also noted that some of their gamified designs produced poorer respondent data. They also do not present a comparative analysis of different game elements across question types.
Gamification in Market Research In addition to gamified surveys, gamification has been explored in other areas of the market research industry such as focus groups: for example, a gamified introduction of participants in a focus group setting [2] has been shown to increase creativity and participant interest. Gamification has also been explored to improve long-term participation and involvement in online communities; market research companies often create their own respondent panels and online communities, and maintaining the engagement of panelists is vital [33]. A recent study found that the addition of game elements led to increased engagement among panelists in a market research online community [38].
Gamification has also been explored in industry: for example, design firms produce avatar-based surveys for studying household products and consumer behaviors [29,30]. These firms claim that gamified surveys improve completion rates and data quality, particularly in young respondents [1], though the research detailing these improvements has not been made public. Other systems have become popular games in their own right – e.g.,

- 3 -
BrandBang! [10] is a market research game that uses a picture-reveal mechanic to measure brand logo recognition, and Logos Quiz [3] uses several different game mechanics to test logo, brand name, and slogan recognition.
DESIGN ELEMENTS IN OUR GAMIFIED SURVEY We designed our systems for the area of branding and advertising market research. Measurement of advertising effectiveness has been well studied in the marketing literature and so provides an established framework for designing survey questions [16]. As many of these questions involve identifying a company by their slogans or advertisements, we modeled our gamified survey as a brand recognition trivia game show; successful examples of brand trivia games exist [3,10], and this design allowed us to use a variety of established survey questions in one game.
Previous researchers have developed frameworks and design patterns for developing games and gamified tasks [11,14,37]; we identified six elements from these frameworks that can be used to characterize our designs of the survey questions. As described below, we used different elements from this list to build the three levels of gamification for our study.
• Core Task: Every survey question has a core task that is used to determine a respondent’s knowledge, beliefs, or behavior. Core tasks typically take the form of a closed or open-answer question, such as identifying the brand most associated with a slogan. The core task provides the principal data point for market researchers. The suite of core tasks used in our designs is typical of that used in other advertising research surveys.
• Game Mechanic: For each survey question we identify a game mechanic that pairs well with the core task; these mechanics have been used in other trivia games with similar content [1,3,10,26,37]. A game mechanic may add a challenge, add freedom by making the task less linear, or add an implicit reward or progress element. Previous work has noted that mechanics must be carefully matched with work tasks [37]. We did not test an exhaustive list of game mechanics for each core task, and other suitable mechanics likely exist.
• Theme: A fantasy context or style for the gamified survey can take the form of a vicarious setting, and can be extended with the use of avatars. For our ‘trivia game show’ theme we used ‘cash’ prizes, cheering sound effects, a ‘Market Trivia’ banner, and an introductory message that read “Welcome to the Game Show!” Respondents were not represented with an avatar.
• Reward: Visuals and audio can be used to provide simple rewards in a gamified survey, and points can be given for completing questions. The content and style of questions in advertising research surveys allows us to provide feedback for correct and incorrect responses. A cheering sound was played on correct responses, and a tension-filled gong and drum sound was played at the
start of each question. The number of points earned on each question was revealed in a visual animation.
• Challenge: In addition to any challenge from the game mechanic, other challenging game elements can be added as well. Our design included a timer which directly affected the number of points earned on a correct response: 300% if less than half of the timer had expired, 200% if more than half had expired, and 100% if the timer had expired.
• Progress: Providing feedback on the respondent’s progress (levels, number of questions left, etc.) and responses (badges for long responses, achievements for sections completed) can provide motivation to complete the survey, as well as foster competition if progress is shared in a social context [18]. Our design did not include progress markers about the number of questions left, because our main experimental measure was the number of questions completed. In addition, previous research indicates that overall progress feedback can increase the completion rate in all cases [12].
QUESTION TYPES We gamified three question types that are commonly used in advertising research surveys (see Figure 1).
Image Identification A respondent is shown an advertising image (a billboard, TV advertisement screenshot, or a print ad) and is asked to identify the sponsoring company. This survey question is used to determine the brand linkage ratio, a standardized measure of the strength of association between the advertising and the sponsor [16]. • Core Task: Identify/recognize an image. Respondents
were asked to type the name of the sponsor company, or click a dedicated “I Don’t Know” button.
• Game Mechanic: A slow-reveal mechanic is used to add a dynamic of mystery and tension; the source image is divided into a 14x14 grid and sections are revealed in random order while a 15 second timer ticks down. If the respondent answers incorrectly, the correct answer is given to them (common feedback in trivia games).
Slogan Matching A respondent is shown 5 phrases, one at a time in a random order, and asked to match each phrase to one of several options (a set of company logos, and a “None of These” option). This survey question is used to determine the strength of association between taglines, branded products, and key marketing messages and the sponsoring company. • Core Task: Drag each phrase to the corresponding
company logo, or to the “None of These” option. • Game Mechanic: A drag-and-drop matching game. All
phrases are shown immediately, allowing the respondent to choose which phrase to match first. Additional ‘pick up’ and ‘drop’ sound effects are added. A 20-second timer was used. When the respondent clicks ‘Done’ all correct responses are highlighted. The correct response is not revealed for any incorrect responses.
- 4 -
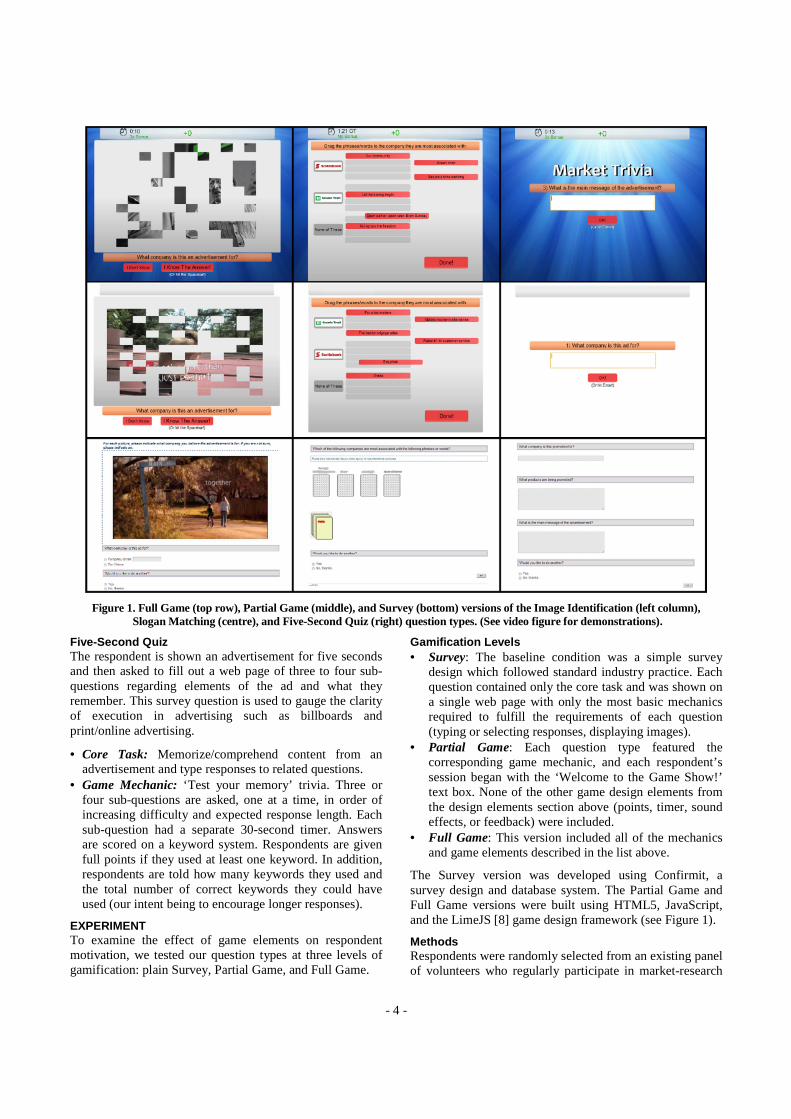
Figure 1. Full Game (top row), Partial Game (middle), and Survey (bottom) versions of the Image Identification (left column), Slogan Matching (centre), and Five-Second Quiz (right) question types. (See video figure for demonstrations).
Five-Second Quiz The respondent is shown an advertisement for five seconds and then asked to fill out a web page of three to four sub-questions regarding elements of the ad and what they remember. This survey question is used to gauge the clarity of execution in advertising such as billboards and print/online advertising.
• Core Task: Memorize/comprehend content from an advertisement and type responses to related questions.
• Game Mechanic: ‘Test your memory’ trivia. Three or four sub-questions are asked, one at a time, in order of increasing difficulty and expected response length. Each sub-question had a separate 30-second timer. Answers are scored on a keyword system. Respondents are given full points if they used at least one keyword. In addition, respondents are told how many keywords they used and the total number of correct keywords they could have used (our intent being to encourage longer responses).
EXPERIMENT To examine the effect of game elements on respondent motivation, we tested our question types at three levels of gamification: plain Survey, Partial Game, and Full Game.
Gamification Levels • Survey: The baseline condition was a simple survey
design which followed standard industry practice. Each question contained only the core task and was shown on a single web page with only the most basic mechanics required to fulfill the requirements of each question (typing or selecting responses, displaying images).
• Partial Game: Each question type featured the corresponding game mechanic, and each respondent’s session began with the ‘Welcome to the Game Show!’ text box. None of the other game design elements from the design elements section above (points, timer, sound effects, or feedback) were included.
• Full Game: This version included all of the mechanics and game elements described in the list above.
The Survey version was developed using Confirmit, a survey design and database system. The Partial Game and Full Game versions were built using HTML5, JavaScript, and the LimeJS [8] game design framework (see Figure 1).
Methods Respondents were randomly selected from an existing panel of volunteers who regularly participate in market-research

- 5 -
surveys. The invitation email told respondents that they would be playing a survey game with an opening and ending questionnaire. Once participants had begun the session, they completed questions in one of the conditions described above (survey, partial, or full game). After completing a question the respondent had the option to continue, or to quit and move on to the final questionnaire. All participants were instructed that they only needed to complete one question to receive a reward. After choosing to quit, or completing all questions, respondents were given the option of receiving a standard payment, or of entering a draw for a larger amount. We used the number of questions completed as our main measure of participation.
A total of 36 questions were designed (12 of each question type) using advertising material from local mobile-phone providers. Each respondent saw either the Survey, Partial Game, or Full Game version of the questions. Questions were grouped into blocks by question type. Respondents had to complete all 12 questions in a block before they could move on to the next question type. Blocks were presented in random order (6 possible orderings). Question order within a block was randomized for each respondent.
Study Design The study used a mixed-factorial design with the following factors: Gamification level (between): Survey, Partial, or Full Game; Question type (within): Image identification, Slogan matching, and Five-second quiz; and Block order (between): whether a game was played in the first, second, or third block. In addition, we also analysed the effects of demographics (age, gender, gaming experience) and the participant’s length of tenure on the panel.
Results A total of 591 respondents completed the session; in addition, 53 respondents began the session but did not finish the final questionnaire due to system issues. For our analysis we used data from all 644 respondents (Survey: 201, Partial Game: 192, Full Game: 198) who entered the session. Since respondents were only required to complete one question to earn their reward, our primary measure of motivation was the number of questions completed (out of 36 total questions). In the following sections we analyse the main research questions that motivated the study.
Did Increasing Gamification Increase Participation? A univariate ANOVA test showed a main effect of gamification level on total questions completed (F2,641=23.9, p<0.001). Tukey HSD post-hoc pairwise comparisons of the three levels revealed a significant difference between Full Game and Survey (p<0.001), Survey and Partial Game (p<0.001), and Full Game and Partial Game (p=0.031). The average number of questions completed increased with gamification level (Figure 2).
Did the Three Question Types Perform Differently? To explore differences between question types, we analysed the three order positions separately, since order had an effect on number of questions completed (Figure 3).
Figure 2. Mean questions completed by level of gamification.
A univariate ANOVA showed no effect of question type on the number of questions completed when played first (F2,635=0.42, p<0.959), when played second (F2,635=0.073, p<0.93), or when played third (F2,635=0.86, p<0.55). In addition, no interaction of question type and gamification level was found (all p>0.63). This suggests that all question types performed equally, and received a similar motivational benefit from gamification (Figure 3).
Figure 3. Average number of questions completed for each
question type, separated by play order.
Did the Effect of Gamification Wear Off While Playing? As there was no effect of question type on the average number of questions completed, we combined this data and analyzed the effect of block order and gamification level to determine if the motivational effect of gamification diminished during a respondent’s session. We limited our analysis to respondents who completed at least one question in a block (first block: 644 respondents, second block: 321 respondents, third block: 206 respondents). Univariate ANOVA showed a main effect of gamification level on the number of questions completed for the first question block (F2,641=5.43, p=0.005), but not for the second (F2,641=2.71, p=0.067) or third question blocks (F2,641=1.36, p=0.26). This suggests that the motivational gains from the game elements diminished as a respondent progressed (Figure 4).
Figure 4. Average number of questions completed for each gamification level, and each block of questions.

- 6 -
Does Age, Gender, or Tenure Change the Effects? A demographics questionnaire divided respondents into two groups by gender (245 males and 399 females) and three groups by age (187 were aged 18-34, 229 were aged 35-54, and 228 were aged 55 or older). Univariate ANOVA did not show a main effect for gender (F1,638=0.018, p=0.89) or age (F2,635=1.76, p=0.172). There were no interactions with gamification level (gender: F1,638=0.044, p=0.95; age: (F2,635=1.531, p=0.19), indicating that all our demographic groups responded similarly to gamification.
The tenure of a panelist (the length of time a person had been a member of the panel) is also a possible factor in their engagement level, and is also a proxy for their experience with market research surveys. To explore the effects of tenure, we compared the extreme cases of respondents who had been on the panel for 4 years or more (232 respondents), and respondents who had been on the panel for 6 months or less (232 respondents). Univariate ANOVA showed no effect of tenure on questions completed (F1,458=3.062, p=0.081) and no interaction with gamification level was found (F1,458=0.83, p=0.44). These results indicate that long-tenured and short-tenured respondents also respond similarly to the effects of gamification.
Does Gamification Work Differently for Non-Gamers? Our demographics questionnaire also asked participants to name any computer of video games that they play. Using this data, respondents were divided into two groups: those who stated they played games (464 respondents), and those indicated that did not play any games or did not respond (180 respondents). Univariate ANOVA did not show a significant difference in questions completed for these two groups (F2,638=3.796, p=0.052). In addition, no interaction was found with gamification level (F2,638=0.23, p=0.794) indicating that experience with games is not a factor in the motivational effect of gamification.
Data Differences Across Gamification Level Previous research has found that gamification can both improve [39,22] and compromise [19,26] collected data. In many cases (including our market-research domain), there is no established ‘ground truth’ to compare to, only the existing metric (in our case, the survey instrument). Therefore, as an initial analysis of data quality, we analyzed the data collected in each of our three questions types for differences between levels of gamification.
Image Identification A major design difference between the Full Game and Partial Game versions is the addition of correct and incorrect response feedback; points are given for correct responses, and the correct answer is revealed if the respondent was incorrect. To determine if this reward system compromised respondent data, we compared the percentage of correct responses between respondents for each of the three levels of gamification. Only respondents who completed at least 6 of the image identification questions were included. Univariate ANOVA showed a
main effect (F2,327=12.922, p<0.001) and a Tukey HSD post-hoc pairwise comparison showed significant differences between Full Game and Survey (p<0.01) and Full Game and Partial Game (p<0.001), but no significant difference was found between Survey and Partial Game (p=0.414). It seems likely that providing the correct answer in all cases may have trained respondents to identify similar images and company advertising styles (Figure 5).
Slogan Matching Since responses in this question type are always discretely defined, we can analyze the effect of gamification on the respondent data by comparing each respondent’s percentage of correct responses. Univariate ANOVA did not find a significant difference between the three levels of gamification (F2,389=0.119, p<0.888). Thus, revealing the correct response only when the respondent was correct did not appear to affect the respondent data.
Five-Second Quiz Responses in this game are given as free-form text, making direct comparisons more difficult. For our initial analysis we compared the average response length in characters, between the three gamification levels. Univariate ANOVA found a significant difference in average response length for gamification level (F2,410=8.723, p<0.001). A Tukey HSD post-hoc pairwise comparison found a significant difference between Partial Game and Full Game conditions (p<0.001, with responses 1.79 characters shorter in the Full Game) but no significant difference between Survey and Partial Game (p=0.069) or Survey and Full Game (p=0.221).
There are two possible reasons for the shortened responses: Firstly, the timer may pressure respondents to complete questions quickly, resulting in shorter answers. Secondly, the keyword scoring system for this question type may have been problematic; in their comments some respondents indicated it was difficult to write responses that triggered keywords, and others stated that it was impossible to use all of the possible keywords. The number of possible keywords was shown after a response to encourage longer responses, but this feedback may have had a demotivating effect.
Figure 5. Average correct response percentage for Image Identification questions.
Discussion Our results show that gamifying market research surveys significantly improves participation, and that motivation increases with the addition of a game mechanic and other game elements (Figure 2). Our results found no significant

- 7 -
effect of respondent age, gender, panel tenure, and gaming experience, indicating that gamification can improve motivation across all of these demographic factors. In the following sections we provide explanations for these results, and discuss issues that are raised by our findings.
Why did gamification lead to greater participation? Our study shows that two different approaches to gamification (one that only adds a game mechanic, and one that adds the mechanic plus several other game elements) both increased participation rates. These results suggest that two underlying theories of gamification can be at work at the same time; that is, motivation can increase both through the interactivity of the game mechanic, as well as through the addition of elements such as theme, reward, and challenge. To our knowledge this is the first result to show the additive effects of these different gamification elements.
These results are important for designers of surveys, because there are considerable differences in the effort and cost of adding different kinds of game elements. Designers can obtain a significant increase in participation by adding game mechanics to surveys, even without the added cost of developing theme, challenge, or reward elements. In addition, there are some domains where these extended game elements may be intrusive or inappropriate, but the mechanics can still be used. If a greater motivational effect is desired, however, our results show that there is added benefit to adding these elements to the system.
Did the gamification effects wear off during the session? Our results showed that participants completed substantially fewer questions in the second and third rounds, and that the differences between the three levels of gamification also diminished. This could suggest that the motivating effects of gamification ‘wear off’ as participants continue in a session. This issue needs further study; however, there are reasons to believe that other factors may have also been contributing to the reduction.
In particular, our system did not explicitly design for the transition between the different question types, and thus was not balanced or optimized to keep respondents in a state of flow [35] throughout their session. For example, additional design elements such as an indication of game-wide progress, a ramping of difficulty level, and mixing the question type during the session are some of the possible options that could sustain engagement over the longer term.
Why did the data differ between gamification levels? For most of the question types and gamification levels, no significant differences were found in our measures of response quality. However, we did find two situations where game elements may have changed respondent data.
First, the additional game elements in the Five Second Quiz (either the timer or keyword scoring system) appear to have led participants to produce shorter answers. While shorter responses are not necessarily lower in quality, the purpose of this question type was to collect free form text; shorter
responses may be missing some implicit information, such as tonal cues, which may be valuable to the researchers. This difference in response length likely represents a fundamental tradeoff for time-based game elements; however, there may be other mechanisms for increasing response length, such as providing points based on the number of keywords entered within the timer period.
Second, it is possible that revealing the correct response in the Image Identification game (Full Game) may have provided training that was not in the Survey version; as a result, participants performed better on later questions, thereby skewing the measurement of brand linkage ratio [16]. Interestingly, revealing the correct response only when the respondent was correct (as in the Slogan Matching game) did not appear to affect performance.
To follow up on this possibility, we carried out a small second study, in which the Image Identification game no longer revealed the correct answer after incorrect responses. This change removes any training effects that could be provided to participants. We ran this follow-up with 110 additional participants from the panel; all other aspects of the experiment were the same as described above.
We analysed our results to look specifically at differences in data quality for the Image Identification game. As in our first experiment, we compared correct response percentages for each gamification level. With the removal of the correct-answer feedback, no significant difference was found between the Modified Full Game and Survey (p=.586), or Modified Full Game and Partial Game (p=0.72). This result suggests that our ‘training’ hypotheses was correct, and that revealing the correct response only when the respondent is correct brings the respondent data back in line with the data from the other versions (Fig.5).
CONCLUSIONS AND FUTURE WORK Gamification is an increasingly popular method for improving motivation, but a lack of empirical comparisons makes it difficult to identify the elements that provide these benefits. We designed three versions of a gamified market research survey and compared them in a study with over 600 participants. Our evaluation demonstrates that the motivational benefits of games increase with the level of gamification, and that these benefits apply regardless of age, gender, length of a panelist’s tenure, and game experience. Our study also showed how game elements can change respondent data, and we explored ways to address these changes in a small follow-up study.
Our future work in this area will continue in three directions. First, we will carry out additional studies to assess survey gamification in other domains and over a longer term, to see whether the effects are consistent once participants are familiar with gamified versions of the system. Second, we will develop new types of gamified questions and new methods of delivering the questions, to investigate whether we can sustain the motivational benefits

- 8 -
over the entire game session. Third, we will explore ways of managing tradeoffs between time pressure and response quality, using mechanisms such as the ‘keyword efficiency’ measure identified above.
REFERENCES 1. Adamou, B. Using Gamification in Youth Surveys.
http://rwconnect.esomar.org/2012/07/17/using-gamification-in-surveys-for-children/.
2. Adamou, B. Giving Research the NOS Effect. Proc. 2012 Net Gain 6.0 MRIA Conference.
3. Atico Mobile: Logo Quiz iPhone App. http://aticod.com/portfolio/logosQuiz/.
4. Center for Game Science at University of Washington: Foldit. http://www.fold.it.
5. Chao, D. Doom as an Interface for Process Management. Proc. CHI 2001, 152-157.
6. Chrons, O., & Sundell, S. Digitalkoot: Making Old Archives Accessible Using Crowdsourcing. Proc. HCOMP 2011.
7. Deterding, S., Dixon, D., Nacke, L., O'Hara, K., & Sicart, M. Gamification: Using Game Design Elements in Non-Gaming Contexts. CHI 2011 Ext. Abstracts.
8. DigitalFruit: LimeJS HTML 5 Game Framework. http://www.limejs.com.
9. Dignan, A. Game Frame: Using Games as a Strategy for Success. Free Press, 2011.
10. Eye Tracking Technologies Limited: BrandBang!. http://support.brandbang.org/.
11. Flatla, D.R., Gutwin, C., Nacke, L.E., & Bateman, S., Mandryk, R.L. Calibration Games: Making Calibration Tasks Enjoyable by Adding Motivating Game Elements. Proc. UIST 2011, 403-412.
12. Galesic, M., & Bosnjak, M. Effects of questionnaire length on participation and indicators of response quality in a web survey.
13. Guin,T.D., Baker, R., Mechling, & J., Ruylea E. Myths and Realities of Respondent Engagement in Online Surveys. Int. J. of Market Res. 54, 5 (2012), 613-633.
14. Hunicke, R., LeBlanc, M., & Zubek, R. MDA: A Formal Approach to Game Design and Game Research. Proc. AAAI04 WS on Challenges in Game AI, 2004, 1-5.
15. Jung, J., Schneider, C., and Valacich, J. Enhancing the motivational affordance of information systems: The effects of real-time performance feedback and goal setting in group collaboration environments. Management Science 56, 4, (2010), 724-742.
16. Keller, K. L. Conceptualizing, Measuring, and Managing Customer-Based Brand Equity. Journal of Marketing 57, 1, (1993), 1-22.
17. Korn, O. Industrial playgrounds: how gamification helps to enrich work for elderly or impaired persons in production. Proc. EICS 2012, 313-316.
18. Lewis, C., Wardrip-Fruin, N., & Whitehead, J. Motivational game design patterns of 'ville games. Proc. FDG 2012, 172-179.
19. Malinoff, B. Sexy questions, dangerous answers. Proc. CASRO 2010 Technology Conference.
20. Malinoff, B. Yin and Yang of Gamification. Proc. 2012 Net Gain 6.0 MRIA Conference.
21. Mason, A., Michalakidis, G. & Krause, P. Tiger nation: Empowering citizen scientists. Proc. IEEE DEST 2012.
22. Mekler, D., Brühlmann, F., Opwis, K., & Tuch, N. Disassembling gamification: the effects of points and meaning on user motivation and performance.CHI 2013.
23. Murphy, L. The Quant vs. Qual Dynamic. Greenbook Winter 2013, 19-21.
24. Nikkila, S., Byrne, D., Sundaram, H., Kelliher, A., & Linn, S. Taskville: visualizing tasks and raising awareness in the workplace. CHI 2013 Ext. Abstracts.
25. Presser, S. et al. Methods for testing and evaluating survey questions. Public Opin. Q. 68, 1 (2004):109-130.
26. Puleston, J. & Sleep, D. The game experiments: researching how gaming techniques can be used to improve the quality of feedback from online research. Proc. ESOMAR Congress 2011.
27. Rapp, A., Marcengo, A., Simeoni, R., & Console, L. Playing while Testing: How to Gamify a User Field Evaluation. CHI 2013 Ext. Abstracts.
28. Reeves, B., & Read, J. Total Engagement. 2009. 29. Research Through Gaming: Pimple Crisis.
http://www.youtube.com/watch?v=2s63gLuO-W0. 30. Research Through Gaming: The Playspondent House.
http://www.researchthroughgaming.com/ 31. Ryan, R. M., Rigby, C. S. and Przybylski, A. The
Motivational Pull of Video Games: A Self-Determination Theory Approach. Motivation & Emotion 30, 4 (2006), 347-363.
32. Saha, R, Manna R., & Geetha G. CAPTCHINO- A Gamification of Image-based CAPTCHAs to Evaluate Usability Issues. Proc. ICCS 2012, 95-99.
33. Sherman, B. Planning for success: Maximizing ROI for custom panels and online communities. Quirks Marketing Review 25, 4, (2011), 46- 51.
34. Shneiderman, B. Designing for Fun: How Can We Design User Interfaces to Be More Fun? Interactions 11, 5, (2004), 48-50.
35. Sweetser, P. & Wyeth, P., GameFlow: a model for evaluating player enjoyment in games. Computers in Entertainment 3, 3, (2005), 1-24.
36. Thomas, R., Bremer, J., Terhanian, G. & Couper, M.P. Truth in measurement: comparing web-based interview techniques. Proc. ESOMAR Congress 2007.
37. Von Ahn, L., & Dabbish, L. Designing Games With a Purpose. Comm. ACM 51, 8, (2008), 58-67.
38. Wilson, D. & Birks, D. F. The development of the KubeMatrix as a mobile app for Market Research Online Communities. Proc. ASC 2011.
39. Witt, M., Scheiner, C., & Robra-Bissantz, S. Gamification of Online Idea Competitions: Insights from an Explorative Case. Proc. Informatik 2011.