effects of food plots on selected growth parameters
TRANSCRIPT

Louisiana State UniversityLSU Digital Commons
LSU Historical Dissertations and Theses Graduate School
1990
Effects of Food Plots on Selected GrowthParameters, Productivity, and Harvesting of White-Tailed Deer in a National Forest.Kenneth Dale DancakLouisiana State University and Agricultural & Mechanical College
Follow this and additional works at: https://digitalcommons.lsu.edu/gradschool_disstheses
This Dissertation is brought to you for free and open access by the Graduate School at LSU Digital Commons. It has been accepted for inclusion inLSU Historical Dissertations and Theses by an authorized administrator of LSU Digital Commons. For more information, please [email protected].
Recommended CitationDancak, Kenneth Dale, "Effects of Food Plots on Selected Growth Parameters, Productivity, and Harvesting of White-Tailed Deer in aNational Forest." (1990). LSU Historical Dissertations and Theses. 4906.https://digitalcommons.lsu.edu/gradschool_disstheses/4906

INFORMATION TO USERS
The most advanced technology has been used to photograph and reproduce this manuscript from the microfilm master. UMI films the text directly from the original or copy submitted. Thus, some thesis and dissertation copies are in typewriter face, while others may be from any type of computer printer.
The quality of this reproduction is dependent upon the quality of the copy submitted. Broken or indistinct print, colored or poor quality illustrations and photographs, print bleedthrough, substandard margins, and improper alignment can adversely afreet reproduction.
In the unlikely event that the author did not send UMI a complete manuscript and there are missing pages, these will be noted. Also, if unauthorized copyright material had to be removed, a note will indicate the deletion.
Oversize materials (e.g., maps, drawings, charts) are reproduced by sectioning the original, beginning at the upper left-hand corner and continuing from left to right in equal sections with small overlaps. Each original is also photographed in one exposure and is included in reduced form at the back of the book.
Photographs included in the original manuscript have been reproduced xerographically in this copy. Higher quality 6" x 9” black and white photographic prints are available for any photographs or illustrations appearing in this copy for an additional charge. Contact UMI directly to order.
University Microfilms International A Bell & Howell Information Com pany
300 North Z eeb Road. Ann Arbor, Ml 48106-1346 USA 313/761-4700 800/521-0600

O rder N u m b er 9104123
Effects o f food plots on selected growth param eters, productivity, and harvesting of w hite-tailed deer in a national forest
Dancak, Kenneth Dale, Ph.D.
The Louisiana State University and Agricultural and Mechanical Col., 1990
U M I300 N. Zeeb Rd.Ann Arbor, MI 48106

EFFECTS OF FOOD PLOTS ON SELECTED GROWTH PARAMETERS. PRODUCTIVITY. AND HARVESTING OF WHITE-TAILED DEER IN A NATIONAL FOREST
A Dissertation
Submitted to the Graduate Faculty of the Louisiana State University and
Agricultural end Mechanical College In partial fulfillment of the
requirements for the degree of Doctor of Philosophy '
In
The School of Forestry. Wildlife, and Fisheries
byKenneth Dale Dancak
D.S.. Southwest Texas State University. 1974 M.S., Louisiana State University, 1964
May 1990

ACKNOWLEDGMENTS
This study was funded by the U.SD.A. Forest Service, Region 8, through the
Challenge Grant Program. I thank Mr. Robert Joslfn, former Forest Supervisor, Kisatchie
National Forest, Mr. Joe Hogan, Forest Wildlife Biologist, Kisatchie National ForasL, and Mr.
Tom Fair, Kisatchie District Ranger, Kisatchie National ForesL. for their support of this
project. My committee members, Dr. James W. Avault, J r ., Dr. RoberL H. Chabreck, Dr.
Robert E. Noble, and Dr. Norwin E. Linnartz of the LSli School of Forestry, Wildlife, and
Fisheries, and Dr. Donald L. Robinson of the LSU Department of Agronomy, provided advice
and assistance during the course of the study. Dr. Robinson provided extensive laboratory
support. Mrs. Frances Rolhwein, Wildlife Biologist, U.SD.A. Forest Service, and her
husband, Mr. Jim Rothwein, provided invaluable support. Numerous Northwestern State
University and Louisiana Stale University students and Dr. Arthur Allen. Department of Life
Sciences, Northwestern Stats University, helped operate the deer check station and/or
conducted deer censuses. Mr. Hugh Savoy, Research Associate, and Ms. Julie Riemer.
Research Specialist, LSU Agronomy Department, provided guidance during chemical analyses.
Mr. Billy Nelson, Mrs. Bernsdine Barber, and Dr. Michael McCormick of the Forage Quality
Lab, Southeastern Louisiana Research Station, helped with chemical analyses. Messrs.
James Dardar, Thomas Magliolo, and Anthony Martin, summer youth workers from central
Louisiana, and Mr. Matthew KHIen and Ms. Veronica Appleby, LSU students, assisted with lab
work. A special note of gratitude is extended to Mr. Ralph Costa. Wildlife Biologist. U.S.D.A.
ForesL Service, for his initiation of this study, his professional support, and his friendship:
to Messrs. Jay Johnson and Nathaniel McGaskey. U.S.D A. Forest Service technicians, for
their assistance with fieldwork; and to my major professor. Dr. Mark K. Johnson, LSU
School of Forestry. Wildlife, and Fisheries, for his tutelage during my tenure as a graduate
student a t LSU.
i i

•*v.
TABLE OF CONTENTSPage
ACKNOWLEDGEMENTS .................................................................................................................. H
TABLE OF CONTENTS.................................................................................................................... Ill
LIST OF TABLES........................................................................................................................... v
LIST OF FIGURES..............................................................................................................................xil
ABSTRACT...................................................................................................................................... Kill
INTRODUCTION.............................................................................................................................. 1
LITERATURE REVIEW...................................................................................................................... 3
Forage Quality.................................................................................................................. 3
Deer Nutrition and Its Ramifications............................................................................. 4
Food Plots and Deer......................................................................................................... 6
The Effect of Food Plots on Deer-Hunting Success...................................................... 8
STUDY AREA................................................................................................................................ 10
Location and Topography.................................................................................................. 10
Climate................................................................................................................................ 10
Soils..................................................................................................................................... 10
Flora and Fauna.................................................................................................................. 16
History of Red Dirt and Current Land Use Practices................................................. 17
METHODS............................................................................................................................................ 27
Experimental Design....................................................................................................... 27
Deer Censuslng................................................................................................................ 32
Soil A nalyses.................................................................................................................. 34
Food Plots......................................................................................................................... 35
Analyses of Food Plot Forages.........................................................................................38
Deer Fecal Analyses........................................................................................................... 41
Deer Check S tation.............................................................................................................43
i i i

Deer Productivity .............................................................................................................46
Economic Aspects of th« Year-Round Food Plot P ro g ram ......................................... 47
S ta tis tic s ........................................................................................................................... 47
RESULTS AND DISCUSSION............................................................................................................49
Deer Abundance..................................................................................................................49
Soil F ertility ..................................................................................................................... 52
Food Plot Forages — General Comments........................................................................54
Food Plot Production and Deer Utilization................................................................... 55
Warm-Season P lo ts ........................................................................................ 55
Caol-Season Plots...............................................................................................59
Fecal Pellet Composition.....................................................................................60
Nutrient Content of Food Plot Forages............................................................................ 62
Nutrient Content of Deer Fecal Matter............................................................................69
Deer Harvest — General Comments............................................................................... 76
Selected Growth P aram eters ................................................................................. .. 79
Body Weights....................................................................................................... 79
Body S iz e ........................................................................................................ 82
Antler Development........................................................................................83
Deer Productivity............................................................................................................83
Deer Harvesting.................................................................................................................94
Hunt QualiLy.......................................................................................................................99
Economic Aspects of the Year-Round Food Plot Program ......................................... 104
SUMMARY AND CONCLUSION.................................................................................................... 115
LITERATURE CITED.................................................................................................................... 116
APPENDIX....................................................................................................................................... 130
VITA................................................................................................................................................184
iv

LIST OF TABLES
Table Page
1. Recommended mineral requirements Tor bear cattle ................................................... 5
2. Temperature and precipitation, 1951 - 1973, recorded at Natchitoches, Louisiana.. 13
3. Rainfall record for National Red DirL Wildlife Management Preserve, Natchitoches
Parish. Louisiana; 1983 - 1989............................................................................. 14
4. Forest treatments at National Red Dirt Wildlife Management Preserve.
Natchitoches Parish. Louisiana; 1979 - 1988..................................................... 19
5. Historical data pertaining to deer-hunting at National Red Dirt Wildlife Manegement
Preserve, Natchitoches Parish, Louisiana; 1955 - .........1989........................... 23
6. Number of deer harvested per square kilometer on control and food plot units al
National Red Dirt Wildlife Management Preserve, Natchitoches Parish.
Louisiana; 1 9 8 3 -1 9 8 5 ........................................................................................... 29
7. Fawns/adult doe harvested on control and food plot units at National Red Dirt
Wildlife Management Preserve, Natchitoches Parish, Louisiana; 1983 - 1985.. 30
8. Mean body weights of deer harvested on control and food plot units at National
Red Dirt Wildlife Management Preserve. Natchitoches Parish, Louisiana;
1 9 8 3 -1 9 8 5 ................................................................................................................. 31
9. Size and type of food plots on National Red Dirt Wildlife Management Preserve.
Natchitoches Parish, Louisians; 1906 - 1989.......................................................... 37
10. Deer-hunLing dales a t National Red DirL Wildlife Management Preserve.
Natchitoches Parish, Louisiana during the 1986 - 1989 deer-hunting seasons. . 44
11. White-tailed deer population surveys conducted a l National Red Dirt Wildlife
Management Preserve, Natchitoches Parish, Louisiana; 1986 - 1988................... 50

12. Estimates of daer population size in 1987 and 1988 on combined control
and food plot units aL National Red Dirt Wildlife Management Preserve,
Natchitoches Parish, Louisiana.................................................................................. 51
13. Food plot production and deer utilization in food plot units a t National Red Dirt
Wildlife Management Preserve, Natchitoches Parish. Louisiana; 1986 - 1988.. 56
14. Vegetative production in deer-proof enclosures vs rabbit-proof enclosures on
food plots In combined study units T1 and T2 al National Red Dirt Wildlife
Management Preserve, Natchitoches Perish, Louisiana; 1987 - 1988.............. 61
15. Mean crude protein content of food plot forages collected in combined study
units T1 and T2 at National Red Dirt Wildlife Management Preserve.
Natchitoches Parish, Louisiana; 198 6 - 1988........................................................ 63
16. Mean nutrient content of American jointvetch on food plots at National Red Dirt
Wildlife Management Preserve, Natchitoches Parish, Louisiana; 1986 - 1988.. 64
17. Mean nutrient content of red clover on food plots a t National Red Dirt Wildlife
Management Preserve, Natchitoches Parish, Louisiana; 1987 - 1988................ 65
18. Mean nutrient contenL of subclover on food plots a t National Red DirL Wildlife
Management Preserve, Natchitoches Parish, Louisiana; 1987 - 1988................ 66
19. Mean nutrient content of wheat on food plots at NaLional Red Dirt Wildlife
Management Preserve, Natchitoches Parish, Louisiana; 1987............................... 67
20. Mean crude protein content of deer fecal samples collected on control and food
plot units a t National Red Dirt Wildlife Management Preserve. Natchitoches
Parish. Louisiana; 1986 - 1988.................................................................................. 70
21. Mean nutrient content of deer fecal matter collected on combined study units
a t National Red DirL Wildlife Management Preserve, Natchitoches Parish,
Louisiana; 198 6 - 1988 ................................................................................................ 71
v i

22. Mean body weights of male and female white-tailed deer harvested on control
and food plot units a t National Rad Dirt Wildlife Management Preserve,
Natchitoches Parish, Louisiana; 1986 - 1989............................................. 80
23. Mean humerus length of mate and female white-tailed deer harvested on control
and food plot units a t National Red Dirt Wildlife Management Preserve.
Louisiana: 1986 - 1989............................................................................................... 84
24. Mean number of antler points of male white-tailed deer harvested on control
and food plot unils at National Red Dirt Wildlife Management Preserve,
Natchitoches Parish, Louisiana; 1986 - 1989............................................. 86
25. Meen antler scores of mate white-tailed deer harvested on control and food plot
units at National Red Dirt Wildlife Management Preserve, Natchitoches Parish,
Louisiana; 1986 - 1989............................................................................................... 87
26. Mean number of corpora lutea in ovaries of female while-Lailed deer harvested on
control and food plot units a t National Red Dirt Wildlife Management Preserve,
Natchitoches Parish. Louisiana; 198 6 - 1988......... 88
27. Fawns/adult doe harvested on control and food plot unils at National Red Dirt
Wildlife Management Preserve, Natchitoches Parish. Louisiana; 1986 - 1989. . 90
28. Comparison of various reproduction parameters of white-tailed deer harvested on
control and food plot units a t National Red Dirt Wildlife Management Preserve.
Natchitoches Parish, Louisiana; 1 9 8 6 -1 9 8 8 ........................................................ 91
29. Mean length and weight of embryos collected from female while-tailed deer
harvested on control and food plot units a t National Red Dirt Wildlife
Management Preserve, Natchitoches Parish, Louisiana; 1986 - 1988.............. 93
30. Mean kill-times of hunters on control and food plot units during deer-hunting
season at National Red Dirt Wildlife Management Preserve, Natchitoches
Parish. Louisiana; 1986 - 1989............................................................................. 95
v i i

31. Hunter efforts/killed deer on control end food plot units el Notional Red Dirt Wildlife
Management Preserve, Natchitoches Parish, Louisiana; 1 9 8 6 -1 9 8 9 ... 100
32. Ralio of number of unsuccessful hunters not seeing deer: number of unsuccessful
hunters seeing deer on control and food plot units a t National Red Dirt Wildlife
Management Preserve, Natchitoches Parish, Louisiana; 1986 - 1989... 105
33. Ratio of number of unsuccessful hunters not shooting a t deer: number of unsuccessful
hunters shooting a t deer on control and food plot units a t National Red Dirt Wildlife
Management Preserve. Natchitoches Parish, Louisiana; 1986 - 1989... 109
34. Approximate expenses for the year-round food plot program at National Red Dirt
Wildlife Management Preserve, Natchitoches Parish, Louisiana from
1 May 1986 to 30 June 1989...................................................................................... 113
35. Number of deer harvested per square kilometer on study unils at National Red Dirt
Wildlife Management Preserve. Natchitoches Parish, Louisiana; 1983 - 1985.. 131
36. Fawns/adult doe harvested on study units a t National Red Dirt Wildlife
Management Preserve, Natchitoches Parish, Louisiana; 1983 - 1985................ 132
37. Mean body weights of male and female white-tailed deer harvested on study units
at National Red Dirt Wildlife Management Preserve, Natchitoches Parish,
Louisiana; 1 9 8 3 -1 9 8 5 ..................................................................................................133
38. White-tailed deer population surveys conducted on study units at National Red Dirt
Wildlife Management Preserve, Natchitoches Parish, Louisiana; 1 9 8 6 - 1988.. 134
39. Estimates of deer population size in 1987 and 1988 at National Red DirL Wildlife
Management Preserve, Natchitoches Parish. Louisiana........................................ 135
40. Food plot production and deer utilization in study unit T1 a t National Red Dirt Wildlife
Management Preserve, Natchitoches Parish, Louisiana; 1986 - 1988................ 136
41. Food plot production and deer utilization in study unit T2 a t National Red Dirt Wildlife
Management Preserve, Natchitoches Parish, Louisiana; 1986 - 1988................ 138
v i i i

42. Vegetative production In deer-proof enclosures vs rabbit-proof enclosures on food
plots in study units T1 and T2 a t National Rad Dirt Wildtifa Management
Preserve, Natchitoches Parish, Louisiana; 1987- 1988......................................... 140
43. Mean crude protein content of food plot forages collected in study unils T1 and T2
at National Red Dirt Wildlife Management Preserve. Natchitoches Parish.
Louisiana; 1986 - 1988.............................................................................................. 142
44. Mean nutrient content of American jointvetch on food plots at National Red DirL
Wildlife Management Preserve, Natchitoches Parish, Louisiana; 1986- 1988.. 144
45. Mean nutrient content of red clover on food plots at National Red Dirt Wildlife
Management Preserve, Natchitoches Parish, Louisiana; 1987- 1988.............. 146
46. Mean nutrient content of subclover on food plots at National Red Dirt Wildlife
Management Preserve, Natchitoches Parish, Louisiana; 1987- 1988................ 148
47. Mean nutrient content of wheat on food plots a t National Red Dirt Wildlife
Management Preserve, Natchitoches Parish, Louisiana; 1987.................................150
48. Mean crude protein content of deer fecal samples collected on study units at
National Red Dirt Wildlife Management Preserve, Natchitoches Parish,
Louisiana; 1 9 8 6 -1 9 8 8 .............................................................................................. 152
49. Mean nutrient content of deer fecal matter collected on study units at National
Red Dirt Wildlife Management Preserve, Natchitoches Parish, Louisiana;
1986 - 1 9 8 8 ..................................................................................................................153
50. Mean body weights of male and female white-tailed deer harvested on study units
a t National Red Dirt Wildlife Management Preserve, Natchitoches Parish,
Louisiana; 1986 - 1989.............................................................................................. 157
51. Mean humerus length of male and female white-tailed deer harvested on study
units at National Red Dirt Wildlife Management Preserve. Natchitoches
Parish. Louisiana; 1986- 1989................................................................................ 159
ix

52. Mean number of antler points of male white-tailed deer harvested on study units
a t National Red Dirt Wildlife Management Preserve, Natchitoches Parish,
Louisiana; 1 9 8 6 -1 9 8 9 ................................................................................................ 161
53. Mean antler scores of male white-tailed deer harvested on study units at National
Red Dirt Wildlife Management Preserve, Natchitoches Parish, Louisiana;
1 9 8 6 -1 9 8 9 .................................................................................................................. 162
54. Mean number of corpora lutea in ovaries of female white-tailed deer harvested on
study units a t National Red Dirt Wildlife Management Preserve, Natchitoches
Parish, Louisiana; 1986 - 1988...................................................................................163
55. Fawns/adult doe harvested on study units a t National Red DirL Wildlife
Management Preserve, Natchitoches Parish, Louisiana; 1 9 8 6 -1 9 8 9 ............... 164
56. Comparison of various reproduction parameters of white-Lailed deer harvested
on study units at National Red Dirt Wildlife Management Preserve,
Natchitoches Parish, Louisiana; 1986 - 1988............................................................165
57. Length and weight of white-tailed deer embryos collected from female deer
harvested on study units at National Red Dirt Wildlife Management Preserve,
Natchitoches Parish, Louisiana; 1986 - 1988............................................................167
58. Mean kill-times of hunters on study units during deer-hunting season at National
Red Dirt Wildlife Management Preserve, Natchitoches Parish. Louisiana:
1 9 8 6 -1 9 8 9 ............................................................................................................. 168
59. Hunter efforts/killed deer on study units at National Red Dirt Wildlife
Management Preserve, Natchitoches Parish, Louisiana; 1986 - 1989............... 172
60. Ratio of number of unsuccessful hunters not seeing deer: number of unsuccessful
hunters seeing deer on the study units a t National Red Dirt Wildlife
Management Preserve, Natchitoches Parish, Louisiana; 19B6- 1989............... 176
x

61. Ratio of number of unsuccessful hunters not shooting at deer: number of unsuccessful
hunters shooting at deer on control and food plot units at National Red Dirt Wildlife
Management Preserve, Natchitoches Parish, Louisiana: 1966- 1989................... 180
x i

LIST OF FIGURES
Figure Pace
1. Location or National Red Dirt Wildlife Management Preserve, Natchitoches
Parish, Louisiana............................................................................................................ 11
2. Kisatchie Ranger District, including National Red Dirt Wildlife Management
Preserve lin Natchitoches Parish]............................................................................. 12
3. Soil associations at National Red Dirt Wildlife Management Preserve, Natchitoches
Parish, Louisiana............................................................................................................ 15
A. Layout of study units a t National Red Dirt Wildlife Management Preserve,
Natchitoches Parish. Louisiana; 1986 - 1989............................................................ 28
5. Censused areas in the study units a t National Red Dirt Wildlife Management
Preserve, Natchitoches Parish. Louisiana; 1986 - 1988. .................................. 33
6. Distribution of cool-season and warm-season food plots at National Red Dirt
Wildlife Management Preserve, Natchitoches Parish, Louisiana; 1086- 1080. . 36
7. Antler scoring methodology at National Red Dirt Wildlife Management Preserve,
Natchitoches Parish, Louisiana; 1986 - 1989............................................................ 45
x l i

ABSTRACT
A total of 8. t ha or warm-season and 16.8 ha of cool-soason food plots ware
Installed on 2 of 4 study units a t National Red Dirt Wildlife Management Preserve, Louisiana,
an area managed by the USDA Forest Service for multiple resources. Mean (± s.e.) study
unit size was 2220 ±246 ha. No food plots were installed on the remaining 2 study units
(controls). Warm-season food plots were planted with American Jofntvetch (Aeschvnomene
amerlcana): cool-season plots were planted with red clover (Trlfollum pretense),
subterranean clover (Trlfollum subterraneum). winter wheat (Trltlcum aestlvum) and white
clover (Trlfollum reoens). All plots were maintained from June 1986 to June 1989. Food
plot forages were analyzed for biomass production, white-tailed deer (Qdocolleus
vlrolnlanus) utilization, and nutrient content. Deer were censused prior to the s ta rt of the
annual deer-hunting seasons from 1986 - 1988. Deer harvested by hunters during deer-
huntlng seasons (1986-1989) were analyzed for age. body weight, leg length, and antler
development. Reproductive tracts were extracted from female deer. Hunters were
questioned as to area hunted, deer seen, deer shot at, time spent hunting, and deer klll-sites.
Deer fecal samples were collected In August, January, and May from 1986 - 1908 and
analyzed for nutrient content and presence of food plot forages. Production of food plot
forages generally was sufficient to allow free-ranging deer to feed ad libitum on the plots.
Deer utilization of food plot forages ranged from 0.06 - 0.50 kg/deer/day in various periods
during the study. No differences (P > 0.05) were found In deer density among food plot and
control units. Similarly, no differences (P > 0.05) were found in deer fecal nutrient content,
growth and productivity parameters of deer, hunter success, or hunt quality among the food
plot and control units. The cost ($22,426 total) of the rood plots was not justified by these
results. The low deer density and the apparent ample availability or relatively high-quality
native browse and forage might have contributed to the food plots having no effect on the
deer In the Preserve.
x i i i

INTRODUCTION
Reieerchen have demonstrated that cool-season and warm-season Food plots can ba
a valuable deer (Odocoileus vlrolnlanus)1 management tool (Johnson e ta l. 1987. Keegan e ta l.
1989). Food plot forages can Improve deer nutrition if the forages are planted In areas which
support relatively low-quality native vegetation. Improved nutrition Is a key factor In
enhancing deer growth, body weights, antler development, and productivity (French e t al.
1956, Verme 1965, and many others).
With human encroachment ever-increasing and increasing amounts of land being
leased to Individuals and clubs for hunting, less land Is available for public hunting.
Consequently, the role of National Forests In recreational hunting is increasing in importance.
The overseer of the National Forests, the U.S.D.A. Forest Service (hereafter called Forest
Service), is mandated by the National Environmental Policy Act of 1969 and the National
Forest Management Act of 1976 to manage the Forests for multiple resources (timber
production, watershed conservation, wildlife conservation, recreation, and cattle grazing).
Often, the management of 1 resource favorably impacts the management of another resource.
Timber management, for example, can be beneficial to deer management. Thinnings, small
dearcuts, and other timber management practices can increase forage production and cover
for deer. Because the Forest Service Is interested in maximizing the resources of the
National Forests to the degree that financial and political constraints allow, it Is Important to
1 Scientific nomenclature of plants and trees is from Radford et al. (1968), excepL for
Aeschvnomene americana (Rudd 1955), Androoooon diveraens (Hitchcock 1950), and
Trifolium subterraneum (Hitchcock and Conquist 1973). Scientific nomenclature of birds is
from the A.O.U. Check-list (1903); scientific nomenclature of mammals is from Hall and
Kelson (1959), except for Fells rufus (McCord and Cardoza 1982) and Vulpesvulpes (Samuel
and Nelson 1982).
1

2
know if food plots can improve the deer resource in a National Forest. The objective of this
study was to determine if food plots, available year-round, increase deer body growth,
antler development, productivity, and hunters' success in a National Forest.

LITERATURE REVIEW
Deer nutrition, growth, reproduction, and harvesting are broad subjects. Much work
has been conducted in these areas — small libraries could be filled with pertinent literature.
A complete synopsis of the studies in these areas would he burdensome and unwieldy to the
reader; hence, the crux of the research dealing with these subjects follows.
Forage Quality
I define forage quality as Ihe degree to which forage is palatable and/or preferred by
an herbivore. Planl chemical, structural, and digestibility factors influence forage quality
(Vangilder el al. 19B2). Additionally, forage quality is site- and seasonally-dependent. For
example, plants growing in more fertile soils usually are more nutritious than plants growing
in less fertile soils (site-dependent), and the natural aging process of a plant causes
decreases in plant nutrient concentrations resulting in a decrease in forage quality, especially
as the plant becomes senescent (season-dependent).
Many regions in the United States, particularly in the South. supporL native
vegetation that is relatively low in dietary quality during much of the year (Short 1969,
Byrd I960). Low dietary quality in plants can be attributed to several causes. FirsL,
relatively low quality vegetation may arise because the soil nutrient supplies sometimes are
lacking because of weathering and/or an inherent lack of particular soil nutrients (Brady
1974:279). A soil lacking in nutrients contributes to diminished floral production. Vegetation
produced on such soil has a corresponding lack of nutrients which can detrimentally impact its
nutritional value. Second, nutrient levels of plants decline as plants mature (Pearson e t al.
1982). Third and similar to the second-listed cause, digestibility of native plants decreases
as plants mature (Pearson e t al. 1982). This decrease in digestibiliLy can be attributed to an
increase in cellulose and lignin content in plants. Deer do not efficiently digest plant matter
3

4
high in fiber content (Short 1970. For these reasons, native vegetation in the South
sometimes is relatively deficient in nutritional quality — crude protein, phosphorous, and
digestibla energy in particular (Swank 1956, Lay 1957, Goodrum and Raid 1962, Murphy and
Coates 1966, Blair and Epps 1969, Short 1969. Short e ta l. 1969. Varner e ta l. 1977,
Bryant e ta l. 1980, Thill and Morris 19B3. Meyer e ta l. 1984).
Even though some areas support native vegetation that is sometimes deficient in
nutrient content, this does not mean that these areas are woefully inadequate. If an area has
a history of sustaining a population of free-ranging herbivores, the quality of the flora in the
region is generally adequate to meet the physiological demands of the animals. Even though
considerable variation in quality exists among plant species, animals such as deer are able to
select the most nutritious forages available (Swift 1948, Cook e ta l. 1953, Bissell 1959,
Hesselton and Hesselton 1982) thereby enhancing their ability to procure a nutritious, well-
balanced diet. If forage quality is too low, animals probably disperse from the area or suffer
from nutritional maladies.
Deer Nutrition and Its Ramifications
Food components (proteins, vitamins, lipids, carbohydrates, and inorganic elements
and compounds) are interactive in their metabolic pathways which makes nutrition a complex
subjecL. Because of the complexity of nutrition along with lime and monetary constraints,
researchers have restricted their nutritional investigations of deer to macronutrients.
Among the nutrients which have received greatest scientific scrutiny are crude protein (CP),
phosphorous (P), energy, and calcium. These nutrients play a major role in growth (body and
antler) and reproduction.
Mineral requirements of deer are similar to those of beef cattle (French e t al. 1956).
In addition to those minerals listed for beef cattle (Table 1), researchers have demonstrated
that deer requirements for crude protein needed for maintenance versus maximum growth
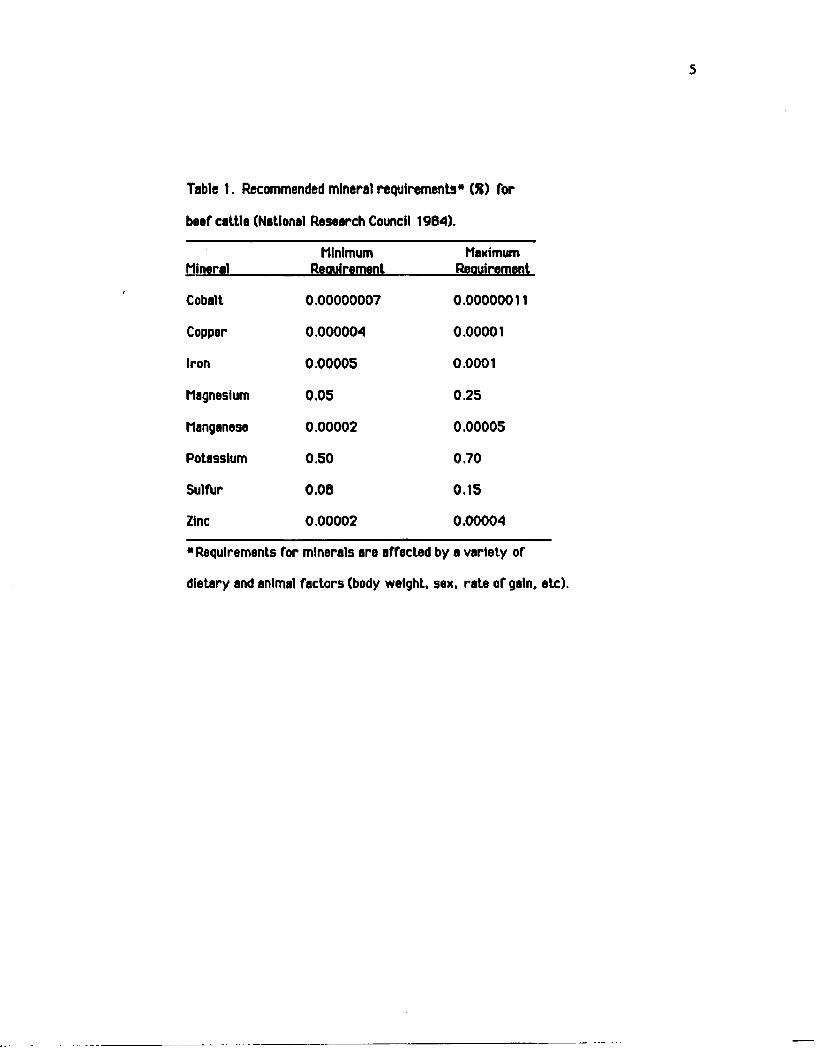
Table t . Recommended mineral requirements1* (8) for
beef cattle (National Research Council 1984).
MineralMinimum
ReauirementMaximum
Reauirement
Cobalt 0.00000007 0.00000011
Copper 0.000004 0.00001
Iron 0.00005 0.0001
Magnesium 0.05 0.25
Manganese 0.00002 0.00005
Potassium 0.50 0.70
SulfUr 0.08 0.15
Zinc 0.00002 0.00004
“ Requirements for minerals are affected by a variety of
dietary and animal factors (body weight, sex, rate of gain, etc).

6
rang* from approximately 6X to 25X (Smith a t al. 1975, Holter a t al. 1979), Ca
requirements range from 0.09X to 0.649! (French a t al. (956, McEwen e t al. 1957), and P
requirements range from 0.20JC to 0.569! (McEwen e t al. 1957, llllrey a t al. 1975) of the
daily diet.
The central theme in deer nutrition studies is that deer generally improve in growth
capacity, antlar development, and productivity as overall dietary quality improves. A
nutritious diet facilitates body growth of deer (Einarsen 1946, French e t al. 1956, Lay 1957,
McEwen et al. 1957, Klein 1962, Verme 1963, Dietz 1965, Verme 1965, Murphy and Coates
1966. Ullrey e ta l. 1967, Klein 1969, Short e ta l. 1969, Nixon e ta l. 1970, Verme end Ullrey
1972, Robinette e t al. 1973, Thompson e t al. 1973, Ullrey e t al. 1973, Kirkpatrick al al.
1975, Smith e t at. 1975. Holter and Hayes 1977, Holter et at. 1979. Verme and Ozoga I960,
Ozoga and Verme 1982, Jacobson 1984, Hobbs and Swift 1985) and anUer development
(French el al. 1956, Murphy and Coates 1966, Hesselton and Sauer 1973, Robinette et al.
t973, Ozoga and Varme 1982, Ullrey 1983, Williams et al. 1983). A nutritious diet enhances
ovarian functioning (Verme 1965, Short 1969, Hesselton and Jackson 1974) and deer
productivity (Cheatum and Severinghaus 1950, Murphy and Coates 1966, Verme 1965,
Verme 1967, Verme 1969, Robinette e l al. 1973, Ozoga and Verms 1982, Hobbs and Swift
1985, Verme 1965, Murphy and Coates 1966). Futhermore, a nutritious diet Increases milk
production in does which is beneficial to fawns (Cheatum and Severinghaus 1950, Verme
1963, Murphy and Coates 1966, Meyer at al. 1984).
Food Plots and Deer
The use of "food plots* has a long history. For over 50 years, game managers in the
eastern and southeastern United States have used forest clearings to create vegetative
diversity and produce supplemental food for wildlife (Larson 1966). Currently, states such
as Louisiana and Texas plant food plots for wildlife manegement programs (Patti Groetsch.

7
Wildlife Biologist, La. Dept. Wlldl. and Fish., Baton Rouge, personal communication, 1990;
Welshuhn 1983). Additionally, the Forest Service plants food plots on log-chipping and log
-loading sites. With public and private agencies commonly planting food plots today, the
practice is likely to continue.
Despite their current usage, food plots are viewed by many with skepticism and
disfavor. Some consider them an unnatural method of increasing a deer population to an
artificially high level which cannot be supported withoul continued, prohibitively expensive
support (Mautz 1978:344). Conversely, the practice of using food plots has a number of avid
supporters. Persons argue that diminished habilaL calls for intensive wildlife management.
With hunting being confined to ever-smaller tracts of land, private landowners are finding iL
increasingly profitable to lease lands for hunting (Weishuhn 1983). To justify high lease
costs, land managers often employ intensive wildlife management practices such as food
plots. Additionally, food plots can improve deer nutrition and physiological performance.
Johnson el at. (1987) found that body weights of free-ranging deer on an area with cool
-season food plots consisting of subterranean clover were significantly greater (P <0.01)
than body weights of deer on an area withoul food plots because crude protein and
digestibility of subterranean clover exceeded that of native (southeastern Louisiana) forages.
They estimated * 40X of the cool-season diets of free-ranging deer were comprised of
forages from the rood plots that totaled < IX of the habitat. In a substudy of theirs, captive
fawns grazing wheat or subterranean clover gained about twice as much weight as fawns fed
a simulated native diet. Their study explicitly demonstrated the potential benefits of cool
-season food plots on deer. In a study of the effects of warm-season food plots on deer in
southeastern Louisiana, Keegan e t al. (1989) found that American joinLvetch provided •> 32X
of the diet (about 0.45 kg of forage per deer per day) of free-ranging deer and that deer with
a Jolntvetch-supplemented diet consumed significantly greater (P < 0.01) concentrations of
crude protein (CP), phosphorous (P). and calcium (Ca) than deer foraging on native vegetation

8
[17.591 vs 12.191 CP. 0.2391 vs 0.17X P. and 0.959? vs 0.8391 Ca in joinlvetch
-supplemented vs native vegetation diets].
Dear need quality forage year-round to meat their physiological demands. Antler
development in spring and summer, lactation in summer and fall, fawn growth In summer and
fall, and recovery from the ru t during late winter and spring place high metabolic demands
upon deer. Yet summer and fall forage can be deficient in nutrients needed to meet the high
metabolic demands of deer (Goodrum and Reid 1962, Thomas 1966, Lay 1969, Korschgenet
al. 1980. Ockenfels and Bissonette 1962, Fenwood et al. 1984. Scotter I960, Blair e ta l.
1984). High qualiLy winter forage is often lacking because of harsh weather conditions. Food
plots and supplemental feeding can be used to improve deer nutrition during the winter,
summer, and fall.
Food plots can produce an intangible benefit as well — they can contribute to a
landowner's sense of the land ethic (Leopold 1949:201-226). Some landowners undoubtedly
receive deep satisfaction if they are able to enhance the wildlife carrying capacity of their
land with food plots, especially with so much habitaL degradation occurring in today's world.
Summarily, food plots are used primarily to maximize a deer resource. Nutritionally
superior forages grown on food plots can provide a basis for improving body growth, antler
development, and productivity. With increasing demands on our natural resources (deer
included), the use of food plots probably will gain in acceptance and become more widely
utilized in the future.
The Effect of Food Plots on Deer-Hunting Success
Numerous studies have been conducted on various facets of deer hunting. Subjects
such as hunting efficiency (Holsworth 1973), hunters' altitudes and behaviors (Kennedy
1974), hunters' fidelity to hunting sites (Langenau and Aldrich 1981), hunt ratings (Langenau
a ta l. 1981), results of controlled deer hunts (Van Etten et al. 1965, Roseberry e ta l. 1969),

9
comparisons of violators and nonviolators of hunting laws (Shafer e t al. 1972) and hunter
distribution in a forest (Thomas e t al. 1976) have captured the attention of various
researchers. However, few, if any, studies have bean conducted on the effects of food plots
on deer-hunting success. Empirical evidence indicates that food plots aLlract deer and,
therefore, deer might be easier to harvest where food plots exist because deer lend to be
attracted to areas with concentrated food sources (Byford 1969). Regions with
concentrated food sources such as food plots allow deer to forage for a relatively short lime
and still consume high levels of nutrients. This tendency could favorably affect hunters'
success by increasing deer abundance near food plots.

STUDY AREA
Location and Topoaraohv
This study was conductad a t National Rad Dirt Wildlifs Management Praaarva,
hereafter cattad Rad Dirt or Presarvs. Rad Dirt is locatad in southcantral Natchitoches Parish
in west-canlral Louisiana (Fig. 1) and is approximately 48 km southwest oF Natchitochas.
Louisiana and approximately 97 km northwest of Alexandria, Louisiana; the Preserve is a
15,516 ha subcomponent of the Kisatchie Ranger District in the KisaLchia National Forest
(Fig. 2). The area is characterized by gently rolling to steep hills interspersed with numerous
ravines and streams. Topographical relieF varies up to 52 m and the maximum elevation
above sea level is 110 m.
Climate
West-central Louisiana has hot, humid summers and short, mild winters. Hottest
months are July and August with mean temperatures oF 28*C (Martin e t al. no date); coldest
months are December and January with mean temperatures oF B*C (Table 2). Annual
precipitation ranges From 122 - 152 cm. MosL rainFall occurs in winter and spring. Rain
often lasts several days during these seasons. Summer rains usually occur as intense
thunderstorms. Climatic data For 1983 - 1989 are presented in Table 3.
Soils
Five soil associations, Kisatchie - Oula, Anacoco - Malbis, Guyton, Balis - Briley, and
Bellwood - Natchitoches - Keithville, constitute the soils at Red Dirt (Martin el. al. no date)
(Fig. 3). Kisatchie - Oula soils predominate the Preserve and are Found In upland areas with
gentle to steep slopes. These soils have a loamy surface layer, a clayey subsurFace layer,
and are moderately well drained to well drained. They are poorly suited For cultivated crops
and pastureland because oF slope, low Fertility, and rock outcrops. Anacoco - Malbis soils are
10

11
Fig. t . Location of National Red Dirt Wildlife Management Preserve, Natchitoches Parish, Louisiana.

Fig. 2. Kisatchie Ranger District (shaded areas), including National Red Dirt Wildlife Management Preserve [in Natchitoches Parish, Louisiana].

Table 2. Temperature and precipitation, 1951-1973, recorded a t Natchitoches,
Louisiana (Martin et. al, no date).
Month
Temperature (C*) Precipitation (cm)MeanDallyMan.
MeanDallyMin.
OverallMean Mean..
Mean 0 Days w / i 0.25cm Preclo.
January 16.1 3.3 9.7 10.9 6
February 18.2 4.6 11.4 11.2 6
March 22.1 7.8 14.9 10.5 6
April 26.7 12.7 19.7 12.6 6
May 30.2 16.5 23.4 14.1 6
June 33.6 20.3 27.0 9.4 6
July 34.9 21.8 28.4 8.6 6
August 35.1 21.1 28.1 7.2 5
September 32.4 18.6 25.4 10.4 5
October 27.6 12.1 19.9 7.2 3
November 21.4 7.1 14.3 9.8 6
Pecemtar 1Z£ 10.8 15J. 7
Y early Mean 2 6 .3 12.5 19.4 ----- -----
Y early Total ----- ----- ----- 125.1 6 8

14
Table 3. Rainfall record (cm) for National Red Dirt Wildlife Management Preserve,
Natchitoches Parish, Louisiana; 1983-1989.
1983 1984 1985 1986 1987 1988 1989Month W.C." W.C. W.C. W.C. W.C. W.C. Wild." W.C. Wild,
Jan 17.60 8.56 8.03 2.92 8.18 7.26 7.77 23.62 20.75
Feb 14.96 17.70 22.20 7.98 22.81 7.06 7.01 11.35 8.86
Mar 12.37 14.10 13.36 4.22 7.24 22.61 23.65 10.19 11.28
Apr 8.00 11.10 6.40 8.00 2.03 4.47 4.55 7.14 3.35
May 33.86 12.98 7.90 14.33 7.62 4.11 5.49 31.42 26.01
June 14.86 7.39 4.27 16.00 9.96 8.28 4.88 47.23 56.24
July S.56 6.45 15.60 5.61 10.85 16.66 5.46 16.81 14.30
Aug 14.22 8.59 7.16 6.35 18.67 10.29 12.70 8.13 6.30
Sept 9.42 16.03 13.59 9.45 7.59 2.06 1.85 trace trace
Oct 8.53 29.34 33.73 15.24 5.33 10.67 16.66 8.00 5.13
Nov 24.84 22.96 11.81 18.62 30.35 7.54 4.95 4.04 3.05
Dec 20.78 5.26 1255 . JLL5Q. 2&24 29,9ft 11.68 12.45
TOTAL 185.14 160.45 154.33 121.26 148.13 127.25 115.87 179.61 167.72
"W.C.* Work Center rain gauge (located « 8km west of Red Dirt); Wild. * Wilderness rain
gauge (located near northwestern edge of Red Dirt National Wilderness).

15
Betis-Briley
Bellwood-Natchitoches Keithville Kisatchie-Oula
t
jllHjii! Jrf-iiiiiilfi i i l i u i r t i l i t i i i i i t f f i i i i i i i i
i i s s t i m i i i
H l U i t f t S U i j j i t i i i i i j l i J i l
iHHtiUHisitttittitilH
......m t m t m m s t t i j j i n i t i :
i r i i i t l
IIIWIi i t n u H i i i S i i i i i i } ; ; : : : ; ! :
Guyton — i
Anacoco-Malbis
miles 0
Fig. 3. Soil associations at National Red Dirt Wildlife Management Preserve, Natchitoches Parish, Louisiana.

16
found in level to gently sloping upland araas. Those soils have a loamy surface layer and a
loamy and clayey subsurface layer and are poorly drained to moderately well drained. They
are poorly suited for cultivated crops and moderately well suited for pasturelend because of
slope and low fertility. Guyton soils are level, poorly drained loam soils found in flood plains.
They are poorly suited for cultivated crops and pastureland because of wetness and flooding.
Betis - Briley soils have a sandy surface layer and a sandy and loamy subsurface layer and
are found in uplands with gentle to steep slopes. These soils are well drained to excessively
drained and are poorly suited for cultivated crops and moderately well suited for pastureland
because of soil droughtiness, low fertility, and slope. Bellwood - Natchitoches - Keithville
soils are found in gently to strongly sloping upland areas, are poorly drained to moderately
well drained, and have a loamy surface layer and clayey and loamy subsurface layer. They
are poorly suited for cultivated crops and moderately well suited for pastureland because of
slope and low fertility.
Flora and Fauna
Red Dirt is on the northern fringe of the longleaf pine (Pinus palustris) - bluestem
(Androooaon sdd.) range in Louisiana. In its virgin state, this range consisted largely of
parklike stands of pine and an understory dominated by grasses. Ecologists regarded the
community as a fire subclimax (Grelen and Duvall 1966). Man's management of the range has
altered the overstory and understory composition greatly, however. Current botannical
composition of Red Dirl is discussed below.
Approximately 25X of Red Dirt consists of bottomland vegetation (Chatham 1959).
Bottomlands are highly dispersed and a wide variety of vegetation dependent on soil type
exists in these low-lying areas. Common bottomland species include blackberry (Rubus sdd.).
smilax (Smilax sod.), dogwood (Cornus florida). American beautyberry (Callicaroa
americana). grape (V itisspp.). loblolly pine (P. taeda). sweetleaf (Svmolocos tinctorial.

redbay (Persea borbonia). red maple (Acer rubrum). blackgum (Nvssa svlvatica).
huckleberry (Vacdniuro elliotti). sweetgum (Liouidambar aivreclflue). water oak (Quercus
nlora). wax myrtle (Mvrtca cerifera). yaupon (Hex vomitnria). and yellow jessamine
(Gelsemlum semoervlrens).
The remainder of Red Dirt Is covered by upland vegetation which includes longteaf
pine, loblolly pine, pinehill bluestem (Androoooon diveroens). blackberry, smilax, Japanese
honeysuckle (Lonicera iaoonicp). yaupon, blackjack oak (£. marilandica). post oak (Q.
stallata). sandjack oak (Q. incana). southern red oak (Q. falcata). American beautyberry,
grape, sweetleaf, blackgum, huckleberry (y. elliotti and y. aboreum). dogwood, and
persimmon (Diosovros virainiana). The overstory in the upland areas consists mainly of
second-growth pine with occasional hardwoods.
Wildlife species within the Preserve include cottontail rabbits (Svlvilaous
floridanus). swamp rabbits (£. aouaticus). gray squirrels (Sciurus caroiinensls). fox
squirrels (S. niaer). raccoons (Procvon lotorl. Virginia oooossums (Didelohis viroiniana).
white-tailed deer (Odocoileus virainianus). wild turkeys (Meleaaris aailopavol. bobwhites
(Collnus viroinianus). mourning doves (Zenaida macroura). American woodcock (Scolooax
minor), red foxes (VuIdbsvuIqbs ). gray foxes (Urocvon cinereoaraenteus). coyotes (Canis
latrans). and bobcats (Felis rufus). Numerous species of nongame mammals and birds exist in
the Preserve, most notably, the endangered red-cockaded woodpecker (Plcoides borealis).
History of Red Dirt and Current Land Use Practices
The National Forest Reservation Commission established the Kisatchie National Forest
in 1930. Prior to acquisition, most of the Forest had been dearcul by commercial limber
harvesters. The Civilian Conservation Corps reforested much of the area during the early
1930's. The Forest Service and Louisiana Department of Wildlife and Fisheries established
National Red Dirt Wildlife Management Preserve in 1941 as a deer enclave from which a sta te-

18
wide deer restocking program could be initiated.
Today, Red Dirt is essentially an even-aged forest managed for multiple resources
(timber production, watershed conservation, wildlire conservation, and recreation). Cattle
grazing is not authorized. Each resource use is supposed to enhance the other uses. In timber
production, for example, cuttings are supposed to be limited to tracts averaging 16-20 ha for
pine and 6-8 ha for hardwoods (exceptions do exist). These relatively small-sized blocks
produce a habitat mosaic with the resultant increased edge effect being beneficial to wildlife
(McGinnes 1969, Resler 1972, Robinson and Bolen 1989:72). Timber is thinned to
approximately 1.88 - 3.76 sq meters/ha basal area, dependent on timber type (loblolly pine,
tongleaf pine, upland hardwoods, bottomland hardwoods, or mixed hardwoods), age. and site
index (Chip Ernst, Asst. District Ranger. Kisatchie Ranger District, Kisatchie National Forest,
USDA ForesL Service, personal communication, 1990). which stimulates underslory
production (Blair 1960), including the numerous browse species listed above. Areas subject
to erosion such as woods roads and logging skid trails are fertilized with 604 kg/ha of
8-24-24 fertilizer and planted with plant species such as brownlop millet (Panicum
ramosum), Pensacola bahiagrass (Pasoalum note turn). Italian ryegrass, Korean tespedeza
(Lesoedeza stipulacea) and sericea lespedeza (L. cuneata) that are valuable to wildlife (Martin
e ta l. 1951:378-379 and 405-406, Johnson eL al. 1987). Prescribed burns, which can
contribute to an improvement in the nutritional quality and production of forages and browse
(DeWitt and Derby 1955, Ahlgren 1960) are common at Red Dirt. Wildlife stand improvement
(an improvement made in a limber stand to increase its value to wildlife — an example is
reducing the overslory to increase underslory production) is a common form of habitat
manipulation. The above examples or multiple-use management practices have wide-ranging,
potentially beneficial impacts on the Red Dirt ecosystem; a listing of these practices and the
number of hectares they impact is provided in Table 4 (an explanation of the study units is
provided in the Experimental Design section).

19
Table 4. Forest treatments a t National Red Dirt Wildlife Management Preserve, Natchitoches
Parish, Louisiana; 1979 - 1988.
______________________Number of Hectares_______________________Study Erosion Wildlife Timber Timber Prescribed1 M Year Control Seeding "WSI Regeneration Thinning Burn
1984 — •— 43 43 163 1327
1985 — — — 62 — —
1986 12 12 — 65 189 777
1987 3 — 21 — 12 291
1988 2 — & 12 149 518
TOTAL: 17 12 69 189 513 2913
1983 10 110 8 110 — —
1984 — — 45 87 7 389
1985 57 — —
1986 2 7 7 31 95 453
1987 4 — — 76 35 308
1988 2 1 Z2Z 26 269 518
TOTAL: 38 117 121 387 406 1668

20
Table 4. Forest treatments at National Red Dirt Wildlife Management Preserve. Natchitoches
Parish. Louisiana; 1979 - 1966 (continued).
Number of HectaresStudyUnit Year
ErosionControl
WildlifeSeedlno -WSI
TimberReaeneratlon
TimberThinning
PrescribedBurn
Suffer: 1981 58 297
1982 — — 24 75 601 —
1983 — — 2 120 932 —
1984 — — — — — 405
1985 — — — 104 — 291
1986 — — — 134 409 —
1987 330 — 8 32 263 1052
1986 — — — — — m
TOTAL: 330 0 34 523 2502 1926
T1: 1980 — — 20 18 140 —
1981 — — 34 74 445 —
1962 — — — 26 200 —
1964 — — — 54 — —
1985 — — — 109 — —
1986 — — — 40 — —
1986 — 66 5 142 366 178
1987 — — — — — 113
TOTAL: 0 66 59 463 1151 291

21
Table 4. Forest treatments at National Red Dirt Wildlife Management Preserve, Natchitoches
Parish, Louisiana; 1979 - 1900 (continued).
Number of HectaresStudyUnit Year
ErosionControl
WildlifeSeedlna •WSI
TimberReaenerallon
TimberThlnnlno
PrescribedBurn
T2: 1979 228
1982 — 17 28 16 109 —
1985 — — — 66 — 61
1986 — — — 33 — —
1987 2 — 25 117 83 —
1988 2 4 13 4 155 zzz
TOTAL: A 17 57 614 347 81
Wilderness:
1986 — — — 2833 — —
"WSI - wildlife stand improvement.

•rr.
22
Numerous recreational pursuits are allowed and encouraged a t Red Dirt. Camping,
hunting (National Rad Dirt Wildlife Management "Preserve* is a misnomer; the Preserve
should be reclassified as a Wildlife Management Area), fishing, trail-riding, and hiking are
common pastimes. While no detailed usage records have been kept by the USDA Forest
Service on the majority of these recreational pursuits, records have been maintained on deer
hunting (Table 5) which, along with squirrel hunting, has been the most intensive recreational
use a t Red Dirt. For 14 years after its formation, Red Dirt remained closed to deer hunting.
Deer hunting was firs t allowed in 1955 with a 5-day bucks only hunt. Numerous
sportspersons in the Red Dirt area were opposed to the Preserve being open to hunting, so the
Louisiana Department of Wildlife and Fisheries closed the deer season in 1956 (Aycock
1968:61). Thereafter though, deer hunting has been an annual occurrence a t Red Dirt. The
type of season, all bucks only, all either sex, or a consecutive combination of the two, has
varied through the years according to the dictate of the Louisiana Department of Wildlife and
Fisheries. Hunter participation, hunter efforts per harvested deer (which sometimes is
correlated with deer population density), and total deer kill have varied through the years, as
would be expected. In 1959, all-time highs of 7,616 hunter efforts and 337 deer kills were
recorded; 69 deer were live-trapped and removed to other parts of the slate during this
year. (From 1954 - 1959, the Louisiana Department of Wildlife and Fisheries conducted a
deer restocking program in various parts of the state with Red Dirt deer. In 1954, 1955.
1956, 1957, 1958, and 1959, the Department trapped and removed 83, 151. 181, 172. 60,
and 69 deer, respectively.] The deer kill from 1963 - 1967 was relatively high. The annual
number of deer killed during this period ranged from 233 to 297. The deer kill per year
generally declined during the 1970’s — as few as 14 deer were kilted in 1977. in 1978, only
420 hunter efforts were recorded on the Preserve. Since then, the deer kill per year has
increased steadily. The kill appears relatively stable now — the average deer kill per yew
(As*.) from 1986 to 1988 was 158 A 4 (with bucks only hunting followed by either sex

Table 5. Historical data pertaining to deer-huntfng a t National Red Dirt Wildlife Management Preserve, Natchitoches Parish, Louisiana;
YcrDeer Harvest Total
Males Females HarvestNumber of
Hunters
HunterEfforts/Deer
HuntingSeasoiDates
Number of Days In
SeasonDates of
Either Sex Hunt
1955 90 — 90 1996 22.2 1-5 Dec 5 bucks-only
1956 CLOSED TO HUNTING — — — — — —
1957 86 — 86 2765 32.2 unknown iunk) 5 bucks-only
1958 47 — 47 2090 4 4 5 unk 5 bucks-only
1959 176 161 337 7616 22.6 24-28 Nov 5 28 Nov
1960 96 78 174 4898 28.1 24-28 No/ 5 28 Nov
1961 76 45 121 3545 29.3 24-28 Nov 5 28 Nov
1962 84 — 84 2059 24.5 unk 5 bucks-only
1963 129 121 250 2650 105 29 Nov-3 Dec 5 29 Nov
1964 112 178 290 3121 10.8 27 Nov-1 Dec 5 27-30 Nov
1965 127 131 258 3724 14.4 26-30 Nov 5 26 Nov
1966 132 165 297 4861 16.4 25-29 Nov 5 all
1967 118 115 233 4173 17.9 24-26 Nov, 2-3 Dec 5 24-25 Nov
1968 96 96 192 4525 23.6 23-24 Nov, 29 Nov-1 Dec 5 23-24 Nov

Table 5. Historical data pertaining to deer-huntlng a t National Red Dirt Wildlife Management Preserve. Natchitoches Parish, Louisiana;
1 9 5 5 -1 9 8 9 (continued).--------------------------------------------------------------------------------------------------------------------------------------------Hunter Hunting Number
Deer Harvest Total Number of Efforts/ Season of Days In Dates ofYear Males Fema1es_ Harvest Hunters Deer Dates Season Either Sex Hunt
1969 76 60 136 3464 25.4 22-23. 28-30 Nov 5 22-23 Nov
1970 48 30 78 2803 35.9 21-25 Nov 5 all
1971 55 54 109 3085 28.3 20-21. 26-28 Nov 5 all
1972 30 24 54 2265 41.9 18-19, 24-26 Nov 5 all
1973 75 68 143 3729 26.1 23-25 Nov, 1-2 Dec 5 all
1974 56 43 99 3416 34.5 23-24 Nov, 29 Nov-IDec 5 all
1975 34 32 66 2786 42.2 22-23, 28-30 Nov 5 ail
1976 40 16 56 2518 45.0 26-28 Nov, 4-5 Dec 5 all
1977 3 11 14 1026 73.2 17-21 Dec 5 all
1978 22 — 22 420 19.1 11-12 Nov 2 bucks-only
1979 48 — 48 1650 34.3 9 -11 ,2 3 -2 5 Nov 6 bucks-only
1980 31 — 31 1043 33.6 14-16 Nov 3 bucks-only
1981 31 — 31 unk unk 13-17 Nov 5 bucks-only
1982 66 — 66 unk unk 6-8, 20-24 Nov 8 bucks-only

Table 5. Historical data pertaining to deer-huntlng a t National Red Dirt Wildlife Management Preserve, Natchitoches Parish, Louisiana;
1955 - 1989 (continued).___________________________________________________________________________________________
YearDeer Harvest Total
Males Females HarvestNumber of
Hunters
HunterEfforts/Deer
HuntingSeasonDates
Number of Days In
SeasonDates of
Either Sex Hunt
1983 71 64 135 unk unk 11-13, 25-7 Nov 6 12. 25 Nov
1984 62 30 92 unk unk 3-11, 23-25 Nov 12 23-25 Nov
1985 84 38 122 unk unk 9-17, 23-24, 29-30 Nov 13 23-24, 29-30 Nov
1986 114 53 167 3257 195 8-16, 28-29 Nov, 6-7 Dec 13 28-29 Nov. 6-7 Dec
1987 99 53 152 2860 18.8 7-8, 13-15, 27-29 Nov, 5-6 Dec 10 27-29 Nov, 5-6 Dec
1988 113 43 156 2991 19.2 5-6, 11-13, 25-27 Nov, 3-4Dec 10 25-27 Nov. 3 -4 Dec
1989 121 118 235 3494 14.9 28-29 Oct. 18-19, 24-26 Nov. 2-3 Dec 9 all

26
hunting). During this period, approximately 3,000 hunter efforts per year were recorded. In
1980, the deer kill rose to 239. This relatively high harvest can be attributed to an entire
season of either sex hunting.
The above deer kills reflect the number of deer brought to the check station. A
number of deer killed on Red Dirt most certainly went unreported each year, especially in
light of the fact that law enforcement on the Preserve was not intensive during much of the
year. Red Dirt hunting regulations require hunters to bring harvested deer to the check
station for analysis; however, hunters determined not to comply with the regulations
probably found ways to violate the rules.

METHODS
E w w im w lfilD w tan ,
The entire Preserve, excluding the Red Dirt Netional Wilderness, wes utilized in this
study. Two treatment units, T1 (2,383 ha) and T2 (1,489 ha), and 2 control units. Cl
(2,525 ha) and C2 (2,484 ha), were incorporated into the experimental design (Fig. 4). Food
plots were established on treatment units; no Food plots were established on control units.
A non-fenced buffer zone was used to separate the 4 study units to offset the potential
problem of deer movement among areas. This zone coursed along identifiable roads and
ranged from approximately 1.2 to 3.2 km in width. No food plots were established in the
buffer and deer harvested from this area were excluded from statistical comparisons of
treatment versus control units.
The study units were intended to be as equal in ail aspects as possible, differing only
in the presence or absence of food plots. Habitat types and quality in the study units and the
surrounding vicinity was roughly uniform. Treatment and control units were approximately
equal in regard to deer. For example, in the 3 years proceeding this study (1983 - 1985),
the number of deer harvested per uniL area and the fawn:doe ratio (a measure of
productivity) were not different (P > 0.05) (Tables 6 and 7 and Appendix Tables 35 and 36).
Average body weights of 0.5-, 1.5-, and 12.5-year-old males and females between the
treatment unit types and among the study units generally were not different (P > 0.05)
(Table Sand Appendix Table 37). Sporadic variation was existent; however, no trends were
noticed and I consider the weight discrepancies inconsequential.
In my opinion, the equality of experimental units was achieved for all important
variables except one — the disparity in size of T2 compared to the other units. This
shortcoming was forced upon me by the necessity for unit boundaries to follow identifiable
terrain features. Even so. this was a minor discrepancy because T2 was deemed sufficiently
large to support enough deer for valid statistical reporting.
27

28
N
BufferZone
Red Dirt National Wilderness
T2
Scale:
km 0I 1----- .
miles 0 1
Fig.4, Layout of study units at National Red Dirt Wildlife Management Preserve, Natchitoches Parish, Louisiana; 1986 - 1989.

29
Table 6. Number of deer harvested per square kilometer on control and food plot units at
National Red Dirt Wildlife Management Preserve, Natchitoches Parish, Louisiana;
1983-1985.
Year Control Units (Cl & C2) Food Plot Units (T1 8. T2)Chi-square
Test Probabilitv
1983 0.66 1.04 0.70 < P i 0.80
1984 0.32 1.00 0.50 < P s 0.70
1985 0.58 1.17 0.50 < P i 0.70

30
Table 7. Fawns/adult doe (2 2.5-years-old) harvested on control and food plot units at
National Red Dirt Wildlife Management Preserve, Natchitoches Parish, Louisiana;
1963-1985.
Control Units Food Plot Units Chi-squareYear___________ (Cl & C2)_____________(T1 8._T2)________________ Test Probability
1983 0.75 0.75 P> 0 .95
1984 1.25 0.80 0.70 < P i 0.80
1985 0.67 0.68 P > 0.95

31
Table 6. Mean body weights (kg) of deer harvested on control and food plot units a t National
Rad Dirt Wildlife Management Preserve, Natchitoches Parish, Louisiana; 1983 - 1985.
Age Control Units (Cl & C2) Food Plot Units (T1 M 2 )y sac Category Mean i n tteao t s,*, n p > t
M ales:
1983 0.5 34.1 1 29.5 2.3 6 0.48
1.5 50.0 1.7 9 54.9 2.2 6 0.10
*2.5 69.8 3.2 7 64.0 4.5 7 0.31
1984 0.5 23.6 1.8 2 27.5 1.1 2 0.21
1.5 47.7 1.6 7 49.8 2.2 8 0.45
*2.5 87.3 — 1 56.7 3.4 5 0.05
1985 0.5 27.5 0.2 2 26.9 1.1 5 0.77
1.5 47.5 1.8 11 47.4 1.5 17 0.96
*2.5 58.0 2.0 6 63.1 2.9 5 0.17
Females:
1983 0.5 22.7 2.5 4 29.5 1.0 6 0.02
1.5 40.9 3.5 3 42.0 3.7 2 0.87
*2.5 49.5 1.7 9 51.8 2.6 9 0.47
1984 0.5 23.6 — 1 24.5 — 1 —
1.5 42.7 — 1 39.3 3.4 2 0.67
*2.5 47.4 3.5 4 42.1 1.7 8 0.15
1985 0.5 29.1 0.4 2 25.2 3.8 3 0.48
1.5 39.5 — 1 42.3 2.7 4 0.69
*2.5 48.8 1.4 7 44.5 1.0 10 0.02

32
Deer Censusino
Deer density on each study unit was astimatad prior to the s ta r t of each hunting
season. In 1086, I conducted a spotlight survey by myself during 3 consecutive nights
(4-6 November) from approximately 2000 hours to 0100 hours. A hand-held,
100,000-candlepower spotlight was shined exclusively to the left side of the vehicle. Gravel
roads little used by traffic were traveled at a rate of 8 - II km/hr during this survey.
Routes remained constant in each study unit for the 3 nights and were approximately 8 km
long per unit (Fig. 5). The starting point for each nightly census was rotated among study
units, Mid-story vegetation was not dense and horizontal visibility was generally good.
Weather conditions, however, were less then excellent. Skies were overcast, the ground
was wet from recent rains, and relative humidity was >80X during the firs t 2 nights. An
intermittent drizzle occurred during the third night. The census was not rescheduled because
the gun-hunting portion of deer season began 2 days later (8 November).
Strip censuses of each study unit were made in 1QB7 and 1088. Six LSU School of
Forestry, Wildlife, and Fisheries students conducted a census on 4 consecutive days from
11-14 August 1987 and in 1988, four LSU studenls conducted the census on 4 consecutive
days from 2-5 August. These censuses were conducted in August because student assistance
was more available during this period than any other period prior to deer season. Transect
routes coursed through the same area in each unit both years (Fig. 5). Starting and stopping
points of each transect were placed on readily-identifiable gravel roads to prevent the
students, who were unfamiliar with the Preserve, from getting lost. Transect routes were
oriented north - south in C1, T 1, and T2 and east - west in C2 and were approximately
0.4 km apart to promote independence of observations. The sun was to the back or to the side
of observers at all times during the censuses to facilitate sighLings of deer. Weather
conditions were excellent during the 1987 and 1988 census periods: skies were clear, wind
speed was negligible, and relative humidity was <70%. Transects were traversed during the

33
N Strip Census
C2
km 0 1I--------- 1-----1
miles 0 1
Fig. 3. Censused areas in the study units at National Red Dirt Wildlife Management Preserve, Natchitoches Parish, Louisiana; 1986 - 1988.

34
morning (0700 hours to 1000 hours) and afternoon (1630 to 1930 hours). A total of 9 (in
C1). 10 (in C2). 9 (in T1), and 10 (in T2) transects were conducted in 1987 and a total of 8
transects were made in each unit in 1988. All observers noted the number of deer seen and
compass bearing and distance to each deer.
The average number of deer seen per kilometer of transect in each study unit was
computed and the results were compared for statistical differences. Deer density on each
study unit was estimated with the Hayne (1949) formula of:
N ■ (C/2L)'*(F i/d 1 +...+ Fn/dn) where N - estimated animal population per unit area;
C ■ 43,560 (a conversion factor); L * length of census lines; F i Fn ■ numbers of animals
observed to flush a t the corresponding flushing distances; d l dn m various flushing
distances. The average deer density on the 4 study units was used to estimate the deer
population on the entire Preserve.
Soli Analyses
Twelve soil cores (15 cm deep by 8 cm wide) were collected from the soil surface of
randomly-selected sites at each of 18 prospective food plots fn February 1986 to determine
fertilizer and lime requirements necessary to achieve abundant food plot forage growth. Ten
of the 18 sampled food plots were in unit T 1 and 8 were fn T2. The soil core samples from
each food plot site were mixed together to form a composite sample for that food plot site.
The IB composite samples were analyzed for available nutrients by LSU Agronomy
Department's Soil Testing Laboratory. Fertilization and llmfng rates for all food plots were
based on average nutrient concentrations and pH readings.

35
Food Plots
Tho best available sitas that appaarad to be least limiting to forage growth ware
selected for food plots. Site dispersion was an additional selection factor — sitas ware
selected so that food plots would be widely distributed throughout treatment units in order to
affect as many dear as possible (Fig. 6). Eighteen plots of cool-season forages and 12 plots of
warm-season forage were established in T1 and 11 plots of cool-season forages and 6 plots
of warm-season forage were established in T2. Total acreage used for food plots in this
study (Table 9) was based on the findings of Dr. Mark K. Johnson (Professor, School of
Forestry, Wildlife, and Fisheries, LSU, Baton Rouge, Louisiana) that 0.4 ha of warm-season
food plots and 0.4 ha of cool-season food plots can significantly supplement the dial of
approximately 20 and 10 dear, respectively. At the onset of the study, lir. Ralph Costa,
Wildlife Biologist, Kisatchie Ranger District, liberally estimated the Red Dirt deer population
to be I d ee r/10 ha. Consequently, I grew enough coot- and warm-season forages to
supplement I d ee r/10 ha.
Warm-season plots were planted exclusively with American jolntvetch (hereafter
called jointvetch) fn June 1966; half of each cool-season plot was planted with Kenland red
clover and Caldwell wheat and half with h t. Barker subterranean clover and Caldwell wheat
in October 1986. These species are hereafter called red clover, subclover, and wheal. The
clovers were separated on the plots so differences in production and deer utilization could be
more readily estimated. In October 1966, all cool-season plots were overseeded with
Osceola ladino clover, hereafter called while clover. No food plots were planted in the buffer
zone.
A large number of forage species such as oats (Avena satlva). rye grass (Lolium
multlflorum). soybeans (Glycine max), and so on, are viable selections for a food plot
program. The 5 species I used provided a year-round source of nutritious, palatable food.
Jointvetch provided high quality deer forage from April until November; the cool-season

36
• oool-season plotN
• warm-season plot
• • WildernessArea
C2T2
km 0 1I--------- 1-----1
miles 0 1
Fig.6. Distribution of cool-season and warm-season food plots at National Red Dirt Wildlife Management Preserve, Natchitoches Parish, Louisiana; 1986 - 1989.

37
Table 9. Size and type of food plots on National Red Dirt Wildlife Management Preserve,
Natchitoches Parish, Louisiana; 1986-1989.
Studv UnitTI Studv Unit T2Cool-Season
Plot Size (ha)
Warm-Season Cool-Season Plot Size Plot Size
(ha) (ha)
Warm-Season Plot Size
(ha)
0.6 0.4 0.8 0.6
0.2 0.3 0.4 0.4
0.4 0.2 0.4 0.5
0.8 0.4 0.4 0.4
1.2 0.4 0.4 0.8
1.0 0.4 1.0 0.4
1.0 0.8 1.0 —
0.4 0.4 0.6 —
0.6 0.4 0.4 —
0.2 0.4 0.4 —
0.4 0.4 M z z
0.4 0.4 Total: 6.3 3.2
0.4 — n: 11I
6. I
0.6 —
0.2 —
0.4 —
0.8 —
S<fi —
Total: 10.5 4.9
n: 18 12
Total Cool-Season Plot Area (ha) (Study Units T1 and T2): 8.1 Total Warm-Season Plot Area (ha) (Study Units T1 and T2): 16.8

38
forages provided high quality deer food from October to June.
AH food plots received 2,242 kg/he of ground agricultural limestone and 224 kg/ha
of 8-24-24 fertilizer prior to the firs t growing season. Warm-season plots received an
additional 11 kg/ha of borax fertilizer to stimulate seedling development (Traynor 1980:68).
The following 2 years, 224 kg/ha of 8-24-24 fertilizer and no lime was applied to each food
plot. Plots were disked approximately 15 cm deep to disseminate the fertilizer and lime and
to provide a well-prepared seedbed. Warm-season plots were seeded with 17 kg/ha of
jointvetch and cool-season plots were seeded with 6 kg/ha of red clover. 10 kg/ha
subclover, and 50 kg/ha wheat. Seeding was conducted with an electric motor-driven seed
broadcaster mounted on the back of a Honda 4-wheel All-Terrain-Vehide. Seeds were
harrowed into the soil to promote seed-soil contact. Warm-season ploLs were sprayed with
an herbicide mixture of 9.5 liters Dual 8E (pre-emergent herbicide from Ceba-Geigy Chemical
Co.). 11.4 liters Roundup (post-emergent herbicide from Monsanto Chemical Co.), and
1,135.5 liters of water in mid-April 1987 to reduce weed competition. Spraying rate was
234 liters/ha. Herbicides were not used on cool-season plots because of the relative lack of
competitor species during this period.
Analyses of Food Plot Forages
Food plot production and deer utilization were determined from oven-dried weights of
forage clippings taken inside and outside vegetative enclosures. Vegetative enclosures were
placed randomly on 10 semi-randomly-selected jointvetch plots (semi-random in that
6 enclosures were designated to be in unit T1 and 4 in T2 because of the size discrepancy
between the units). Food plots designated to receive vegetative enclosures were selected
with the use of a random number generator on a pocket calculator (Sharp Model EL-506).
Each food plot receiving an enclosure had an imaginary, numbered, ■ 5 m x 5 m grid system.
A pocket calculator with a random number generator was used to selecL the grid in which the

39
enclosure was placed. Enclosures on jointvetch plots were constructed of hogwire (« 10 cm
square mesh) with steel rods used for vertical support. These enclosures covered e ground
area of approximately 1m2 and were approximately 1.0 m tall to prevent deer from
browsing the tall-growing Jointvetch. Vegetative enclosures were placed on 20 semi
randomly selected cool-season plots. Ten (6 in T1 and A In T2) or the 20 cool-season plot
enclosures were situated randomly In red clover and the remaining 10 enclosures (6 in T1
and A In T2) were placed randomly In subclover. Clover enclosures were contructed of
hogwire and covered a ground area of about 1 m2 but were half the height of jointvetch
enclosures because of the relatively small stature of clovers.
During the study, I noticed that rabbits could crawl through the bottom of deer-proof
enclosures and feed on the vegetation therein. Consequently, 10 rabbit-proof vegetative
enclosures (6 in T1: 3 on red clover and 3 on subclover; A in T2: 2 on red clover and 2 on
subctover) were placed on plots with deer-proof enclosures to ascertain whether rabbit-
grazing removed significant amounts of vegetation from the plots. Rabbit-proof enclosures
were constructed of wire mesh (■> 2 cm square) with dimensions identical to those of deer-
proof enclosures on cool-season plots.
Vegetative clippings in the center of the enclosures and immediately outside the
vegetative enclosures in randomly selected positions [An imaginary, numbered grid system
was established around the periphery of each enclosure. Clipping site within the grid system
was determined with a random number generator on a pocket calculator.) were conducted
during the approximate beginning, middle, and end of growth seasons from 1986 to 1988.
This equated to clippings being conducted in approximately late June, late August, and late
October for jointvetch and mid-January, late March, and mid-May for the clovers and wheat.
Clippings were conducted to determine periodic estimates of production and nutrient content
of the forages. [Exceptions to the 3 clippings per growth season sampling frequency were
jointvetch in 1988 which was clipped once at the end of the growing season and white clover

40
which was not sampled because of the termination of my fieldwork responsibilities.] A
nerrow-bordered, square, wooden frame with an aperture of 400 sq cm was used to
standardize the amount of clipped vegetation. Forages were clipped to ground level and after
each clipping, each enclosure was randomly replaced on the same plot.
Forage production was estimated from oven-dried weights of inside-enclosure
clippings. Deer consumption of the forages was estimated by subtracting outside-enclosure
from inside-enclosure vegetative weights. Percent utilization of forages was estimated as:
(the amount of forage consumed by deer + forage production) x 100. The estimated amount
of food plot forages consumed per deer per day was calculated by: (average kg/ha production
of each food plot forage x amount of acreage of each food plot forage) * number of days since
vegetative enclosures were emplaced or since last clipping * estimated number of deer on
study unit.
Each clipped forage species a t each food plot was placed in a separate paper bag.
After all required clippings were collected, forage specimens were transported to LSU, oven-
dried (Precision Scientific Co. Model 18 convection oven; W.H. Curtin and Co.; New Orleans,
Louisiana) at 60*C for 48 hours, weighed to the nearest 0.01 g on a Sartorius Universal
Balance (Model 3600P; Brinkmann Instruments Co.; Westbury, New York), and ground in a
Wiley mill (Arthur H. Thomas Co.; Philadelphia, Pennsylvania) through a 40 mesh screen.
Forage samples were processed through Southeastern Louisiana Research Station's Near
-Infra-Red Spectrophotometer (Pacific Scientific Model 5 1 A) for crude protein analysis and
through the LSU Agronomy Department's Induclively-Coupted Argon Plasmamembrane (ICP)
Spectrophotometer (Applied Research Laboratories Model 34100 ICP-AES) to determine
mineral (P, K, Ca, Mg, S, Fe, Mn, Cu, Zn. and Co) concentrations. Sample preparation
procedures for near-infra-red spectrophotometry follow those presented by Schenk (1986).
Sample preparation procedures for ICP spectrophotometry were modified from Isaac and
Johnson (1975) in thatHN03 was used as a digestive agent instead of HNO3 -HCIO4 .

41
Deer Fecal Analyses
Thirty fecal pellet groups in each study unit were collected in August, January, and
May for 2 years (1986 - 1988) during the study. These collection periods represented
summer, winter, and spring, respectively. Pellet collection extended through 2 complete
warm-season and cool-season forage growth cycles. Pellet groups on the control units were
collected in as wide a distribution as possible. Pellet groups on treatment units were
collected as close to food plots as possible in order to increase the likelihood of securing deer
fecal matter with a high food plot forage content. Fresh pellet groups with at least several
grams of fecal matter were sought because of extensive nutrient tests and microhistological
examinations of these samples. Pellet groups were placed in separate air-tight plastic bags
and after the complete seasonal quota of fecal pellets had been collected, they were
transported to LSU, oven-dried a t 60*C for 48 hours and ground in a Wiley mill through a
40 mesh screen. Fecal samples were analyzed to determine crude protein and mineral
content as par forage nutrient analyses methods. All fecal samples were analyzed to
determine crude protein content; 10 composite fecal samples (3 samples per composite
sample) per study unit per collection period were analyzed to determine mineral content.
Samples were composited for mineral analyses to reduce costs. Jenks el al. (1989)
demonstrated no difference (P > 0.70) in fecal nitrogen content between composites and the
means of individual samples. I assumed the same relationship holds true for other nutrients.
Fecal pellets were analyzed for the presence or absence of food plot forages.
Approximately 0.25 g of ground fecal matter from each sample was mixed separately in a
50:50 solution of household bleach and water and allowed to set for 5 minutes to reduce plant
pigment coloration (DeLany 1985:11). Approximately 0.10 g of this bleached fecal matter
was ptaced on each of 2 microscope slides, diluted with water, covered with a microscope
cover slips, and scrutinized with a microscope at lOOx power. Fifty fields per slide were
examined. Samples were noted as either containing one or more food plot forages or being

42
devoid of them.
A microhistological examination of deer fecal samples based on methods outlined in
Johnson e l al. (1982) was attempted to determine diet composition, in preparation for this
examination, an informal deer browse survey of Red Dirt and a review of pertinent literature
from researchers who had worked in or near the area (Aycock 1968, Thill 1983) was
conducted. From these endeavors, a list of plant species deer were likely to browse was
concocted. In as much as Dr. hark K. Johnson maintains an extensive library of plant
specimens for microhistological work a t LSU. plant species that were not already available as
reference slides were collected and reference slides were made of them. After extensive
viewing of these reference slides and making reference drawings of vegetative species deer
were likely to browse, a proficiency test of identifying microscopic plant fragments was
conducted. Eleven vegetative species were ground in a Wiley mill through a 20 mesh screen
and composited in varying proportions into 10 te st mixtures. Each te st mixture contained
anywhere from 4 to 8 plant species. Fifty microscope fields of each of 5 randomly selected
test mixtures were viewed and species frequency was noted; a chi-square test (Steel and
Torrie 1980: 477) on expected versus observed vegetative frequencies indicated a
difference (chi-square * 71.25, 10 d.f., P< 0.01) — the composition of the te st mixtures
was not accurately identified. I continued to refine my microscope analysis technique and to
study plant reference slides and reference drawings for another month. A re test of my
microhistological proficiency was conducted — this time with 5 test mixtures of varying
amounts of the 11 vegetative species contained in the firs t proficiency test. Fifty
microscope fields of each of the 5 test samples were examined and again, no sample
composition was identified accurately (chi-square ■ 59.09, 10 d.f., P< 0.01). Consequently,
the attempt to identify deer diet composition at Red Dirt was abandoned.

43
Deer Check Station
Dales for the 1986-1989 deer-hunting seasons at Red Dirt are listed in Table 10.
Bag limit of deer during the study was I/day with a limit of 6/season. The deer check
station was not staffed during the lengthy archery season because of time, money, and
personnel constraints. During gun-hunting season, the deer check station was staffed by
assorted combinations of various Kisatchie National Forest (Forest Service) personnel,
various Northwestern State University (Natchitoches, Louisiana) wildlife students, various
LSU School of Forestry, Wildlife, and Fisheries students. Dr. Arthur Allen (Professor.
Department of Life Science, Northwestern State University, Natchitoches, Louisiana), Dr.
Mark K. Johnson, and myself. Hunters wore required to check in and out of the Station aach
day and to bring killed deer to the check station before field-dressing them. At the conclusion
of each day, hunters were questioned concerning the number of hours they hunted and
whether they saw and shot at any deer. Killed deer were weighed to the nearest pound with a
Jacobs Detecto balance scale (New York, NY) and age was estimated by tooth wear and
eruption (Severinghaus 1949) as 0.5-, 1.5-, 2.5-, or *3.5-years. Numerous researchers
(Blood and Lovaas 1966, Moen 1973:263 and 436, Anderson eL al. 1974, Roseberry and
Klimstra 1975, Parker a t al. 1984, Parker 1987, and others) have used various body-
surface measurements as indices of body condition and growth in Cervidae species. Because
heavier deer generally have longer lag measurements than lighter deer (Roseberry and
Klimstra 1975), humerus length (the distance from the proximal tip of the greater tuberosity
to the distal tip of the lateral epicondyle) was used as an index to corroborate the findings of
body weights. Humerus length was measured to the nearesl centimeter with a seamstress
tape. Additionally, antler points were counted (any antler protrusion greater than 2.5 cm
was considered a point), and various antler measurements (Fig. 7) on each male with antlers
were added for an antler score. Hunters who had killed deer were questioned as to their
name, hometown, kill site, and number of hours hunted before making the kill.

44
Table 10. Deer-hunting dates at National Red Dirt Wildlife Management Preserve,
Natchitoches Parish, Louisiana during the 1986-1989 deer-hunting seasons.
SeasonGun-huntina Archerv
Dates Tvoe of Hunt Dates Tvoe of Hunt
1986 8-16 November bucks only 1 October-20 Jan 1987 either sex 1
28-29 November either sex
6-7 December either sex
1987 7-8 November bucks only 1 October - 20 Jan 88 either sex 1
13-15 November bucks only
27-29 November either sex
5-6 December either sex
1988 5-6 November bucks only 1 October-20 Jan 1989 either sex 1
11-13 November bucks only
25-27 November either sex
3-4 December either sex
1989 28-29 October either sex 2 1 October-20 Jan 1989 either sex 1
18-19 November either sex
24-26 November either sex
2-3 December either sex3
1 Bucks only during bucks-onty gun-hunting season.
2onIy persons i 16-years-old could shoot a t deer.
3B1ack-powder weapons only.

45
m
Detail of tine measurement.
Antler score * total number of centimeters in(a + b + c + d + e + f+ g + h + i + j+ k + l * m ) 4 number of antler points.
fig. 7. Antler scoring methodology of study at National Red Dirt Wildlife Management Preserve, Natchitoches Parish, Louisiana, 1986 - 1989.

46
Deer Productivity
According to Mansell (1971), ovarian analyses are availd method of determining
productivity; consequently, an ovarian analysis was conducted on killed female deer (except
for those hsrvesled during the 1989 hunting season because of the earliness of the hunting
season in relation to the Red Dirt deer breeding season). Ovaries, fallopian tubes, and the
upper uterine tracts were removed, placed in separate plastic bags into an ice chest filled
with ice, and transported to LSU at the end of the weekend hunt. At LSU, each ovary and
uterus was sliced sagitally with a razor blade and analyzed for the presence of corpora lutes
and embryos. Corpora lutea were defined as luteinized follicles greater than 4mm in
diameter (Tear et al. 1965:33). Embryos were measured for crown-rump length (Noble
1974:9) with Slaedtler calipers and weighed to the nearest 0.01 g on a Sartorius Universal
Balance after being partially dried on paper towels. Frequency of fertilization, reproductive
rate, reproductive efficiency, ovulation rate, and breeding dates of deer on each study unit
were determined from results of reproductive trac t analyses. Equations deriving these
variables were obtained from Noble (1974):
Frequency of Fertilization ■ number of pregnant adult females x 100number of adult females in sample
(Frequency of fertilization » percentage of adult females (i2.5-years-old) in a herd that become pregnant in any one breeding season),
Reproductive Rate * total number of embrvos in all pregnant femalesnumber of pregnant females
(Reproductive rate - average number of fetuses per pregnant female).
Reproductive Efficiency ■ total number of embrvos___________ x 100I total number of corpora lutes in pregnant females!
(Reproductive Efficiency ■ percentage of eggs ovulated that become embryos), and
Ovulation Rate - total number of corpora lutea in pregnant females total number of pregnant females
(Ovulation Rate * average number of eggs ovulated by a female during the estrous period she became pregnant).

47
Fawnstadult female ratios in the kill were determined in an effort to quantify herd
productivity (Creed e ta l. 1984).
Economic Aspects of the Year-Round Food Plot Program
Food plot expenses were maintained by Kisatchle Ranger District office personnel and
myself for cost/benefit analyses.
Statistics
Differences between treatment unit types and among study units in the average
number of deer seen per kilometer, average number of harvested fawns per adult female,
frequency of fertilization, reproductive raLe, reproductive efficiency, hunter efforts per
killed deer, ratio of unsuccessful hunters not seeing deer: unsuccessful hunters seeing deer,
and ratio of unsuccessful hunters not shooting a l deer: unsuccessful hunters shooting a t deer
were analyzed with Chi-square goodness of fit tests (Steel end Torrie 1980: 472-474, 477
-478, 495-499). Differences between treatment unit types in average vegetative production
in deer-proof versus rabbit-proof enclosures, deer fecal crude protein content, nutrient
levels of deer fecal matter, deer body weights, humerus lengths, antler points, antler
scores, average number of corpora lutea in the ovaries of females, and average kill-times of
hunters were analyzed with Student's t tests (Steel and Torrie 1980: 96-99). Differences
among study units in average vegetative production in deer-proof versus rabbit-proof
enclosures, deer fecal crude protein content, nutrient levels of deer fecal matter, deer body
weights, humerus lengths, antler points, antler scores, average number of corpora lutea in
the ovaries of females, and average kill-times of hunters were analyzed with 1-way analysis
of variance (Steel and Torrie 1980: 137-145) and Duncan's new multiple range test (Steel
and Torrie 1980: 187-188). Correlation analysis (Steel and Torrie 1980: 272-276) was
performed to describe relationships between humerus length and deer body weights.

48
Statistical tests were conducted with the Stattctical Analysis System program (SAS
Institute, Inc.; Cary, North Carolina) on computers a t LSU's System Network Computer
Canter, Baton Rouge, and with Stalview software published by Brainpower, Inc. (Calabasas.
California). The acceptance level of a Type I error was seL a t 0.05.

RESULTS and DISCUSSION
DEER ABUNDANCE
No deer were seen on any study unit on any of the 3 nights of the spotlight survay in
1986 (Tabla 11 and Appandix Table 38). The lack of dear sightings could be attributable to
many factors, 2 of which are I ) unconventional technique — I conducted the spotlight survey
by myself and I may have missed or overlooked deer. Three persons seem to be the optimum
crew size for spotlighting (Harwell a t al. 1979) because this enables 1 person to drive and
record data and 2 persons to keep a sharp lookout - 1 on each side of the road. 2) The
overcast, wet conditions were not conducive to a good survey (Progulske and Duerre 1964).
Rainy conditions reduce surveyor visibility and thus diminish survey effectiveness. Because
no deer were seen on any study unit despite their known existence, the results of the 1986
survey were inconclusive, but suggested a relatively low deer density.
Better success was achieved with censuses in 1987 and 1988 despite the paucity of
deer sfghUngs (Table 11 and Appendix Table 38). Using the Hayne formula (Hayne 1949) to
determine deer density, no significant difference was found in the number of deer/sq km on
the study units, which suggests an even distribution of deer throughout Red Dirt in 1987
(Table 12 and Appendix 39). The deer herd on the entire Preserve in 1987 was estimated to
be 427 ± 162 deer, which is equivalent to 2.75 ± 1.04 deer/sq km. As in 1987, no
significant difference In deer density existed among study units in 1988. The estimated deer
population for the Preserve during 1988 was 356 ± 72 deer, which equates to 2 .2 9 ± 0.46
deer/sq km. For various calculations in this dissertation, I assumed that the population
density in 1986 was approximately equal to that in 1988. The logic behind my assumption
was that hunter efforts/harvested dear, a sometimes reliable indicator of deer abundance in
an area (Hayne 1984), and the type of hunting allowed (bucks only versus either sex) were
approximately equal during these 2 years.
The Red Oirt deer population in 19B7 and 1988 appear underestimated if one
49

50
Table 11. White-tailed deer population surveys conducted a t National Red Dirt Wildlife
Management Preserve, Natchitoches Parish, Louisiana; 1966 - 1988.
Spotlight Survey:4-6 November 1986
Study No. of T r ansects Transect Total No. ofUnit Surveyed Lenath (km) Deer Seen
ControlUnits
3 16 0
Food Plot Units
3 16 0
S tr ip Census Surveys11-14 Auaust 1987
Study No. of Transects Unit Surveyed
Mean ±s.e. Transect Lenath (km)
Total No. of Deer Seen
Mean No. of Deer Seen / km
Chi-square Test Results
ControlUnits
19 3.35 ±0.31 13 0.20 - P > 0.90
Food Plot Units
19 3.94 ±0.18 13 0.16
2-5 Auoust 1988Study No. of Transects Unit Surveved
Mean ±s.e. Transect Lenath (km)
Total No. of Deer Seen
Mean No. of Deer Seen / km
Chi-square Test Results
ControlUnits
16 3.28 ±0.20 4 0.08 - P > 0.80
Food Plot Units
16 3.60 ±0.30 11 0.18

51
Table 12. Estimates (Hayne 1949) of deer population size in 1987 and 1988 on combined
control and food plot units a t National Red Dirt Wildlife Management Preserve, Natchitoches
Parish, Louisiana.
(Hayne's (1949)Estimate) Estimated
Number of Number of Number ofYfiflC________ Ares___________ Deer/ha___________ ha/Deer____________Deer
1987 Control 0.0056 32.62 86Units (Cl &C2)
Food Plot 0.0034 11.81 32Units <T1 &T2)
entire Preserve 0.0045 (± 0.0017) 36.05 427 (± 162)
1988 Control 0.0032 53.88 50Units (Cl &C2)
Food Plot 0.0043 43.10 50Units (T1 &T2)
entire Preserve 0.0038 (± 0.0008) 43.25 356 (± 72)

52
compares tha huntar efforts par harvested deer during these years with hunter efforts/
harvested deer during past years. The hunter success ra te at Red Dirt in 1967 was
1 harvested dear per 17.9 hunter efforts and deer density was estimated with the Lincoln
Index procedure (Caughley 1977:141-145) as 456 ± 76 deer (Aycock 1966:57). The hunter
success rate in 1967 was similar to the hunter success rates from 1986 - 1988 (19.5,
18.8, and 19.2, respectively) end the dear herd was estimated as 427 ± 162 deer in 1987
and 356 1 72 in 1988. Estimates of deer population size based on changes in hunter success
are founded on the assumptions that the vulnerability of deer to hunling remains constant
throughout the hunting season and that hunter success is proportional to the number of deer
surviving (Hayne 1984). Hunter success is influenced by hunter skill, deer conditioning and
behavior, and weather conditions (Hayne 1984).
Even though numbers of hunter efforts per harvested deer were approximately equal
in 1967 and 1986 - 1988, the deer herd was not equally vulnerable to hunting during these
2 periods. The 1967 season opened with 2 days of either sax hunting while the 1986-1988
seasons opened with bucks only hunling. Because most deer usually are killed during the
opening portion of a hunt, the 1967 deer herd was more vulnerable to hunting than the
1986 - 1988 herd. For equal harvest rates to occur during seasons in which the deer were
unequally vulnerable to hunting, herd sizes would have to be unequal. This implies theL the
1986 - 1988 deer herd was more papulous than I estimated. Regardless, the deer population
was less than originally presumed at the beginning of the study.
SOIL FERTILITY
Soil te st results for TI and T2 collectively averaged 8 (± 1) ppm P (Bray No. 2),
27 (±4) ppm K, 308 (±27) ppm Ca, 47 (±5) ppm Mg, 1.3 (±0.1) X organic maLter, and a
logarithmic pH average of 4.9. A measure of the soil fertility of Red Dirt can be beLler
appreciated if the soil nutrient concentrations are contrasted with soil nutrient

53
concentrations from an area of relatively high fertility. For example, a Bruin silt loam from
Concordia Parish, Louisiana, a region adjacent to the Mississippi River and noted for high
agricultural yields (Martin 198B), averages 84 ppm P, 156 ppm K. 2520 ppm Ca, 180 ppm
Mg, 2.2R organic matter, and 6.4 pH (1:1 H20) in the top horizon (MarLin 1988). The
contrast between the soils a t the Preserve and the Bruin silt loam provides evidence of the
low fertility, especially in P. which is characteristic of the soil associations at Red Dirt.
Various researchers have scrutinized the relationship bBtween soil fertility and
wildlife productivity and body size. Crawford (1950) found that as soil fertility Increased,
animal weights and/or pelt quality of raccoons, muskrats, opossums, and rabbits Increased.
Williams and Caskey (1965) echoed Crawford's sentiments when they found a direct
relationship between cottontail fecundity and soli nutrient content. Deer are beneridally
affected by soil nutrient content. Soli P. Ca, Mg, K, and organic matter were significantly
(P< 0.05) correlated with deer body weights and antler measurements in yearling males
(Jacobson 1984). With relatively tow soil fertility a t Red Dirt, one would expect a
corresponding detrimental effect on deer productivity, size, end antler development because
of a paucity of browse, since plants do not grow well In infertile soils. In fact. Aycock
(1968) stated Red Dirt was renowned for Its low carrying capacity for deer, which he
attributed to insufficient quantities of browse. In my extensive forays at Red Dirt,
however, I found ample amounts of browse available for deer consumption. Multfple-
resource management by the Forest Service Is largely responsible for the excellent condition
of Red Dirt deer habitat. In my opinion, the relatively infertile Red Dirt soils produce more
than enough forage and browse for the current deer population.

54
FOOD PLOT FORAGES — GENERAL COMMENTS
Each forage species in my food plot program had desirable characteristics that
prompted me to include them in the study. For example, subterranean clover and red clover,
when grown in conjunction with range grasses, improve production and quality of pastureland
(Knight a t al. 1976, Knight et al. 1982). Render (1984:23-24) found that during the cool
season, subclover is an excellent source of nutrients, especially crude protein, calcium,
phosphorous, and anergy. Red clover is similarly high in nutritive value; crude protein
content ranges up to 28X and total digestible nutrients range from 88X to 65X during the
vegetative and full-bloom stages, respectively (Taylor 1973). Additionally, subterranean
clover and red clover are more shade-tolerant than many cool-season forages currently
grown in the Southeast (Bula 1960, Hagedorn el al. 1980, Watson et al. 1984). Davis (1983)
found thaL subclover production in a pine forest decreased only about 30 percent as timber
canopy approached 100 percent. The shade tolerance of these plants could improve food plot
production under timber canopies if light was a limiting factor as it sometimes was in this
study. Wheat produced belter weight gains in deer than many other grass forages (Owens
and Newsom 1973, Johnson e t al. 1987) and it is relatively easy to grow. White clover
reseeds easily, is perennial in temperate areas, has good winter hardiness, and is capable of
ample forage production (Leffel and Gibson 1973). White clover is an excellent source of
nutrients: up to 27.71! CP, 2.70 Mcal/kg digestible energy. I.40JS Ca, 0 .5 IX P, 0.45X Mg.
and 2.I3X K (Essig 1985). Jointvetch is a tall, profusely growing plant that has the
capaciLy to supply ample high-quality forage to support lactation, parturition recovery,
antler development, and fawn growth. Additionally, jointvetch has a low maintenance cost,
fixes nitrogen In the soil, has high levels of crude protein (Thro et al. 1987), and often
efficiently reseeds (Moore 1978).

55
FOOD PLOT PRODUCTION AND DEER UTILIZATION
Warm-Season Plots
Jointvetch production increased steadily throughout 1986 and 1987 (Table 13 and
Appendix Tables 40 and 41). End-season production averaged 1.353 ± 498 kg/ha in Tt and
1,744 ± 513 kg/ha in T2 in 1986. Jointvetch production in T1 and T2 was much greater a t
the beginning of the growing season in 1987 than in 1986 because of natural reseeding by the
plants and additional broadcast seeding by myself. At the end of the growing season in 1987,
production in T1 and T2 averaged 70X greater (2.665 ± 733 kg/ha in Tt versus
2.484 ± 553 kg/ha in T2) than end-season production in 1986. Annual plants such as
jointvetch lend to increase production in successive years after their initial establishment if
weather and soil conditions are favorable and if competitor species are controlled. Vetch
production was clipped only once in 1988 (at the end of the growing season) and end-season
production was drastically below 1986 and 1987 levels. Jointvetch production in 1988 was
reduced because of drought conditions.
A direct correlation often exists between the availability of a plant and the
consumption rate of that plant by an herbivore (Pelrides 1975). Jointvetch consumption
followed that pattern in this study (Table 13 and Appendix Tables 40 and 41). Generally,
deer consumed greater amounts of jointvetch as the growth season progressed. Consumption
of jointvetch by deer varied between study units and among years. Consumption tended to
increase from 1986 to 1987 and drop In 1988 (similar to jointvetch production).
Consumption by deer on T2 exceeded that on T1 in 1986 and 1988 but not in 1987. Percent
utilization generally was lower on T2 than on T l. In 1987, percent utilization was greater
during the early portion of the growing season and less during the middle and end of the
growing season, when jointvetch became relatively slemy and less palatable. I attribute this
variation in utilization to site-specific changes In forage preference by deer. Many factors
such as the availability of equally-preferred native forages and disturbances of deer on food

Table 13. Food plot production and deer utilization (mean ± s.e.) in food plot units a t National Red Dirt Wildlife Management Preserve,
Natchitoches Parish. Louisiana; 1986-1988.
Red Clover SubSlflYSC________ Wheat_________ JgjnWctCh________ * k g o fMean Mean Mean Mean Food Plot
Mean Utilization Mean Utilization Mean Utilization Mean Utilization Forages/Time Production Bv Deer Production BvDeer Production Bv Deer Production Bv Deer Deer/Period (ko/ha) (ko/ha) (* « Jt) (ko/ha) (ko/ha) (*KUt) (ko/ha) (ko/ha) (*XUt) (ko/ha) (ko/ha) (*KUt) ..... Dav_
July 86 331118 74110 22 0.20
Sept 86 11481236 191±3 18 0.48
Nov 86 1S481196 294124 19 0.34
Jan 87 56±24 26116 40 64 t14 25114 36 6913 7 i0 10 — — — 0.32
Apr 87 1114188 160112 14 15471191 234148 15 632182 30i1 5 — — — 0.42
May 87 1244192 6814 6 17711227 90 ±8 5 606120 13l4 2 — — — 0.39
July 87 9541314 213130 24 0.38
Aug 87 18431110 238114 13 0.45
Oct 87 2574190 299123 12 0.34
Jan 88 650122 4211 6 937t92 76 t4 8 0.48
Mar 88 886146 118111 18 16921170 220110 13 0.44
May 88 10621158 I19H 12 11151141 12612 12 0.38

Table 13. Food plot production and deer utilization (mean ± s.e.) in food plot units a t National Red Dirt Wildlife Management Preserve.
Natchitoches Parish, Louisiana; 1986-1998 (continued).
_______ Red Clover________ Subclover________ Whsat_________ JolntVetch________ «kg ofMean Mean Mean Mean Food Plot
Mean Utilization Mean Utilization Mean Utilization Mean Utilization Forages/Time Production Bv Deer Production Bv Deer Production Bv Deer Production BvDeer Deer/ Period (ko/ha) (ko/ha) (»SUt) (to/he) (ko/ha) («SUt) feflflia) tW h aL t» SUU (ko/ha) (ko/ha) («*Ut) Day__
Nov 88 — — — — — — — — — 338160 116±16 34 0.07
"XUt - X utilization.
•Based on estimate of 1 deer/36.0 ha in 1987 and 1 deer/43.3 ha in 1986 and 1988.

58
plot areas influence food plot forage intake by deer. Variation in food plot utilization was
expected during the 3 years of this study.
Compared to jointvetch production achieved by other researchers, jointvetch
production a t Red Dirt was relatively low (Table 13 and Appendix Tables 40 and 41). Thro e t
al. (1987) and Keegan (1988) obtained yields as high 7.500 and 5,767 kg/ha, respectively.
The low production at Red Dirt undoubtedly can be attributed to low soil fertility, despite the
addition of fertilizer and lime, and. a t times, low amounts of rain. Nevertheless, deer were
able to forage ad libitum on warm-season food plots. During this study, *2991 of the
jointvetch was consumed during any particular period of the growth season (Table 13 and
Appendix Tables 40 and 41). The majority of the jointvetch biomass was untouched by deer.
Evidently, jointvetch was available in sufficient quantity throughout the growing season to
meet the nutritional demands of deer. Keegan (1988) found that deer consumed a seasonal
average of 2591 of the jointvetch on food plots. Consumption rates throughout this study
were similar to the deer consumption rates of Keegan's study.
Jointvetch provided up to 0.50 kg of dry forage per deer per day on T1 and T2 (Table
13 and Appendix Tables 40 and 41). French e t al. (1956) found that daily food requirements
were 0.91 kg (3,600 cal) Ifor deer weighing 22.7 - 27.3 kg], 1.36 - 1.82 kg (6,300 cal)
[for 45.4 kg deer], and 2.27 - 2.73 kg (9,900 cal) (for 68.2 kg deer] of high quality, dry
forage. The majority of the Red Dirt deer herd appears to be young U 1.5 years-old; see
Deer Harvest — General Comments section). Young, relatively lightweight deer do not have
as great a food requirement as older, heavier deer (French e t al. 1956). Deer consumed an
estimated average of 0.38 kg of food plot forages (0.36 kg jointvetch and 0.40 kg cool
-season forages) per deer per day from July 1986 to May 1988 (Table 13). This would have
provided approximately 42* (for deBr weighing 22.7 - 27.3 kg), 2191 - 28* (for 45.4 kg
dear), and 1491 - 179C (for 68.2 kg dear) of the deers' diet. Johnson et a). (1987) found that
• 40* of the cool-season diets for free-ranging deer was comprised of forages from food

plots. Keegan e t al. (1989) found about 32X of the warm-season diets for free-ranging deer
was comprised of jointvetch. Even though a sizeable portion of the diets was comprised of
food plot forages, one can infer (from Table 13) that the majority of ingested matter was
native vegetation. Leopold el al. (1947), Hubert e t al. (I960), and others have documented
that supplemental feeding seldom eliminates the use of natural foods.
Cool-Season Plots
End-season yields of dry forage were < 1998 kg/ha (subclover), 1336 kg/ha (red
clover), and 626 kg/ha (wheal) (Table 13 and Appendix Tables 40 and 41). In comparison,
DeLany (1985:19) reported a yield of 7,113 kg/ha dry forage of subclover and Taylor
(1973) reported a yield of 7,105 kg/ha dry forage of red clover. Wheat yields of
4,483 kg/ha can be expected from soils of good fertility (Joost e ta l. 1986:5). The low
yields of the cool-season forages a t Red DirL can be attributed to low soil fertility inherent in
the region, despite the addition of fertilizer and lime in this study, and, a l limes, low
amounts of rain.
Subclover production exceeded red clover and wheat production in T1 and T2 during
the first growing season (1987); subclover exceeded red clover production during the second
growing season (1988) as well. Production of the clovers in the second year exceeded
production during the first year largely because of natural reseeding plus additional
broadcast seeding. Production during the letter part of the growth period in 1988 was
diminished because of drought conditions.
During the first growing season, deer utilization of subclover and red clover was
greatest during the early part of the growing season (Table 13 and Appendix Tables 40 and
41). Utilization of red clover and subclover generally diminished after spring green-up of
native forages. Utilization of wheat remained relatively constant during the early and mid
portion of the firs t growing season and diminished toward the end. The diminution in use of

60
the cool-season forages as the season progressed probably is attributable to the greaning-up
and increased availability of warm-season native plants and jointvetch, as well as the
maturation of the cool-season forages.
The cool-season forages provided up to 0.48 kg of dry forage per deer per day a l Red
Dirt (Table 13 and Appendix Tables 40 and 4 1). As with jointvetch, a substantial portion of
the deers* dial was provided by cool-season food plot forages. I am confident that deer were
the principal grazers on the food plots as evidenced by the fact thaL rabbit-grazing on the
forages was negligible during the study. No significant difference existed in vegetative
production from deer-proof versus rabbit-proof enclosures (Table 14 and Appendix Table
42). Rabbits do pose a potential hazard to studies such as this in that they can consume targe
quantities of food plot forages (Render 1984:14-18), but this problem did not materialize at
Red Dirt.
As with jointvetch, cool-season food plot forage availability exceeded deer demand
(Table 13 and Appendix Tables 40 and 41). Deer were able to eat cool-season forages
libitum. Deer never consumed more than 52X of the available cool-season food plot forages
on any food plot unit. Deer consumption of subclover generally exceeded that of red clover
and wheat during the first growing season (1967) and consumption of subclover was
consistently greater than consumption of red clover in the second growing season (1988).
Wheat did not regenerate after the first growing season. Again, dear consumption appeared
related to forage availability. As clover and wheal production increased, deer consumption
of these forages increased.
Fecal Pellet Composition
No food plot forages were found in deer fecal pellets collected from C1 or C2 during
the study Indicating no movement of deer among units. EvfdenLly, the buffer zone was
sufficiently large to prevent any confounding results. Deer from the control units evidently

61
Table 14. Vegetative production (mean i s.e.) in deer-proof enclosures vs rabbit-proof
enclosures on food plots in combined study units T1 and T2 at National Red Dirt Wildlife
Management Preserve, Natchitoches Parish, Louisiana; 1987- 1988.
Forage Type Production (ko/ha)____________________May 87 March 88 May 88
Red Clover(n»5):
Deer-Proof
Rabbit-Proof
P > T:
Subclover (n>5):
Deer-Proof
Rabbit-Proof
P >T:
Wheat(n=10):
Deer-Proof
Rabbit-Proof
P >T:
12591315
12951295
0.4
2005 1 352
2075 1362
0.4
6 5 6 1 196
6 8 7 1 184
0.4
935 1 106
96 5 1 108
0.4
1458 1 270
15151269
0.4
14161258
1460 1 267
0.4
14351306
1452 1 313
0.4

did not graze on the food plots. Conversely, the majority of fecal pellets collected on T1 and
T2 contained food plot forages. This was expected because I collected pellets near the food
plots. The following percentage of pellet groups contained food plot forages in the indicated
months:
(T1) August 1986, 878; January 1987. 508; May 1987, 908; August 1987, 838;
January 1988, 838; and May 1986, 978; (T2) August 1986, 808; January 1987. 678;
May 1987, 738; August 1987, 978; January 1988, 838; and May 1988, 838. The large
number of pellet groups containing food plot forages provides corroborating evidence that
food plots were used extensively, as indicated by the estimated amount of food plot forages
consumed per deer per day (Table 13 and Appendix Tables 40 and 41).
NUTRIENT CONTENT OF FOOD PLOT FORAGES
Jointvelch crude protein (CP) content (whole plant) ranged from 9 6 8 - 1 8 .2 8
during the two growing seasons (Appendix Table 43). In the coot-season forages, CP content
of red clover was generally higher than the CP content of subclover and wheaL (Table 15).
Red clover CP content ranged from 10.88 - 18.38 while subclover CP ranged from 7.48
- 17.48 during the two growing seasons and wheat CP ranged from 4.88 - 13.28. Crude
protein content of food plot forages in T1 versus T2 generally was similar during the cool
-and warm-seasons even though red clover CP content was slightly greater in T1 than T2
during the second growing season (1988). Crude protein content of all food ploL forages
generally diminished as the growing season progressed, especially toward the end.
Decomposition of cytoplasmic proteins occurs during the senescense of plant tissues (Meyer
e ta l. 1973:348).
Macronutrient and micronutrient content of JofnLvetch, red clover, subclover, and
wheat during various growth season periods are listed in Tables 16 - 19 and Appendix Tables
44 - 47. The concentration ranges of P. K, S, Mn, and CP in red clover, subclover, wheat.

63
Table 15. Mean crude protein content (X) of food plot forages collected in combined study
units T1 and T2 a t National Red Dirt Wildlife Management Preserve, Natchitoches Parish,
Louisiana (red clover, subclover, and jointvetch: n - 10; wheat: n « 20); 1986-198B.
CollectionPeriod
Food Plot ForaaesRed Clover Subclover Wheat JointvetchMeanC.P.* ±s.e.
MeanC.P.* ± 5 .8 .
MeanC.P.* ±5.0.
MeanC.P.* ±5.0.
Jul 86 ------ — 17.610.1
Sep 86 — ------ — 16 .210 .8
Nov 86 — ---- — 9.8 1 0.2
Jan 87 15.6 ± 0.9 11.6 ± 0.2 11.0 ± 2.2 —
Apr 87 16.7 ± 0 .5 12.1 ±0.1 9.0 ± 0.4 —
May 87 15.410.1 9.6 ± 2.2 5.2 ± 0.4 —
Jul 87 — — — 1 6 .510 .7
Aug 87 — — — 16 .012 .2
Oct 87 — — — 12.91 0.1
Jan 88 16.3 ± 2 .0 16 .610 .8 — —
Mar 88 15.7 ± 1.6 15.31 1.6 — —
May 88 11.7 ± 0 .9 11.210.1 — —
Nov 88 — — — 11.51 0.3
“ C.P. ■ crude protein.

Table 16. Mean nutrient content (X) of American jointvetch in food plots a t National Red Dirt Wildlife Management Preserve,
Natchitoches Parish. Louisiana (n - 10): 1986 - 1968._________________________________________________________ __CollectionDate
P K Ca _ Mo s Feft s.e. X s.e. X s e . X s.e. X s.e. X s.e.
July 86 0 2 5 0.02 2.42 0.36 1.28 0.16 0.34 0.02 0.28 0.04 0.018 0.001
Sept 86 0.16 0.01 1.48 0.03 1.30 0.08 0.33 0.00 0.27 0.01 0.018 0.002
Nov 86 0.13 0.01 1.09 0.27 1.04 0.04 0 2 8 0.02 0.24 0.06 0.017 0.002
July 87 0.25 0.02 1.96 0.08 1.06 0.08 0 2 8 0.02 0.24 0.02 0.029 0.013
Aug 87 0 2 0 0.01 1.56 0.06 1.20 0.14 0.29 0.02 0.22 0.02 0.014 0.002
Oct 87 0.16 0.02 1.06 0.08 1.06 0.08 0.25 0.00 0.15 0.00 0.015 0.000
Nov 88 0.11 0.01 0.70 0.04 1.00 0.04 0.24 0.01 0.11 0.00 0.006 0.002
Mn Zh Cu CoJuly 86 0.016 0.004 0.0047 0.0007 0.0011 0.0000 0.00004 0.00002
Sept 86 0.016 0.001 0.0058 0.0012 0.0010 0.0001 0.00002 0.00001
Nov 86 0.008 0.001 0.0070 0.0028 0.0019 0.0007 0.00003 0.00002
July 87 0.012 0.001 0.0043 0.0000 0.0020 0.0001 0.00002 0.00002 -
Aug 87 0.020 0.006 0.0046 0.0009 0.0012 0.0001 0.00006 0.00002
Oct 87 0.010 0.001 0.0058 0.0031 0.0010 0.0001 0.00004 0.00002
Nov 88 0.008 0.002 0.0034 0.0010 0.0009 0.0001 0.00008 0.00006

Table 17. Mean nutrient content (X) of red clover In food plots at National Red Dirt Wildlife Management (Reserve, Natchitoches
Parish, Louisiana (n - 10); 1987- 1988.
CollectionDate
P K Ca Ma S FeX s.e. X s.e. X s a . X _ s.e. X s.e. X s.e.
Jan 87 0.19 0.03 1.68 0.11 1.29 0.07 0.22 0.02 0.08 0.08 0.14 0.04
Apr 87 0.14 0.01 1.46 0.22 1.89 0.13 0.26 0.03 0.15 0.02 0.02 0.01
May 87 0 2 2 0.02 1.72 0.06 1.67 0.01 0.34 0.04 0.16 0.01 0.02 0.01
Jan 88 0.33 0.04 2.14 0.42 1.10 0.07 0.20 0.02 0.24 0.01 0.04 0.02
Mar 88 0.29 0.02 2.28 0.70 1.54 0.04 0.22 0.04 0.23 0.01 0.07 0.04
May 88 0.19 0.02 1.64 0.18 1.44 0 2 4 0 2 8 0.02 0.13 0.01 0.04 0.03
Mn Zn Cu Co
Jan 87 0.014 0.003 0.0024 0.0002 0.0006 0.0001 0.00004 0.00001
Apr 87 0.016 0.006 0.0028 0.0001 0.0008 0.0001 0.00002 0.00002
May 87 0.022 0.002 0.0036 0.0000 0.0014 0.0001 0.00001 0.00001
Jan 88 0.010 0.002 0.0033 0.0005 0.0016 0.0004 0.00002 0.00002
Mar 88 0.016 0.006 0.0044 0.0004 0.0008 0.0004 0.00002 0.00001
May 88 0.008 0.004 0.0028 0.0006 0.0012 0.0001 0.00006 0.00004

Table 18. Mean nutrient content (X) of subclover in food plots a t National Red Dirt Wildlife Management Preserve, Natchitoches
Parish, Louisiana (n - 10); 1987 - 1988.
CollectionDate
P K Ma s FeK s.e. IE s.e. X sje. % s.e. s s.e. 5? s.e.
Jan 87 0.13 0.01 1.55 0.02 1.44 0.04 0.19 0.02 0.16 0.00 0.11 0.03
Apr 87 0.08 0.01 1.36 0.02 1.68 0.10 0.24 0.01 0.14 0.00 0.04 0.00
May 87 0.09 0.02 1.32 0.28 1.30 0.02 0.19 0.01 0.13 0.00 0.06 0.01
Jan 88 0 2 7 0.07 1.96 0.36 0.92 0.01 0.22 0.02 0.20 0.01 0.20 0.14
Mar 88 0.30 0.02 2.41 0.11 1.61 0.08 0.24 0.01 0.24 0.06 0.12 0.08
May 88 0.14 0.04 0.83 0.43 1.06 0.14 0.79 0.62 0.10 0.02 0.02 0.01
..... Mn Zn Cu_____ Co
Jan 87 0.010 0.001 0.0028 0.0002 0.0008 0.0004 0.00004 0.00001
Apr 87 0.012 0.001 0.0024 0.0004 0.0006 0.0002 0.00002 0.00001
May 87 0.014 0.002 0.0030 0.0004 0.0011 0.0000 0.00004 0.00002
Jan 88 0.015 0.001 0.0044 0.0004 0.0013 0.0001 0.00022 0.00018
Mar 88 0.022 0.006 0.0050 0.0002 0.0012 0.0001 0.00008 0.00004
May 88 0.020 0.008 0.0034 0.0000 0.0008 0.0002 0.00002 0.00002

Table 19. Mean nutrient content (X) of wheat in food plots at National Red Dirt Wildlife Management Preserve, Natchitoches Parish,
Louisiana (n» 10); 1987.
Collection P K Ca Mu s FeDate 8 se . 8 s.e. 8 S4. 8 s.e. 8 s.e. 8 s.e.
Jan 87 0.34 0.02 2.64 0.20 0.44 0.02 0.12 0.01 0.26 0.01 0.036 0.012
Apr 87 0.21 0.02 2.14 0.08 0.28 0.04 0.12 0.01 0.17 0.01 0.010 0.001
May 87 0.14 0.02 0.96 0.04 0.16 0.01 0.08 0.01 0.10 0.02 0.008 0.002
Mn ____ Zn Cu Co
Jan 87 0.018 0.004 0.0021 0.0002 0.0004 0.0001 0.00002 0.00002
Apr 87 0.016 0.001 0.0024 0.0001 0.0006 0.0002 0.00000 0.00000
May 87 0.012 0.004 0.0024 0.0001 0.0011 0.0001 0.00000 0.00000

68
and jointvatch ware similar. Red clover appeared to have the highest Ca and lowest Fa
concentration among the 4 forages. Subclover had the highest Mg and Co concentrations.
Wheat had the lowest Ca, lowest Mg, and lowest Zn concentrations. Jointvetch had the
highest Zrt and Cu concentrations. Seasonal trends in nutrient concentrations among the
forages varied. In the cool-season forages, P, K, S, and Fe generally decreased in
concentration in red clover, subclover, and wheat and Ca generally increased then decreased
as the growing seasons progressed. Magesium, Mn, Zn, Cu, and Co concentrations remained
relatively stable during the growing seasons. Trends in nutrient concentrations of jointvetch
were approximately equal to those in the cool-season forages. Phosphorus, K, and S
generally decreased in concentration; Ca and Mn generally increased then decreased; and Mg,
Fe, Zn, Cu, and Co concentrations remained relatively stable during the growing seasons.
Nutrient concentrations in the forages were not similar to those reported by other
researchers. Taylor (1973) stated red clover should contain up to 288 CP. DeLany
(1985:27) found that subclover CP ranged from 14.68 - 27.38 and Render (1984:24)
stated Ca and P content in subclover ranged from 0.568 -1 .1 1 8 and 0.188 - 0.258,
respectively. Render (1984:24) found wheat to contain 9.08 -2 2 .7 8 CP, 0.198 -0 .3 8 8
Ca, and 0.188 - 0.368 P. Thro a t el. (1987) stated jointvetch contained up to 20.98 CP
(whole plant) and Schultz (1987:30) reported P levels in jointvetch as high as 0.458. The
fact that nutrient levels of the forages grown in this study were relatively low might be
attributable to the low soil fertility a t Red Dirt.
The majority of the nutrients (1C, Ca, S, Fe. Mn, Zn, Cu, and Co) in subclover, red
clover, wheat, and jointvetch exceeded the dietary requirements for beef cattle put forth by
the National Research Council (1984). Magnesium, CP, end P did not exceed the nutrient
requirements. Magnesium, however, was welt within the recommended dietary limits and CP
was sufficiently high (>138) for all food plot forages during all periods of the growing
seasons to maximize deer body growth and reproduction (Thill e l al. 1967). Phosphorous

69
was deficient in American jointvetch in the tatter part of the growing seasons. In the cool
-season forages, no trends existed in P deficiency; however, P was deficient in numerous
growth periods.
NUTRIENT CONTENT OF DEER FECAL MATTER
Deer fecal crude protein (DFCP) averaged 17.3X on control units and 17.OX on food
plot units from August 1986 to May 1988 (Table 20 and Appendix Table 48). Little variation
in deer fecal crude protein existed between treatment unit types and among study units.
Deer fecal crude protein was not consistently higher or lower in any study unit, which
indicated a rough parity in DFCP among study units. No significant trends in concentrations
of fecal macro- and micronutrfents of deer on CI end C2 versus T1 and T2 were noted during
the study (Teble 21 and Appendix Table 49). Fecal macro- and micronutrfents from deer on a
particular unit were significantly higher or lower in concentration than the fecal nutrients
collected from deer on other study units in various sampling periods. However, these
instances were generally isolated, infrequent, and, therefore, inconsequential.
Deer fecal crude protein was cyclical in all study units — highest concentrations
were obtained in spring (May 1987 and May 1988; mean DFCP value = 20.3) and lowest
concentrations in winter (January 1987 and January 1988; mean DFCP value * 13.7). The
majority of fecal macro- and micronulrients, P, Mg. Ca. Zh, S, Co, and Cu. exhibited
seasonal trends in concentration similar to that of DFCP. Therefore, forage quality a t Red
Dirt varied seasonally; forage quality was relatively low during winter and relatively high
during spring with intermediate values during summer.
Ruminant fecal nutritive quality is associated in varying degrees with diet quality
and animal condition (Holloway e l al. 1981, Holechek e ta l. 1982). Fecal components of crude
protein, dry matter, ether extract, crude fiber, nitrogen-free extract, acid soluble ash, jQ
vitro dry matter digestibility, and zinc can be correlated with dietary intake (Mould and

70
Tibi* 20. M*an crudi protaln content (X) of deer focal samples collected on control and food
plot units at National Red Dirt Wildlife Management Preserve, Natchitoches Parish, Louisiana
(n - 60 samples per area per collection period); 1986 - 1988.
Aua86 Jan 87 Mav 87 Auo87 Jan 88 Mav 88Areas £ P .« ±s.e. C.P.* ±s.e. C.P - ±s.e. C.P * ±s.e. C.P.* ±S.e. C.P.* ±s.e.
ControlUnits
17.3 ± 0.4 14.6 ± 0 .4 20.9 ± 0.4 17.7 ± 0.5 13.5 ± 0.3 19.7 ±0.4
Food Plot Units
16.9 ± 0 .3 13.4 ±0.3 21.0 ± 0 .4 17.3 ± 0 .3 13.4 ± 0 .2 19.7 ± 0 .3
P >T >0.10 i 0.025 >0.40 >0.10 > 0.375 >0.40
••C.P. ■ crude protein

71
Table 21. Mean nutrient content (X) of deer fecal matter collected on combined study units
at National Red Dirt Wildlife Management Preserve, Natchitoches Parish, Louisiana (n ■ 20
composite samples per combined area per collection period); 1966 - 1988.______________
Ml1
PelletCollection
DateControl Units (Cl 8.C2)
Mean ± s.e.Food Plot Unite (T1 &T2)
Mean ± s.e. P>T
P 6608 0.28 0.01 0.33 0.02 0.02
P 8701 0.27 0.02 0.23 0.01 0.02
P 8705 0.48 0.04 0.41 0.02 0.15
P 8708 0.28 0.01 0.32 0.01 0.03
P 8801 0.30 0.02 0.38 0.04 0.10
P 8805 0.38 0.02 0.37 0.02 0.07
K 8608 0.12 0.01 0.26 0.04 <0.01
K 8701 0.27 0.07 0.34 0.06 0.43
K 8705 0.37 0.10 0.19 0.03 0.07
K 8708 0.11 0.01 0.22 0.04 0.02
K 8801 0.20 0.04 0.25 0.04 0.43
K 8805 0.20 0.03 0.24 0.04 0.33
Ca 8608 2.30 0.16 1.69 0.11 <0.01
Ca 8701 1.39 0.11 1.07 0.08 0.02
Ca 8705 2.37 0.24 1.64 0.19 0.08
Ca 8708 2.11 0.17 1.80 0.16 0.19
Ca 8801 1.51 0.16 1.78 0.19 0.29
Ca 8805 2.27 0.16 1.72 0.16 0.02

72
Table 21. Mean nutrient content (X) of deer fecal matter collected on combined study units
a t National Red Dirt Wildlife Management Preserve, Natchitoches Parish, Louisiana (n * 20
composite samples per combined area per collection Period): 1986 - 1988 (continued),____
Nil
PelletCollection
Date
w i j w . i w y e » w w i w v n w
Control Units (Cl & C2) Mean 1 s.e.
Food Plot Units (Tl 8.T21 Mean ± s.e. P>T
Mg 8608 0.32 0.02 0.50 0.04 <0.01
Mg 8701 0.24 0.02 0.21 0.01 0.16
Mg 8705 0.46 0.04 0.49 0.04 0.72
Mg 8708 0.35 0.02 0.43 0.02 0.02
Mg 8801 0.29 0.03 0.26 0.02 0.50
Mg 8805 0.51 0.02 0.45 0.03 0.15
S 8608 0.32 0.01 0.33 0.01 0.44
s 8701 0.26 0.01 0.26 0.01 0.69
s 8705 0.39 0.02 0.36 0.02 0.21
s 8708 0.31 0.02 0.31 0.01 0.98
s 8801 0.29 0.01 0.27 0.01 0.02
s 8805 0.38 0.02 0.35 0.01 0.09
Fe 8608 0.05 0.01 0.04 0.00 0.50
Fe 8701 0.04 0.00 0.03 0.00 0.42
Fe 8705 0.03 0.00 0.07 0.02 0.06
Fe 8708 0.05 0.02 0.02 0.00 0.16
Fe 8801 0.04 0.00 0.05 0.01 0.26
Fe 8805 0.04 0.01 0.06 0.01 0.46

73
Table 21. Mean nutrient content (X) of deer fecal matter collected on combined study units
a t National Red Dirt Wildlife Management Preserve, Natchitoches Parish, Louisiana (n ■ 20
composite samoles oerxembined area per collection period): 1066 - 1988 (continued). Pellet
Collection Control Units (Cl 8, C2) Food Plot Units (T1 &T2)
HI1 Bite__________dsio_______± s e ,________ Mean t s.e._____________ P>I
Mn 8608 0.16 0.02 0.13 0.01 0.18
Mn 8701 0.18 0.01 0.21 0.01 0.10
Mn 8705 0.15 0.01 0.15 0.01 1.00
Mn 8708 0.16 0.02 0.14 0.01 0.30
Mn 8801 0.22 0.01 0.18 0.02 0.08
Mn 8805 0.14 0.01 0.14 0.01 0.57
Zn 8608 0.009 0.001 0.010 0.001 0.46
Zn 8701 0.007 0.001 0.006 0.001 0.51
Zn 8705 0.014 0.003 0.010 0.001 0.22
Zn 8708 0.014 0.004 0.008 0.001 0.15
Zn 8801 O.OOB 0.001 0.006 0.001 0.07
Zn 8805 0.010 0.001 0.010 0.001 1.00
Cu 8608 0.003 0.000 0.004 0.001 0.45
Cu 8701 0.002 0.000 0.002 0.000 0.95
Cu 8705 0.003 0.001 0.003 0.001 0.95
Cu 8708 0.003 0.000 0.003 0.000 0.73
Cu 8801 0.002 0.000 0.002 0.000 0.68
Cu 8805 0.003 0.000 0.003 0.000 0.93

74
Table 21. Mean nutrient content (X) of deer fecal matter collected on combined study units
at National Red Dirt Wildlife Management Preserve, Natchitoches Parish, Louisiana (n ■ 20
composite samples per combined area per collection period): 1986 - 1968 (continued), Pellet
Collection Control Units (Cl &.C2) Food Plftt.Unlt; jTI M 2)
Ml! Date _ Mean ± s.e. . Mean ± s.e . P>T
Co 8608 0.0008 0.0005 0.0003 0.0002 0.34
Co 8701 0.0001 0.0001 0.0004 0.0003 0.24
Co 8705 0.0011 0.0000 0.0012 0.0001 0.85
Co 8708 0.0004 0.0001 0.0003 0.0001 0.25
Co 8801 0.0001 0.0000 0.0001 0.0000 0.35
Co 8805 0.0010 0.0004 0.0022 0.0007 0.14
tNt - Nutrient.

75
Robbins 1981, Holloway a t at. 1981). However, faw. if any, studios have baan conductad to
corralats othar macro- and micronutriants in tha diat and facas of doer or other ruminants.
Undoubtedly, tha dietary - fecal nutrient relationship is dependant on tha physiological
condition of dear. Functions such as dear growth and lactation diminish tha correlation of
macro- and micronutriants between tha dial and facas (Dr. Tim Brown, Research Scientist,
Southeastern Louisiana Research Station, personal communication, 1990). Any such factors
which negated the accuracy of the correlation of dietary and fecal macro- and micronutrfents
were assumed to be equal among the study units.
I expected dear fecal nutrienl concentrations to be greater from deer on food plot
areas than on control areas because of the hypothetical increase in dietary qualiLy provided
by food plot forages (Johnson a t al. 1987, Keegan et al. 1989). This was not tha case. Dear
fecel nutrient concentrations generally were similar in food plot and control units (Tables 20
and 21, Appendix Tables 48 and 49). Food plot forages failed to raise the nutritional plane of
deer. The multlple-resource management of the Forest Service encouraged understory
vegetation growth that provided a highly nutritious diet for deer on all study areas. Deer
were ingesting food matter of similar nutritional quality on food plot areas and control areas
despite the fact that deer on units T1 and T2 were supplemented with food plot forages. As
indicated in the Flora section, species such as blackberry, smilax, Japanese honeysuckle,
dogwood, American beautyberry, grape, sweetleaf, redbay, red maple, blackgum,
huckleberry, wax myrtle, yaupon, persimmon, and yellow jessamine were available for
deer consumption. In their study on the Kisatchie National Forest, Pearson et a). (1982)
noted that many of these species as well as others, have high concentrations of nutrients
during various parts of the year. With low deer density a t Red Dirt and ample high-quality
forage and browse available during this study, individual animals on control units were able
to select a diat similar in nutritional quality to that of deer on food plot units. Deer are
inclined to consume the most nutritious end palateble forages available (Swift 1948. Cook et

76
•I. 1953, Blssell 1959, Hesselton and Hesselton 1982), be they food plot forages or native
vegetation.
DEER HARVEST — GENERAL COMMENTS
Compared to gun-hunting, bow-hunting is not popular with sportsmen a t Red Dirt.
Typically, bow-hunters' success is low, relatively few deer are harvested, and there is
insignificant impact on the deer population (Denney 1978:397). Mr. Kenneth Penrod (Forest
Technician, Forest Service, Kisatchfe Ranger District, 1988) estimated the yearly harvest
during this study at i 10 dear.
Sample sizes of deer harvested on each unit were small. The average sample size of
males harvested on each study unit from 1986 - 1988 was approximately 2 (0.5-years-
old), 10 ( 1.5-yrs-old), 5 (2.5-yrs-oid). and 2 (i3.5-yrs-old) (average total per
unit - 19]. Average sample size for corresponding age-classes of females harvested on each
unit during this period was approximately 2, 2, I, and 3 [average total per un it“ 8]. Small
sample sizes make detection of significant differences in variables difficult. For statistical
significance to materialize in small samples, large and often unreasonable differences must
occur. I doubt if dense deer populations exist on any NaLional Forest that does not have an
intensive law enforcement program. The small sample sizes of deer in this study merely
mirror reality in many National Forests and therefore are valid.
The number of deer harvested on Red Dirt from 1986 - 1988 was restricted by
bucks only hunting during the the first half of each season. The number of deer that hunters
brought to the check staLion each year was 167 (1986), 152 (1987), and 156 (1988). This
equates to a harvest of I deer per 92.3 ha (1986), 101.2 ha(19B7), and 98.7 ha (1988) for
each of the 3 years, in 1989, 235 deer ( I per 66.0 ha) were killed with season-long, either
sex hunting. This number Is similar to the numbers of deer harvested on Red Dirt in the mid-
1960's (Table 5). Even though the harvest from 1966 - 1988 was less than in 1989, the

77
annual kill increased from that of tha mid io lata 1970's and aarly 1980‘s (ranga ■ 14 to 99
daar brought to the check station each year during these years).
Based on the estimated deer population of 356 ± 72 deer in 1986 and 1986 and
427 ± 162 deer in 1987, the percentage of the herd killed each year was 47X (1986), 36X
(1987), and44X (1988). These harvest percentages may appear excessive; however. Van
Etten e t al. (1965) found during 2 consecutive autumns that deer population density could be
maintained with harvest rales as high as 431! on range in excellent condition and with high
deer productivity. With the on-going intensive multiple-resource management of the Forest
Service, Red Dirt appears to meet the former criterion. Based on my observations, ample
cover, water, and browse are available. The latter criterion, high productivity, is
questionable and will be discussed later. Even though it is possible to have hervesl rales as
high as those achieved in this study and still maintain a roughly stable population density for
a short term (assuming that the total population estimate was accurate), continued high rales
of harvesting such as that in 1989 might precipitate a decline in hard size.
An average of 14 (0.5-years-old), 59 (1.5-yrs-old), 22 (2.5-yrs-old), and
7 (23.5-yrs-old) males were killed each year (1986 - 1988) on the entire Preserve. The
average number of harvested male fawns was relatively small because they were hunted
only during the either sex portion of the season. The number of older males (*3.5-years-old)
in the kilt was relatively small because hunting pressure end natural mortality make
individuals in this age-class uncommon. In 1989 (with an entire season of either sex
hunting), the number and age of males harvested on the entire Preserve were 47 (0.5-years
-old), 41 (1.5-yrs-old), 21 (2.5-yrs-old), and 10 (i3.5-yrs-old). The numbers of
harvested 2 .5 - and l3.5-yeer-old males were approximately equal to the average of the
previous 3 years. The number of 1.5-year-old males declined considerably, however. Male
fawns killed in 1989 greatly increased from the previous 3-year average. If the numbers of
harvested males in all age-classes in 1989 were representative of the population structure

78
or males, this would Indicate that the Red Dirt buck population Is relatively young (the birth
rete is exceeding the death rate) end increasing (Ceughley 1977:120-123, Robinson and
Bolen (98951-52).
The age structure of females in the harvest from 1986 - 1988 did not correlate well
with the age structure of males in the kill. The average number and age of females killed
each year (1986 - 1988) on the entire Preserve were 13 (0.5-years-old). 11 (1.5-yrs
-old), 8 (2.5-yrs-old), and 16 (i3.5-yrs-old). In 1989, 39 (0.5-years-old), 18 (1 .5-yrs-
old), 26 (2.5-yrs-old), and 33 (*3.5-yrs-o1d) females were harvested — roughly similar in
ratio to the 1986 - 1988 average. The oldest does represented the largest female age-class
in the kill from 1986 - 1988 (339B of the harvested females during this period) and the
second largest in 1989 (28 Ji of the harvested females): I believed that the oldest females
would be the most experienced and the most wary toward hunters, but this was noL the case.
Maguire and Severinghaus (1954), however, noted that differential vulnerability among age-
classes of females could not be demonstrated during an open season in New York, if the
numbers of harvested females in these age-classes are representative of the population
structure of does, then the female population is stable at best and maybe on the verge of a
downward trend (Caughley 1977:120-123, Robinson and Bolen 1989:51-52).
An average of 18 males and 8 females were killed on each study unit per year during
1986 - 1988. The discrepancy in the kill of males versus females probably resulted from
the design of the hunting season. The first part of each hunting season allowed bucks only and
the latter part allowed either sex hunting. Bucks were hunted throughout the season
contributing in large part to the greater percentage of males in the kill. In 1989, however,
approximately equal ratios of males:females (119:116) were harvested during the season
-long, either sex hunting season. This demonstrates an equal vulnerability of the sexes to
hunting pressure.

79
SELECTED GROWTH PARAMETERS
Body Weights
Body weights of males in ail age-classes did nol significantly differ between
treatment unit types and among units (Table 22 and Appendix Table 50). Consequently, body
weights of male deer from the 4 study units were pooled for descriptive purposes: average
male body weights ranged from 23.3 - 30.5 kg (0.5-years-old), 42.7 -5 1 .3 k g (1 .5 -y rs
-old), 55.3 -7 1 .4 k g (2.5-yrs-old), and 59.8 - 79.4 kg (i3.5-yrs-old). Similarly, average
body weights of females in al) age-classes generally were not significantly different during
the study (Table 22 and Appendix Table 50). Because variation did exist, body weights of
the different age-classes of females were not pooled for descriptive purposes. The weights
of females and males in the various age-classes fluctuated from one year to tha nexL. The
largest annual variation occurred in the 1.5-year-old female age-class on C2 (Appendix
Table 50): in 1986, a 1.5-year-old female weighing 37.6 kg was harvested; in 1987, the
average body weight was 47.5 i 1.3 kg, which was considerably heavier than the average
body weights of 1.5-year-old females on the other units. In 1988, average body weights of
1.5-year-old females on C2 dropped to 32.4 ± 0.2 kg. which was significantly lighter than
the average body weights of this age-class on Cl, T l, and T2. In 1989, the average weight
rose again to 35.8 ± 0.7 kg. As in the case of 1,5-year-old females, body weights for all
other deer generally Increased the second year, and decreased the third and fourth years.
The drought during the third year probably contributed to the decrease in body weights by
reducing the amount and digestibility of forage available. During the course of the study, I
expected the body weights of deer on Tl and T2 to increase from year-to-year because of
the effects of the superior nutrition provided by food plot forages. Evidently, deer nutriLion
in all areas was relatively good because native browse and forage was available in ample
quantities. The food plots produced no additive effects on the variables I measured that were
above and beyond the effects produced by the multiple-resource management of the Forest

80
Table 22. Mean body weights (kg) of male and female white-tailed deer harvested on control
and food plot units a t National Red Dirt Wildlife Management Preserve, Natchitoches Parish,
Louisiana; 1986 - 1989.
Age Control Units (Cl &C2) Food Plot Units (Tl & T2)Ywr Category OsflD * S.e. n Mean ±s.e. n_________ e> LM ales;
1986 0.5 30.1 1.0 4 27.4 1.7 8 0.31
1.5 47.8 1.2 18 47.6 1.2 26 0.91
2.5 58.0 2.8 8 59.2 2.3 13 0.76
*3.5 61.4 — 1 72.3 7.9 3 0.56
1987 0.5 29.4 1.5 3 28.2 — 1 0.72
1.5 49.1 1.5 20 51.4 1.0 14 0.27
2.5 60.5 3.1 11 67.7 1.9 6 0.13
23.5 77.3 2.8 4 66.4 5.0 2 0.11
1988 0.5 25.5 2.4 5 25.8 2.3 5 0.94
1.5 47.0 1.0 20 48.4 1.2 22 0.39
2.5 65.6 3.4 11 62.3 3.8 7 0.54
23.5 75.8 3.6 6 63.4 6.0 4 0.10
1989 0.5 24.4 0.8 18 24.1 1.0 16 0.85
1.5 43.7 0.6 17 42.8 1.0 11 0.40
2.5 58.8 2.2 6 57.4 2.9 6 0.72
23.5 62.8 4.6 7 ---- 0 __

81
Table 22. Mean body weights (kg) of male and Female white-tailed deer harvested on control
and food plot units a t National Red Dirt Wildlife Management Preserve, Natchitoches Parish.
Louisiana; 1986 - 1989 (continued).
Age Control Units (Cl &C2) Food Plot Units (Tl 8, T2)Year Category Dean___t 3,ft,_____ D_______ Mean ts .e . n_________ E>I_Famalas:
1986 0.5 27.3 1.1 4 26.5 0.8 3 0.62
1.5 39.5 1.2 3 41.8 1.4 5 0.31
2.5 45.2 0.8 3 49.7 2.4 4 0.19
>3.5 42.3 2.5 4 49.3 3.0 2 0.16
1987 0.5 23.9 1.6 8 29.1 — 1 0.32
1.5 43.4 1.6 9 39.8 2.1 4 0.22
2.5 46.5 2.3 6 51.8 — 1 0.41
>3.5 48.9 4.4 3 51.6 1.4 7 0.46
1988 o.s 23.8 1.1 6 27.3 0.0 2 0.13
1.5 37.5 2.9 4 40.9 — 1 0.64
2.5 46.3 _ 1 — — 0 —
>3.5 43.9 2.0 8 43.7 1.5 9 0.94
1989 0.5 22.1 0.7 17 21.7 1.4 10 0.79
1.5 35.8 0.7 7 38.6 2.3 2 0.13
2.5 42.2 1.4 9 41.2 1.2 12 0.57
>3.5 40.9 1.4 16 43.0 0.9 9 0.29

Service.
In comparison with other studies, Red Dirt deer weighed considerably less than deer
that were supplementally-fed in a northern Michigan study (Ozoga and Verme 1982).
Average yearling male weights in their study ranged from 612 - 63.9 kg compared to the
42.7 - 51.3 kg weight range of yearling males on food plot and control areas a l Red Dirt. I
attribute the weight discrepancy between the Red Dirt and northern Michigan deer to the fact
that animals in northern latitudes are different subspecies and tend to be larger than those in
southern latitudes (Smith 1980:374). On an 8,907 ha bottomland hardwood trac t in Pointe
Coupe Parish, Louisiana, John (1971) found the average body weight of 1.5-yeer-old males
was 55.3 *4.6 kg, slightly greater than the average weight of yearling males in this study.
Browse and forage availability in bottomlands is generally greater than In uplands because of
the greater availability of water and more fertile soil and this might account for the weight
difference between the deer herds. Red Dirt deer body weights were similar to those of deer
utilizing food plot forages in Johnson ela l.'s (1987) southeastern Louisiana study, however.
In 3 years of their study, average 1.5-year-old male weights ranged from 46.6 - 53.6 kg.
Deer on control units were as heavy as deer on food plots units in this study and
approximately equal to those in Johnson et al.'s study, despite the low soil ferlility at the
Preserve. Because of the low deer density, deer on all study areas were able to select
relatively nutritious forages without much intraspecific competition. Based on my
observations, ample, relatively high-quality deer foods were available in all study units and
this contributed to the parity of body weights.
Body Size
Humerus length was highly correlated (P < 0.01) with body weights in males and
females and corroborated previous reports (Roseberry and Klimslra 1975, Parker 1987)
that leg length is a good index of body weight. The average humerus length of mates in the

83
various age-classes between the treatment unit types and among the 4 study units during the
study was not significantly different during any year (Table 23 and Appendix Table 51). This
parallels my findings that body weights or males were statistically similar among the units.
No significant difference existed among females in humerus length among the 4 units during
any year. Deer eating more nutritious forage, greater quantities of Ca specifically, should
be able to achieve greater skeletal growth than deer eating less nutritious forage. The
nutritional quality of forage consumed by deer among the study units was similar; therefore,
skeletal growth and body size were approximately equal.
Antler Development
The average number of antler points was not significantly different among deer on
the 4 study units during any year (Table 24 and Appendix Table 52). Similarly, antler
scores (i.e., antler size) of males from food plot areas were not significantly different from
antler scores of males from control areas (Table 25 and Appendix Table 53). Antler
development, in general, is dependent upon genetics, age, and nutrition (Hesselton and
Hesselton 1982). Of these 3 factors, genetics was not an issue in this study. The deer on
Red Dirt were assumed to be the same genetic strain. If genetic differences were
significant, sizeable differences in body weights within sex and age-classes would have been
evident; standard erro rs of body weights listed in Tables 8, 22, 37, and 50 did not appear
overly large. Age was a dependent, uncontrollable variable. Nutrition, however, was a key
factor. Nutritional parity among the study units probably explains the parity in antler
development.
DEER PRODUCTIVITY
The number of corpora lutea in the ovaries of females between treatment unit types
and among units from 1986 - 1988 was nol significantly different (Table 26 and Appendix

84
Table 23. Mean humerus length (cm) of male and female white-tailed deer harvested on
control and food plot units a t National Red Dirt Wildlife Management Preserve, Natchitoches
Parish, Louisiana; 1986 - 1969.
Age Control Units (Cl &C2) Food Plot UnltslTl M 2 )Year Category Mean ± s.e. n_______ Mean ±s.e. n P>T
Males:
1986 0.5 22.2 0.2 4 21.4 0.3 8 0.11
1.5 25.8 0.3 18 25.3 0.3 26 0.57
2.5 27.2 0.2 8 27.1 0.3 13 0.66
23.5 28.0 — 1 27.3 1.2 3 0.81
1987 0.5 22.7 0.9 3 24.0 — 1 0.53
1.5 26.4 0.3 20 26.5 0.3 14 0.84
2.5 27.5 0.6 11 27.5 0.4 6 0.96
23.5 29.2 0.6 4 29.0 0.0 2 0.80
1986 0.5 22.6 0.7 5 21.6 0.4 5 0.27
1.5 26.5 0.3 20 26.9 0.3 22 0.33
2.5 28.5 0.5 11 29.4 0.4 7 0.19
23.5 29.3 0.2 6 29.2 0.6 4 0.89
1989 0.5 22.4 0.3 IB 22.3 0.4 16 0.83
1.5 26.2 0.4 17 26.9 0.8 11 0.35
2.5 26.8 0.5 6 28.5 0.6 6 0.66
23.5 27.9 0.8 7 — - - - 0 —

85
Table 23. Mean humerus length (cm) of male and female white-tailed deer harvested on
control and food plot units a t National Red Dirt Wildlife Management Preserve, Natchitoches
Parish, Louisiana; 1986- 1989 (continued).
AgeYear Category
Control Units (Cl &C2) Mean ± s,e. Q_
Food Plot Units (Tl &T2) Mean ±s.e. n P>T
F em ales:
1986 0.5 21.2 0.2 4 21.7 0.3 3 0.35
1.5 23.3 0.3 3 24.0 0.6 5 0.48
2.5 24.7 0.3 3 24.5 0.6 4 0.85
23.5 24.2 0.2 4 24.0 1.0 2 0.75
1987 0.5 20.6 0.5 8 22.0 — 1 0.35
1.5 25.3 0.6 9 24.8 0.5 4 0.57
2.5 25.2 0.3 6 27.0 — 1 0.07
23.5 26.0 1.2 3 26.1 0.3 7 0.87
1986 0.5 21.2 0.4 6 22.0 0.0 2 0.30
1.5 25.2 0.5 4 27.0 — 1 0.20
2.5 26.0 — 1 — — 0 —
23.5 25.5 0.4 6 25.3 0.3 9 0.76
1989 0.5 21.0 0.3 17 21.2 0.5 10 0.72
1.5 24.6 0.3 7 24.5 0.5 2 0.91
2.5 25.0 0.7 9 25.3 0.4 12 0.68
23.5 25.0 0.3 16 25.5 0.4 9 0.53

86
Table 24. Mean number or antler points of male white-tailed deer harvested on control and
food plot units at National Red Dirt Wildlife Management Preserve. Natchitoches Parish,
Louisiana; 1986 - 1989.
YearAge
CateaorvControl Units (C1 & C2) Mean ± s.e. n
Food Plot Units tT 1 S.T21 Mean ±s.e. n P>JL
1986 0.5 — — 4 — — 8
1.5 4.1 0.5 18 3.7 0.3 26 0.53
2.5 6.4 0.6 8 6.5 0.5 13 0.91
*3.5 6.0 — 1 8.7 0.8 3 0.53
1987 0.5 — — 3 — — 1 —
1.5 3.6 0.4 20 3.4 0.4 14 0.72
2.5 7.0 0.6 11 7.2 0.5 6 0.86
23.5 7.2 0.9 4 8.5 0.5 2 0.40
1988 0.5 — — 5 — — 5 —
1.5 3.2 0.3 20 4.0 0.4 22 0.13
2.5 7.3 0.6 11 6.7 0.4 7 0.52
23.5 7.8 0.4 6 7.2 0.5 4 0,38
1989 0.5 — — 18 — — 16 —
1.5 3.9 0.3 17 3.2 0.4 11 0.20
2.5 6.7 0.4 6 6.5 0.3 6 0.76
23.5 7.0 1.0 7 _ _ 0 _____

87
Table 25. Mean antler scores of mate white-tailed deer harvested on control and food plot
units at National Red Dirt Wildlife Management Preserve, Natchitoches Parish, Louisiana;
1986 - 1989.
Age Control Units (Cl & C2) Food Plot Units (T1 &T2)YfiSC W w r y Mean ± s.e. q________ Mean *s.e._____n P>T
1966 0.5 — — 4 — — 8 _ _ _
1.5 86.6 0.5 18 84.1 4.2 26 0.77
2.5 162.0 22.7 8 169.7 15.3 13 0.77
23.5 199.0 — 1 241.0 53.2 3 0.73
1987 0.5 — — 3 — — 1 —
1.5 79.2 b 2 20 79.7 5.4 14 0.96
2.5 177.0 12 .4 11 187.3 16.8 6 0.63
23.5 247.8 31.1 A 222.0 4.0 2 0.61
1988 0.5 — — 5 — — 5 —
1.5 72.0 5.3 20 85.6 6.6 22 0.12
2.5 208.6 19.1 11 177.7 16.0 7 0.27
23.5 239.3 8.5 6 212.2 35.8 4 0.40
1989 0.5 — — 18 — — 16 —
1.5 66.5 5.3 17 76.7 8.6 11 0.32
2.5 190.2 9.5 6 183.2 7.8 6 0.58
23.5 205.6 27.3 7 — — 0 —

88
Table 26. Mean number of corpora lutaa in ovaries of female white-tailed deer harvested on
control and food plot units a t National Red Dirt Wildlife Management Preserve, Natchitoches
Parish, Louisiana; 1906 - 1900.
Age Control Units (C1 &C2) Food Plot Units (T1 &T2)Year Cateaorv Mean ± s.e . n Mean ±s.e. n P>T
1986 0.5 0.0 0.0 4 0.0 0.0 3
1.5 1.0 0.6 3 1.0 0.4 5 1.00
2.5 2.3 0.3 3 1.8 0.2 4 0.21
23.5 1.8 0.2 4 2.0 0.0 2 0.54
1987 0.5 0.0 0.0 8 0.0 — 1 —
1.5 1.2 0.3 9 1.0 0.4 4 0.70
2.5 1.0 0.4 6 0.0 — 1 0.44
23.5 2.0 0.0 3 1.7 0.3 7 0.54
1988 0.5 0.2 0.0 6 0.0 0.0 2 0.60
1.5 1.5 0.5 4 2.0 — 1 0.68
2.5 2.0 — 1 — — 0 —
23.5 1.6 0.3 8 1.8 0.1 9 0.61

89
Table 54). Fawn:doe ratios were not significantly different (Table 27 and Appendix Table
55). Furthermore, no significant differences in frequency of fertilization (percentage of
adult females in a herd that became pregnant in any one breeding season), reproductive
efficiency (percentage of eggs ovulated that became embryos), reproductive rate (average
number of fetuses per pregnant female), or ovulation rate (average number of eggs ovulated
by a female during the estrous period she became pregnant) of females occurred between
treatment unit types and among the study units (Table 28 and Appendix Table 56). Lengths
and weights of embryos collected from females to test differences between treatment uniL
types and among units are presented in Table 29 and Appendix Table 57.
Reproduction studies a t Red Dirt were hampered by the small number of females in
the harvest. Meaningful comparisons were difficult to make with the low numbers achieved
in this sludy: an average of 8 females per year were harvested on each study unit. Even
fewer of these harvested deer were observed as pregnant — an average of 0.75 females
were pregnant on each unit in I9B6, 0.25 in 1987, and 0.50 in 1988. Roberson (1967)
determined that the peak breeding period for deer on Red Dirt is during the firs t 2 weeks of
November — the beginning of the gun-hunting deer season. The either sex season began soon
after this reproductive peak (in 1989, either sex season began on 28 October);
consequently, this study paints a rather incomplete picture of deer productivity at Red Dirt.
If reproductive tracts could have been obtained later in the year, March for example, a more
realistic understanding of the productivity of the Red Dirt Deer herd might have been realized
because mating has subsided and fetuses are well developed by this time. Nevertheless, the
best estimate of Red Dirt deer productivity can be derived from the 1989 fawn:doe ratio
(the year when the greatest number of females were harvested). In 1989, 1.33 fawns :doe
were recorded on the study areas. Noble (1974:38) found 0.94 fawns per doe in the longleaf
pine belt of Mississippi, an area he described as having sandy, infertile soils (similar to Red
Dirt). He found 1.29 fawns per doe in the Mississippi River bottomlands of Mississippi, an

90
Table 27. Fawns/adult doe (2 2.5-years-old) harvested on control and Food plot units at
National Red Dirt Wildlife Management Preserve. Natchitoches Parish. Louisiana;
1966 - 1969.
VeerControl Units
(Cl 8c C2)Food Plot Units
(T1.fc.T2)..... _Chi-square
___ Test Probability _
1986:
Fawns/Doe 1.14 1.83 0.50 < P i 0.70
Number of Fawns 8 11
Number of Does 7 6
1987:
Fawns/Doe 1.22 0.25 0.30 < P i 0.50
Number of Fawns 11 2
Number of Does 9 8
1988:
Fawns/Doe 1.22 0.78 0.70 < P i 0.80
Number of Fawns 11 7
Number of Does 9 9
1989:
Fawns/Doe 1.40 1.23 0.90 < P i 0.95
Number of Fawns 35 26
Number of Does 25 21

91
Table 28. Comparison of various reproduction parameters of white-tailed deer harvested
on control and food plot units a t National Red Dirt Wildlife Management Preserve,
Natchitoches Parish. Louisiana; 1986 - 1988.
Reproduction Parameter and Year
Control Units CC1 & C2)
Food Plot Units CT1 & T2)
Chi-square Test Results
1986 Frequency of Fertilization 29* 17* 0.80 < P i 0.90
No. of Pregnant Adult Females 2 1
No. or Adult Females 7 6
1967 Frequency of Fertilization 0* 12* 0.70 < P i 0.80
No. of Pregnant Adult Females 0 1
No. of Adult Females 9 8
1988 Frequency of Fertilization 22* OX O.SO < P I 0.70
No. of Pregnant Adult Females 2 0
No. of Adult Females 9 9
1966 Reproductive Rate 2 2 P > 0.95
Total No. of Embryos 4 2
No. of Pregnant Adult Females 2 1
1987 Reproductive Rate 0 1 0.30 < P i 0.50
Total No. of Embryos 0 1
No. of Pregnant Adult Females 0 1
1986 Reproductive Rate 1 0 0.30 < P i 0.50
Total No. of Embryos 2 0
No. of Pregnant Adult Females 2 0

92
Table 28. Comparison of various reproduction parameters of white-tailed deer harvested
on control and food plot units a t National Red Dirt Wildlife Management Preserve,
Natchitoches Parish, Louisiana; 1966 - 1986 (continued).
Reproduction Parameter and Year
Control Units (C1&C2)
Food Plot Units CT1 & T2)
Chi-square Test Results
1966 Ovulation Rate 2 2 P > 0.95
Total No. C.L.1 in Pregnant Does 4 2
No. of Pregnant Adult Females 2 1
1987 Ovulation Rate — 2 —
Total No. C.L.1 in Pregnant Does — 2
No. of PregnanL Adult Females 0 1
1988 Ovulation Rate 2 — —
Total No. C.L.1 in Pregnant Does 4 —
No. of Pregnant Adult Females 2 0
1986 Reproductive Efficiency 100X 100X P > 0.95
Total No. of Embryos 4 2
Total No. C.L.1 Pregnant Does 4 2
1967 Reproductive Efficiency OX 50X 0.30 < P i 0.50
Total No. of Embryos 0 1
Total No. C.L. 1 in Pregnant Does — 2
1988 Reproductive Efficiency 50X OX 0.30 < P i 0.50
Total No. of Embryos 2 0
Total No. C.L.1 in Pregnant Does 4 —
1C1. - corpora lutea.

93
Table 29. Mean length and weight of embryos collected from female white-tailed deer
harvested on control and food plot units at National Red Dirt Wildlife Management
Preserve, Natchitoches Parish, Louisiana; 1986 - 1988.
Mean Mean MeanNo. of Mean Length of Wt. of
Pregnant No. of Embryos EmbryosYear Area Females Embryos_______ (mm)___________ (a)
1986: Control 1.0 2 10 0.20Units (Cl & C2)
Food Plot 0.5 2 1 0.00Units (T1 &T2)
1987: Control 0.0 0Units (Cl &.C2)
Food Plot 0.5 1 18 3.70Units (TI &T2)
1988: Control 1.0 1 3 0.10Units (Cl & C2)
Food Plot 0.0Units (T1 M 2 )
0

94
r u with highly fertile, alluvial soil. The Red Dirt deer herd apparently is more productive
then deer in the Mississippi longleaf pine belt and as productive as dear In the fertile
Mississippi bottomlands. The relatively high level of productivity a t Rad Dirt might be
attributable to the high quality forage and browse available and the relatively large number
of older females.
If sufficient numbers of pregnant deer had been available for examination from
1986 - 1988, the data might have approximated that presented by Noble (1974:35-37) in
his study of deer reproduction in Mississippi: frequency of fertilization of 92X - 93JS (the
norm for much of the United States): ovulation rata of 1.46 - 1.94; and 87. IX - 89.4*
reproductive efficiency. Prime-aged females with adequate nutrition will have ovulation
rales and reproductive efficiencies in the upper range of those presented.
DEER HARVESTING
The average number of hours required to kill e deer (deer kill-time) generally was
not significantly different between treatment unit types end among study units for any year
(Table 30 and Appendix Table 58). I had eoriori expectations of deer kill-times on food plot
areas being less than those on control areas. Hunters should have had en easier time killing
deer on these areas because of the tendency of deer to congregate at places of high-quality,
easily obtainable food (Byford 1969). Noble (1974:36) staled that many of the deer he killed
in spring were ambushed a t food plots. But such was not the case a t Red Dirt. Two possible
reasons come to mind: 1) if deer did congregate about food plots during hunting season, they
became especially secretive in their habits (feeding a t night and hiding during the day) making
them as equally difficult to kill as the deer on units CI and C2; and 2) deer on food plot areas
did not congregate at food plots during the hunting season and were as widely distributed as
deer on control areas. I accept the latter explanation even though food plot forage
consumption was substantial during this period (Table 13). Daer probably grazed on the plots

95
Table 30. Mean ktll-tlmes of hunters on control and food plot units during deer-hunting
season a t National Red Dirt Wildlife Management Preserve. Natchitoches Parish, Louisiana;
1906 - 1909.
Control Units (Cl &C2) Mean No. Hours
Hunted/Successful Hunter Before
Making a Kill
Food Plot Units CT1 & T2) Mean No. Hours
Hunted/Successful Hunter Before Making a Kill
Date ....... ___fH rs . n •Hrs. ±s.e. n_ _ P > T
1986:
BtaKff Qnte
8 Nov, Sat 2.2 0.4 6 2 2 0.4 20 0.95
9 Nov. Sun 1.5 0.5 2 1.6 0.2 4 0.80
10 Nov, Mon 2.1 0.6 4 2.0 0.0 2 0.95
11 Nov, Tue 2.0 — 1 2.9 0.8 3 0.65
12 Nov. Wed 2.0 — 1 2.0 — 1 —
13 Nov, Thu M — — 0 1.0 — 1 —
14 Nov, Frl 2.5 0.5 2 — — 0 —
15 Nov. Sat 2.1 0.3 5 2.3 0.4 6 0.75
16 Nov, Sun 2.1 1.1 2 — — 0 —
Elther-Sex
28 Nov. Fri 3.2 0.8 9 2.0 0.3 15 0.13
29 Nov. Sat 1.6 0.4 6 1.6 0.3 6 1.00
6 Dec, Sat 3.1 0.3 6 1.8 0.2 5 0.01
7 Dec, Sun 2.5 — 1 2.5 — 1 —
Season Ave: 2.4 0.2 45 2.0 0.2 64 0.17

96
Table 30. Mean kill-times of hunters on control and food plot units during deer-hunting
season a t National Red Dirt Wildlife Management Preserve, Natchitoches Parish, Louisiana;
1966 - 1969 (continued).
Date
..ftn t a l Un its (Cl * C2)Mean No. Hours
Hunted/Successful Hunter Before Making a Kill___
■*Hta____ _0_
Food Plot Units <T1 &T2) Mean No. Hours
Hunled/Successful Hunter Before Making a Kill
*Hrs. i 5 -e j)___ J L l I
1987;
feisks.PnlY7 Nov, Sat 1.7 0.2 8 2.4 0.8 8 0.38
8 Nov, Sun 1.6 0.4 8 1.4 0.5 5 0.75
13 Nov, Fri 3.0 1.7 3 3.3 0.8 3 0.89
14 Nov. Sat 2.7 0.9 4 1.9 0.5 4 0.44
IS Nov, Sun 2.0 0.5 2 — — 0 —
Either-Sex
27 Nov. Fri 2.2 0.2 18 2.1 0.2 6 0.66
28 Nov, Sat 2.6 0.6 13 2.8 0.5 5 0.84
29 Nov, Sun 2.1 0.6 4 3.9 0.1 2 0.14
5 Dec, Sat 1.6 0.1 2 2.8 0.3 3 0.07
6 Dec, Sun 1.8 0.2 2 — _ 0 —
Season Ave: 2.2 0.2 64 2.4 0.2 36 0.44

97
Table 30. Mean klll-tlmas of hunters on control and food plot units during deer-huntlng
season a t National Red Dirt Wildlife Management Preserve, Natchitoches Parish, Louisiana;
1906- 1969 (continued).
Cpntr.oL IJplts tC.l &.Q21 Food PiQt Units (TI. M 2).Mean No. Hours Mean No. Hours
Hunted/Successful Hunted/SuccessfulHunter Before Hunter BeforeMaklno a Kill ___ MffMna 11 Kill___
Qfits____________*Hrs,___ iSJb___ D________ifctei___ _______D_________ p >T
1988:
Bucks Onlv
5 Nov, Sat 2.6 0.3 17 3.1 0.6 11 0.50
6 Nov, Sun 1.4 0.2 5 1.6 0.3 7 0.62
11 Nov. Fri 2.0 — 1 2.0 0.4 8 0.99
12 Nov, Set 1.6 0.4 5 1.2 0.4 3 0.55
13 Nov, Sun 1.9 1.4 2 1.2 0.2 2 0.70
Either-Sex
25 Nov, Fri 2.3 0.3 12 2.0 0.7 10 0.76
26 Nov, Sat 1.0 — 1 1.5 0.0 2 —
27 Nov, Sun 2.4 0.7 5 2.8 0.9 3 0.70
3 Dec, Sat 2.5 0.5 6 2.4 0.4 2 0.87
4 Dec, Sun 2.0 0.1 7 3.1 0.1 2 0.01
Season Ave: 2.0 0.1 61 2.2 0.2 50 0.96

98
Table 30. Mean kill-times of hunters on control and food plot units during deer-hunting
season at National Red Dirt Wildlife Management Preserve, Natchitoches Parish, Louisiana;
1906 - 1989 (continued).
Control Units (Cl &C2) Food Plot Units <T1 &T2)Mean No. Hours Mean No. Hours
Hunted/Successful Hunted/SuccessfulHunter Before Hunter BeforeMaklno a Kill Makina a Kill
P it? •Hrs. dts.e. n P > T
1089:
Youth Hunt
28 Oct. Sat 2.5 1.0 2 2.0 1.0 2 0.76
29 Oct. Sun — — 0 \ 2 0.8 2 —
Either-Sen
18 Nov. Sat 2.7 0.2 44 2.2 0.3 32 0.16
19 Nov, Sun 2.0 0.2 25 1.8 0.3 10 0.76
24 Nov. Fri 2.9 0.4 16 3.4 0.7 9 0.51
25 Nov. Sat 2.2 0.9 8 2.5 0.3 6 0.78
26 Nov, Sun 2.0 1.0 2 1.5 0.5 4 0.62
Black Powder
2 Dec. Sat — — 0 3.0 — 1 —
3 Dec, Sun — _ _ 0 — — 0 —
Season Ave: 2.5 0.1 97 2.3 0.2 66 0.43
” denotes no deer were killed.

99
up to the beginning of the hunting season; afterwards, the persistent trafficking of hunters
through the woods most likely dispersed the deer (Root e t el. 1066).
Success among hunters can be standardized as hunter efforts per harvested deer
(Hayne 1984). This equates to the average number of hunters necessary to kill I deer. If
the average number of hunter efforts per harvested deer decreases in an area relative to
other areas, hunting success in that area increases. Of course, this is contingent upon all
other factors discussed earlier being equal among the areas. At Red Dirt, significant
variation in hunter efforts per harvested deer existed between treatment unit types and
among study units on a daily basis as well as a seasonal basis (Table 31 and Appendix Table
59). On opening day of the 1986 gun-hunting season, hunter efforts per harvested deer
ranged from 8.2 on unit T2 to 37.0 on unit C2. From then on, hunter success in the units
vacillated throughout the 4 hunting seesons. In 1987, the seasonal average of hunter efforts
per harvested deer was significantly lower in C1 and C2 than in Tt and T2. This might be
attributed to an overkill of deer on units T1 and T2, especially the year before. Despite
these significant differences, no trends that lasted throughout the study (even on opening day
of each of the 4 hunting seasons when one might expecL a difference) were observed as to the
number of hunters on one particular area having greater success at killing deer than hunters
on the other units. This suggests thaL food plots do not increase the possibility of harvesting
a deer on a public area where large numbers of people are allowed to hunt simultaneously.
HUNT QUALITY
Crockford (1969) claimed that hunt quality is ’hunting for a maximum period of time
with a minimum of hunter contact and controls and a reasonable opportunity to see deer or
fresh deer sign* Slankey e t al. (1973) stated that the quality of a hunt is defined
individually; some hunters correlate hunt quality with killing a deer, others are satisfied if
they merely see a deer, deer scrapes, etc.. and others are content with campfire

100
Table 31. Hunter efforts / killed deer on control and food plot units at National Red Dirt
Wildlife Management Preserve, Natchitoches Parish, Louisiana; 1986-1989.
HuntingDate
Control Units fCI a,C2>
Food Plot Units (T1 & T2)
Chi-square Test Probability (P)
1986 :
Bucks .Only
8 Nov, Sat 27.8 9.2 P i 0.01
9 Nov, Sun 61.5 35.8 P i 0.01
tO Nov, Non 10.8 22.0 0.05 < P i 0.10
11 Nov, Tue 32.0 20.0 0.05 < P i 0.10
12 Nov, Wed 36.0 32.0 0.50 < P i 0.70
13 Nov, Thu — 28.0 —
14 Nov, Fri 27.0 — —
IS Nov, Sat 12.4 16.0 0.50 < P i 0.70
16 Nov, Sun 31.0 — —
Either Sex
28 Nov, Fri 21.3 13.4 0.10 < P i 0.20
29 Nov, Sat 30.0 23.0 0.30 < P i 0.50
6 Dec, Sat 15.8 12.4 0.50 < P i 0.70
7 Dec, Sun 79.0 37.0 P i 0.01
Season Ave: 25.6 17.4 0.20 < P i 0.30

101
Table 3 1. Hunter efforts / killed deer on control and food plot units a t National Red Dirt
Wildlife Management Preserve, Natchitoches Parish, Louisiana; 1986-1989 (continued).
Hunting Control Units Food Plot Units Chi-squareQatS______________ (C18.C2)_____ <T1 & T2)___________ Test Probability (P)
1987:
Bucka-fiate7 Nov, Sal 19.1 19.6 0.90 < P l 0.95
8 Nov. Sun 14.9 20.4 0.30 < P i 0.50
13 Nov. Fri 20.3 21.7 0.80 < P i 0.90
14 Nov. Set 18.8 22.2 0.50 < P i 0.70
15 Nov, Sun 34.5 — —
A lte r San
27 Nov, Fri 7.0 28.0 P i 0.01
28 Nov, Set 9.8 33.2 P i 0.01
29 Nov, Sun 29.5 58.0 P i 0.01
5 Dec. Sat 23.0 27.0 0.50 < P i 0.70
6 Dec, Sun 18.5 — —
Season Ave: 14.6 29.5 P i 0.05

102
Table 3 1. Hunter efforts / killed deer on control and food plot units a t National Red Dirt
Wildlife Management Preserve, Natchitoches Parish, Louisiana; 1966-1989 (continued).
Hunting Control Units Food Plot Units Chi-squareM s __________________(Cl_8.C2)_________ (Tt &_T2)___________ le s t Probability (P)
198S:
Bucks Oniv
5 Nov, Sat 8.2 12.3 0 .3 0 < P i0 .5 0
6 Nov. Sun 19.8 17.0 0.50 < P i 0.70
11 Nov. Fri 53.0 10.8 P i 0.01
12 Nov. Sat 18.4 33.7 P i 0.05
13 Nov, Sun 34.5 40.5 0.30 < P i 0.50
Either Stx
25 Nov. Fri 12.2 19.6 0 .1 0 < P i0 .2 0
26 Nov. Sat 120.0 70.5 P i 0.01
27 Nov. Sun 22.0 41.3 P i 0.02
3 Dec. Sat 13.5 52.0 P i 0.01
4 Dec, Sun 10.7 26.5 P i 0.01
Season Ave: 16.1 22.8 0.20 < P i 0.30

103
Table 31. Hunter efforts / killed deer on control and food plot units at National Red Dirt
Wildlife Management Preserve, Natchitoches Perish, Louisiana; 1986-1909 (continued).
HuntingDate
Control Units (Cl 8.C2)
Food Plot Units (T1 & T2)
Chi-square Test Probability (P)
1980:
Youth Hunt
28 Oct, Sat 13.5 11.0 0.50 < P i 0.70
29 Oct, Sun — — —
Either Sex
18 Nov, Sat 4.6 7.1 0.30 < P i 0.50
19 Nov. Sun 8.0 17.9 0.05 < P l 0.10
24 Nov. Fri 11.8 19.9 0.10 < P i 0.20
25 Nov. Sat 23.5 34.8 0.10 < P i 0.20
26 Nov, Sun 68.0 35.2 P *0.01
Black Powder
2 Dec, Sat — 6.0 —
3 Dec, Sun — — —
Season Ave: 13.4 10.9 0.50 < P i 0.70
"Denotes no deer were killed.

104
camaraderie. For the purposes of this study, I assumed that hunt quality improved as the
number of deer kills and number or hunters seeing deer end shooting a t deer increased. I
found no significant trends in these variables between treatment unit types and among study
units (Tables 32 end 33 and Appendix Tables 60 and 61).
I originally contended that greater numbers of deer would be on food plot areas than
control areas because of the ease of securing a nutritious, palatable diet and the increase in
productivity which could result from this supplemented diet. These greater numbers of deer,
in turn, would beneficially affect hunt quality. However, deer numbers were not greater on
food plot areas, reproduction was not enhanced, and consequently, hunt quallLy was not
significantly affected by the presence of food plots.
ECONOMIC ASPECTS OF THE YEAR-ROUND FOOD PLOT PROGRAM
Ozoga and Verme(19B2) spent an estimated $83 annually to supplement the diet of
each deer with bagged feed in their study. Johnson et a). (1987) spent an estimated $29 per
deer initiating their cool-season food plot program. Keegan e t al. (1989) spent
approximately $227/ha (seed, fertilizer, herbicide, and labor) establishing their warm
-season food plot program. Thereafter, annual regeneration costs for Keegan et al. were
about $62/ha. In comparison, the food plot program in this study cost an estimated $87
annually per deer on T1 end T2 for the 3-year study period (Table 34) (deer numbers were
based on the 1988 population density esUmate), much more than that spent by Johnson eL al.
who did not incur high equipment and labor charges. The establishment cost for this cool- and
warm-season food plot program was approximately $566/ha. Establishment costs vary
among regions depending on the amounL of site preparation, fertilizer, and lime necessary to
prepare the food plot. In my study, extensive clearing of the plots was required, hence, the
high establishment cost. Annual regeneration costs of the cool- and warm-season plots in
this study were about $ 134/ha/year, considerably more than that spent by Johnson e t al. or

105
Table 32. Ratio of number of unsuccessful hunters not seeing deer: number of unsuccessful
hunters seeing deer on control and food plot units a t National Red Dirt Wildlife Management
Preserve, Natchitoches Parish, Louisiana; 1986-1909.
Hunting Control Units Food Plot Units Chi-squarePete__________________ fc i 8. C2)__________ <T! &. T2)___________ Test Probability <P)
1986:
Bucks Only
8 Nov. Sat 4.0 3.6 0.80 < P i 0.90
9 Nov, Sun 3.6 5.3 0.50 < P i 0.70
10 Nov, Mon 9.0 20.5 P i 0.05
11 Nov, Tue 4.5 5.8 0.50 < P £ 0.70
12 Nov, Wed 5.5 4.8 0.80 < P £ 0.90
13 Nov. Thu 5.5 3.4 0.30 < P £ 0.50
14 Nov. Fri 2.6 5.0 0.30 < P £ 0.50
IS Nov, Sat 3.2 2.8 0.80 < P £ 0.90
16 Nov, Sun 8.6 7.4 0.70 < P £ 0.80
Either Sex
28 Nov. Fri 7.8 8.5 0.80 < P £ 0.90
29 Nov. Set 8.6 12.1 0.30 * P £ 0.50
6 Dec. Sat 7.3 5.2 0.50 < P £ 0.70
7 Dec, Sun 8.7 12.0 0.30 < P £ 0.50
Season Ave: 6.1 7.4 0.70 < P £ 0.80

106
Tabte 32. Ratio of number of unsuccessful hunters not seeing deer: number of unsuccessful
hunters seeing deer on control and food plot units a t National Red Dirt Wildlife Management
Preserve, Natchitoches Parish, Louisiana; 1986-1989 (continued).
Hunting Control Units Food Plot Units Chi-squareM e___________ (S.Lfr-C2)________ (IL & J2J_______ IS3t.ProHMm.yJEl1987:
P u d ' S . O n l y ,
7 Nov, Sat 3.5 3.6 P > 0.95
8 Nov, Sun 10.1 5.1 0.10 < P 4 0.20
13 Nov, Fri 3.2 3.6 0.80 <P £0.90
14 Nov, Sal 3.6 4.2 0.80 < P £ 0.90
15 Nov, Sun 6.1 6.5 0.90 < P £ 0.95
Either Sex
27 Nov, Fri 5.4 6.5 0.70 < P £ 0.80
28 Nov. Sat 6.8 6.4 0.90 < P £ 0.95
29 Nov, Sun 57.0 38.0 0.05 < P £0.10
5 Dec. Sat 5.5 9.8 0.20 < P £ 0.30
6 Dec, Sun 35.0 47.0 0.10 < P £0.20
Season Ave: 13.6 13.1 0.90 < P £ 0.95

107
Table 32. Ratio of number of unsuccessful hunters not seeing deer: number of unsuccessful
hunters seeing deer on control and food plot units a t National Red Dirt Wildlife Management
Preserve, Natchitoches Parish, Louisiana: 1986-1989 (continued).
Hunting Control Units Food Plot Units Chi-squareQfitfi_________________ (Cl 8. C2)___________ CT1 6.T2)__________ Test Probability (P)
1988:
Bucks Only
5 Nov, Sat 2.9 3.1 0.90 < P 1 0.95
6 Nov, Sun 5.5 4.1 0.50 < P £ 0.70
11 Nov. Fri 5.2 6.0 0.80 < P £ 0.90
12 Nov. Sat 8.7 8.2 0.90 < P £ 0.95
13 Nov, Sun 12.0 10.8 0.80 < P £ 0.90
Eiihsc Sex
25 Nov, Fri 8.4 7.8 0.80 < P £ 0.90
26 Nov, Sat 19.8 27.8 0.20 < P £ 0.30
27 Nov, Sun 13.1 17.3 0.30 < P £ 0.50
3 Dec, Sat 9.4 17.0 0.10 < P i 0.20
4 Dec, Sun 4.0 3.4 0.80 < P £ 0.90
Season Ave: 8.9 10.6 0.70 < P £ 0.80

108
Table 32. Ratio of number of unsuccessful hunters not seeing deer: number of unsuccessful
hunters seeing deer on control and food plot units a t National Red Dirt Wildlife Management
Preserve, Natchitoches Parish, Louisiana; 1986-1989 (continued).
HuntingDate
Control Units (Cl 8.C2)
Food Plot Units (T1 8.T2)
Chi-square Test Probability (P)
1969:
Youth Hunt
28 Oct, Sat 6.2 4.0 0.30 < P £ 0.50
29 Oct, Sun 2.2 2.9 0.70 < P £ 0.80
Either Sex
18 Nov, Sat 5.5 4.8 0.80 < P £ 0.90
19 Nov, Sun 6.0 11.3 0.20 < P £ 0.30
24 Nov, Fri 7.5 6.3 0.70 < P £ 0.80
25 Nov, Sat 12.9 11.9 0.80 <P £ 0.90
26 Nov, Sun 26.8 68.5 P £0.01
Black Powder
2 Dec. Sat M _____ 5.0 —
3 Dec, Sun --------- — —
Season Ave: 7.8 8.0 P > 0.95
"Denotes no deer were seen.

109
Table 33. Ratio of number of unsuccessful hunters not shooting a t deer: number of
unsuccessful hunters shooting at deer on control and food plot units at National Red Dirt
Wildlife Management Preserve, Natchitoches Parish, Louisiana; 1986-1989.
Hunting Control Units Food Plot Units Chi-squareM S _________________(Cl &C2)____________ <T1 &T2)___________ Test Probability (P)
1986:
Bucks Only
8 Nov, Sat 28.2 27.3 0.90 < P i 0.95
9 Nov, Sun 60.0 68.5 0.30 < P £ 0.50
10 Nov, Mon « _____ — —
11 Nov. Tue 36.0 29.0 0.30 < P £ 0.50
12 Nov. Wed 33.0 29.0 0.50 < P £ 0.70
13 Nov. Thu 72.0 62.0 0.30 < P £ 0.50
14 Nov, Fri 13.0 25.0 0.05 <P £0.10
15 Nov, Sat 17.3 19.0 0.70 < P £ 0.80
16 Nov, Sun 30.0 26.0 0.50 < P £ 0.70
Either Sex
28 Nov, Fri 62.7 62.3 P 2 0.95
29 Nov, Sat 42.8 66.5 P £ 0.05
6 Dac, Sat 44.0 28.5 0.05 * P £0.10
7 Dec, Sun 149.0 36.0 P £ 0.01
Season Ave: 49.0 39.9 0.30 < P £ 0.50

110
Table 33. Ratio of number of unsuccessful hunters not shooting a t deer: number of
unsuccessful hunters shooting a t deer on control and food plot units a t National Red Dirt
Wildlife Manegement Preserve, Natchitoches Parish, Louisiana; 1986-1989 (continued).
Hunting Control Units Food Plot Units Chi-squareOats_________________(S 1A ..C 2)___________ (T1 & T2)___________ Twt.ProbiibjlltYtP)
1987:
Sucks Only
7 Nov, Sat 36.2 37.2 0.90 < P * 0.95
8 Nov, Sun 55.5 53.5 0.80 < P £ 0.90
13 Nov, Fri 29.0 31.0 0.70 < P * 0.80
14 Nov. Set 35.5 28.3 0.30 < P s 0.50
15 Nov, Sun 33.5 35.5 0.80 < P * 0.90
Either Sow
27 Nov, Fri 36.0 54.0 0.05 <P< 0.10
28 Nov. Sat 115.0 53.7 P*0.01
29 Nov, Sun 114.0 114.0 P> 0.95
5 Dec. Sat 22.0 26.0 0.50 <P *0.70
6 Dec. Sun 35.0 23.5 0.10 <P *0.20
Season Ave: 51.2 45.7 0.50 < P * 0.70

I l l
Table 33. Ratio of number of unsuccessful hunters not shooting a t deer: number of
unsuccessful hunters shooting a t deer on control and food plot units aL National Red Dirt
Wildlife Management Preserve, Natchitoches Parish. Louisiana: 1986-1989 (continued).
Hunting Control Units Food Plot Units CM-squareBiiS_________________(CI-&C2)____________ (Tl LT 2)___________ l e s tP rgjaifeim pJ.
1988:
Bucks Only
5 Nov, Sat 24.6 41.3 P i 0.05
6 Nov. Sun 47.0 37.3 0.20 < P i 0.30
11 Nov, Fri 26.0 26.0 P> 0.95
12 Nov. Sat 87.0 49.0 P i 0.01
13 Nov. Sun 50.0 61.0 0.20 < P i 0.30
Either Sex
25 Nov. Fri 33.5 23.2 0.10 < P 10.20
26 Nov, Sat 39.7 46.3 0.30 < P i 0.50
27 Nov. Sun 52.5 121.0 PiO.OI
3 Dec. Sat 37.5 34.0 0.50 < P < 0.70
4 Dec, Sun 34.0 51.0 0.05 < P i 0.10
Season Ave: 43.2 49.0 0.50 < P i 0.70

112
Table 33. Ratio of number of unsuccessful hunters not shooting a t deer: number of
unsuccessful hunters shooting a t deer on control and food plot units at National Red Dirt
Wildlife Management Preserve, Natchitoches Parish, Louisiana; 1986-1909 (continued).
HuntingDate
Control Units (Cl 8.C2)
Food Plot Units (T1 8. T2)
Chi-square Test Probability (P)
1989:
Youth Hunt28 Oct, Set 25.0 10.0 P i 0.02
29 Oct, Sun 6.0 20.0 P i 0.01
Either Sex
18 Nov, SaL 19.9 17.7 0.70 < P i0 .8 0
19 Nov, Sun 45.0 28.2 P i 0.05
24 Nov, Fri 28.7 15.5 P i 0.05
25 Nov, Sat 30.0 33.8 0.50 < P i 0.70
26 Nov. Sun 67.0 137.0 P iO.OI
Black Powder
2 Dec, Sat — — —
3 Dec, Sun — — —
Season Ava: 29.0 24.3 0.50 < P i 0.70
* Denotes no shooting at deer.

Table 34. Approximate expenses for the year-round food
plot program at National Red Dirt Wildlife Management
Preserve, Natchitoches Parish, Louisiana from 1 May 1986
to 30 June 1989.
M m ________________________________________ Expense
Establishm ent C osts:
Clearing plots (equipment, fuel. & operator) $2,638
Discing plots (equipment, fuel, & operator) $2,949
Fertilizer, seed, and lime (& application) $5,000
Administrative costs $ 1,500
Labor (400 hrs 9 $5/hr) $2.000$14,087
Regeneration C osts (2 .5 y rs ) :
Mowing plots (equipment, fuel, & operator) $2,504
Fertilizer and seed (& application) $3,035
Administrative costs $1,050
Labor (350 hrs • $5/hr) $ 1.750$6,339
TOTAL $22 ,426

114
Keegan e t a), who did not have similarly high equipment, labor, and administrative expenses.
In general, food plot program costs are highly dependent on the efficiency of the initiating
organization and their budget consciousness. Private growers who are budget conscious
undoubtedly could initiate more cost effective food plot programs.

SUMMARY AND CONCLUSION
Deer diets supplemented with food plol forages were not nutritionally superior to
natlva vegetation diets despite the fact that food plot forages constituted a sizeable portion
of the diet In food plot areas throughout the year. Consequently, food plot forages had no
additive effect on growth or productivity of deer. Deer from food plot end control areas
were killed at approximately equal rates. The number of hunters seeing deer and shooting at
deer on food plot and control areas was approximately equal indicating that hunt quality in the
units was similar. The high cost of the food plot program was not justified in that deer did
not increase in size, antler development, or productivity, and hunting success was
unaffected.
Deer density a t National Red Dirt Wildlife Management Preserve was low. High
-quality browse appeared to be available throughout the area in ample quantities. In my
opinion, deer were able to select and eat what they wanted (availability was still a factor)
libitum. The ample quantities of relatively high-quality native vegetation negated the effect
of the food plot forages. If deer density had been high and native browse and forages were
less available, the effects of year-round food plot forages on the selected growth
parameters, productivity, and harvesting of deer might have been evident.
115

LITERATURE CITED
Ahlgran, C.E. 1960. Some e(Teels or fire on reproduction and growth of vegetation in
northeastern Minnesota. Ecology 41(3):43l-445.
American Ornithologists* Union. 1983. Check-list of North American birds. Sixth ed. Allen
Press, Inc., Lawrence, Kans. 877pp.
Anderson, A.E., D.E. Medln, and D.C. Bowden. 1974. Growth and morphometry of the
carcass, selected bones, organs, and glands of mule deer. Wildl. Monogr. 39. 122pp.
Aycock, S.R., J r . 1968. Population dynamics of the white-tailed deer herd on the Red Dirt
Wildlife Management Area. M.S. Thesis. La. State Univ., Baton Rouge. 71pp.
Bissell, H. 1959. Interpreting chemical analysis of browse. Calif. Fish and Game 45:57-58.
Blair, R.M. 1960. Deer forage increased by thinnings in a Louisiana loblolly pine plantation.
J . Wildl. Manage. 24(4):401-405.
Blair, RJ1„ R. Alcaniz, and HT. Morris. 1984. Yield, nutrient composition, and ruminsnt
digestibility of fleshy fungi in Southern forests. J . Wildl. Manage. 48(4): 1344-1352.
and E.A. Epps. J r . 1969. Seasonal distribution of nutrients in plants of seven
browse species in Louisiana. South. For. Exp. Stn., USDA For. Serv. Res. Pap. SO-51,
35pp.
Blood, D.A., and A.L. Lovaas. 1966. Measurements and weight relationships in Manitoba elk.
J . Wildl. Manage. 30(0:135-140.
Brady. N.C. 1974. The nature and properties of soils. Eighth ed. Macmillan Publishing Co.,
New York. 639pp.
Bryant, F.C., M.M. Kolhmann, and L.B. Merrill. 1980. Nutritive content of sheep, goat, and
white-tailed deer diets on excellent condition rangeland in Texas. J . Range Manage.
33(6):410-4I4.
116

Bula. R J. 1960. Vegetative and floral development in red clover as affected by duration and
intensity of illumination. Agron. J . 52:74-77.
By ford, J l . 1969. Movement responses of white-tailed deer to changing food supplies.
Proc. Southeast. Assoc. Game and Fish Comm. 23:63-78.
Byrd, N.A. 1980. Forestland grazing. USDA For. Serv., Southeast Area State and Priv. For.,
For. Rep. SA-FR10, 45pp.
Caughley, 6. 1977. Analysis of vertebrate populations. John Wiley and Sons, New York.
234pp.
Chatham, T.W. 1959. A study of an overpopulation of deer on the Red Dirt Game
Management Area, Natchitochas Parish, Louisiana. M.S. Thesis. La. State Univ., Baton
Rouge. 74pp.
Cheatum, E l., and C.W.Severinghaus. 1950. Variations in fertility of white-tailed deer
related to range conditions. Trans. N. Am. Wildl. Conf. 15:170-190.
Cook, C.W., L.A. Stoddarl, and l £ . Harris. 1953. Effects of grazing intensity upon the
nutritive value of range forage. J . Range Manage. 6:51-54.
Crawford, B.T. 1950. Some specific relationships between soils and wildlife. J. Wild).
Manage. 14(2): 115-123.
Creed, W.A., F. Haberland, B.E. Kohn, and K.R. McCaffery. 1984. Harvest management: the
Wisconsin experience. Pages 243-260 jaL.K. Halls, ed. White-tailed deer ecology and
management. Stackpole Books, Harrisburg, Pa. 870pp.
Crockford, J.A. 1969. Philosophy of deerherd management. Pages 51-53 jQ, White-tailed
deer in the Southern forest habitat. USDA For. Serv., South. For. Exp. Stn. 130pp.
Davis, L.G. 1983. Production of subterranean clover in Louisisna pine forests. M.S. Thesis.
La. State Univ., Baton Rouge. 40pp.
Deltz, DJ?. 1965. Deer nutrition research in range management. Trans. N. Am. Wild), and
Nat. Resour. Conf. 30:274-285.

118
DeLany, B.W., J r . 1985. Effects of cool-seeson food plots on while-tailed deer. M.S. Thesis.
La. Stale Univ., Baton Rouge. 46pp.
Denney, R.N. 1978. Managing the harvest. Pages 395-408 in J.L. Schmidt and D.L. Gilbert,
eds. Big game of North America. Slackpole Books, Harrisburg, Pa. 494pp.
DeWitt, J.B., and J.V. Derby, J r. 1955. Changes in nutritive value of browse plants
following forest fires. J . Wildl. Manage. (9(1):65-70.
Einarsen, A.S. 1946. Crude protein determination of deer food as an applied management
technique. Trans. N. Am. Wildl. Conf. 11:309-312.
Essig, H.W. 1985. Quality and anliquality components. Pages 309-324 in N.L. Taylor, ed.
Clover science and technology. Agron. Series No. 25. Am. Soc. of Agron., inc.. Crop
Science Soc. of Am., Inc., Soil Science of Am., Inc., Publishers. Madison. Wis. 616pp.
Fenwood, J.D., D.F. Urbston, and R.F. Harlow. 1984. Determining deer habitat capability in
Ouachita National Forest pine stands. Proc. Annu. Conf. Southeast. Assoc. Fish and
Wildl. Agencies 38:13-22.
French. C£.. L.C. McEwen, N.D. Magruder, R.H. Ingram, andR.W. Swift. 1956. Nutrient
requirements for growth and antler development in the white-tailed deer. J . Wildl.
Manage. 20(3):221-232.
Goodrum, PD., and V.H.Reid. 1962. Browsing habits of while-tailed deer in the Western
Gulf Region. Proc. Natl. White-tailed Deer Disease Symp. 1:9-14.
Grelen, H I., and V.L.Duvall. 1966. Common plants of longlBaf pine - bluestem range. Res.
Pap. SO-23, New Orleans, La. USDA For. Serv., South. For. Exp. Stn. 96pp.
Hagedorn, C.. VX.Watson, and WJE. Knight. 1980. Pages 143-145 in R.D. Child andE.K.
Byington, eds. Southern forest range and pasture resources symposium. Winrock.
Morrilton, Ark.
Hall, EA., and K.R. Kelson. 1959. The mammals of North America. The Ronald Press Co.,
New York. 1083pp.

Harwell. F.. RL. Cook, and J.C. Barron.. 1979. The spotlight count method for surveying
white-tailed dear in Texas. Texas Fed. Aid Proj. W-I09-R. FA Rep. Series No. 21.
Tex. Parks and Wildl. Dept. 25pp. Mimeogr.
Hayne, D.W. 1949. An examination of the strip census method for estimating animat
populations. J . Wildl. Manage. 13(2): 145-157.
1964. Population dynamics and analysis. Pages 203-210 iat-K- Halls, ed. White-
tailed deer ecology and management. Stackpole Books, Harrisburg, Pa. 870pp.
Hesselton, W.T., and R.M. Hesselton. 1982. White-tailed deer. Pages 878-901 in J.A.
Chapman and G.A. Feldhammer, eds. Wild mammals of North America. Johns Hopkins
Univ. Press, Baltimore, Md. 1147pp.
and L.W. Jackson. 1974. Reproductive rates of white-tailed deer in New York State.
New York Fish GameJ. 21:135-152.
and P.R. Sauer. 1973. Comparative physical condition of four deer herds in New
York according to several indices. New York Fish Game J . 20:77-107.
Hitchcock, A.S. 1950. Manual of the grasses of the United Stales. Second ed. Revised by A.
Chase. USDA Misc. Publ. No. 200. U.S. Gov. Printing Office, Washington, D.C. 1051pp.
Hitchcock, C l., and A. Conquist. 1973. Flora of the Pacific Northwest. Univ. Wash. Press.,
SeaLtle. 730pp.
Hobbs, N.T., and DJ1. Swift. 1985. Estimates of habitat carrying capacity incorporating
explicit nutritional constraints. J. Wildl. Manage. 49(3):8l4-622.
Holechek, J.L., M. Vavra. and D. Arthun. 1982. Relationships between performance, intake,
diet nutritive quality and fecal nutritive quality of cattle on mountain range. J . Range
Manage. 35(6):741-744.
Holloway, J.W., R.E. Estell II, and W.T. Butts, J r . 1981. Relationship between fecal
components and foraga consumption and digestibility. J . Anim. Sci. 52(4):836-848.

Holsworth. W.N. 1973. Hunting efficiency end white-tailed deer density. J . Wildl. Menage.
37(3):336-342.
Hollar, J £ . , and Hit. Hayes. 1977. Growth in white-tailed deer fawns fed varying energy
and constant protein. J . Wild). Manage. 41(3):506-510.
-.................. . and S.H. Smith. 1979. Protein requirement of yearling white-tailed deer. J.
Wildl. Manage. 43:872-879.
Hubert, G.F., J r .. A. Woolf, and G. Post. 1980. Food habits of a supplementally-fed captive
herd of white-tailed deer. J . Wildl. Manege. 44(3):740-746.
Isaac, R.A., and W.C. Johnson. 1975. Collaborative study of wet and dry ashing techniques
for the elemental analysis of plant tissue by atomic absorption spectrophotometry. J.
Appl. Org. Anal. Chem. 58:436-440.
Jacobson. H.A. 1984. Relationships between deer and soil nutrients in Mississippi. Proc.
Annu. Conf. Southeast. Assoc. Fish and Wildl. Agencies. 38:1-12.
Jenks, J.A., D.M. Leslie, Jr., RJ.. Lochmillar. M.A. Melchiors, and WJO. Warde. 1080.
Effect of compositing samples on analysis of fecal nitrogen. J. Wildl. Manage.
53(0:213-215.
John, D£. 1971.. Production and utilization of natural and planted foods and their
relationship to physical condition in deer. M.S. Thesis. La. Slate Univ., Baton Rouge.
138pp.
Johnson, MX., B.W. DeLany, S.P. Lynch, J.A. Zeno, S.R. Schultz, T.W. Keegan, and BD.
Nelson. 1987. Effects of cool-season agronomic forages on white-Lailed deer. Wildl.
Soc. Bull. 15:330-339.
, H. Wofford, and H.A. Pearson. 1982. Microhistologica) techniques for food habits
analyses. Res. Pap. SO-199. New frleans. La.: USDA For. Serv., Southern For, Exp.
Sin. 40pp.

Joosl. R.E., C.R. Chaney, D i.Frlesner. R.D. Galea. R.L. Mitchell, 6.D. Mooso, D.R. Morris,
and J.L. Rabb. 1986. Performance of cool-season annual forage crops in Louisiana.
La. Agric. Exp. Stn. Mlmeo. Series No. 10, 1985-1986. La. Slate Univ.. Baton Rouge.
39pp.
Keegan, T.W. 1988. White-tailed deer use of American jofntvotch food plots. M.S. Thesis.
La. State Univ., Baton Rouge. 94pp.
M.K. Johnson, and 6.D. Nelson. 1989. American jointvetch improves summer range
for white-tailed deer. J . Range Manage. 42(2): 128-134.
Kennedy. J J . 1974. Attitudes and behavior of deer hunters in a Maryland forest. J . Wildl.
Manage. 38(0:1-8 .
Kirkpatrick. R.L., D.E. Buckland, W.A. Abler, P JF. Scanlon, J.B. Whelan, and H.E. Burkhart.
1975. Energy and protein influences on blood urea nitrogen of while-tailed deer
fawns. J . Wildl. Manage. 39(4):692-698.
Klein, DP. 1962. Rumen contents analysis as an index to range quality. Trans. N. Am. Wildl.
and Nat. Resour. Conf. 27:150-164.
Klein, D.R. 1969. Food selection by North American deer end their response to over
utilization of preferred plant species. Pages 25-44 in A. Watson, ed. Animal
populations in relation to their food resources. Oxford, Blackwell Sci. Publ. 477pp.
Knight, W.E., C.E. Hagedorn, VJ(. Watson, and D l. Friesner. 1982. Subterranean clover in
the United States. Advances in Agron. 35:166-191.
H.D. Palmerlree, and V.H.Watson. 1976. Growing subterranean clover in
Mississippi. Miss. Agric. and For. Exp. Stn. Info. Sheet 1268, 2pp.
Korschgen, L J . , W.R. Porath, and 0. Torgerson. 1980. Spring and summer foods of deer In
the Missouri Ozarks. J . Wildl. Manege. 44(0:89-97.

122
Langenau, E£., J r ., and JJ1. Aldrich. 1981. Immigration, amigration, and raturn ratas
among firaarm dear huntara in northern lower Michigan. J . Wildl. Manage. 45(2):314-
322.
R J . Moran. J.R. Terry, and D.C. Cue. 1981. Relationship between kill and ratings of
the hunt. J . Wildl. Manage. 45(4):959-964.
Larson. J.S. 1966. Problems in measuring food production on forest wildlife clearings.
Proc. Annu. Conf. Southeast. Assoc. Game and Fish Comm. 20:33-37.
Lay. D.W. 1957. Some nutritional problems of deer management in the Southern pine type.
Proc. Southeast. Assoc. Game and Fish Comm. 10:30-37.
1969. Foods and feeding habits of white-tailed deer. Pages 8-13 iQ.White-tailed
deer in the Southern forest habitat. USDA For. Serv.. South. For. Exp. Stn. 130pp.
Leffel, R.C., andPB. Gibson. 1973. White clover. Pages 167-176 in M.E. Heath, D.S.
Metcalfe, and R.F. Barnes, eds. Forages: the science of grassland agricultural. Third
ed. Iowa State Univ. Press, Ames, la. 755pp.
Leopold, A. 1949. A sand county almanac and sketches here and there. Oxford Univ. Press,
New York. 226pp.
. LJC. Sowls, and D.L. Spencer. 1947. A survey of over-populated deer ranges in the
United Stales. J . Wildl. Manage. 11( 1): 162—177.
Maguire, H£.( and C.W. Severinghaus. 1954. Wariness as an influence on age composition of
while-tailed deer killed by hunters. New York Fish Game J . 1(1 ):98-109.
Mansell, W.D. 1971. Accessory corpora lutes in ovaries of white-tailed deer. J . Wildl.
Manage. 35(2):369-374.
Martin, A.C., H.S. Zim, and AJ.. Nelson. 1951. American wildlife and plants: a guide to
wildlife food habits. Dover Publications, New York. 500pp.
Martin, 6.P. 1988. Soil survey of Concordia Parish, Louisiana. USDA Soil Conserv. Serv.,
La. Agric. Exp. Stn., and La. Soil and Water Conserv. Comm. 154pp. and 45 maps.

Martin. G.P.. J r .. C l . Butler, E. Scott, J.E. Lyles, M. Mariano. J . Ragus, P. Mason, and L.
Schoelerman. No date. Soil survey of Natchitoches Parish. Louisiana. USDA Soil
Conserv. Serv., La. Agric. Exp. Stn., La. Soil and Water Conserv. Comm., and USDA
For. Serv. unpublished.
Mautz, W.W. 1978. Nutrition and carrying capacity. Pages 321-348 ia J l . Schmidt and
D l. Gilbert, eds. Big game of North America. SLackpole Books, Harrisburg, Pa.
494pp.
McCord. C.M., andJ.E. Cardoza. 1982. Page 728 ]n J.A. Chapman and G.A. Feldhammer,
eds. Wild mammals of North America. Johns Hopkins Univ. Press. Baltimore, Md.
1147pp.
McEwen, L.C., C.E. French, N.D. Magruder, R.W. Swift, and R.H. Ingram. 1957. Nutrient
requirements of the while-tailed deer. Trans. N. Am. Wildl. Conf. 22:119-132.
McGinnes, 8.S. 1969. How size and distribution of cutting units affect food and cover of
deer. Peges 66-70 & White-tailed deer in the Southern forest habitat. USDA For.
Serv.. South. For. Exp. Stn. 130pp.
Meyer, B. S., DB. Anderson, R.H. Bohning, and D.G. Fratianne. 1973. Introduction to plant
physiology. D. Van Nostrand Co.. New York. 565pp.
Meyer, M.W., R.D. Brown, end h.W. Graham. 1984. Protein and energy content of white
tailed deer diets in the Texas Coastal Bend. J . Wildl. Manage. 48(2):527-534.
Moen, A.N. 1973. Wildlife ecology; an analytical approach. W.H. Freeman and Co., San
Francisco, Calif. 45Bpp.
Moore. W.H. I97B. Managing jointvetch for deer and cattle. Southeast. For. Exp. Stn., USDA
For. Serv. Res. Note SE-259, 6pp.
Mould, E.D.. and C.T. Robbins. 1981. Nitrogen metabolism In elk. J. Wildl. Manage.
45(2):323-334.

Murphy, D.A., and J.A. Coates. 1966. Effects of dietary protein on dear. Trans. N. Am.
Wildl. and Nat. Re sour. Conr. 31:129-139.
National Research Council. 1984. Nutrient requirements of beef cattle. Subcommittee on
beef cattle nutrition. Washington. D.C. 55pp.
Nixon. C.M.. li.W. McClain, and K.R. Russell. 1970. Deer food habits and range
characteristics in Ohio. J . Wildl. Manage. 34(4):870-886.
Noble, R.E. 1974. Reproductive characteristics of the Mississippi white-tailed deer. Miss.
Game and Fish Comm., Game Division. 58pp.
Ockenfels, R.A., and J.A. Bissonette. 1982. Estimates of white-tailed deer activity levels in
Oklahoma. Proc. Annu. Conf. Southeast. Assoc. Fish and Wildl. Agencies 36:445-453.
Owens. R.D., and J.D. Newsom. 1973. The effect of a diet of winter pasture grasses on
growth of white-tailed deer fawns. Proc. Ann. Conf. Southeast. Assoc. Game and Fish
Comm. 27:120-125.
Ozoga, J.J., and L J . Verme. 1982. Physical and reproductive characteristics of a
supplementaliy-fed white-tailed deer herd. J . Wildl. Manage. 46(2):281-301.
Parker, K.L. 1987. Body-surface measurements of mule deer and elk. J. Wildl. Manage.
51(3):630-633.
C.T. Robbins, and T.A. Hanley. 1984. Energy expenditures for locomotion by mule
deer and elk. J . Wildl. Manage. 48(2):474-488.
Pearson, H.A., H.E. Grelen, E.A. Epps. Jr., M.K. Johnson, and B.W. Blake wood. 1982.
Botannical composition and nutritive value of diets on Southern pine range. South.
For. Exp. Stn., USDA For. Serv. Res. Pap. SO-178, 24pp.
Petrides, 6.A. 1975. Principle foods versus preferred foods and their relations to slocking
rate and range condition. Biol. Conserv. 7(3):161-169.
Progulske, D.R., and D.C. Duerre. 1964. Factors influencing spotlighting counts of deer. J .
Wildl. Manage. 28(0:27-34.

Radford, A.E.. H£. Ahles, and C.R. Ball. 1968. Manual of the vascular flora of the Carollnas.
The Univ. of N.C. Press. Chapel Hill. 1183pp.
Render, J.H. 1984. Cottontail feeding on subterranean clover compared to ryegrass and
wheat. M.S. Thesis. La. State Univ., Baton Rouge. 39pp.
Resler. R.A. 1972. Clearculting: beneficial aspects for wildlife resources. J . Soil and Water
Conserv. 27:250-259.
Roberson, J.H., J r. 1967. A survey of breeding seasons of white-tailed deer (Odocolleus
viroinlanus) in Louisiana. M.S. Thesis. La. Slate Univ., Baton Rouge. 69pp.
Robinson. W.L., and E.G. Bolen. 1989. Wildlife ecology and management. Second ed.
Macmillan Publishing Co., New York. 574pp.
Robinette, W.L., C.H. Baer, R.E. Pillmore, and C.E. Knittle. 1973. Effects of nutritional
change on captive mule dear. J. Wild). Manage. 37(3):312-326.
Root, B.G., E.K. Frltzell, and N.F. Giessman. 1988. Effects of intensive hunting on white
tailed deer movement. Wildl. Soc. Bull. 16:145-151.
Roseberry, J.L., D.C. Autry, W.D. Klimstra, and L.A. Mehrhoff, J r . 1969. A controlled deer
hunt on Crab Orchard National Wildlife Refuge. J. Wildl. Manage. 33(4):791-795.
and W.D. Klimstra. 1975. Some morphological characteristics of the Crab Orchard
deer herd. J. Wildl. Manage. 39(1):48-5B.
Rudd, V.E. 1955. The American species of aeschynomene. Bull. U.S. Nall. Mus. (Smithsonian
Inst.) 32:1-172.
Samuel, D.E., and B.B. Nelson. 1982. Page 475 in J.A. Chapman and G.A. Feldhammer, eds.
Wild mammals of North America. Johns Hopkins Univ. Press, Baltimore, Md. 1147pp.
Schenk, J ., ed. 1986. Operation of the NIR scanner communications programs. Section 7,
Pacific Scientific Forage Systems. Pacific Scientific Ltd., Silver Springs. Md.

126
Schultz. S.R. 1987. Spring compensatory growth and summer growth of yearling white-
tailed deer grazing American jofntvatch. M.S. Thesis. La. State Univ., Baton Rouge.
55pp.
Scotter. G.W. 1980. Management or wild ungulate habitat in the western United Stales and
Canada: a review. J . Range Manage. 33(1):16-27.
Severinghaus. C.W. 1949. Tooth development and wear as criteria of age in white-tailed
deer. J . Wildl. Manage. 13(2): 195-216.
Shafer. E.L., J r., P.H. Amidon, and C.W. Severinghaus. 1972. A comparison of violators and
nonviolators of New York's deer-hunting laws. J . Wildl. Manage. 36(3):933 -939.
Short, H i. 1969. Physiology and nutrition of deer in Southern upland forests. Pages 14-18
in J W. Smith, ed. White-tailed deer in Southern forest habitat. Proc. South. For. Exp.
Stn. Symp., USDA For. Serv., New Orleans, La., 130pp.
1971. Forage digestibility and diet of deer on Southern upland range. J . Wildl.
Manage. 35(4):698-706.
J.D. Newsom, G.L. McCoy, and J JF. Fowler. 1969. Effects of nutrition and climate
on Southern deer. Trans. N. Am. Wildl. and Nat. Resour. Conf. 34:137-145.
Smith, R.L. 1980. Ecology and field biology. Third ed. Harper and Row Publishers, New York.
835pp.
Smith. S.H., J.B. Holter, HX. Hayes, and H. Silver. 1975. Protein requirement of white
tailed deer fawns. J . Wildl. Manage. 39{3):5B2-589.
Slankey, G.H., R.C. Lucas, and R.R. Ream. 1973. Relationships between hunting success and
satisfaction. Trans. North Am. Wildl. and Nat. Resour. Conf. 38: 234-242.
Steel, R.6.D., and JX . Torrie. 1980. Principles and procedures of statistics. Second ed.
McGraw-Hill Book Co., New York. 633pp.
Swank, W.G. 1956. Protein and phosphorous content of browse plants as an influence on
Southwestern deer herd levels. Trans. N. Am. Wild). Conf. 21:141-158.

Swift. R.W. 1948. Deer select most nutritious forages. J. Wildl. Manage. 12(0:109-110.
Taylor. NJ.. 1973. Rad clover and alsfke clover. Pages 148-158 M i. Heath, O.S.
Metcalfe, and R.F. Barnes, eds. Forages; the science of grassland agricultural. Third
ed. Iowa State Univ. Press. Ames, IA. 755pp.
Tear, J.G., J.W. Thomas, and E.A. Walker. 1965. Ecology and management of white-tailed
deer in the Llano Basin or Texas. Wild). Monogr. 15.62pp.
Thill, R.E. 1983. Deer and cattle forage selection on Louisiana pine-hardwood sites. Res.
Pap. SO-196, New Orleans, La. USDA For. Serv., South. For. Exp. Stn. 35pp.
____ _ and H.F. Morris, J r . 1983. Quality of spring deer diets on Louisiana pine-hardwood
sites. Proc. Annu. Conf. SoutheasL. Assoc. Fish and Wildl. Agencies 37:127-137.
A. Martin, J r., H J. Morris, J r ., and ED. McCune. 1987. Grazing and burning
impacts on deer diets on Louisiana pine-bluestem range. J . Wildl. Manage. 51(4):873-
880.
Thomas, J.W. 1966. Carrying capacity and overpopulation problems in Texas deer herds.
Pages 43-54 Jq The white-tailed deer: its problems and potentials. Tex. Agric. and
Meet). Univ., Collage Station. ) 10pp.
JD . Gill, J.C. Pack. W.M. Healy, and HD. Sanderson. 1976. Influence of forestland
characteristics on spatial distribution of hunters. J. Wildl. Manage. 40(3):500-506.
Thompson, C.B., J.B. Holter, H.H. Hayes, H. Silver, and W.E. Urban, J r . 1973. Nutrition of
white-tailed deer. I. Energy requirements of fawns. J. Wildl. Manage. 37(3):301-
311.
Thro. A.M., C.C. Shock, B.D. Nelson, F J . Peterson, A.B. Coco, L.P. Brown, and A.T. Wier.
1987. Aeschynomene and other summer legumes in Louisiana. La. Agric. 30(4):6-8.
Traynor, J . 1980. Ideas in soil and plant nutrition. Kovak Books, Bakersfield, Catif. 120pp.

Ultrey, D.E. 1983. Nutrition and antler development In white-tailed deer. Pages 49-59 jn
R.D. Brown, ed. Antler development in Corvidae. Caesar Kleberg Wildl. Res. Inst.,
Kingsville, Tex. 480pp.
W.6. Youatt, H.E. Johnson, A 5 . Cowan, L.D. Fay, R.L. Covert, W.T. Magee, and K.K.
Keahey. 1975. Phosphorous requirements of weened while-tailed deer fawns. J.
Wildl. Manage. 39(3)590-595.
____ L 5. Fay, and B.L. Bradley. 1967. Protein requirement of whita-
tailed deer fawns. J . Wildl. Menage. 31(4):679-685.
_ _ _ _ _ _____ _______ _ B.L. Schoepke, W.T. Magee. andK.K. Keahey. 1973. Calcium
requirements of weaned white-tailed deer fawns. J . Wild). Manege. 37(2): 187-194.
VanEtten. R.C., D.F. Switzenberg, and L. Eberhardl. 1965. Controlled deer hunting in a
square-mile enclosure. J . Wildl. Manage. 29(1)59-73.
Vangilder, L.D., 0. Torgerson, and W.R. Porath. 1982. Factors influencing diet selection by
white-tailed deer. J . Wild). Manage. 46(3):711-718.
Varner, L.W., L.H. Blankenship, and G.W. Lynch. 1977. Seasonal changes in nutritive value of
deer food plants in south Texas. Proc. Annu. Conf. Southeast. Assoc. Fish and Wildl.
Agencies 31 :99-106.
Verme, LJ. 1963. Effects of nutrition on growth of white-tailed deer fawns. Trans. N. Am.
Wildl. and Nat. Resour. Conf. 26:431-443.
1965. Reproduction studies on penned white-tailed deer. J . Wildl. Manage. 29( 1 ):74-
79.
1967. Influence of experimental diets on white-tailed deer reproduction. Trans. N.
Am. Wildl. and Nat. Resour. Conf. 32.405-420.
1969. Reproductive patterns of white-tailed deer related to nutritional plane. J.
Wildl. Manage. 33(4)581-887.

and J J . Ozoga. 1980. Effects of diet on growth and lipogenesis in dear fawns. J.
Wildl. Manage. 4 4 2 )515 -324 .
and D.E. Ullrey. 1972. Feed and nutrition of dear. Pages 275-291 in The digestive
physiology and nutrition of ruminants. Vol 3. Practical nutrition. D.C. Church,
Corvallis, Oreg. 350pp.
Watson, V.H., C. Hagedorn, W.E. Knight, and H.A. Pearson. 1984. Shade tolerance potential
of grass and legume germplasm for use in the Southern foresl range. J . Range
Manage. 37(3):229-232.
Weishuhn, L.L. 1983. Management of while-tailed deer on south Texas ranges. Pages 349-
353 in RD. Brown, ed. Antler development in Corvidae. Caesar Kleberg Wildl. Res.
Inst., Kingsville, Tex. 480pp.
Williams, C.E., and A.L. Caskey. 1965. Soil fertility and cottontail fecundity in southeastern
Missouri. Am. Midi. Nat. 74:211-224.
Williams, J.D., D.E. Harmel, W.E. Armstrong, and S.E. Wardroup. 1983. Antler development
in the white-tailed deer. Page 468 iQR.D. Brown, ed. Antler development in Cervidae.
Caesar Kleberg Wildl. Res. Inst., Kingsville, Tex. 480pp.

APPENDIX
130

131
Table 3S. Number of dear harvested per square kilometer on study units at National Red Dirt
Wildlife Management Preserve, Natchitoches Parish. Louisiana, 1983-1985.
YearStudv Unit Chi-square
Test ProbabilityCl C2 T1 —T2
1983 0.71 0.60 0.59 1.48 0.80 < P i 0.90
1984 0.20 0.44 0.71 1.28 0.80 < P i 0.90
1985 0.55 0.60 0.46 1.88 0.50 < P i 0.70

132
Table 36. Fawns/adult doe (2 2.5-years-old) harvested on study units at National Red Dirt
Wildlife Management Preserve, Natchitoches Parish, Louisiana; 1903-1905.
__________________Study Unit__________________ Chi-squareYear__________ £J___________ £2___________ U ___________12_______Test Probability
1983 0.60 1.00 1.49 0.50 0.80 < P £ 0.90
1984 1.00 0.17 1.00 0.67 0.80 < P i 0.90
1985 0.50 1.00 0.78 0.60 P > 0.95

Table 37. Mean body weights (kg) of male and female white-tailed deer harvested on study
units a t National Red Dirt Wildlife Management Preserve, Natchitoches Parish, Louisiana;
1983-1985 .
Studv UnitAge Cl C2 _ T1 T2
Year Cateaorv Ave.±s.e. n Ave.ls.e. n Ave.is.e. n Ave.ls.e. n P>fMales:1983 0.5 34.0 i — 0 34.014.5 2 27.212.3 4 0.29
1.5 48.512.3 6 53.012.7 3 58.313.2 3 51 .5H .8 3 0.09
12.5 67.4±5.0 3 71.614.5 4 67.611.8 4 59.1110.9 3 0.52
1984 0.5 25.4 1 21.8 1 — 0 27.510.9 2 0.33
1.5 46.212.3 3 48.812.3 4 48.813.2 5 51.713.2 3 0.71
12.5 — 0 87.3 1 53.515.9 3 61.617.3 2 0.14
1985 0.5 — 0 27.510.5 2 — 0 26.910.9 5 0.77
1.5 48.111.8 9 44.618.2 2 47.712.7 6 47.311.8 11 0.92
12.5 58.1 1 58.012.3 5 62.317.7 2 63.612.7 3 0.64
Females:1983 0.5 21.610.9 2 23.815.4 2 27.3 1 30.010.9 5 0.14
1.5 34.1 1 44.310.9 2 47.7 1 36.4 1 0.17
12.5 49.512.3 5 49.413.2 4 50.013.6 3 52.713.6 6 0.85
1984 0.5 — 0 23.6 1 24.5 1 — 0 —
1.5 — 0 42.7 1 39.313.6 2 — 0 0.67
12.5 51.7 1 45.814.5 3 43.1 l 1.8 6 38.613.2 2 0.31
1985 0.5 28.6 1 29.5 1 31.8 1 21.813.2 2 0.54
1.5 39.5 1 — 0 48.2 1 40.312.7 3 0.45
12.5 45.613.2 2 50.111.4 5 50.0 1 *43.910.9 9 0.01
"significant difference a t 0.05 alpha level with Duncan's test.

134
Table 36. White-tailed deer population surveys conducted on study units at National Red Dirt
Wildlife Management Preserve, Natchitoches Parish. Louisiana; 1986 - 1988.
Spoilfght Survey:4-5 November 1986
Study No. of Transects Unit Surveyed
Transect Length (km)
Total No. of Deer Seen
Cl 3 8 0
C2 3 8 0
T1 3 8 0
T2 3 8 0
S tr ip Census Surveys ;11-14 Auaust 1987
StudyUnit
No. of Transects Surveyed
Meants.e. Transect
Lenath fkm)Total No. of Deer Seen
Mean±s.e.No. of
Deer Seen / kmChi-square
Test Results
Cl 9 3.66 ±0.06 7 0.22 ±0.04 — P>0.93
C2 10 3.04 ±0.05 6 0.19 ±0.03
T1 9 3.76 ±0.03 0 0.00 ±0.00
T2. 10 4.11 ±0.01 • 13 0.32 ±0.05
2-5 Auaust 1988
StudyUnit
No. of Transects Surveyed
Mean±s.e. Transect
Lenath fkm)Total No. of Deer Seen
Mean±s.e.No. of
Deer Seen / kmChi-square
Test Results
C1 8 3.49 ±0.08 1 0.03 ±0.00 — P>0.95
C2 8 3.08 ±0.11 3 0.13 ±0.01
T1 8 3.30 ±0.15 3 0.11 ±0.03
T2 8 3.91 ±0.02 8 0.26 ±0.06

135
Table 39. Estimates (Hayne 1949) or deer population size In 1987 and 1988 a t National
Red Dirt Wildlife Management Preserve, Natchitoches Parish, Louisiana.
YpprStudyUnit
(Hayne‘s (1949) Estimate)
Number of Deer/ha
Number or ha/Deer
Estimated Number of
Deer
1987 Cl 0.0038 43.26 59
C2 0.0075 21.97 114
T1 0.0000 0.00 0
12 0.0069 23.62 64
entire Preserve 0.0045 (± 0.0017) 36.05 427 (± 162)
1988 Cl 0.0024 68.05 38
C2 0.0041 39.72 63
T1 0.0028 57.88 48
1 2 0.0058 28.31 51
entire Preserve 0.0038 (± 0.0008) 43.25 356 (± 72)

Table 40. Food plot production and deer utilization (mean ± s.e.) in study unit T1 a t National Red Dirt Wildlife Management Preserve, Natchitoches
Parish, Louisiana: 1986-1988.
RtlCIfixsr Subciover___________________ Vftttdt_________ JgintVetch________ »kg ofMean Mean Mean Mean Food Plot
Mean Utilization Mean Utilization Mean Utilization Mean Utilization Forages/Time Production Bv Deer Production Bv Deer Production Bv Deer Production By Deer Deer/Period ftq /J iaU M a) ttq/hri (kg/ha) (kg/ha) (W t o ).i* .m ) (ko/ha) fra/ha) (» su t) Qay_
July 86 — — — — — — — — — 313±109 64*27 20 0.16
Sept 86 — — — — — — — — — 911±308 188*78 21 0.46
Nov 86 — — — — — — — — — 1353*498 270*184 20 0.30
Jan 87 31*8 9*7 29 78*16 39*14 50 66*10 7*17 10 — — — 0.31
Apr 87 1203*263 172*44 14 1738*373 282*79 16 714*160 30*51 4 — — — 0.48
May 87 1336*379 64*15 5 1998*389 98*26 5 626*169 9*36 1 — — — 0.39
July 87 640*213 183*74 29 0.32
Aug 87 1733*780 251*102 14 0.47
Oct 87 2665*733 322*126 12 0.36
Jan 88 671*166 43*14 6 1029*359 72*53 7 — — — — — — 0.48
Mar 88 932*145 107*37 22 1862*362 209*72 11 — — — — — — 0.42
May 88 1220*274 118*25 10 1256*277 128*39 10 — — — — — — 0.39

Table 40. Food plot production and deer utilization (mean ± s.e.) in study unit T1 a t National Red Dirt Wildlife Management Preserve, Natchitoches
Parish, Louisiana; 1986-1988 (continued).
Red Clover Subclover Wheat JointVetch • kg of Food Plot Forages/
Deer/Time
MeanMean Utilization
Production By Deer.......
MeanMean Utilization
Production By Deer
MeanMean Utilization
Production By Deer
MeanMean Utilization
Production By DeerPeriod (ko/ha) (kg/ha) (*XUt) (ko/ha) (ko/ha) (*XUt) (ko/ha) (ko/ha) (** Jt) (kg/ha) (ko/ha) (*XUt) Dav
Nov 88 278±219 101*73 36 0.06
"*Ut - X utilization.
eBased on estimate of 1 deer/36.0 ha in 1987 and 1 deer/43.3 ha in 1986 and 1988.

Table 41. Food plot production and deer utilization (mean ± s.e.) in study unit T2 at National Red Dirt Wildlife Management Preserve,
Natchitoches Parish, Louisiana; 1986-1988.
Red Clover _______ Subclover___________________ Wheat_________ JointVetch________ ek g o fMean Mean Mean Mean Food Plot
Mean Utilization Mean Utilization Mean Utilization Mean Utilization Forages/Time Production BvDeer Production Bv Deer Production __ _ Bv Deer Production BvDeer Deer/Period (ko/ha) (ka/ha) (*JJUt) (ka/ha) (ko/ha) (*XUt) (ka/ha) (ko/ha) («XUt) (ka/ha) (ko/ha) («SUt) Day
July 86 349±128 85±27 24 0.23
Sept 86 1384±367 194±69 14 0.50
Nov 86 1744±513 319±52 18 0.38
Jan 87 80±32 42±18 52 50±15 11±3 22 72±20 7±8 10 — — — 0.32
Apr 87 1026±83 148±17 14 1356±96 187±30 14 550±102 31 ±52 6 — — — 0.35
May 87 1151±98 71 ±66 7 1544±109 81±24 5 587±90 17±18 3 — — — 0.38
July 87 1267±120 243±74 19 0.44
Aug 87 1953±878 224±87 12 0.43
Oct 87 2484±553 276±92 11 0.32
Jan 88 628±60 41±7 7 845±58 79±10 9 0.48
Mar 88 841±45 129±24 15 1521±130 230±13 15 0.46
May 88 903±168 120±50 13 974±191 125±36 13 0.38 138

i
i
Table 41. Food plot production and deer utilization (mean ± s.e.) in study unit T2 at National Red Dirt Wildlife Management Preserve,
Natchitoches Parish, Louisiana; 1986-1988 (continued).
Red Clover Subclover Wheat JointVetch • kg of
Time
MeanMean Utilization
Production Bv Deer
MeanMean Utilization
Production By Deer
MeanMean Utilization
Production By Deer
MeanMean Utilization
Production Bv Deer
Food Plot Forages/
Deer/Period (ka/ha) (kg/ha) (*J?Ut) (ka/ha) (ka/ha) (*XUt) (ka/ha) (ko/ha) CXUt) (kg/ha) (ka/ha) (*XUt) Day
Nov 88 397*216 132±80 33 0.08
•XUt - X utilization.
•Based on estimate of 1 deer/36.0 ha in 1987 and 1 deer/43.3 ha in 1986 and 1988.
139

HO
Table 42. Vegetative production (mean i s.e.) in deer-proof enclosures vs rabbit-proof
enclosures on food plots in study units T1 and T2 at National Red Dirt Wildlife Management
Preserve, Natchitoches Parish, Louisiana; 1967- 1986.
Forage Type ___________________Production (ko/ha)___________________May 87 March 88 May 88
T1:Red Clover(n=3):
Deer-Proof
Rabbit-Proof
P >F:
Subclover (na3):
Deer-Proof
Rabbit-Proof
P >F:
Wheat(n*6):
Deer-Proof
Rabbit-Proof
P > F:
1288 ± 573
1315 ± 539
>0.25
2220 ± 592
2307 ± 599
>0.25
710 ±330
741 ±311
>0.25
9 8 1 ± 180
9 9 6 ± 193
>0.25
1715 ±330
1768 ±345
>0.25
1416 ± 479
1486 ±478
>0.25
1591 ±514
1603 ±526
> 0.25

141
Table 42. Vegetative production (mean ± s.e.) In deer-proof enclosures vs rabblt-proor
enclosures on food plots In study units Tt and T2 a t National Red Dirt Wildlife Management
Preserve, Natchitoches Parish, Louisiana; 1967 - 1986 (continued).
Forage Type ___________________ Production (ko/ha)___________________May 87 March 88 May 88
T2:Red Clover (n*2):
Deer-Proof
Rabbit-Proof
P >F:
Subclover (n*2):
Deer-Proof
Rabbit-Proof
P >F:
Wheat (n*4):
Deer-Proof
Rabbit-Proof
P >F:
1218 ± 18
1265 ± 10
> 0.10
1681± 124
1728± 190
>0.25
574 ± 113
6 0 6 ± 95
>0.25
865 ± 78
918 ± 48
>0.25
968 ± 4 8
998 ± 50
>0.25
1521± 184
1558 ± 182
>0.25
1202 ±240
1225 ± 255
>0.25

142
Table 43. Mean crude protein content (%) or food plot forages collected In study units T1 and
T2 a t National Red Dirt Wildlife Management Preserve, Natchitoches Parish, Louisiana; 1986-
1966 (red clover, subclover, and jointvetch: n » 6 for T1, n ■ 4 for T2; wheat: n ■ 12 for
T1, n ■ 8 for T2).
UniLCollectionPeriod
Red Clover Subclover Wheat JointvetchMeanC.P.* ±s.e.
MeanC.P.* ±s.e.
MeanC.P.“ ±s.e.
Mean ____ C.P.- ±s.e
Jul 86 __ __ — 17.5 ±1.2
Sep 66 — — — 15.4 ±0.7
Nov 86 — — — 9.6 ±0.3
Jan 67 16.5 ±2.6 11.3 ±0.5 13.2 ±0.5 —
Apr 87 16.2 ±1.2 12.2 ±0.6 8.6 ±0.7 —
May 87 15.5 ±0.6 7.4 ±0.2 4.8 ±0.2 —
Jul 87 — — — 15.8 ±1.1
Aug 87 — — — 13.7 ±1.1
Oct 67 — — — 13.0 ± 1.4
Jan 88 18.3 ±0.8 17.4 ±0.6 — —
Mar 88 17.3 ±0.6 16.9 ±0.9 — —
May 88 12.6 ±0.8 11.2 ±0.6 — —
Nov 88 — — — 11.8 ± 0.9
T l:

143
Table 43. Mean crude protein content (%) of food plot Forages collected in study units T1 and
T2 a t National Red Dirt Wildlife Management Preserve, Natchitoches Parish. Louisiana; 1906-
1900 Cred clover, subclover, and Jointvetch; n * 6 for T1, n ■ 4 for T2; wheat: n ■ 12 for
T1. n » 0 for T2) (continued).
______________________Food Plot Forages______________________Red Clover Subclover Wheat Jointvetch
Study Collection Mean Mean Mean MeanUnit Period C.P." ±s.e. C.P.- ±s.e._ C P * ±s.e. CP.* ±s.e.
T2:JUI06 — — — 17.7 ±0.6
Sep 86 — — — 16.9 ±0.8
Nov 86 — — — 9.9 ±0.6
Jan 87 14.7 ±0.8 11.8 ±0.5 8.9 ±0.5 —
Apr 87 17.2 ±0.6 12.0 ±0.3 9.3 ±0.6 —
May 87 15.4 ±1.9 11.0 ±0.9 5.7 ±0.7 —
Jul 87 — — — 17.2 ±1.4
Aug 87 — — — 18.2 ±1.0
Oct 87 — — — 12.8 ±1.1
Jan 06 14.3 ±0.7 15.9 ±2.4 — —
Mar BB 14.1 ±1.2 13.7 ±1.3 — —
May 88 10.8 ±1.5 11.1 ±1.2 — —
Nov 88 — — — 11.2 ± 0.8
"C.P. * crude protein.

Table 44. dean nutrient content (Jt) of American jointvetch on food plots a t National Red Dirt Wildlife Management Preserve, Natchitoches
Parish. Louisiana tfor studv unit T1. n - 6: for study unit T2, n « 4 ); 1986 - 1988._______________________________________________Collection P K Ca Mo S Fe MnDais * s-e. x tfii S S s j l S ££*______ 2_________ S______ a ^T1:
July86 0.27 0.03 2.78 0.17 1.44 0.25 0.36 0.02 0.32 0.04 0.017 0.002 0.020 0.012
SeptSG 0.15 0.04 1.51 0.14 1.22 0.01 0.33 0.01 0.26 0.01 0.019 0.002 0.017 0.004
Nov86 0.14 0.04 1.36 0.13 1.00 0.07 0.27 0.02 0.18 0.02 0.019 0.007 0.009 0.002
July87 0.23 0.03 2.03 0.11 0.98 0.11 0.30 0.07 0.23 0.01 0.016 0.004 0.011 0.003
Aug87 0.19 0.02 1.50 0.20 1.07 0.10 0.27 0.02 0.20 0.02 0.013 0.001 0.014 0.002
0ct87 0.17 0.03 1.14 0.09 0.98 0.10 0.25 0.02 0.15 0.01 0.015 0.004 0.011 0.002
Nov88 0.12 0.03 0.67 0.34 0.96 0.23 0.23 0.05 0.11 0.01 0.005 0.001 0.006 0.001
T2: P K Ca Ma S Fe Mn _ _
July86 0.22 0.01 2.05 0.37 1.11 0.07 0.31 0.03 0.25 0.03 0.018 0.005 0.013 0.006
Sept86 0.17 0.02 1.45 0.39 1.38 0.08 0.33 0.03 0.28 0.06 0.016 0.002 0.016 0.005
Nov86 0.12 0.01 0.82 0.14 1.09 0.02 0.30 0.06 0.31 0.16 0.015 0.004 0.008 0.003
July87 0.27 0.02 1.88 0.15 1.15 0.07 0.27 0.02 0.26 0.02 0.042 0.028 0.013 0.003
Aug87 0.20 0.01 1.63 0.09 1.34 0.08 0.31 0.03 0.25 0.01 0.016 0.003 0.026 0.006
0ct87 0.14 0.02 0.99 0.10 1.14 0.09 0.25 0.03 0.15 0.01 0.015 0.005 0.010 0.003
Nov88 0.10 0.03 0.74 0.05 1.04 0.08 0.24 0.02 0.11 0.00 0.008 0.001 0.009 0.004

Table 44. Mean nutrient content (X) of American jointvetch on food plots a t National Red Dirt Wildlife Management Preserve, Natchitoches
Parish. Louisiana (for study unit T1. n - 6: for study unit T2. n - 4 ): 1986 - 1988 (continued).____________________________________Collection Date _
2ft Cu CoX s.e. X s.e. X s.e.
T1:
July86 0.0054 0.0009 0.0011 0.0001 0.00002 0.00001
Sept86 0.0071 0.0013 0.0009 0.0000 0.00001 0.00001
Nov86 0.0098 0.0028 0.0026 0.0012 0.00001 0.00001
Ju1y87 0.0043 0.0008 0.0021 0.0010 0.00000 0.00000
Aug87 0.0055 0.0015 0.0012 0.0001 0.00004 0.00002
0ct87 0.0089 0.0049 0.0009 0.0001 0.00002 0.00001
Nov88 0.0044 0.0028 0.0008 0.0001 0.00002 0.00002
T2: Zft Cu Co
July86 0.0040 0.0012 0.0011 0.0000 0.00007 0.00004
Sept86 0.0046 0.0011 0.0011 0.0001 0.00003 0.00001
Nov66 0.0042 0.0007 0.0012 0.0002 0.00005 0.00003
July87 0.0043 0.0004 0.0019 0.0008 0.00003 0.00001
Aug87 0.0037 0.0003 0.0011 0.0001 0.00008 0.00004
0ct87 0.0027 0.0003 0.0010 0.0001 0.00007 0.00003
Nov88 0.0024 0.0006 0.0010 0.0000 0.00014 0.00014

Table 45. Mean nutrient content (X) of red clover on food plots at National Red Dirt Wildlife Management Preserve, Natchitoches Parish,Louisiana ffor study unit T1. n ■ 6: for study unit T2. n - 4 1: 1987 - 1988.___________________________________________________
_ _ _ _ _ _ _ _ _ _ _ _ _ _ _ _ _ _ _ _ _ _ _ _ _ _ _ _ _ _ _ _ _ _ _ _ _ _ _ _ _ _ _ _ S M v Unit , T 1_ _ _ _ _ _ _ _ _ _ _ _ _ _ _ _ _ _ _ _ _ _ _ _ _ _Collection P K Ca Mg S_____ Fe Mn_____Date S s.e. S i t 8 i t 8 i t 8 i t S i t 8________ i t
Jan87 0.22 0.02 1.57 0.08 1.22 0.14 0.25 0.04 0.16 0.02 0.10 0.01 0.017 0.002
Apr87 0.15 0.03 1.24 0.07 '..76 0.35 0.29 0.09 0.13 0.01 0.03 0.02 0.022 0.003
May87 0.20 0.00 1.78 0.16 1.66 0.11 0.30 0.05 0.17 0.01 0.02 0.00 0.023 0.005
Jan88 0.37 0.02 2.56 0.10 1.03 0.05 0.22 0.03 0.25 0.00 0.06 0.04 0.011 0.002
Mar88 0.31 0.04 2.98 0.49 1.51 0.03 0.26 0.02 0.22 0.02 0.11 0.04 0.010 0.003
May 88 0.21 0.05 1.83 0.03 1.20 0.02 0.30 0.02 0.12 0.02 0.01 0.00 0.013 0.003
Study Unit T2
P k; Ca Ma s Fe Mn
Jan87 0.16 0.00 1.79 0.00 1.36 0.00 0.20 0.00 0.00 0.00 0.18 0.00 0.010 0.000
Apr87 0.13 0.03 1.68 0.51 2.02 0.32 0.23 0.00 0.17 0.00 0.01 0.00 0.009 0.001
May87 0.24 0.05 1.65 0.29 1.68 0.11 0.38 0.04 0.16 0.01 0.01 0.00 0.020 0.007
Jan88 0.29 0.03 1.73 0.06 1.17 0.01 0.18 0.03 0.24 0.02 0.04 0.01 0.008 0.003
Mar 88 0.27 0.01 1.59 0.31 1.58 0.47 0.19 0.08 0.24 0.07 0.03 0.00 0.023 0.016
May88 0.17 0.11 1.46 0.58 1.68 0.49 0.27 0.02 0.14 0.03 0.07 0.06 0.004 0.002

Table 45. Kean nutrient content (5?) of red clover on food plots at National Red Dirt Wildlife Management Preserve, Natchitoches Parish,Louisiana (for study unit T1. n - 6: for study unit T2. n - 4 ): 1987 - 1988 (continued).________________________________________
______________________ Study Unit T1_________________________Collection Zq Cu_____ Cu______Date 8 a £ i_ _ _ _ _ _ 8_______ s&>_________8_________ 3.e.
Jan87 0.0023 0.0002 0.0007 0.0001 0.00004 0.00001
Apr87 0.0027 0.0001 0.0009 0.0001 0.00003 0.00003
May87 0.0036 0.0006 0.0013 0.0001 0.00000 0.00000
Jan88 0.0038 0.0004 0.0019 0.0007 0.00000 0.00000
Mar88 0.0047 0.0012 0.0012 0.0002 0.00003 0.00001
May88 0.0035 0.0002 0.0012 0.0003
_ _Studv Unit T2
0.00002 0.00001
2n Cu Co
Jan87 0.0026 0.0002 0.0006 0.0002 0.00005 0.00001
Apr87 0.0028 0.0002 0.0007 0.0001 0.00000 0.00000
May87 0.0036 0.0003 0.0014 0.0006 0.00001 0.00001
Jan88 0.0028 0.0006 0.0012 0.0007 0.00004 0.00002
Mar88 0.0040 0.0014 0.0004 0.0002 0.00002 0.00002
May88 0.0022 0.0002 0.0011 0.0002 0.00009 0.00009

Table 46. Mean nutrient content (X) of subctover on food plots a t National Red Dirt Wildlife Management Preserve, Natchitoches Parish,
Louisiana (for study unit T1. n - 6: for study unit T2. n - 4 ) ; .1 9 8 7 - 1968,__________________________________________________Study Unit. T1
Collection P K Ca Mo s Fe MnDate R s.e. X s.e. X s.e. X s.e. X s.e. X s.e. X s.e.
Jan87 0.14 0.02 1.57 0.18 1.48 0.15 0.21 0.02 0.16 0.01 0.08 0.01 0.011 0.002
Apr87 0.09 0.01 1.38 0.23 1.79 0.06 0.24 0.02 0.14 0.00 0.04 0.01 0.012 0.003
May87 0.07 0.02 1.03 0.15 1.32 0.31 0.18 0.01 0.13 0.01 0.05 0.01 0.016 0.000
Jan88 0.34 0.05 2.33 0.33 0.93 0.06 0.23 0.03 0.19 0.02 0.06 0.03 0.016 0.002
Mar88 0.28 0.03 2.30 0.45 1.53 0.30 0.23 0.00 0.17 0.01 0.04 0.01 0.028 0.009
May88 0.18 0.02 1.26 0.34 1.20 0.14 0.17 0.00 0.12 0.01 0.03 0.02 0.028 0.016
Studv Unit T2
P K Ca Me 5 Fe fin
Jan87 0.12 0.02 1.53 0.13 1.41 0.09 0.17 0.02 0.16 0.02 0.14 0.03 0.010 0.003
Apr87 0.08 0.01 1.34 0.51 1.58 0.08 0.23 0.03 0.14 0.00 0.04 0.02 0.011 0.004
May87 0.10 0.01 1.60 0.55 1.29 0.66 0.20 0.07 0.13 0.01 0.06 0.00 0.011 0.005
Jan88 0.20 0.02 1.60 0.40 0.91 0.22 0.20 0.01 0.20 0.00 0.33 0.11 0.014 0.010
Mar 88 0.31 0.09 2.52 0.53 1.69 0.02 0.25 0.01 0.30 0.07 0.19 0.11 0.017 0.002
May88 0.11 0.00 0.40 0.00 0.91 « 0.00 1.41 0.00 0.09 0.00 0.01 0.00 0.011 0.000

Table 46. Mean nutrient content (X) of subclover on food plots a t National Red Dirt Wildlife Management Preserve, Natchitoches Parish,
Louisiana (for study unitTI. n - 6; for studv unlt I2 . n_-4 I J 9 9 7 - 19B9 (continued)._______________________________________________________________ Study Unit T1_________________________
Collection Zn Cu CoDate ___ X s.e. X s.e. a s.e.
Jan87 0.0030 0.0002 0.0012 0.0002 0.00003 0.00001
Apr87 0.0028 0.0002 0.0007 0.0002 0.00001 0.00001
May87 0.0035 0.0010 0.0011 0.0002 0.00006 0.00001
Jan88 0.0040 0.0002 0.0014 0.0003 0.00003 0.00002
Mar88 0.0052 0.0008 0.0012 0.0001 0.00004 0.00004
May88 0.0034 0.0012 0.0011 0.0001
Study Unit T2
0.00004 0.00004
jZcl _£ll_ S sl
Jan87 0.0027 0.0002 0.0004 0.0001 0.00005 0.00001
Apr87 0.0020 0.0005 0.0004 0.0002 0.00002 0.00002
May87 0.0026 0.0006 0.0011 0.0001 0.00002 0.00002
Jan88 0.0049 0.0008 0.0012 0.0004 0.00040 0.00016
Mar88 0.0047 0.0002 0.0013 0.0003 0.00012 0.00008
May88 0.0034 0.0000 0.0006 0.0000 0.00000 0.00000

Table 47. Mean nutrient content (X) of wheat on food plots at National Red Dirt Wildlife Management Preserve, Natchitoches Parish,
Louisiana: 1987 (for study unit T1. n - 12: for study unit T2. n - 8 1._____________________________________________________Study Unit T1
Collection JSl J3d_V 9 V 9
Jan87 0.36
_______
0.03 2.83 0.26 0.42
___ iiSj__
0.03 0.11 0.01 0.25 0.02 0.025 0.003 0.014 0.003
Apr87 0.23 0.02 2.07 0.18 0.24 0.03 0.12 0.01 0.16 0.03 0.010 0.004 0.017 0.008
May87 0.13 0.03 0.92 0.08 0.15 0.01 0.08 0.01 0.08 0.00 0.006 0.002 0.017 0.004
Study Unit T2P K Ca Mo s Fe Mn
Jan87 0.31 0.08 2.44 0.19 0.47 0.05 0.12 0.01 0.26 0.04 0.048 0.015 0.021 0.003
Apr87 0.19 0.03 2.22 0.19 0.32 0.08 0.13 0.01 0.18 0.02 0.011 0.003 0.016 0.005
May87 0.16 0.04 1.00 0.07 0.16 0.02 0.09 0.01 0.11 0.02 0.009 0.004 0.008 0.001

Table 47. Mean nutrient content (X) of wheat on food plots at National Red Dirt Wildlife Management Preserve, Natchitoches Parish,
Louisiana: 1967 (for study unit T .l^fl-_ i2;Jbr study unit T2. n - 8 ) [continued).-----------------------------------------------------------------______________________ Study Unit T1__________________________
CollectionDate
Zn Cu Co___ SS s.e. * S Jt. R s.e.
Jan87 0.0019 0.0002 0.0004 0 . 0 0 0 0 0.00002 0.00001
Apr87 0.0024 0.0002 0.0008 0.0001 0 . 0 0 0 0 0 0 . 0 0 0 0 0
May87 0.0025 0.0003 0.0012 0.0001 0.00000 0 . 0 0 0 0 0
Study Unit T2Zn Cu Co
Jan87 0.0023 0.0002 0.0003 0 . 0 0 0 0 0 . 0 0 0 0 0 0 . 0 0 0 0 0
Apr87 0.0023 0.0001 0.0003 0.0000 0 . 0 0 0 0 0 0 . 0 0 0 0 0
May87 0.0023 0.0003 0.00 to 0.0001 0 . 0 0 0 0 0 0 . 0 0 0 0 0

Table 48. Mean crude protein content (X) of deer fecal samples collected on study units a t National Red Dirt Wildlife Management Preserve,
Natchitoches Parish, Louisiana; 1986 - 1988 (n - 30 samples per study unit per collection period).'11
Auo 86 Jan 87 Mav 87 __ Aua87 ’ Jan 88
COCO>I
StudyUnit
•Duncan's C.P • ±s.e. Test
•Duncans C.P." ±s.e. T es t. C.P." ±s.e
•Duncan's . Test
•Duncan's C P ." *s.e. Test
•Duncan's C P." ± se . Test
•Duncan's C.P." ±s.e. Test
Cl 16.7 ±0.6 A,B 14.3 ±0.5 A.B 21.4 ±0.7 A 17.3 ±0.9 A 13.4 ±0.3 A 20.7 ±0.4 A
C2 18.0 ±0.6 A 14.8 ±0.6 A 20.4 ±0.6 A 18.0 ±0.5 A 13.6 ±0.6 A 18.7 ±0.5 B
T1 17.8 ±0.5 A 13.6 ±0.6 A.B 21.5 ±0.6 A 16.7 ±0.5 A 13.5 ±0.4 A 20.3 ±0.4 A
T2 15.9 ±0.4 B 13.2 ±0.3 B 20.5 ±0.5 A 17.9 ±0.3 A 13.3 ±0.3 A 19.0 ±0.4 B
"C.P. - mean crude protein.
•crude protein values with similar letters are not significantly different; alpha level - 0.05.

153
Table 49. Mean nutrient content (X) of deer fecal matter collected on study units a l National
Red Dirt Wildlife Management Preserve, Natchitoches Parish, Louisiana (n * 10 composite
samples per study unit oer collection period); 190ft - 1980.____________________________Pellet ___________________ Study Unit____________________
Collection Cl C2 T1 T2Mi1 Dale X a.e. X s.e. X s.e. X s.e. P>F
P 8608 *0.25 0.02 0.31 0.02 0.35 0.02 0.31 0.02 0.01
p 8701 0.28 0.02 0.26 0.02 0.23 0.01 0.22 0.01 0.14
P 8705 0.47 0.05 0.49 0.08 0.38 0.03 0.44 0.03 0.38
P 8708 0.26 0.02 0.30 0.01 0.31 0.02 0.32 0.02 0.07
P 8801 0.34 0.04 0.27 0.02 0.33 0.03 0.43 0.07 0.11
p 8805 0.39 0.03 0.37 0.01 *0.44 0.02 *0.31 0.02 0.01
K 8608 0.12 0.02 0.12 0.02 0.20 0.03 *0.31 0.06 0.00
K 8701 0.33 0.11 0.20 0.07 0.31 0.08 0.37 0.10 0.64
K 8705 0.46 0.18 0.26 0.05 0.15 0.04 0.23 0.04 0.14
K 8708 0.11 0.01 0.12 0.02 0.14 0.03 *0.30 0.07 0.01
K 8801 0.17 0.04 0.23 0.07 0.16 0.02 0.33 0.08 0.14
K 6805 0.24 0.05 0.16 0.02 0.27 0.04 0.23 0.05 0.36
Ca 8608 1.92 0.19 *2.69 0.20 1.90 0.15 1.48 0.14 0.00
Ca 8701 1.47 0.16 1.31 0.15 1.08 0.10 1.06 0.14 0.12
Ca 8705 1.87 0.19 *3.02 0.39 1.51 0.13 2.24 0.35 0.00
Ca 8708 1.68 0.23 *2.55 0.15 1.74 0.14 1.87 0.29 0.02
Ca 8801 1.47 0.19 1.55 0.26 1.89 0.26 1.66 0.30 0.67
Ca 8805 1.75 0.15 *2.85 0.16 1.67 0.22 1.76 0.24 0.00

154
Table 49. Mean nutrient content (X) of deer fecat matter collected on study units a t National
Red Dirt Wildlife Management Preserve, Natchitoches Parish, Louisiana (n « 10 composite
samples per study unit per collection period); 1986 - 1988 (continued)._________________Pellet _______________________Study Unit_______________________
Collection C! C2 T1 T2l i t1 Date X 5.e. X s.e. X s.e. X s.e. P>F
Mg 8608 -0.31 0.02 -0 .34 0.03 0.52 0.04 0.49 0.06 0.00
Mg 8701 0.24 0.02 0.24 0.03 0.23 0.01 0.19 0.02 0.24
Mg 8705 0.48 0.05 0.44 0.08 0.42 0.06 0.56 0.05 0.29
Mg 8708 -0 .32 0.04 0.37 0.03 0.39 0.03 0.46 0.03 0.03
Mg 8801 0.29 0.05 0.28 0.05 0.28 0.02 0.24 0.03 0.83
Mg 8805 0.47 0.03 0.55 0.03 0.52 0.02 "0.40 0.05 0.03
S 8608 0.30 0.03 0.34 0.01 0.34 0.01 0.33 0.02 0.38
S 8701 0.28 0.01 0.25 0.01 0.25 0.01 0.26 0.02 0.44
S 8705 0.39 0.02 0.38 0.01 0.36 0.03 0.37 0.01 0.59
S 8708 0.31 0.03 0.31 0.02 0.32 0.02 0.30 0.01 0.94
S 8801 0.29 0.01 0.30 0.02 0.29 0.00 -0 .25 0.01 0.01
S 8805 0.38 0.02 0.39 0.03 0.37 0.01 0.33 0.02 0.18
Fe 8608 0.06 0.03 0.03 0.01 0.04 0.01 0.04 0.00 0.52
Fe 8701 0.04 0.00 0.03 0.00 "0.03 0.00 0.04 0.01 0.04
Fe 8705 0.03 0.00 0.03 0.00 0.09 0.04 0.05 0.01 0.12
Fe 8708 0.08 0.04 0.03 0.00 0.02 0.00 0.03 0.00 0.29
Fe 8801 0.04 0.01 0.04 0.01 0.04 0.00 0.05 0.01 0.24
Fe 8805 0.03 0.01 0.06 0.03 0.06 0.02 0.05 0.01 0.71

155
Table 49. Mean nutrient content (X) of deer fecal matter collected on study units at National
Red Dirt Wildlife Management Preserve, Natchitoches Parish, Louisiana (n ■ 10 composite
samples per study unit per collection period): 1966 - 1986 (continued)._________________Pellet _______________________ Study Unit
NOCollection
DateCl C2 T_1___ T2
P>FX s.e. X s.e. X s.e. X s.e.
Mn 8608 0.10 0.02 "0.21 0.01 0.13 0.01 0.14 0.01 0.00
Mn 8701 0.15 0.01 0.21 0.02 0.21 0.02 0.20 0.02 0.06
Mn 8705 0.13 0.02 0.16 0.02 0.17 0.02 0.12 0.01 0.11
Mn 8708 "0.12 0.02 "0.21 0.02 0.13 0.01 0.16 0.01 0.00
Mn 8801 0.18 0.01 *0.25 0.02 0.20 0.03 0.16 0.02 0.02
Mn 8805 0.12 0.01 0.16 0.01 0.15 0.01 0.14 0.01 0.12
Zn 6608 0.010 0.002 0.009 0.001 0.011 0.001 0.010 0.001 0.80
Zn 8701 0.007 0.001 0.006 0.000 0.007 0.001 0.006 0.001 0.80
Zn 8705 0.018 0.005 0.008 0.001 0.010 0.001 0.010 0.001 0.08
Zn 8708 0.020 0.008 0.008 0.001 0.009 0.001 0.007 0.000 0.07
Zn 8801 0.009 0.002 0.007 0.001 0.007 0.001 0.005 0.000 0.13
Zn 8805 0.012 0.002 0.008 0.000 0.010 0.001 0.010 0.001 0.08
Cu 6608 0.003 0.000 0.003 0.000 0.003 0.000 0.004 0.001 0.45
Cu 8701 0.002 0.000 0.002 0.000 0.002 0.000 0.002 0.000 0.52
Cu 0705 0.004 0.000 0.003 0.000 0.003 0.000 0.004 0.000 0.61
Cu 8708 0.003 0.000 0.003 0.000 0.003 0.000 0.003 0.000 0.84
Cu 8801 0.002 0.000 0.002 0.000 0.002 0.000 0.002 0.000 0.19
Cu 6805 0.003 0.000 0.003 0.000 0.003 0.000 0.003 0.000 0.74

156
Table 49. Mean nutrient content (X) of deer fecal matter collected on study units at National
Red Dirt Wildlife Management Preserve. Natchitoches Parish, Louisiana (n * 10 composite
samples per study unit oar collection period); 1986 - 1908 (continued)._________________Pellet _______________________Study Unit
Collection Cl C2 T1 T2Nit Date X s.e. X s.e. X s.e. X s.e. P>F
Co 8608 0.0004 0.0002 0.0011 0.0008 0.0005 0.0002 0.0002 0.0000 0.53
Co 8701 0.0001 0.0001 0.0000 0.0000 0.0008 0.0006 0.0001 0.0000 0.26
Co 8705 0.0012 0.0004 0.0011 0.0007 0.0009 0.0003 0.0017 0.0011 0.84
Co 8708 “0.0006 0.0001 0.0002 0.0000 0.0003 0.0001 0.0003 0.0000 0.01
Co 8801 0.0001 0.0000 0.0000 0.0000 0.0001 0.0000 0.0000 0.0000 0.20
Co 8805 0.0016 0.0007 0.0003 0.0001 0.0019 0.0005 0.0024 0.0012 0.30
iNt * Nutrient.
" significant difference a t the 0.05 alpha level with Duncan's Lest.

157
Table 50. Mean body weights (kg) or male and female white-tailed deer harvested on study
units at National Red Dirt Wildlife Management Preserve, Natchitoches Parish, Louisiana;
198 6 - 1989.
Study UnitAge Cl C2 T1 T2
Year Category Meanis.e. n Meanis.e. n Meanis.e. n Meanis.e. n P>FM ales;1986 0.5 3 0.5 ±1.2 3 28.0 1 24.614.0 3 29.011.1 5 0.37
1.5 48.611.8 11 46.311.2 7 48.312.0 13 46.711.2 13 0.75
2.5 55.9*3.4 5 61.215.2 3 55.713.8 7 62.911.8 6 0.34
23.5 61.2 1 — 0 75.3 1 70.5113.4 2 0.88
1987 0.5 — 0 29.3H .5 3 28.1 1 — 0 0.72
1.5 48.411.4 14 50.614.0 6 51.311.2 12 51.310.5 2 0.61
2.5 57.611.8 5 62.715.5 6 67.5*2.4 5 68.0 1 0.38
23.5 76.313.8 3 79.4 1 — 0 66.215.0 2 0.31
1988 0.5 25.4 1 25.513.1 4 25.912.9 4 24.9 1 1.00
1.5 47.511.5 10 46.411.3 10 47.511.4 17 50.811.3 5 0.46
2.5 71.412.0 2 64.114.0 9 65.216.5 4 58.111.4 3 0.62
23.5 75.3 1 75.714.4 5 63.518.5 3 62.6 1 0.50
1989 0.5 23.9H .2 11 25.111.0 7 23.3H .2 13 27.610.5 3 0.31
1.5 43.511.0 8 43.910.8 9 42.811.3 8 42.712.0 3 0.87
2.5 58.112.4 4 60.215.7 2 61.612.5 2 55.314.0 4 0.69
23.5 70.218.9 2 59.815.3 5 — 0 — 0 0.35

158
fable 50. Mean body weights (kg) of male and female white-tailed deer harvested on study
units a t National Red Dirt Wildlife Management Preserve, Natchitoches Parish, Louisiana;
1986 - 1989 (continued).
Studv UnitAge Cl _C2_ T1 T2
Year Cateoorv Meanis.e. n Meanis.e. n Meanis.e. n Meanis.e. p P>FFem alas:1986 0.5 27.0±1.6 2 27.4*2.0 2 0 26.4*0.8 3 0.88
1.5 40.4*1.4 2 37.6 1 40.5*1.5 3 43.5*2.7 2 0.46
2.5 46.3 1 44.5*0.9 2 54.0 1 48.1*2.7 3 0.40
>3.5 45.8±2.3 2 38.6*2.3 2 — 0 49.2*2.9 2 0.12
1987 0.5 22.9 ±2.0 6 26.8*1.8 2 29.0 1 — 0 0.38
1.5 4 1 .2±1.8 6 47.5*1.3 3 38.1*1.8 3 44.5 1 0.06
2.5 44.8±1.9 5 54.4 1 51.7 1 — 0 0.18
>3.5 50.6*7.0 2 45.4 1 52.2*1.9 5 49.9*1.8 2 0.72
1988 0.5 25.5±1.3 3 21.9*0.9 3 27.2 1 27.2 1 0.15
1.5 42.4±0.7 2 *32.4*0.2 2 — 0 40.8 1 0.01
2.5 46.3 1 — 0 — 0 — 0 —
>3.5 48.1*1.4 3 41.3*2.6 5 43.0*2.1 6 45.0*2.0 3 0.29
1989 0.5 21.9*0.8 12 22.5*1.3 5 22.0*2.4 6 21.1*1.1 4 0.96
1.5 — 0 35.8*0.7 7 36.4 1 40.9 1 0.10
2.5 43.4*1.8 6 39.8*1.1 3 40.7*1.5 9 42.6*1.4 3 0.52
>3.5 41.7*3.2 5 40.5*1.4 11 43.5*1.5 5 42.4*1.0 4 0.71
* significant difference at 0.05 alpha level with Duncan's test.

159
Table 51. (lean humerus length (cm) of male and female white-tailed deer harvested on study
units a t National Red Dirt Wildlife Management Preserve, Natchitoches Parish, Louisiana;
1906-1909.
Study UnitDeer C1 C2 T1 T2
YearAge
(vrs)Mean
Lenath ±s,e. nMean
Lenath is .e . n .Mean
Lenath is .e . nMean
Lenath is .e . n Pr>F
H ales1906;
in©
22.3±0.3 3 22.0 1 20.710.7 3 2 1 .810.2 5 0.10
1.5 25.910.5 11 25.610.5 7 25.910.4 13 25.210.3 13 0.45
2.5 27.210.2 5 27.310.3 3 26.710.4 7 27.510.4 6 0.42
23.5 20.0 1 — 0 29.0 1 26.511.5 2 0.71
1907: 0.5 — 0 22.710.9 3 24.0 1 — 0 0.53
1.5 26.610.4 14 26.010.6 6 26.210.3 12 28.011.0 2 0.34
2.5 27.010.9 5 27.010.7 6 27.610.5 5 27.0 1 0.87
23.5 29.710.7 3 28.0 1 — 0 29.010.0 2 0.41
1900: 0.5 23.0 1 22.511.0 4 21.810.5 4 21.0 1 0.72
1.5 26.710.5 10 26.310.3 10 26.910.3 17 26.610.5 5 0.62
2.5 29.011.0 2 28.310.6 9 29.810.5 4 29.010.6 3 0.50
23.5 30.0 1 29.210.2 5 29.310.9 3 29.0 1 0.87
1909: 0.5 22.410.4 11 22.610.3 7 22.510.5 13 21.711.5 3 0.82
1.5 26.110.6 0 26.210.4 9 27.111.0 8 26.310.9 3 0.76
2.5 28.010.6 4 29.011.0 2 28.011.0 2 28.810.8 4 0.89
23.5 20.012.0 2 27.811.0 5 — 0 — 0 0.92

160
Table 51. Mean humerus length (cm) of male and female white-tailed deer harvested on study
units a t National Red Dirt Wildlife Management Preserve, Natchitoches Parish, Louisiana;
1986-1989 (continued).
Study UnitDeer Cl C2 T1 T2Age
Year (vrs)Mean
Lenath is .e . pMean
Lenath is .e t hMean
Lenath is .e . nMean
Lenath is .e . n Pr>F
Females:1986: 0.5 21.510.5 2 21.010.0 2 0 21.710.3 3 0.46
1.5 23.5±0.5 2 23.0 1 23.310.7 3 25.011.0 2 0.44
2.5 25.0 1 24.510.5 2 25.0 1 24.310.9 3 0.95
13.5 24.510.5 2 24.010.0 2 — 0 24.011.0 2 0.83
1987: 0.5 20.3±0.6 6 21.510.5 2 22.0 1 — 0 0.38
1.5 25.010.6 6 26.011.5 3 25.010.6 3 24.0 1 0.78
2.5 25.210.4 5 25.0 1 27.0 1 — 0 0.24
43.5 27.011.0 2 24.0 1 26.410.4 5 25.510.5 2 0.15
1988: 0.5 21.310.9 3 21.010.0 3 22.0 1 22.0 1 0.80
1.5 26.010.0 2 24.510.5 2 — 0 27.0 1 0.10
2.5 26.0 1 — 0 — 0 — 0 —
43.5 26.310.9 3 25.010.3 5 25.310.3 6 25.310.9 3 0.42
1989: 0.5 21.210.4 12 20.410.2 5 21.310.9 6 21.010.4 4 0.67
1.5 — 0 24.610.3 7 24.0 1 25.0 1 0.68
2.5 25.310.9 6 24.311.2 3 25.410.5 9 25.011.0 3 0.83
43.5 25.410.5 5 24.810.4 11 25.010.6 5 25.810.6 4 0.60

161
Table 52. Mean number of antler points on male white-tailed deer harvested on study units at
National Red Dirt Wildlife Management Preserve, Natchitoches Parish, Louisiana; 1966-1989.
________________________ StudY Wt_________________________Deer Cl C2 T1 T2Age Mean Mean Mean Mean
YfilC (yC5?__*Pts±s.».____q__ #P tsls .e . n »P tsls.e ,____ n »Pts±s.e.____ q__ Pr>F
1986; 0.5 — 3 — 1 — 3 — 5 —
1.5 4.510.6 11 3.410.7 7 3.010.4 13 3.610.4 13 0.55
2.5 5.610.7 5 7.710.3 3 5.710.7 7 7 .3 i0 .4 6 0.11
13.5 6.0 1 — 0 8.0 1 9.013.0 2 0.87
1987: 0.5 — 0 — 3 — 1 — 0
1.5 3.310.5 14 4.510.6 6 3.710.5 12 2.010.0 2 0.28
2.5 6.010.6 5 7.810.8 6 7.610.4 5 5.0 1 0.16
23.5 6.710.9 3 9.0 1 — 0 8.510.5 2 0.31
1988; 0.5 — 1 — 4 — 4 — 1 —
1.5 3.210.5 10 3.110.4 10 3.910.4 17 4 .0H .0 5 0.51
2.5 8.011.0 2 7.110.7 9 7.010.7 4 6.310.3 3 0.80
23.5 8.0 1 7.810.5 5 7 .7 i0 .3 3 6.0 1 0.43
1989: 0.5 — 11 — 7 — 13 — . 3
1.5 3.610.4 8 4.110.5 9 2.910.4 8 4 .0H .2 3 0.32
2.5 7.010.4 4 6.011.0 2 6.510.5 2 6.510.5 4 0.69
23.5 9.012.0 2 6.211.1 5 — 0 — 0 0.25

162
Table 53. Mean antler scores of male white-tailed deer harvested on study units a t National
Red Dirt Wildlife Management Preserve, Natchitoches Parish, Louisiana; 1986-1989.
StMdyUnitDeer Cl C2 T1 T2Age
Year (vrs)Mean
Score ± s.e. nMean
Score * s.e. nMean
Score * s.e. nMean
Score * s.e. n Pr>F
1986: 0.5 3 1 3 5 0.29
1.5 09.3±13.1 I t 82.4* 8.7 7 81.6* 6.0 13 66.5* 5.9 13 0.91
2.5 128.0*22.4 5 218.7*24.1 3 150.6*25.3 7 192.0*11.6 6 0.08
13.5 199.0 1 — 0 279.0 1 222.0*86.0 2 0.90
1987: 0.5 — 0 — 3 — 1 — 0 1.00
1.5 74.4* 5.6 14 90.5*16.2 6 80.8* 6.3 12 73.5*5.5 2 0.61
2.5 157.8*16.8 5 193.0*16.1 6 190.2*20.3 5 173.0 1 0.51
13.5 225.0±30.0 3 316.0 1 — 0 222.0*4.0 2 0.29
1988: 0.5 — 1 — 4 — 4 — 1 —
1.5 71.2± 8.4 10 72.9* 7.0 10 82.7* 7.9 17 95.4*11.9 5 0.38
2.5 258.0±45.0 2 197.7*20.5 9 199.0*23.1 4 149.3* 5.2 3 0.23
13.5 253.0 1 236.0* 9.9 5 215.0*50.5 3 204.0 1 0.87
1989: 0.5 — 11 — 7 — 13 — 3 —
1.5 86.5± 7.6 8 86.4* 7.8 9 73.1*11.1 8 86.3*12.4 3 0.67
2.5 184.8*10.0 4 201.0*24.0 2 181.5*25.5 2 184.0* 6.5 4 0.81
13.5 247.5*66.5 2 188.8*29.6 5 — 0 __ 0 0.38

163
Table 54. Mean number or corpora lutea In ovaries of female white-tailed deer harvested
on study units at National Red Dirt Wildlife Management Preserve. Natchitoches Parish.
Louisiana; 1986-1986.
Study UnitDeer C1 C2 Tt T2
YearAge
(vrs)Mean No.
C.L.“ nMean No.
C.L.“ nMean No.
CL." nMean No.
C.L.* n Pr>F
1986: 0.5 0.0 2 0.0 2 — 0 0.0 3 —
1.5 1.0 2 1.0 1 0.7 3 1.5 2 0.88
2.5 3.0 1 2.0 2 2.0 1 1.7 3 0.29
23.5 1.5 2 2.0 2 — 0 2.0 2 0.47
1987: 0.5 0.0 6 0.0 2 0.0 1 — 0 —
1.5 1.5 6 0.7 3 1.3 3 0.0 1 0.34
2.5 1.2 5 0.0 1 0.0 1 — 0 0.49
23.5 2.0 1 2.0 1 2.0 5 1.0 2 0.29
1988: 0.5 0.0 3 0.3 3 0.0 1 0.0 1 0.75
1.5 1.0 2 2.0 2 — 0 2.0 1 0.62
2.5 2.0 1 — 0 — 0 — 0 —
23.5 2.0 3 1.4 5 1.8 6 1.7 3 0.53
“CL. - corpora lutea.

164
Table 55. Fawns/adult doe ( 2 2.5-years-otd) harvested on study units a t National Red Dirt
WildllFe Management Preserve, Natchitoches Parish, Louisiana; 1986 - 1988.
Study Unit_______________ Chi-squareVeer Cl C2 T1 T2 Test Probability
1986:
Fawns/Doe 1.67 0.75 3.00 1.60 0.50 <P 10.70
Number of Fawns 5 3 3 8
Number of Does 3 4 1 5
1987:
Fawns/Doe 0.86 2.50 0.33 — 0.30 < P 1 0.50
Number of Fawns 6 5 2 0
Number of Does 7 2 6 2
1988:
Fawns/Doe 1.00 1.40 0.83 0.67 P >0.95
Number of Fawns 4 7 5 2
Number of Does 4 5 6 3
1989:
Fawns/Doe 2.09 0.86 1.36 1.00 0.80 < P 10.90
Number of Fawns 23 12 19 7
Number of Does 11 14 14 7

165
Table 56. Comparison or various reproduction parameters of white-tailed deer harvested on
study units a t National Red Dirt Wildlife Management Preserve, Natchitoches Parish,
Louisiana; 1986 - 1988.
Reproduction ___________ Study Unit__________ Chi-squarePrfflwtor Year______________Cl C2 II 12____________ Rwvi.ta
1986 Frequency of Fertilization 33X 25X OX 20X P > 0.95
No. of Pregnant AdulL Females 1 1 0 1
No. of AdulL Females 3 4 1 5
1987 Frequency of Fertilization OX OX 17X OX 0.90 < P i 0.95
No. of Pregnant Adult Females 0 0 1 0
No. of Adult Females 7 2 6 2
1988 Frequency of Fertilization 25X 20X OX OX 0.90 < P s 0.95
No. of Pregnant Adult Females 1 1 0 0
No. of Adult Females A 5 6 3
1986 Reproductive Rate 2 2 0 2 P>0.50
Total No. of Embryos 2 2 0 2
No. of Pregnant Adult Females 1 1 0 1
1987 Reproductive Rate 0 0 1 0 P>0.70
Total No. of Embryos 0 0 1 0
No. of Pregnant Adult Females 0 0 1 0
1988 Reproductive Rate 1 1 0 0 P»0.70
Total No. of Embryos 1 1 0 0
No. of Pregnant Adult Females 1 1 0 0

166
Table 56. Comparison or various reproduction parameters of white-tailed deer harvested on
study units a t National Red Dirt Wildlife Management Preserve, Natchitoches Parish,
Louisiana; 1986- 1988 (continued).
Reproduction Parameter and Year C1
Study Unit C2 T1 T2
Chi-square Test Results
1986 Ovulation Rate 2 2 — 2 —
Total No. C.L.1 in Pregnant Does 2 2 — 2
No. of Pregnant Adult Females 1 1 0 1
1967 Ovulation Rate — — 2 — —
Total No. C.L.1 |n Pregnant Does — — 2 —
No. of Pregnant Adult Females 0 0 1 0
1988 Ovulation Rate 2 2 — — —
Total No. C.L.1 jn Pregnant Does 2 2 — —
No. of Pregnant Adult Females 1 1 0 0
1986 Reproductive Efficiency 1007! 1009! 09! 1007! P>0.95
Total No. of Embryos 2 2 0 2
Total No. C.L.1 jn Pregnant Does 2 2 0 2
1987 Reproductive Efficiency 07! 07! SOTS 07! P»0.95
Total No. of Embryos 0 0 1 0
Total No. C.L.1 ;n Pregnant Does 0 0 2 0
1986 Reproductive Efficiency 507! 5071 07! 071 P>0.95
Total No. of Embryos 1 1 0 0
Total No. C.L.1 in Pregnant Does 2 2 0 0
I d . - corpora lutoa.

167
Table 57. Length and weight of white-tailed deer embryos collected from female deer
harvested on study units a t National Red Dirt Wildlife Management Preserve.
Natchitoches Parish, Louisians; 1986 - 1988.
YearStudyUnit
No. of Pregnant
DoesNo. of
Embrvos
Length of Embryos
(mm)
W t.ofEmbryos
(a)
1986: C1 1 2 11 0.2011 0.20
C2 1 2 8 0.109 0.10
T1 0 0 — —
T2 1 2 1 0.001 0.00
1987: Cl 0 0 — —
C2 0 0 — —
T1 1 1 18 3.70
T2 0 0 — —
1968: Cl t 1 3 0.10
C2 1 1 3 0.10
T1 0
A
0
A
— —

168
Table 58. Mean kill-times of hunters on study units during deer-hunting season at National
Red Dirt Wildlife Management Preserve, Natchitoches Parish, Louisiana; 1986 - 1989.
___________________________ Study Unit___________________________Cl C2 U _____ T 2 ___
Mean No. Hours Mean No. Hours Mean No. Hours Mean No. HoursHunted/Successful Hunted/Successful Hunted/Successful Hunted/Successful
Hunter Before Hunter Before Hunter Before Hunter Before Making a Kill Making a Kill Making a Kill Making a Kill
Date_______#Hrs. ts .e . n *Hrs. ±s.e. n #Hrs. ts .e . n #Hrs. ±s.e. n P>F1906:Bucks Onlv
8 Nov. Sat 2.5 0.3 4 1.5 1.0 2 1.9 0.4 9 2.3 0.6 11 0.82
9 Nov, Sun 1.5 0.5 2 a— 0 — 0 1.6 0.2 4 0.80
10 Nov, Mon 2.2 0.2 2 1.9 1.4 2 2.0 1 2.0 1 0.99
11 Nov, Tue — 0 2.0 1 2.6 1.4 2 3.5 1 0.88
12 Nov. Wed — 0 2.0 1 2.0 1 — 0 —
13 Nov, Thu — 0 — 0 1.0 1 — 0 —
14 Nov, Fri 3.0 1 2.0 1 ---------- 0 — 0 —
15 Nov, Sat 2.1 0.3 4 2.0 1 2.2 0.2 2 2.3 0.7 4 0.99
16 Nov, Sun 3.2 1 1.0 1 — 0 — 0 —
Eilher-Sex
28 Nov, Fri 2.0 0.3 4 4.1 1.3 5 2.0 0.6 7 2.0 0.4 8 0.15
29 Nov, Sat 1.4 0.6 4 2.0 0.0 2 2.2 0.8 2 1.2 0.2 4 0.49
6 Dec, Sat 3.1 0.5 4 3.0 0.5 2 1.5 0.3 3 2.2 0.0 2 0.08
7 Dec. Sun
Season Ave:
2JL
2.3 0.2
1
2.6 0.4
0
2.0 0.2
0 2 A
2.1 0.2
1
0.46

Table 58. Mean kill-times or hunters on study units during deer-hunting season a t National
Red Dirt Wildlife Management Preserve, Natchitoches Parish, Louisiana; 1986 - 1989
(continued).
__________________________Study Unit___________________________ Cl C2 D __ 12__
Mean No. Hours Mean No. Hours Mean No. Hours Mean No. Hours Hunted/Successful Hunted/Successfut Hunted/Successful Hunted/Successful
Hunter Before Hunter BeforeMaking a Kill Making a Kill
Date *Hrs. ±s.e. n *Hrs. ±s.e. n1987:Bucks Only
7 Nov. Sat 1.5 0.5 2 1.8 0.3 6
8 Nov, Sun 1.6 0.5 6 1.8 0.2 2
13 Nov. Fri 1.6 1.4 2 6.0 1
14 Nov. Sat 1.4 0.1 2 "4.0 1.0 2
15 Nov, Sun 1.5 1 2.5 1
Ellher-Sex
27 Nov. Fri 2.3 0.2 16 2.1 0.6 2
28 Nov. Sat 2.1 0.7 7 3.2 0.9 6
29 Nov, Sun 2.2 0.2 2 2.0 1.5 2
5 Dec, Sat 1.5 1 1.8 1
6 Dec, Sun I f i 0.2 2 0
Season Ave: 2.0 0.2 2.6 0.3
Hunter Before Hunter Before Making a Kill Making a Kill
*Hrs. ±s.e. n #Hrs. ts .e . n P>F
2.4 0.8 8 —— 0 0.68
1.8 0.7 3 0.8 0.7 2 0.79
3.3 0.8 3 — 0 0.24
0.5 1 2.3 0.2 3 0.05
— 0 — 0 —
2.0 0.3 4 2.2 0.2 2 0.95
2.8 0.5 5 — 0 0.60
3.9 0.1 2 — 0 0.38
2.5 0.0 2
A
3.5 1
A
—
2.5 0.3
V
2.1 0.3
U
0.23

170
Table 56. Mean kill-times of hunters on study units during deer-hunting season at National
Red Dirt Wildlife Management Preserve, Natchitoches Parish, Louisiana; 1986 - 1989
(continued).
___________________________ Study Unit___________________________Cl C2 T1 T2
Mean No. Hours Mean No. Hours Mean No. Hours Mean No. Hours Hunted/Successful Hunted/Successful Hunted/Successful Hunted/Successful
Hunter Before Hunter Before Hunter Before Hunter BeforeMaking a Kill Making a Kill Making a Kill Making a Kill
Date •Hrs. ±s.e. n •Hrs. is .e . n •Hr s. ±s.e. p •Hrs. ±s.e. n P>F1988:Bucks Onlv
5 Nov, Sat 2.7 0.6 6 2.6 0.4 11 3.3 0.8 8 2.5 1.0 3 0.82
6 Nov, Sun — 0 1.4 0.2 5 1.5 0.3 6 1.8 1 0.85
11 Nov, Fri 2.0 1 — 0 2.2 0.5 6 1.2 0.2 2 0.61
12 Nov. Sat 1.2 0.2 2 1.8 0.7 3 1.2 0.8 2 1.0 1 0.88
13 Nov, Sun 0.5 1 3.2 1 1.0 1 1.5 1 —
Either-Sex
25 Nov, Fri 2.1 0.6 3 2.3 0.4 9 1.8 0.4 5 2.4 1.4 5 0.93
26 Nov, Sat . — 0 1.0 1 1.5 0.0 2 — 0 —
27 Nov, Sun 1.8 0.1 4
oin*
1 3.5 1.0 2 1.5 1 0.05
3 Dec, Sat 3.1 0.1 3 2.0 1.0 3 2.6 1 2.0 1 0.73
4 Dec, Sun 2J I 0.4 3 2 0 0.0 4 *3.1 0.1 2 zzz. 0 0.03
Season Ave: 2.2 0.2 2.2 0.2 2.3 0.3 2.0 0.5 0.89

171
Table 58. Mean kill-times or hunters on study units during deer-hunting season a t National
Red Dirt Wildlife Management Preserve, Natchitoches Parish, Louisiana; 1986 - 1989
(continued).
Studv UnitCl C2 T1 T2
Mean No. Hours Hunted/Successful
Hunter Before Makina a Kill
Date *Hrs. ±s.e. n
Mean No. Hours Hunted/Successful
Hunter Before Makina a Kill
#Hrs. ±s.e. n •
Mean No. Hours Hunted/Successful
Hunter Before Makina a Kill
'Hrs. ±s.e. n
Mean No. Hours Hunted/Successful
Hunter Before Makina a Kill
#Hrs. ±s.e. n P>F1989:Youth Hunt
28 Oct, Sat 2.5 1.0 2 — 0 — 0 2.0 1.0 2 0.76
29 Oct, Sun — 0 — 0 2.0 1 0.5 1 —
Elther-Sex
18 Nov, Sat 2.4 0.2 21 2.9 0.3 23 2.1 0.2 21 2.4 0.6 11 0.32
19 Nov, Sun 1.7 0.3 12 2.2 0.3 13 2.2 0.3 7 1.0 0.3 3 0.11
24 Nov, Fri 3.3 1.0 6 2.6 0.3 10 2.8 0.6 6 4.5 1.9 3 0.43
25 Nov, Sat 1.2 0.2 5 3.8 2.2 3 2.4 0.4 4 2.6 0.9 2 0.30
26 Nov, Sun 2.0 1.0 2 — o 1.5 0.5 4 — 0 0.62
Black Powder
2 Dec, Sat — 0 — 0 3.0 1 — 0 —
3 Dec, Sun — 0 — o — 0 — 0
Season Ave: 2.2 0.2 48 2.7 0.2 49 2.2 0.2 44 2.4 0.4 22 0.26
a denotes no deer were killed.
"significant difference at 0.05 alpha level with Duncan's test.

172
Table 59. Hunter efforts / killed deer on study units at National Red Dirt Wildlife Management
Preserve, Natchitoches Parish, Louisiana; t986-1989.
Hunting Study Unit____________________ Chi-squareDate____________ C]__________ £2__________ 13___________T2 Test Probability fPl
1986:
8 Nov, Sal 25.2 37.0 10.4 8.2 P i 0.001
9 Nov, Sun 38.5 M_____ — 15.8 P £0.01
10 Nov. Mon 15.5 6.0 28.0 15.0 P £0.01
11 Nov, Tue — 5.0 21.5 17.0 P i0 .01
12 Nov. Wed — 16.0 18.0 — 0.70 < P i 0.80
13 Nov. Thu — — 15.0 — —
14 Nov. Fri 31.0 23.0 — — 0.20 < P i 0.30
15 Nov. Sat 7.2 32.0 29.5------- 9.2 P i 0.001
16 Nov, Sun 32.0 30.0 — — 0.70 < P £ 0.80
Either-Sex
28 Nov. Fri 28.0 17.4 16.7 10.9 P £ 0.05
29 Nov. Sat 27.0 34.5 40.5 14.5 P £ 0.01
6 Dec, Sat 17.0 13.0 17.0 5.5 0.05 < P S 0.10
7 Dec, Sun 54.0 — — 10.0 P £ 0.001
Season Ave: 26.2 25.2 23.5 12.6 0.10 < P £ 0.20

173
Table 59. Hunter efforts I killed deer on study units at National Red Dirt Wildlife Management
Preserve, Natchitoches Parish, Louisiana; 19B6-1989 (continued).
Hunting Study Unit____________- Chi-squareDate Cl C2 T1 T2 Test Probability (P
1987:
Bucks Onlv
7 Nov. Sat 51.0 8.5 12.9 P i 0.001
8 Nov, Sun 12.0 23.5 23.3 16.0 0.10 < P £0.20
13 Nov, Fri 17.0 27.0 15.3 — 0.10 < P £0.20
14 Nov, Sat 22.0 15.5 65.0 8.0 P £ 0.001
15 Nov, Sun 48.0 21.0 — — P £ 0.01
Either-Sex
27 Nov, Fri 5.9 15.5 30.8 22.5 P£ 0.001
28 Nov, Sat 13.3 5.8 25.4 — P £ 0.01
29 Nov, Sun 42.5 16.5 45.0 — P £ 0.001
5 Dec, Sat 35.0 11.0 26.0 29.0 P £0.01
6 Dec, Sun 11.5 — — — —
Season Ave: 15.4 13.1 26.5 39.9 P £ 0.001

174
Table 59. Hunter efforts / killed deer on study units a t National Red Dirt Wildlife Management
Preserve, Natchitoches Parish, Louisiana; 1986-1989 (continued).
Hunting Study Unit_________________ Chi-squareDfllfi_____________£]___________C2__________ D ___________ T2 Test Probability (P)
1988:
Pyck? Only.
5 Nov, Sat 10.0 7.3 11.6 14.0 0.50 < P i
6 Nov, Sun — 8.4 12.8 42.0 P i 0.001
11 Nov, Fri 31.0 — 9.2 15.5 P i 0.01
12 Nov, Sat 24.5 14.3 32.5 36.0 P i 0.02
13 Nov, Sun 43.0 41.0 63.0 34.0 P i 0.02
Eilher-Sex
25 Nov, Fri 26.7 7.3 26.6 12.6 P i 0 .01
26 Nov, Sat — 55.0 53.5 — 0.80 < P i
27 Nov, Sun 13.5 56.0 41.5 41.0 P i 0.001
3 Dec, Sat 11.3 15.7 66.0 38.0 P i 0.001
4 Dec, Sun 9.0 12.0 16.0 — 0.30 < P i
Season Ave: 21.7 13.2 22.1 25.5 0.20 < P i

175
Table 59. Hunter efforts / killed deer on study units at National Red Dirt Wildlife Management
Preserve, Natchitoches Parish, Louisiana; 1986-1989 (continued).
Hunting Sbudv Unit Chi-squareDate Cl C2 T1 T2 Test ProbsbifiLv (P)
1989:
Youth Hunt
28 Oct. Sat 10.5 4.0 0.05 <P 10.10
29 Oct. Sun — — 13.0 6.0 —
Either Sex
18 Nov. Sat 5.5 6.0 4.9 6.9 0.90 < P i 0.95
19 Nov. Sun 9.8 9.9 8.6 22.7 P i 0.02
24 Nov, Fri 20.0 12.0 11.0 24.3 0 . 0 5 < P i 0.10
25 Nov. Sat' 21.4 54.3 11.8 30.0 P i 0.01
26 Nov. Sun 39.0 — 9.5 — P i 0.01
Black Powder
2 Dec, Sat --- __ 3.0 ------- -------
3 Dec, Sun — — — — —
Season Ave: 12.0 13.7 7.9 16.6 0.30 < P i 0.50
"Denotes no deer were killed.

Table 60. Ratio of number of unsuccessful hunters not seeing deer: number of unsuccessful
hunters seeing deer on the study units at National Red Dirt Wildlife Management Preserve,
Natchitoches Parish, Louisiana; 1986-1969.
Hunting Studv Unit Chi-squareDate Cl C2 T1 T2 Test Probability (P)
1986:
Bucks Onlv
8 Nov, Sat 3.1 6.5 3.7 3.4 0.50 < P i 0.70
9 Nov. Sun 3.2 4.5 4.3 7.4 0.50 < P i 0.70
10 Nov, Mon 8.7 10.1 13.5 » ______ 0.50 < P i 0.70
11 Nov, Tue 5.3 2.0 4.7 16.0 P £ 0.01
12 Nov, Wed 4.8 7.0 3.2 13.0 P i 0.05
13 Nov, Thu 7.0 4.3 3.6 3.1 0.50 < P 1 0.70
14 Nov, Fri 2.S 2.6 8.5 2.7 0.05 < P i 0.10
15 Nov, Sat 2.8 3.9 3.9 1.9 0.80 < P i 0.90
16 Nov, Sun 10.3 7.2 12.5 5.4 0.30 < P 1 0.50
Either Sex
28 Nov, Fri 9.7 6.2 8.4 8.7 0.80 < P i 0.90
29 Nov, Sat 6.1 22.3 8.8 27.0 P i 0.01
6 Dec, Sat 6.4 12.0 4.4 — 0.10 < P i 0.20
7 Dec, Sun 6.6 25.0 27.0 4.5 P iO.OI
Season Ave: 5.9 8.7 8.2 8.5 0.80 < P 10.90

177
Table 60. Ratio or number of unsuccessful hunters not seeing deer: number of unsuccessful
hunters seeing deer on the study units at National Red Dirt Wildlife Management Preserve,
Natchitoches Parish, Louisiana: 1986-1989 (continued).
Hunting Study_Unit__________________ Chi-square(M i____________£J________ 02___________ IJ_________ 12_______ Test Probability (P?
1987:
Bucks Only
7 Nov, Sat 3.8 3.0 3.3 4.5 0.90 < P 4 0.95
8 Nov, Sun 9.4 11.2 5.2 5.0 0.20 < P 4 0.30
13 Nov, Fri 2.7 4.3 3.3 4.8 0.80 * P 4 0.90
14 Nov, Sat 3.5 3.6 3.4 21.0 P 4 0.01
15 Nov, Sun 6.7 5.0 21.5 3.1 P 4 0.01
Either Sex
27 Nov. Fri 4.4 14.5 6.3 7.2 0.05 < P 4 0.10
28 Nov, Sat 9.6 3.6 7.2 4.9 0.30 < P 4 0.50
29 Nov, Sun 41.5 — 88.0 13.0 P 4 0.01
5 Dec, Sat 6.8 3.3 16.7 5.6 P 4 0.01
6 Dec, Sun — 14.0 24.0 — 0.10 < P 4 0.20
Season Ave: 9.8 6.9 17.9 7.7 0.05 < P 4 0.10

178
Table 60. Ratio of number of unsuccessful hunters not seeing deer: number of unsuccessful
hunters seeing deer on the study units a t National Red Dirt Wildlife Management Preserve,
Natchitoches Parish, Louisiana; 1986-1909 (continued).
Hunting Study Unit__________________ Chi-squareDate Cl C2 T1 T2 Test Probability (Pi
1988:
Sucks Only
5 Nov, Sat 2.2 3.8 3.2 3.0 0.90 < P 1 0.95
6 Nov. Sun 5.2 6.2 4.7 3.4 0.80 < P 10.90
11 Nov, Fri 6.0 4.4 7.0 4.8 0.80 < P 1 0.90
12 Nov. Sat 11.8 6.7 7.9 8.8 0.50 < P 1 0.70
13 Nov, Sun 14.4 9.7 11.7 10.0 0.70 < P 1 0.80
Either Sex
25 Nov, Fri 8.6 8.1 9.1 5.8 0.80 < P 1 0.90
26 Nov, Sat 65.0 10.8 21.0 — P i 0.01
27 Nov, Sun 25.0 9.2 40.5 8.0 P 10.01
3 Dec, Sat 7.8 11.0 16.2 18.5 0.10 <P 10.20
4 Dec, Sun 3.4 4.4 7.5 1.9 0.20 < P 1 0.30
Season Ave: 14.9 7.4 12.9 7.1 0.20 < P 1 0.30

179
Table 60. Ratio or number or unsuccessrul hunters not seeing deer: number or unsuccessrul
hunters seeing deer on the study units a t National Red Dirt Wildltre Management Preserve,
Natchitoches Parish, Louisiana; 1966-1989 (continued).
Hunting Studv Unit Chi-squareDate Cl C2 T1 T2 Test Probabilitv (P)
1989:
Youth Hunt
28 Oct, Sat 6.3 6.0 4.0 4.0 0.80 < P < 0.90
29 Oct, Sun 2.2 2.5 4.0 4.0 0.80 < P S 0.90
Either Sex
18 Nov, Sat 7.2 4.1 5.7 3.9 0.70 < P i 0.80
19 Nov. Sun 4.8 10.0 11.6 10.6 0.30 < P i 0.50
24 Nov, Fri 8.1 6.4 6.9 5.5 0.90 < P i 0.95
25 Nov. Sat 12.8 13.0 11.4 14.3 P > 0.95
26 Nov, Sun 25.3 29.0 103.0 34.0 P i 0.01
Black Powder
2 Dec, Sat ___ . 2.0 «M * « a i------
3 Dec, Sun — — — ---------- —
Season Ave: 7.6 7.9 9.4 6.2 0.80 < P i 0.90
"Denotes no deer were seen.

180
Table 61. Ratio of number of unsuccessful hunters not shooting at deer: number of
unsuccessful hunters shooting a t deer on the study units at National Red Dirt Wildlife
Management Preserve, Natchitoches Parish, Louisiana; 1966-1989.
Hunting___________ ______________ Study Unit_____________ Chi-squareDate________________C]________ C2________B ________12________ Test Probability (P)
1986:
Bucks Only
8 Nov, Sat 32.3 24.0 28.3 26.3 0.70 < P i 0.80
9 Nov, Sun 75.0 45.0 78.0 59.0 P i 0.02
10 Nov, Mon M
11 Nov, Tue 32.0 — 42.0 16.0 P i 0.01
12 Nov, Wed — 14.0 16.0 — 0.70 < P i 0.80
13 Nov, Thu 42.0 — — 22.0 P i 0.02
14 Nov, Fri — 13.0 — 8.0 0.20 < P i 0.30
15 Nov, Sat 12.5 27.0 23.5 14.5 0.05 < P i 0.10
16 Nov, Sun
Either Sex
31.0 29.0 25.0 27.0 0.80 < P i 0.90
28 Nov. Fri 53.5 81.0 54.5 78.0 P i 0.05
29 Nov, Sat 34.7 67.0 79.0 54.0 P i 0.01
6 Dec. Sat 64.0 24.0 48.0 9.0 P i 0.01
7 Dec, Sun 53.0 — 27.0 — P i 0.01
Season Ave: 42.8 46.5 45.7 34.8 0.50 < P i 0.70

181
Table 61. Ratio or number or unsuccessrul hunters not shooting at deer: number or
unsuccessrul hunters shooting at deer on the study units at National Red Dirt Wildltre
Management Preserve, Natchitoches Parish, Louisiana; 1906-1989 (continued).
Hunting Study Unit__________________ Chi-squareBsiS_______________ £J________ C2________T_1__ T2 Test Probability (P)
1987;
Bucks Only
7 Nov, Sat 33.3 45.0 45.0 27.0 0.05 < P 4 0.10
8 Nov, Sun 66.0 45.0 67.0 30.0 P i 0.01
13 Nov. Fri 32.0 26.0 43.0 19.0 P t 0.02
14 Nov, Sat 42.0 29.0 32.0 21.0 0.05 < P i 0.10
15 Nov, Sun 47.0 20.0 43.0 28.0 P i 0.01
Either Sex •
27 Nov, Fri 39.5 29.0 59.5 43.0 P i 0.02
28 Nov. Sat 86.0 29.0 61.0 39.0 P i 0.01
29 Nov, Sun 83.0 — 88.0 — 0.70 < P i 0.80
5 Dec, Sat 34.0 10.0 25.0 28.0 P i 0.01
6 Dec, Sun 21.0 — 24.0 23.0 0.90 < P i 0.95
Season Ave: 45.4 34.8 47.7 31.1 0.10 < P i 0.20

182
Table 61. Ratio of number of unsuccessful hunters not shooting a t deer: number of
unsuccessful hunters shooting at deer on the study units at National Red Dirt Wildlife
Management Preserve, Natchitoches Parish, Louisiana; 1956-1989 (continued).
HuntingDate Cl
Studv Unit C2 T1 T2
Chi-square Test Probabilitv (P)
1988:
Bucks Onlv
5 Nov, Sat 18.0 34.5 42.5 39.0 P 1 0.02
6 Nov, Sun 57.0 37.0 35.5 41.0 0.05 < P i 0.10
11 Nov, Fri 30.0 22.0 24.5 29.0 0.50 < P l 0.70
12 Nov. Sat — 40.0 63.0 35.0 P i 0.01
13 Nov, Sun 29.0 — — 24.0 0.30 < P 1 0.50
Either Sex
25 Nov, Fri 38.5 28.5 21.3 29.0 0.10 < P i 0.20
26 Nov, Sat 65.0 27.0 52.5 34.0 P 10.01
27 Nov, Sun 50.0 55.0 81.0 40.0 P i 0.01
3 Dec, Sat 31.0 44.0 32.5 37.0 0.30 < P 1 0.50
4 Dec, Sun 24.0 44.0 — 21.0 P 10.01
Season Ave: 38.7 36.9 42.0 32.5 0.70 < P 1 0.80

183
Table 61. Ratio or number of unsuccessrul hunters not shooting a t deer: number or
unsuccessrul hunters shooting a t deer on the study units at National Red Dirt Wlldltre
Management Preserve, Natchitoches Parish, Louisiana; 1986-1989 (continued).
Hunting Date _ _ Cl
Study Unit C2 T1 T2
Chi-square Test Probability (P)
1989:
Youth Hunt
28 Oct, Sat 19.0 4.0 16.0 P i 0.01
29 Oct, Sun 6.5 5.0 — 12.0 0.10 < P i 0.20
Either Sex
18 Nov, Sal 18.8 21.7 19.0 16.2 0.80 < P i 0.90
19 Nov, Sun 52.5 35.0 58.0 13.2 P i 0.01
24 Nov, Fri 28.5 29.0 13.8 20.0 0.05 < P i 0.10
25 Nov, Sat 17.0 — 32.0 43.0 P i 0.01
26 Nov, Sun 38.0 — — 34.0 0.50 < P i 0.70
Black Powder
2 Dec, Sat ——— — -r — ,-, _ _ _
3 Dec, Sun — — -------- ---- —
Season Ave: 24.0 42.9 28.2 18.9 P i 0.02
* Denotes no shooting at deer.

VITA
Kenneth Dale Dancak was born in Austin, Texas, on 22 May 1952. He graduated from
Crockett High School, Austin, Texas in 1970 and from Southwest Texas State University,
San Marcos, Texas in 1974 with a Bachelor of Science Degree in General Biology. After a
stint In the United States Marine Corps from 1975 to 1977, he attended Texas Tech
University, Lubbock, Texas from 1979 to 19B1 where he studied Range and Wildlife
Management. He entered Louisiana State University. Baton Rouge, Louisiana In 19B2 and
earned a Master of Science degree in Wildlife Management in December 1984. In January
1985, he initiated his Ph.D. study at Louisiana State University, Baton Rouge, Louisiana and
he is currently a candidate for a Doctor of Philosophy degree in Wildlife and Fisheries
Science.
184

DOCTORAL EXAMINATION AND DISSERTATION REPORT
Candidate: Kenneth Dale Dancak
Major Field: Wildlife and Fisheries Science
Title o f Dissertation: EFFECTS OF FOOD PLOTS ON SELECTED GROWTH PARAMETERS, PRODUCTIVITY, AND HARVESTING OF WHITE-TAILED DEER IN A NATIONAL FOREST
Approved:
Major Professor and Chairman
Dean of the Graduate
EXAM INING COMMITTEE:
f~ odju' 1̂ . KV.fe
Date of Examination:
22 March 1990