effects of financial aid differentiation on college … capstone_2011 formated as policy... ·...
TRANSCRIPT
Securing
Tennessee’s
Future
Effects of Financial Aid
Differentiation on First-
Year Retention in Private
Colleges in Tennessee

Wilburn & McMillian, 2012
Effects of Financial Aid Differentiation on First-Year Retention in Private Colleges in Tennessee
James Wilburn
Reynard Trea McMillian
Vanderbilt University
Peabody College of Education and Human Development
Doctoral Capstone Project
May 2012
Wilburn & McMillian, 2012
Table of Contents Executive Summary ........................................................................................................................ 7
Introduction ..................................................................................................................................... 9
Problem Statement ...................................................................................................................... 9
Project Question #1 ............................................................................................................... 10
Project Question #2 ............................................................................................................... 10
Project Question #3 ............................................................................................................... 10
Project Question #1 ....................................................................................................................... 12
Modification to Project Question #1 ......................................................................................... 12
Conceptual Framework for Project Question #1 ....................................................................... 13
Methods to Address Project Question #1 .................................................................................. 15
Data Source: The TICUA Database .......................................................................................... 19
Variables Used to Construct the Data Set ................................................................................. 21
Variables Used to Construct the Independent Variables and Conduct the Analysis ................ 24
Control Variables Used in the Analysis .................................................................................... 43
Limitations of the Data Analysis for Project Question 1 .......................................................... 46
Presentation of Findings for Project Question #1 ..................................................................... 49
Summary for Project Question #1 ............................................................................................. 55
Project Question #2 ....................................................................................................................... 59
Conceptual Framework for Project Question #2 ....................................................................... 59
Methods to Address Project Question #2 .................................................................................. 62
Empirical Data Description ....................................................................................................... 65
The Data Collection Instruments: The Survey and Interview Protocol .................................... 65
Limitations of the Data Analysis ............................................................................................... 66
Project Question #3 ....................................................................................................................... 73
Conclusions ................................................................................................................................... 86
Recommendations and Suggestions .............................................................................................. 88
References ................................................................................................................................... 122
Wilburn & McMillian, 2012
List of Figures
Figure 1 Four, Five, and Six-Year Graduation Rates for Students Attending TICUA Member
Schools—2001 Freshman Cohort ................................................................................................. 26
Figure 2 Sources of Grant Aid Provided to Students Attending Private Colleges and Universities
....................................................................................................................................................... 27
Figure 3 Institutional Aid Provided to Students Attending TICUA Colleges and Universities
2007 to 2009 (US Dollars) ............................................................................................................ 28
Figure 4 Annual Amount of Financial Aid (non-loan) Awarded to Freshman Attending TICUA
Member Schools from 2007 to 2009 ............................................................................................ 31
Figure 5 Annual Amount of Financial Aid (total) Awarded to Freshman Attending TICUA
Member Schools from 2007 to 2009 ............................................................................................ 37
Figure 6 Student Loans for Students Attending TICUA Colleges and Universities 2007 to 2009
(US Dollars) .................................................................................................................................. 39
Figure 7 Total Costs of Attending TICUA Member Schools from 2007 to 2009 ........................ 42
Figure 8 Undergraduate Enrollments by Ethnicity for Students Attending TICUA Member
Schools 2007-2009........................................................................................................................ 44
Figure 9 Undergraduate Enrollments by Gender for Students Attending TICUA Member Schools
2007-2009 ..................................................................................................................................... 45
Figure 10 Logistics Regression Graph Predicting Student Retention for Students Attending
TICUA Member Schools from 2007 to 2009 ............................................................................... 52
Figure 11 Logistics Regression Graph Predicting Student Retention for Students Receiving
TELS Financial Awards from 2007 to 2009 ................................................................................. 53
Figure 12 Polynomial Regression Graph to Identify the “Tipping Point” for Institutional Aid
Awards 2007 to 2009 .................................................................................................................... 55
Figure 13 Percentage Growth in Mean Family Income by Quintile in Constant 2009 Dollars,
1979-1989, 1989-1999, and 1999-2009 ........................................................................................ 60
Figure 14 – Mean TOTAID by Cohort ......................................................................................... 68
Figure 15 Number of Years in Which Retention Aid Exceeded Enrollment Aid ........................ 70

Wilburn & McMillian, 2012
List of Tables
Table 1 Federal Pell Grant Awards to TICUA Students............................................................... 95
Table 2 HOPE Scholarship to TICUA Students ........................................................................... 95
Table 3 General Assembly Merits Scholarship (GAMS) to TICUA Students ............................. 95
Table 4 HOPE Aspire Awards to TICUA Students ...................................................................... 96
Table 5 Tennessee Student Assistance Award (TSAAG) to TICUA Students ............................ 96
Table 6 Annual Freshman Institutional Aid .................................................................................. 97
Table 7 Annual Tuition and Fees .................................................................................................. 98
Table 8 Freshman Full-time Enrollment Trends ........................................................................... 99
Table 9 Freshman First Year Retention Trends .......................................................................... 100
Table 10 Annual Freshman Financial Aid (Without Loans) ...................................................... 101
Table 11 Total Annual Freshman Financial Aid......................................................................... 102
Table 12 Total Annual Cost of Attendance ................................................................................ 103
Table 13 Annual Freshman Institutional Aid as a ...................................................................... 104
Table 14 Annual Freshman Financial Aid as a Percentage of Total Cost of Attendance ........... 105
Table 15 Amount of Financial Aid Awarded to TICUA Students 2007 to 2009 ....................... 106
Table 16 Logistic Regression of Freshman First Year Retention and Institutional Aid, Loan Free
Aid, and Total Aid Awards ......................................................................................................... 106
Table 17 – Polynomial Regression To Identify a “Tipping Point” in Institutional Aid ............. 107
Table 18 Summary of Financial Aid Variables by Semester by Institution Cohort 2007 .......... 108
Table 19 Summary of Financial Aid Variables per Semester by Institution Cohort 2008 ......... 109
Table 20 Summary of Financial Aid Variables per Semester by Institution Cohort 2009 ......... 110
Table 21 Total Financial Aid (TOTALAID) One-Sample Test ................................................. 111
Table 22 No Loan Aid (FREEAID) One-Sample Test ............................................................... 111
Table 23 Institutional Aid One-Sample Test .............................................................................. 112
Table 24 Tinamou College Dependent T-Test ............................................................................ 112
Table 25 Maleo University Dependent T-Test ........................................................................... 113
Table 26 Swan University Dependent T-Test ............................................................................. 113
Table 27 Grebe College Dependent T-Test ................................................................................ 113
Table 28 Pelican College Dependent T-Test .............................................................................. 114
Table 29 Osprey University Dependent T-Test .......................................................................... 114
Table 30 Quail University Dependent T-Test ............................................................................. 114
Table 31 Rail University Dependent T-Test ............................................................................... 115
Table 32 Sungrebe University Dependent T-Test ...................................................................... 115
Table 33 Hawk University Dependent T-Test ............................................................................ 115
Table 34 Ostrich College Dependent T-Test .............................................................................. 116
Table 35 Pintail Dependent T-Test ............................................................................................. 116
Table 36 Stork University Dependent T-Test ............................................................................. 116
Table 37 Finfoot College Dependent T-Test .............................................................................. 117
Table 38 Crane University Dependent T-Test ............................................................................ 117
Wilburn & McMillian, 2012
Table 39 Penguin University Dependent T-Test ........................................................................ 117
Table 40 Condor University Dependent T-Test .......................................................................... 118
Table 41 Eagle College Dependent T-Test ................................................................................. 118
Table 42 Flamingo University Dependent T-Test ...................................................................... 118
Table 43 Emu College Dependent T-Test .................................................................................. 119
Table 44 Falcon College Dependent T-Test ............................................................................... 119
Table 45 Albatross: University of the South Dependent T-Test................................................. 119
Table 46 Petrel University Dependent T-Test ............................................................................ 120
Table 46 Grouse College Dependent T-Test .............................................................................. 120
Table 48 Heron College Dependent T-Test ................................................................................ 120
Table 49Kiwi University Dependent T-Test............................................................................... 121
Table 50 Linear Regression for Institutional Aid and Minority, Gender, ACT, and 1st Year GPA
for Students Retained and Receiving TELS Awards .................................................................. 121

Wilburn & McMillian, 2012
Executive Summary
The ultimate goal of U.S. financial aid policy is to ensure that academically capable
students are able to earn a college degree independent of financial considerations (Duffy and
Goldberg, 1998). An uncertain US economy, changing demographics, and changes in federal
and state financial aid policies have lead budget-strapped universities to develop innovative
strategies that allocate limited funds to financial aid programs designed to increase enrollment as
well as retention. This capstone project is aimed at answering three questions related to the
influence of financial aid on retention at TICUA member colleges and universities.
1. From the perspective of the students and their families, is there a certain grant/scholarship
aid amount that serves as the tipping point for enrollment and or retention?
Findings:
An institutional aid package of 75% of the sticker price has the greatest effect in
predicting student reenrollment.
For students receiving TELs awards, the analysis found that an institutional aid package
of 68% of the has the greatest effect in predicting student reenrollment.
No tipping point was found for no-loan or total aid packages including loans.
2. Do campus aid programs favor recruiting new students or retaining current students?
Findings:
Of the 26 TICUA member institutions that participated in the study, 19 had at least one
year in which they awarded more financial aid to returning students in comparison to
newly enrolled students.
Six TICUA member institutions had no preference for retention over enrollment
Seven TICUA member institutions favored retention over enrollment for 1 of the 3 years
examined.
Six TICUA member institutions favored retention over enrollment for 3 of the 3 years
examined.
Seven TICUA member institutions favored retention over enrollment for all 3 years
examined.

Wilburn & McMillian, 2012
3. If aid is used as a recruiting/retention tool, what factors are used to determine which
students are more attractive and deserving of an enhanced aid package (i.e. what leveraging
strategies are used)?
Findings:
Of the four factors examined, Minority Status, ACT score, and first-year college GPA
had positive relationships with institutional aid packages.
Of those examined, ACT score has the strongest relationship with institutional aid.
Wilburn & McMillian, 2012
Introduction
In 1956, the precursor of the Tennessee Independent Colleges and Universities
Association (TICUA) was established to promote better cooperation among private institutions
throughout the state of Tennessee. TICUA engages Tennessee's private colleges and universities
to work collaboratively in areas of public policy, cost containment, and professional
development to serve better the state and its citizens. Located in Nashville, the Association
counts among its membership each independent, non-profit, regionally accredited college and
university in Tennessee with a traditional arts and science curriculum. TICUA's 34 member
colleges and universities educate nearly 76,000 students from across the State, country, and
throughout the world.
In the spirit of the ongoing collaborative work of TICUA, recent inquiries from multiple
institutions belonging to TICUA have generated this project on the “best practices” for college
choice and retention of the member institutions. Specifically, are any member institutions using
any identifiable financial aid practices to increase enrollment and retention at their respective
institutions?
Problem Statement
Limited financial resources have placed pressure on campuses to ensure that they serve
students to the best of their abilities. The rise of proprietary institutions purports to offer access
to postsecondary education at the convenience of the student in terms of location, access on-line,
part-time study, range of degrees, time of day of classes and length of programs. Private
businesses and companies have begun to invest in their own employees’ education by training
them on-site for increased responsibilities and new positions. Private non-profit colleges have

Wilburn & McMillian, 2012
traditionally competed against public institutions in the tuition arena and now face an even
greater challenge as more students and their families make decisions about college attendance
based on cost. Given this increasingly competitive market of higher education, private
institutions of higher education are examining what role campus financial aid policies, practice
and procedures play in college choice. Moreover, what impetus encourages students (with
family input) to attend member institutions and to persist at the respective institutions?
The intent of this capstone project is to provide additional information and insight to the
following project questions:
Project Question #1: From the perspective of the students and their families, is there a certain
grant/scholarship aid amount that serves as the tipping point for enrollment and or retention?
Project Question #2: Do campus aid programs favor recruiting new students or retaining
current students?
Project Question #3: If aid is used as a recruiting/retention tool, what factors are used to
determine which students are more attractive and deserving of an enhanced aid package (i.e.
what leveraging strategies are used)?

Wilburn & McMillian, 2012
The results of this project have both immediate and long-term impacts to policy decisions
involving resource allocation and college student enrollment and retention for TICUA member
schools. For the immediate future, this study will provide insight as to what financial aid
practices are most effective and what areas require modification. In the long-term, results from
this study will allow the TICUA administration to more effectively advise state and campus
financial aid policy makers on best practices in marketing strategy, financial resourcing, and aid
program design among private institutions throughout the state of Tennessee. The next section of
the project report introduces the conceptual framework and overview of findings from theory and
research related to the three project questions.

Wilburn & McMillian, 2012
Project Question #1
“From the perspective of the students and their families, is there a certain grant/scholarship aid
amount that serves as the tipping point for retention?”
Modification to Project Question #1
It is important to note that project question number one was modified from the original
project question posited by TICUA in the introduction section of this report. This modification
includes the removal of “enrollment” in the analysis to find a financial aid tipping point. There
are several justifications for this modification. First, the TICUA database provided no
information on a student enrollment comparison group. A student’s decision to enroll in a
particular college is influenced by a number of different factors, many of which are not known
by college administrators seeking to establish a method of predicting enrollment option outcomes
for their respective school. One of these factors is the information on students choosing not to
enroll. Not all colleges collect information on student choosing not to attend but those that do
collect information do so only for the students to whom they offered aid and collect little
information about the students' options beyond the name of the college they actually enrolled.
The TICUA database includes no information on students choosing not to attend a TICUA
school. As such, there was no comparison group for enrollment at the individual student level.
Another reason to omit the analysis on enrollment was the absence of data on student
alternatives and options. The TICUA database does not include data on what other schools were
examined by students in the selection process. Nor does it include data on financial aid offers
made by other schools. Arguably a qualitative data collection methodology could have been use
by the capstone team to gather this information at the individual student level; however, the
capstone team was restricted to interactions with TICUA member school administrators. For
Wilburn & McMillian, 2012
these reasons, the capstone team determined that an analysis of the influence of financial aid on
enrollment could not responsibly or appropriately be made and modified the question to address
only financial aid’s influence on retention.
Conceptual Framework for Project Question #1
The impact of financial factors on student persistence remains a critical issue for many
colleges and universities in the United States. This issue exists because attrition or dropout rates
remain at unacceptable levels – for students, families, elected representatives, media, employers,
and institutions of higher learning (Braunstein, McGrath and Pescatrice, 2001). According to
Tinto (1993), attrition negatively impacts some institutions more than it does others, because
some rely heavily on tuition and fees to support academic programs, physical plant and student
services.
Overall, there is an increased need for research on how changes in financial aid packages
affect student's decisions to remain enrolled in college (DesJardins, Ahlburg, and McCall,
2002). Lack of research in this area is somewhat surprising given the interest in experimentation
with preferential packaging (offering different combinations of grant aid and self-help to
applicants with the same level of financial need) to attract students (Ehrenberg 2000). An
improved understanding of the retention effects of different types and packages of aid is
necessary given the changes in the "mix" of financial aid distribution (an increasing dependency
on loans), changes in financial aid policies by federal and state governments, and movement by
some institutions to a "high tuition/high aid" or "targeted" aid policy.
Wilburn & McMillian, 2012
Because of the accountability movement in higher education (Banta and Borden 1994;
Layzell 1999) financial aid officers are increasingly using financial aid to help improve retention
efforts. New forms of institutional scholarships that are renewable (rather than frontloaded) have
been devised to improve retention (DesJardins, Ahlburg, and McCall, 2002).
Previous research on the relationship of financial assistance and student retention has
important implications to this project. A meta-analysis of 31 studies found financial aid to have a
small, but significant, positive effect on student persistence, enabling lower-income students to
persist at a rate roughly equal to that of middle- and upper-income students. As students
progressed toward graduation, the amount of financial aid and unmet need became more
important discriminators than types of financial aid (Murdock, Nix-Mayer, & Tsui, 1995).
Although several studies on student persistence and attrition exist, researcher Vincent
Tinto’s (1975, 1982, 1993 & 1997) contributions to understanding why students leave college is
widely regarded as the most comprehensive. His work in developing the “revised attrition model
(1993)” has been instrumental in providing higher-education administrators and researchers a
construct upon which to introduce/develop new theories of college student decision-making and
develop innovative programs addressing student attrition. Accordingly, the contributions of key
scholars are reviewed below in a discussion of student attrition theory.
Tinto emphasized the economic theory of cost benefit, echoing Bean’s concept of
“utility” (Bean, 1985) which holds the proposition that a student will withdraw from college
whenever the time, effort, and money spent attending college can be better invested elsewhere.
Research has shown that financial aid in the form of grant and scholarships increases the
probability of college enrollment (Catsiapis, 1987), particularly among African American and
White applicants (Jackson, 1990). Loans, on the other hand, do not. Realizing this trend, several
Wilburn & McMillian, 2012
college and universities are adopting “need blind/no loan” financial aid program in which
students admitted have all of their demonstrated financial need met through grant or loan.
In spite of the paradigmatic nature of Tinto’s theory it has faced continued scrutiny as
researchers look to validate its assumptions. Braxton, Hirschy and McClendon (2004) posited
that the role of social integration in the departure decision making process surpassed that of
academic integration at residential colleges. Further, Braxton et. al proposed a revision to
Tinto’s interactionalist model by adding six influences on social integration – institutional
commitment to the welfare of the student, institutional integrity, communal potential, ability to
pay, proactive social adjustment, and psychosocial engagement. Of particular importance to this
paper is the role that the ability to pay plays in the departure process for students attending
TICUA member schools.
In light of the growing interest in student enrollment and retention, TICUA member colleges
and universities are searching for the most effective use of limited resources that lead to
increased student access, enrollment, ability to pay for higher education, and completion. In the
next section the capstone team attempts to answer project question #1 within the context of the
theory and research highlighted in the conceptual framework.
Methods to Address Project Question #1
The underlying assumption inherent within guiding question #1 is that student retention is
affected by financial aid. The empirical strategy to address this question is to examine this
relationship(s) between these variables using quantitative analysis. The dependent variable for
this analysis is retention at the individual student level. The independent variable, or the variable
Wilburn & McMillian, 2012
hypothesized to influence changes in the dependent variable, is financial aid. Financial aid,
however, comes in many different forms as we will discuss in the data section below. For the
purpose of this project, the project team has identified three financial aid constructs to be used as
independent variables. These financial aid variables are the total amount of institutional aid
received by the student (INSTAID), the total amount of “no-loan” aid received by the student
(FREEAID), and the total amount of aid including loans received by the student (TOTAID). All
three independent variables are calculated at the individual student level and are converted to
constant 2009 dollars using the consumer price index (CPI) provided by the Bureau of Labor
Statistics to insure the data analysis performed in this project does not simply model inflation.
A financial aid award expressed in dollars at one school, however, may have a very
different impact to a student’s ability to pay for college in comparison to another student at a
different school receiving the same dollar amount. For this reason, the independent variables
identified in this report (PINSAID, PFREEAID, and PTOTAID) are expressed as a percentage of
the total cost of attendance (STICKER) for the respective school. This method mirrors student
aid award descriptions used by the College Board in their annual Trends in Higher Education
Series. The resulting independent variables are expressed as PINSAID, PFREEAID, and
PTOTAID.
The three independent variables used in this analysis were examined for multi-
collinearity. Multi-collinearity refers to a situation in which two or more explanatory variables in
a multiple-regression model are highly linearly related. As such, the project team was concerned
about the effects of multi-collinear relationships and its impacts to the predictive power of a
multiple regression analysis that included two or more of these variables. Results from
collinearity diagnostics conducted during the regression analysis resulted in a tolerance of 0.548
Wilburn & McMillian, 2012
and VIF of 1.821 for PINSAID, a tolerance of 0.343 and VIF of 2.919 for PFREEAID, and a
tolerance of 0.442 and 2.264 for PTOTAID. As a general rule, tolerances less than or equal to
0.10 or VIF statistics greater than 10 are indicators of extreme multi-collinearity (Ethignton,
Thomas, and Pike, 2002). In the case of all three of the independent variables, therefore,
collinearity was not an issue. The researchers also examined the control variables and found no
issue with multi-collinear (MINORITY, 0.938, VIF 1.066; GENDER, 0.994, VIF 1.006; ACT,
0.822, VIF 1.217).
The simplest statistical approach to address project question #1 is to assess the
association of the dependent and independent variables through correlation analysis at the level
of the individual student. Correlations, however, only show how much two variables “co-relate”
in a linear fashion. A more appropriate statistical procedure is one that models the asymmetry
between the independent and the dependent variable. For this reason, linear regression is used to
examine the influence of the three financial aid variables on student retention and the regression
coefficient obtained for each type of aid is interpreted as an indicator of the strength of the
influential effect. But aid is correlated with many background characteristics that have their own
influence on retention, and omitting these variables from the regression produces a biased
estimate of the influential effect. We attempt to eliminate this source of bias by controlling for
observable characteristics that are correlated with aid and retention such as race (Ikenberry and
Hartle, 1998; Lillis, 2008; St. John and Starkey, 1995), gender (Perna, 2002; Paulsen, 2001), and
ACT/SAT scores (Munday, 1967; Rothstein, 2004).
As will be discussed in the next section, academic preparation/performance (SAT/ACT)
data was only available for TICUA students receiving Tennessee Education Lottery Scholarship
(TELS) awards. Prior studies have shown a relationship between academic

Wilburn & McMillian, 2012
preparation/performance and student retention (Munday, 1967; Rothstein, 2004) so it was
important to ensure that this variable was included in the analysis. Eliminating students without
this data, however, creates a sampling bias and reduces the size of the sample significantly. For
this reason, the capstone team decided to conduct separate regression analysis on each of the two
sample group – 1) The complete sample with no control for academic preparation/performance
and 2) the students receiving TELS awards. These groups are labeled “All TICUA Students”
and “Students Receiving TELS Awards” respectively.
To assess the influence of the various financial aid packages on student retention at the
individual level, the project team used logistic regression. Logistic regression requires a binary
dependent variable – a categorical variable with two categories. These are coded 0/1 and
indicate if a condition is or is not present, or if an event did or did not occur. In this case, the
dependent variable is retention (RETAINED). As described in the data description section
below, a full-time freshman is assigned to one of two groups depending upon whether or they did
(1) or did not (0) return for their sophomore year in college.
Logistic regression uses the independent variables (PINSAID, PFREEAID, and
PTOTAID) to estimate the likelihood of occurrence of one of the categories of the dependent
variable. A detailed description of how these independent variables were constructed is provided
in the next section. Logistic regression has the same advantages as linear regression, including
the ability to construct multivariate models and include control variables – GENDER,
MINORITY, SAT, ACT. The output of the logistic regression will help the project team
understand the chances that a student will or will not return for their sophomore year, and the
impact that a one-unit change in the financial aid package will have on the likelihood of that
event occurring. To account for the net or independent effects of the independent variables on

Wilburn & McMillian, 2012
each other, one regression analysis for each of the two sample groups was conducted in which all
the independent variables were included. This also allowed for a direct comparison of the
regression coefficients as an indicator of the strength of the relationship to the dependent
variable.
Central to the analysis conducted to answer project question #1 is the identification of a
specific amount of financial aid awarded to a student that serves as a “tipping point” in their
decision stay enrolled at a TICUA member school. Hence, the capstone team is challenged to
identify an amount of aid beyond which any further aid results in a diminishing effect on student
retention. To identify this specific amount, the capstone team used a statistical technique called
polynomial regression. A polynomial regression is a form of linear regression that fits a non-
linear relationship between the independent variable (financial aid) and the corresponding
conditional value of the dependent variable (retention). The resulting curve estimation from this
regression is used to identify if a “tipping point” exists. This amount of aid, from a statistical
stand point, will have the greatest predictive power in determining whether a student is retained
at a TICUA member school.
Data Source: The TICUA Database
In 2004, the presidents of the private colleges and universities within the state of
Tennessee agreed to allow the Tennessee Independent Colleges and Universities Association
(TICUA) to collect enrollment data from each of their institutions and report data relating to the
Tennessee Education Lottery Scholarship (TELS) award recipients to the Tennessee Higher
Education Commission (THEC). Although not all students benefit from TELS, all students are

Wilburn & McMillian, 2012
included in the enrollment reports to TICUA. The data provided by each of the TICUA members
is used to meet reporting requirements for TELS and is used to highlight key trends and
important policy issues facing private colleges and universities.
TICUA maintains this database of student level information with the assistance of
member institutions providing updated information three times per year (fall, spring, summer) as
part of the enrollment and completions reporting cycle. Enrollment and financial aid information
on every student (undergraduate, graduate, and first-professional) attending a TICUA institution
is collected. Each student attending a TICUA member institution is given a unique identifying
number (TICUAID) that is cross checked at the institution and at TICUA to ensure a duplicate
record does not exist. TICUA also uses a data checking program to ensure the quality of data
collection and facilitate the reporting process.
TICUA verifies student personal data with their financial aid information to ensure complete
data sets for each student and each institution. Of the thirty-five TICUA member schools,
twenty-seven provided complete data sets to the TICUA database without missing variables
required for this study. TICUA then removed the students’ street addresses and social security
numbers before providing us with an analysis file with the enrollment and financial aid data. In
order to protect the confidentiality of students, we had no direct access to the students’ identities.
The TICUA database is made up of forty-eight variables reported by its member colleges and
universities. Of the forty-eight variables that make up the TICUA database, six (TERM,
SLEVEL, STATUS, AGE, REGTYPE, YEAR) were used to construct the data set and six
(INSAID, FEDAID, STAAID, PCAID, TOTLOAN, STICKER) were used to create the three
independent variables (PINSAID, PFREEAID, PTOTALAID). The dependent variable,
Wilburn & McMillian, 2012
RETAINED, is a binary variable as mentioned in the methods section. These variables are
discussed in greater detail below.
Variables Used to Construct the Data Set
Out of the 205,184 individual data entries for students enrolled at TICUA member schools
over the three years 2007, 2008, and 2009, we selected a sample of 25,171 students (43.8%
Male, 56.2% Female; 72.1% White, 27.9% Minority; Age 18.3+/-.4 yrs.) using the following
criteria: registered in the fall (TERM=1), as a freshman (SLEVEL =1), full time (STATUS =F),
traditional students (AGE<26), first-time enrolled at the institution (REGTYPE=1).
1. Registration Term (TERM) - This variable identifies the term for which the student is
registered – fall, spring, or summer. For the purpose of this project only applicants registering in
the fall were considered for two reasons. First, many of the financial aid awards programs such
as the Hope scholarship distribute annual awards and require continuous enrollment in a degree
program beginning in the fall semester of the award year. Including students in the sample who
enrolled later in the year that were not eligible for some forms of aid offered to other TICUA
students would adversely affect the external validity of the results. Second, students that enroll
in the fall tend to consist primarily of traditional students. First-time enrollments in the spring or
summer term tend to be nontraditional/transfer students whose background characteristics differ
distinctly from traditional students (Bean and Metzner, 1983, Stewart and Rue, 1983).
2. Student Level (SLEVEL) - This variable indicates the student’s academic level at the
respective institution. If a student is working toward a degree at the reporting institution, the
Wilburn & McMillian, 2012
individual is classified according to the level or progress within that program and according to
the institutional definition. These levels include freshman, sophomore, junior, senior, 5th
year, or
undergraduate special. In addition to these undergraduate levels, graduate and professional levels
are also included in this data element.
The challenge of attracting and retaining a freshman class is one of the greatest challenges
facing a college or university. Freshman class attrition rates are typically greater than any other
academic year and are commonly as high as 20-30% (Mallinckrodt and Sedlacek, 1987). The
purpose of this project was to examine the effect of financial aid on freshman enrollment and
retention. For this reason, this project limited its analysis to students enrolled as freshmen at a
TICUA college or university. Data on sophomore students was also utilized only to determine if
the student was a returning freshman. Good rationales for the criteria you previously listed.
3. Student Enrollment Status (STATUS) – This variable describes whether a student is
considered full-time or part time. TICUA member schools identify the status of each student by
coding them as an “F” for full-time or “P” for part-time. All of the TICUA member schools
participating in this study identify a student enrolled in 12 or more semester credit hours as full-
time. In 2009, 82% of undergraduates attending a TICUA member school were enrolled full-
time. This study included only students enrolled full-time at their respective college or
university. Although some financial award programs (HOPE, PELL) have pro-rated award
schedules for part time students, several programs require students to be enrolled full time to be
considered for aid. Including students who were enrolled part-time and were not eligible for
some forms of aid offered to other TICUA students in the sample would adversely affect the
external validity of the results.

Wilburn & McMillian, 2012
4. Traditional Students (AGE < 26) - Also, this project attempts to examine the effects of
financial aid on retention. To increase the generalizability of this project’s findings to the largest
population within TICUA member schools (traditional undergraduate students enrolled full-
time), non- traditional students were excluded. TICUA defines “non-traditional” students as
student older than 25 years of age. Research has shown that sensitivities to financial aid awards
are different for traditional and non-traditional students (Bean and Metzner, 1985; Stewart and
Rue, 1983). In, 2009, non-traditional students comprised 18% of the headcount at TICUA
colleges and universities and were more likely than traditional students to study part-time
(TICUA, 2009).
5. Type of Student Registration (REGTYPE) - This element is used to describe the current
registration status of the student. The types of enrollment statuses include first-time freshman,
transfer student, or transient student. A first-time freshman is a student who has not been
previously enrolled (first-time college student) for work creditable toward a bachelor’s or
associate degree or certificate in any college, university, or technical institute since they
graduated from high school, but who is now enrolled for work creditable toward such a degree.
A transfer student is a student who last attended another institution from which credit is
acceptable toward the degree or certificate in progress by the student. A transient student is a
student who is regularly enrolled and in good standing at an institution other than the reporting
institution and who is taking a course(s) at the reporting institution which he/she intends to
transfer to his/her regular institution.
The TICUA database does identify the institution from which a student transferred or is
enrolled while in a transient status. However, financial aid information for that institution is
available only if that institution is a TICUA member. In the case where a student transferred or

Wilburn & McMillian, 2012
was registered at a non-TICUA member school, a gap in the database exists. For this reason, this
project included first-time freshmen only and does not include transient students or transfer
students.
6. Academic Year (YEAR) - This variable identifies the year for which the student is
registered. As stated earlier, the TICUA began collecting student data from its member
institutions in 2004. As with many newly instated data collection processes, there were some
issues in obtaining complete and accurate information in earlier years. For this reason, data
collected for 2004, 2005, and 2006 was not used for this project. Similarly, 2010 data collection
was not completed at the time data was collected for this project. This project examines the
TICUA database for the years 2007, 2008 and 2009. There was no attempt by the research team
to account for the possible variation by year in the influence of financial aid on retention. A
more detailed description of how this impacts the project is described in the limitations section
for project question #1.
Variables Used to Construct the Independent Variables and Conduct the Analysis
The analysis conducted to answer project question #1 consists of one dependent variable
(RETAINED) and three independent variables (PINSAID, PFREEAID, and PTOTAID). These
three independent variables were created using six database variables provided by TICUA. The
mathematical equations describing each of the independent variables are:
PINSAID = INSAID/STICKER
PFREEAID = (INSAID+FEDAID+STAAID+PCAID)/STICKER
PTOTAID = (FREEAID+TOTLOAN)/STICKER
Wilburn & McMillian, 2012
Detailed description of the dependent variable, independent variables, and TICUA database
variables used to construct the independent variables are described in greater detail within this
section.
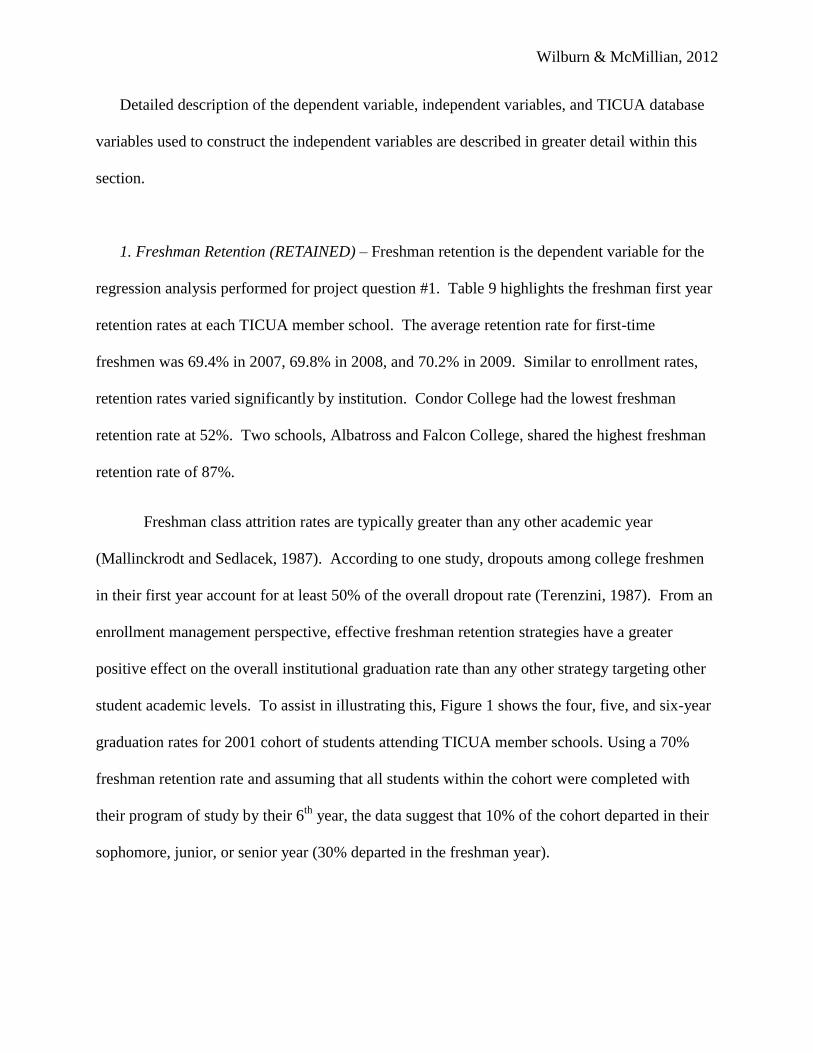
1. Freshman Retention (RETAINED) – Freshman retention is the dependent variable for the
regression analysis performed for project question #1. Table 9 highlights the freshman first year
retention rates at each TICUA member school. The average retention rate for first-time
freshmen was 69.4% in 2007, 69.8% in 2008, and 70.2% in 2009. Similar to enrollment rates,
retention rates varied significantly by institution. Condor College had the lowest freshman
retention rate at 52%. Two schools, Albatross and Falcon College, shared the highest freshman
retention rate of 87%.
Freshman class attrition rates are typically greater than any other academic year
(Mallinckrodt and Sedlacek, 1987). According to one study, dropouts among college freshmen
in their first year account for at least 50% of the overall dropout rate (Terenzini, 1987). From an
enrollment management perspective, effective freshman retention strategies have a greater
positive effect on the overall institutional graduation rate than any other strategy targeting other
student academic levels. To assist in illustrating this, Figure 1 shows the four, five, and six-year
graduation rates for 2001 cohort of students attending TICUA member schools. Using a 70%
freshman retention rate and assuming that all students within the cohort were completed with
their program of study by their 6th
year, the data suggest that 10% of the cohort departed in their
sophomore, junior, or senior year (30% departed in the freshman year).

Wilburn & McMillian, 2012
Figure 1 Four, Five, and Six-Year Graduation Rates for Students Attending TICUA
Member Schools—2001 Freshman Cohort
Data Source: US Department of Education, National Center for Education Statistics, Integrated
Postsecondary Education Data Systems (IPEDS) “Graduation Rate” survey, 2007
As stated in the project question #1 methods description, student persistence is a
dependent variable to be used in a logistic regression. Logistic regression requires binary
dependent variables. When constructing binary variables, an important concern is that the
categories are mutually exclusive – a case cannot be in more than one category at the same time.
To account for student persistence at the individual level, a binary variable (RETAINED) was
created in the TICUA data set and used for the logistic regression analysis highlighted in table
16. At the individual student level, freshmen who returned for their sophomore year were coded
as a “1.” Those students who departed prior to the beginning of their sophomore year were
coded as a “0.”
2. Institutional Aid (PINSAID/INSAID) – This independent variable identifies the financial
aid awarded to a student from the college or university. This includes all types of institutional
Wilburn & McMillian, 2012
grants and scholarships from institutional funds, tuition waivers, and institutional work-study
(outside of the federal work-study program). This definition of institutional aid corresponds with
the definition of institutional aid used by the by the Department of Education’s National Center
for Education Statistics (NCES, 2011) with one exception – institutional loans are not included
as institutional aid in the TICUA database.
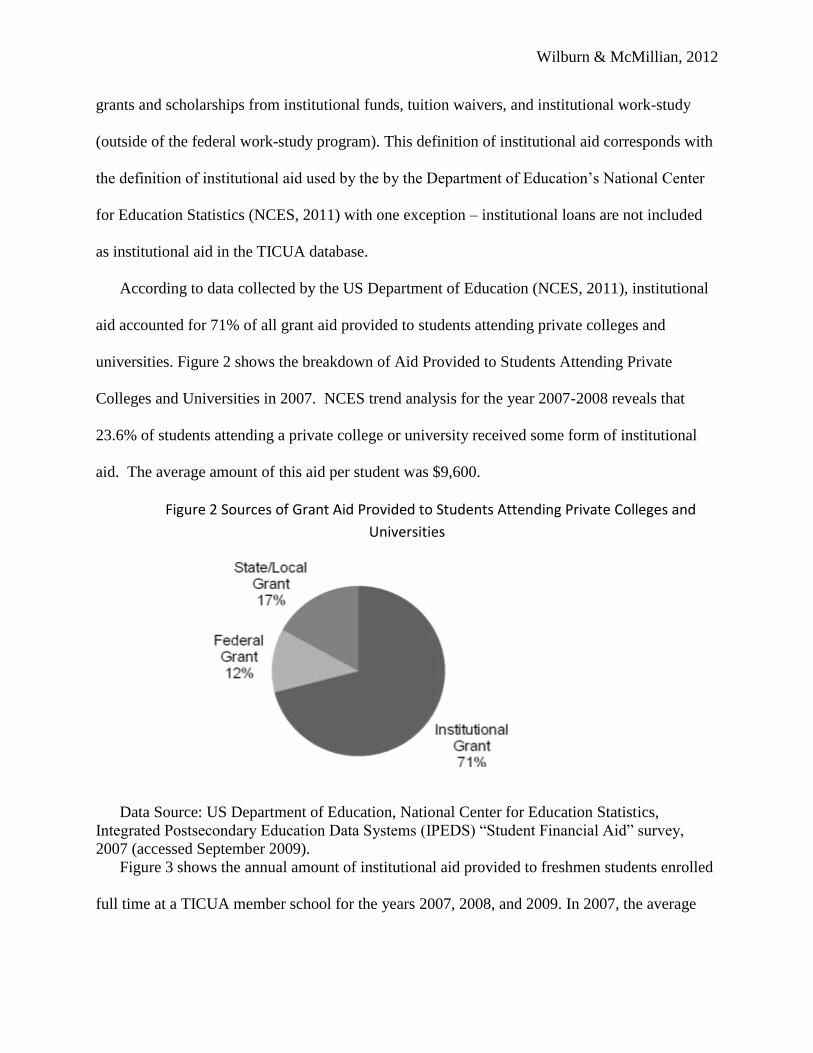
According to data collected by the US Department of Education (NCES, 2011), institutional
aid accounted for 71% of all grant aid provided to students attending private colleges and
universities. Figure 2 shows the breakdown of Aid Provided to Students Attending Private
Colleges and Universities in 2007. NCES trend analysis for the year 2007-2008 reveals that
23.6% of students attending a private college or university received some form of institutional
aid. The average amount of this aid per student was $9,600.
Figure 2 Sources of Grant Aid Provided to Students Attending Private Colleges and
Universities
Data Source: US Department of Education, National Center for Education Statistics,
Integrated Postsecondary Education Data Systems (IPEDS) “Student Financial Aid” survey,
2007 (accessed September 2009).
Figure 3 shows the annual amount of institutional aid provided to freshmen students enrolled
full time at a TICUA member school for the years 2007, 2008, and 2009. In 2007, the average
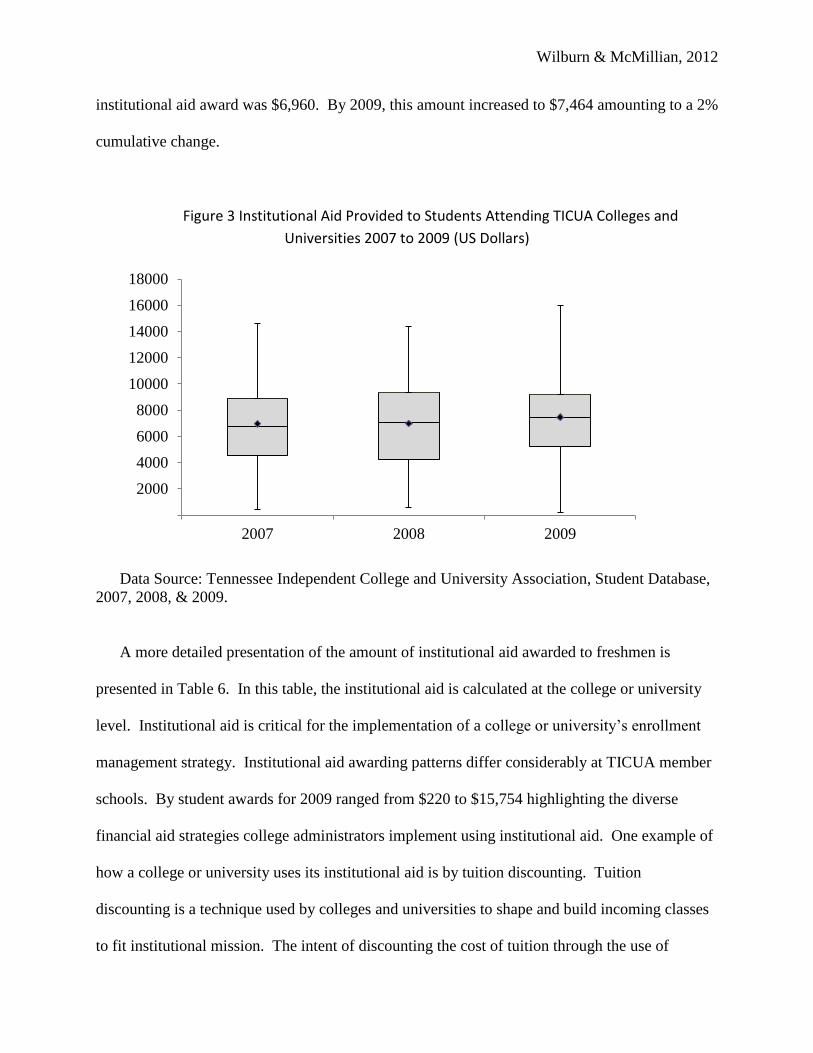
Wilburn & McMillian, 2012
institutional aid award was $6,960. By 2009, this amount increased to $7,464 amounting to a 2%
cumulative change.
Figure 3 Institutional Aid Provided to Students Attending TICUA Colleges and
Universities 2007 to 2009 (US Dollars)
Data Source: Tennessee Independent College and University Association, Student Database,
2007, 2008, & 2009.
A more detailed presentation of the amount of institutional aid awarded to freshmen is
presented in Table 6. In this table, the institutional aid is calculated at the college or university
level. Institutional aid is critical for the implementation of a college or university’s enrollment
management strategy. Institutional aid awarding patterns differ considerably at TICUA member
schools. By student awards for 2009 ranged from $220 to $15,754 highlighting the diverse
financial aid strategies college administrators implement using institutional aid. One example of
how a college or university uses its institutional aid is by tuition discounting. Tuition
discounting is a technique used by colleges and universities to shape and build incoming classes
to fit institutional mission. The intent of discounting the cost of tuition through the use of
2000
4000
6000
8000
10000
12000
14000
16000
18000
2007 2008 2009

Wilburn & McMillian, 2012
institutional funds is to balance student’s ability to pay with willingness to pay at the same time
other objectives are achieved (Davis, 2003). Campuses use tuition discounting to increase the
number of minorities, serve students from low-income households, improve academic profile,
and/or achieve other goals in the enrollment management strategy.
Recently, tuition discounting has come under criticism. Critics state that institutions are not
choosing to or are not able to keep pace with rapid increase in attending college (Graber, 2011).
“Holding discount rates flat while raising tuition at a higher rate than inflation will simply shift
the burden of offsetting the increased cost of attending colleges to sources to the community,
state, federal government, private organizations or the student.” Table 7 shows the annual tuition
and fees charged by TICUA member schools. From 2007 to 2009, tuition and fees increased on
average 7% per year for TICUA schools. In contrast, the amount of institutional aid awarded to
students increased only 2% per year. For this reason, institutional aid is included in this project
as an independent variable to assess the effects on student enrollment and retention. As
mentioned earlier in the methods section, institutional aid (PINSAID) is expressed as a
percentage of the total cost of attendance (STICKER) for the analysis.
3. Total Financial Aid-Without Loans (PFREEAID/FREEAID) - The total financial aid not
including loans is an independent variable that identifies the dollar amount of all grants and
scholarships received by a student. Grants are a type of financial aid that does not require
repayment or employment. Although the TICUA database maintains information on all grant and
scholarship aid, it does not have a single variable that accounts for all “free” aid. As such, the
capstone team created the FREEAID variable. This variable is equal to the sum of all federal
grants (FEDAID), state grants (STAAID), grants from employers or private sources (PCAID),

Wilburn & McMillian, 2012
and institutional aid (INSAID). All need-based grants, merit scholar-ships, tuition waivers, and
employer tuition reimbursements are also included. With the exception of INSAID, which was
described earlier, each of the variables used to construct the FREEAID variable is described in
greater detail below. The definition of FREEAID used by the project team corresponds with the
definition of total grant aid (TOTGRT) used by the by the Department of Education’s National
Center for Education Statistics (NCES, 2011). The mathematical equation used to calculate the
FREEAID variable is:
FREEAID = INSAID+FEDAID+STAAID+PCAID
Excluding the amount of student loan aid from the FREEAID variable ensures that only
aid that reduces the total cost of attending college is analyzed. Student loans, because of the
requirement to pay them back after college, reduce the expected benefits of college. Perna’s
model of student college choice highlights a human capital investment model in which college-
choice decisions are based on a comparison of the expected benefits with the expected costs
(Perna, 2003, 2004). Increasing a student’s ability to pay for college without reducing the “return
on investment” positively retention.
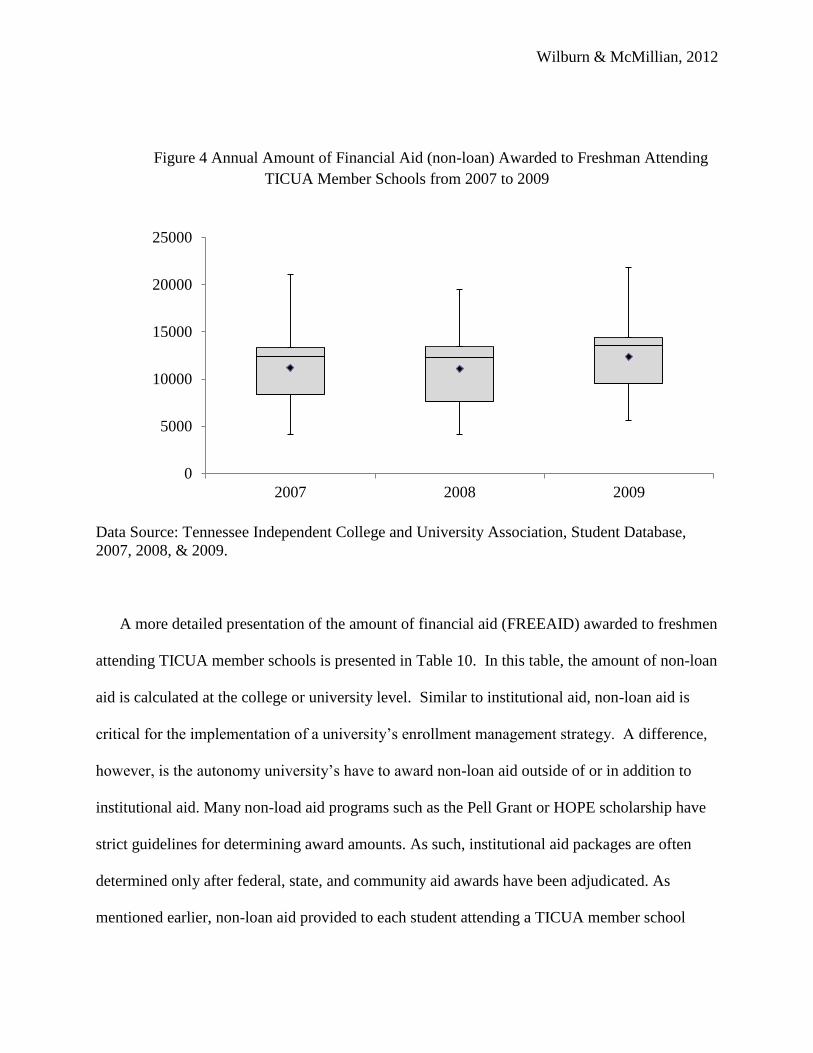
Figure 4 shows the annual amount of financial aid (non-loan) awarded to freshmen
attending TICUA member schools from 2007 to 2009. In 2007, the average amount of non-loan
aid was $11,198 per student. By 2009, this amount increased to $12,360 per student amounting
to a cumulative change of 11.6% and an average annual change of 6.6%. Wide variability exists
between TICUA member schools in the amount of non-loan aid offered as indicated by the
annual standard deviations of $3,785 in 2007, $3,933 in 2008 and $4,218 in 2009.
Wilburn & McMillian, 2012
Figure 4 Annual Amount of Financial Aid (non-loan) Awarded to Freshman Attending
TICUA Member Schools from 2007 to 2009
Data Source: Tennessee Independent College and University Association, Student Database,
2007, 2008, & 2009.
A more detailed presentation of the amount of financial aid (FREEAID) awarded to freshmen
attending TICUA member schools is presented in Table 10. In this table, the amount of non-loan
aid is calculated at the college or university level. Similar to institutional aid, non-loan aid is
critical for the implementation of a university’s enrollment management strategy. A difference,
however, is the autonomy university’s have to award non-loan aid outside of or in addition to
institutional aid. Many non-load aid programs such as the Pell Grant or HOPE scholarship have
strict guidelines for determining award amounts. As such, institutional aid packages are often
determined only after federal, state, and community aid awards have been adjudicated. As
mentioned earlier, non-loan aid provided to each student attending a TICUA member school
0
5000
10000
15000
20000
25000
2007 2008 2009

Wilburn & McMillian, 2012
increased 6.6% per year from 2007 to 2009. In the same time period, institutional aid (included
in the FREEAID variable) increased only 2.0% per year. This indicates that federal, state, and
community grant and scholarship programs are taking on a greater role in providing non-loan aid
to students. As mentioned earlier in the methods section, “No Loan” aid (PFREEAID) is
expressed as a percentage of the total cost of attendance (STICKER) for the analysis. Four data
entries in the TICUA database were used to create the PFREEAID variable – INSAID, FEDAID,
STAAID, and PCAID. Institutional aid was discussed earlier in this section. FEDAID,
STAAID, and PCAID are discussed below.
3. A. Federal Aid (FEDAID) – FEDAID is a variable located in the TICUA database used to
create the independent variable FREEAID. Federal student aid programs are authorized under
Title IV of the Higher Education Act (HEA) of 1965. This database variable deal with all
financial aid awarded to a student from the federal government. This includes but is not limited
to Pell Grant, Stafford Loans, Perkins Loans, PLUS loans, SMART grant, Academic
Competitiveness Grants (ACG), and Supplemental Educational Opportunity Grants (SEOG). It
does not include federal tax benefits, federal veteran’s benefits, or Department of Defense aid
programs. This definition of federal aid corresponds with the definition of financial aid used by
the by the Department of Education’s National Center for Education Statistics (NCES, 2011).
In 2007 to 2008, 51.2% of students attending a private college or university received some
type of federal aid (grant or loan). The average amount of this aid was $7,100. 26.2% of students
attending a private college or university receiving federal grant aid (no loan) with an average
amount of $3,500 (USDOE, 2011). Table 1 shows the federal Pell Grant Awards to TICUA
Students for the years 2007, 2008, and 2009 (TICUA,2007, 2008, 2009). The numbers of
Wilburn & McMillian, 2012
students receiving a federal grant (27%, 28%, and 31%) and the amounts of this award ($3,237,
$3,671, and $4,366) closely resemble the national average.
To be considered for federal student aid, a student must complete a Free Application for
Federal Student Aid (FAFSA) unless the only aid he wants to receive is a PLUS loan via his
parent. The FAFSA collects financial and other information used to calculate the expected family
contribution (EFC) and to determine a student’s eligibility through computer matches with other
agencies. The FAFSA is the only form students must fill out to apply for Title IV aid. A school
cannot require extra information from students except for verification or resolution of conflicting
information. However, a school may require additional information for other purposes, such as
packaging private or institutional aid. If the school collects additional information that affects
Title IV eligibility, it must take the information into account when awarding Title IV aid.
Although TICUA tracks all financial aid assistance information, it does not require member
institutions to provide the EFC along with student data used to create the database.
3. B. State Aid (STAAID) – STAAID is a variable located in the TICUA database used to
create the independent variable FREEAID. This variable in the TICUA database identifies the
financial aid awarded to a student from the State of Tennessee. State aid programs included in
this variable are the Student Assistance Award Grant (TSAAG), HOPE Access Grant
(HOPEGR), HOPE Scholarship (HOPESC), HOPE ASPIRE Award (HOPESU), General
Assembly Merit Scholarship (GMERIT), HOPE Dual-Enrollment Grant (HOPEDU), and the
HOPE Foster Care Grant (HOPEFO). This definition of state aid corresponds with the definition
of state aid used by the by the Department of Education’s National Center for Education
Statistics (NCES, 2011) with one exception – state loans are not included as institutional aid in
Wilburn & McMillian, 2012
the TICUA database. TICUA tracks loan data as a separate variable. Similar to requests for
federal financial aid, students wishing to receive state financial aid must complete the FAFSA.
Some programs, such as the Tennessee Student Assistance Award Grant (TSAAG) require an
additional application form.
In 2007 to 2008, 25.3% of students attending a private college or university received
financial assistance in the form of state aid. The average amount of this aid was $3,500
(USDOE, 2011). State aid provided to TICUA students are need and/or merit based. Tables 2
thru 5 show the amount of aid TICUA students received for the years 2007, 2008 and 2009 for
several of the state aid programs. The largest state aid program in the state of Tennessee is the
HOPE scholarship program funded by the lottery system. From 2007 to 2008, Tennessee state
aid in the form of the HOPE scholarship lagged USDOE state aid findings; however, the amount
of aid provided to TICUA students was higher ($3,967 to $3,984). In 2009, the number of
TICUA students receiving HOPE aid nearly doubled (20% to 39%. This increase has placed a
strain on the long term viability of the HOPE program in the state of Tennessee and has forced
policy makers to reexamine the selection process.
The use of state aid as an independent variable to assist in determining the effects on
enrollment and retention is not new. Dynarski (2000) studied enrollment rates for youth in
Georgia relative to other southern states, before and after the Hope Scholarship program was
initiated in that state. She estimates that the program increased college enrollment rates of 18 to
19-year-olds by 7.0 to 7.9 percentage points. Given the value of the Hope Scholarship, this
estimate converts to an estimate of 2 to 3 percentage points per $1000 difference in cost. Zhang
and Ness (2010) found that in the aggregate and on average, the implementation of state merit
aid programs both increases the total 1st-year student enrollment in merit aid states and boosts

Wilburn & McMillian, 2012
resident college enrollment significantly. This project considers state aid as part of a larger
variable including all non-loan aid.
In another study conducted by the Tennessee Higher Education Commission (THEC, 2010),
the results indicated that students who remain in school after losing TELS awards are more likely
to come from higher income families. Nearly two‐thirds of fall 2008 first‐time freshmen from the
highest income group who did not renew their scholarship returned for the sophomore year.
Among such students from the lowest income families, the rate of students returning to college
was only 46 percent, a difference of 18 percentage points. This implies that income has some
influence on college retention, suggesting that the scholarship may play a more important role in
the decision to remain in school for lower‐income students. The effects highlighted by Dynarski
and Zhang and THEC justify its relevance and inclusion in the analysis of the TICUA database.
3. C. Private / Community Aid (PCAID) – PCAID is a variable located in the TICUA
database used to create the independent variable FREEAID. This variable identifies the financial
aid awarded to a student through a private organization or community program. This aid is
provided as a grant or scholarship and is not a loan. Thousands of private scholarships and
grants are available each year through businesses, companies, nonprofit organizations, clubs,
societies and unions across the country. This aid can be need-based, merit-based, or association-
based or a combination of the three.
Any source of grant or scholarship lowers the net cost of attendance for students and parents,
so the positive effects of financial aid on enrollment and retention may be strictly an economic
affect brought on by an increased ability to pay – especially for students of lower socio-
economic backgrounds (Hossler et. al, 1999; Paulsen and St. John, 2002, Tinto, 1986; Braxton,

Wilburn & McMillian, 2012
2003). When isolated as an independent variable, the effects of privately and community funded
scholarships is mixed. Schwartz (2005) used a binomial logistic model to investigate the effects
of various types of financial aid on enrollment. His findings suggest that publically provided
grants had a significant effect on the decision to attend college, however, privately funded
scholarships had no measurable effect. This project, however, considers private and community
aid as part of a larger variable including all non-loan aid. As such, the positive effects
highlighted by Hossler et. al. justify its relevance and inclusion in the analysis of the TICUA
database.
4. Total Financial Aid (PTOTATAID/TOTAID) - The total financial aid variable is an
independent variable that identifies the dollar amount of all financial aid provided to a student
from any source except parents, relatives, or friends. This definition of total financial aid
corresponds with the definition of total loan aid (TOTAID) used by the by the Department of
Education’s National Center for Education Statistics (NCES, 2011). The TOTAID variable is
calculated by summing the total amount of aid offered to a student without loans (FREEAID)
and the total amount of aid received through loans (TOTLOA).
Figure 5 shows the annual amount of total financial aid provided to freshmen students
enrolled full time at a TICUA member school for the years 2007, 2008, and 2009. In 2007, the
average financial aid award was $15,200. By 2009, this amount increased to $17,268 amounting
to a 15.1% cumulative change. The average annual change was 8.1%. Wide variability exists
between TICUA member schools in the amount of total aid offered as indicated by the annual
standard deviations of $3,909 in 2007, $4,080 in 2008 and $4,171 in 2009.

Wilburn & McMillian, 2012
Figure 5 Annual Amount of Financial Aid (total) Awarded to Freshman Attending
TICUA Member Schools from 2007 to 2009
Data Source: Tennessee Independent College and University Association, Student Database,
2007, 2008, & 2009.
A more detailed presentation of the amount of total financial aid (TOTALAID) awarded
to freshmen attending TICUA member schools is presented in Table 11. In this table, the
amount of total-aid is calculated at the college or university level. As is the case with
institutional aid and non-loan aid, the total aid package plays a large part in a family’s ability to
pay for college (Perna, 2003). Other studies suggest that offers of financial aid will offset the
decreased demand for higher education brought on by the rising cost of attendance (Heller, 1997;
Leslie and Brinkman, 1988). As mentioned earlier, the total aid package provided to each student
attending a TICUA member school increased 8.9% per year from 2007 to 2009. In comparison,
the cost of tuition and fees at TICUA member schools (Table 7) increased 11% per year during
the same time period suggesting that the total financial aid package is lagging behind the rate of
0
5000
10000
15000
20000
25000
30000
2007 2008 2009

Wilburn & McMillian, 2012
increase for tuition and fees, but only slightly. The effects of this separation are examined in the
findings section of this report. As mentioned earlier in the methods section, total aid
(PTOTAID) is expressed as a percentage of the total cost of attendance (STICKER) for the
analysis. To create the PTOTAID variable, one data entry from the TICUA database, the amount
of total loan aid received by a student (TOTLOA), is added to the PFREEAID variable described
earlier. The TOTLOA variable is described below.
4. A. Amount of Total Loan Aid Received (TOTLOA) - TOTLOA is a variable located in the
TICUA database used to create the independent variable TOTAID. This variable includes all
loan aid received by the student from federal, state, institutional, or private programs. This
includes but is not limited to Stafford loans, PLUS loans, and Perkins loans. It excludes any
loans from family or friends. This definition of total loan aid corresponds with the definition of
total loan aid used by the by the Department of Education’s National Center for Education
Statistics (NCES, 2011).
In 2007 to 2008 a financial aid trend analysis study by the NCES found that 54.3% of
students attending a private college or university received a federal loan. The average amount of
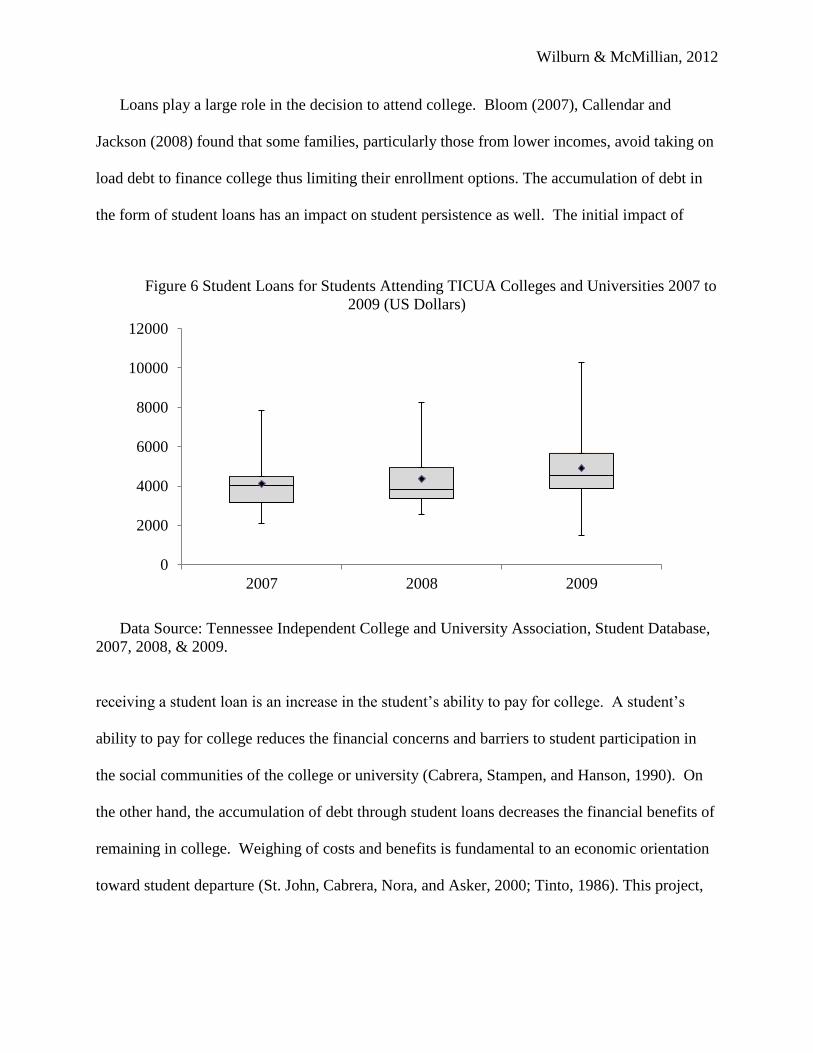
this loan was $5,500 (USDOE, 2011). Figure 5 shows the amount of student loans taken by
students attending TICUA member schools from 2007 to 2009. In 2007, the average amount of
an annual loan for a TICUA student was $4,133. By 2009, this amount had grown to $4,909 –
an increase of 18.8%. Despite the increase, the average amount of an annual loan for a student
attending a TICUA school remained lower that USDOE estimates. The number of TICUA
freshmen taking loans, however, was slightly higher than USDOE estimates ranging from 59.2%
in 2007 to 61.1% in 2009.
Wilburn & McMillian, 2012
Loans play a large role in the decision to attend college. Bloom (2007), Callendar and
Jackson (2008) found that some families, particularly those from lower incomes, avoid taking on
load debt to finance college thus limiting their enrollment options. The accumulation of debt in
the form of student loans has an impact on student persistence as well. The initial impact of
Figure 6 Student Loans for Students Attending TICUA Colleges and Universities 2007 to
2009 (US Dollars)
Data Source: Tennessee Independent College and University Association, Student Database,
2007, 2008, & 2009.
receiving a student loan is an increase in the student’s ability to pay for college. A student’s
ability to pay for college reduces the financial concerns and barriers to student participation in
the social communities of the college or university (Cabrera, Stampen, and Hanson, 1990). On
the other hand, the accumulation of debt through student loans decreases the financial benefits of
remaining in college. Weighing of costs and benefits is fundamental to an economic orientation
toward student departure (St. John, Cabrera, Nora, and Asker, 2000; Tinto, 1986). This project,
0
2000
4000
6000
8000
10000
12000
2007 2008 2009
Wilburn & McMillian, 2012
considers the effects of student loans on enrollment and retention as part of a larger variable that
accounts of all aid received by a student (TOTALAID).
5. Cost of Attending College (STICKER) – All of the independent variables used in this report are
presented as percentages of the overall cost of attending college. From the perspective of
families and students, departure decisions are often based on the ability to pay for college.
Therefore, financial attributes of educational institutions (e.g., tuition, room, and board) are
frequently included in studies that assess enrollment and retention. Several studies of
postsecondary participation and college choice have been conducted employing some or all of
these variables (Bishop, 1977; Kohn, Manksi, and Mundel, 1976; Manski and Wise, 1983;
McPherson and Schapiro, 1991; Parker and Summers, 1993). The STICKER variable used in this
project identifies the total educational expenses of the student. The total cost of attending college
includes the tuition and fees as well as all other expenses related to enrollment: books and
supplies; room and board (or housing and meal allowances for off-campus students). Tuition is
priced for an academic year (two semesters) taking 15 credits each semester. Only mandatory
fees are included. For this project, the cost of attending college is calculated only for students
who attended one institution. This definition of the cost of attending college (STICKER)
corresponds with the definition of price of attendance used by the by the Department of
Education’s National Center for Education Statistics (NCES, 2011) with two exceptions:
transportation costs and other personal living expenses are not included in the STICKER
variable.
Tuition and fees make up approximately 74% of the total cost of attending TICUA
member schools. Previous studies suggest that increase of tuition costs will reduce the demands
Wilburn & McMillian, 2012
for postsecondary education, and the offers of financial aid will offset this decrease (Heller,
1997; Leslie and Brinkman, 1988). From 2007 to 2009, tuition and fees increased on average 7%
per year for TICUA schools. This increase was less than the national average annual increase in
tuition and fees of 15% for private four-year colleges from 2004 to 2009 (College Board, 2009).
TICUA schools also maintain an average tuition cost below the national average for private 4-
year institutions. In 2009, the average tuition and fees at private 4-yr institutions were $26,273,
$7,328 higher than the average tuition at a TICUA institution (TICUA, 2009).
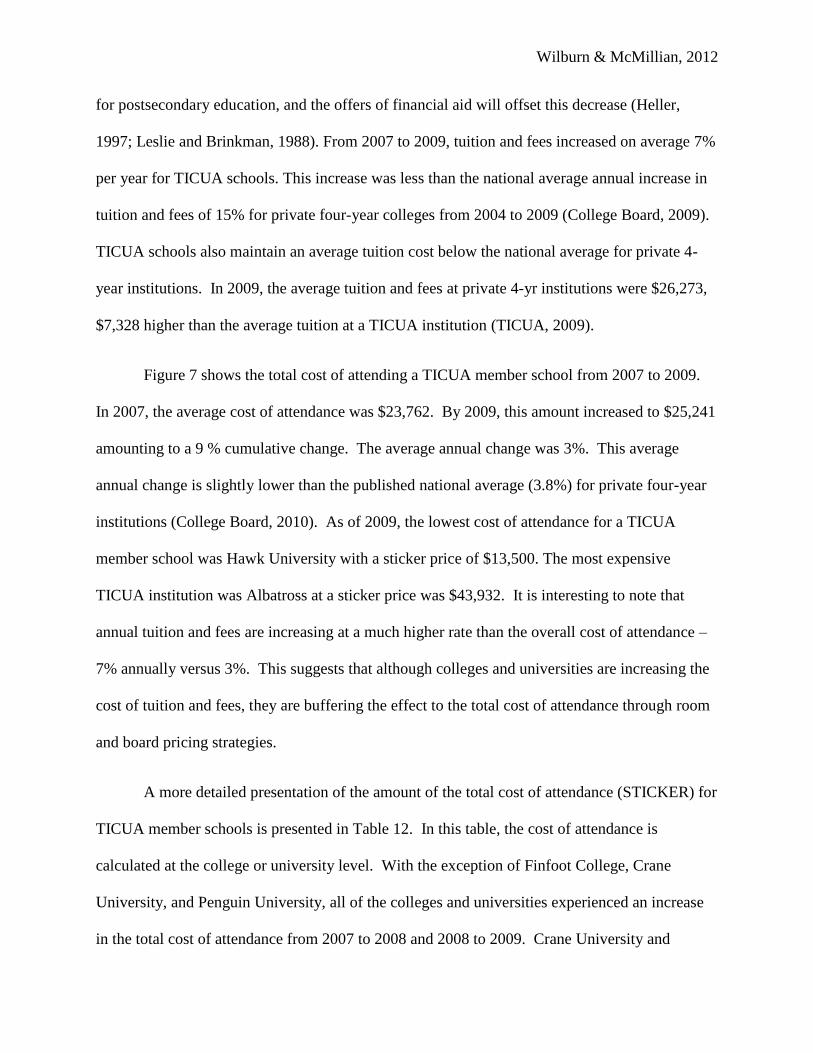
Figure 7 shows the total cost of attending a TICUA member school from 2007 to 2009.
In 2007, the average cost of attendance was $23,762. By 2009, this amount increased to $25,241
amounting to a 9 % cumulative change. The average annual change was 3%. This average
annual change is slightly lower than the published national average (3.8%) for private four-year
institutions (College Board, 2010). As of 2009, the lowest cost of attendance for a TICUA
member school was Hawk University with a sticker price of $13,500. The most expensive
TICUA institution was Albatross at a sticker price was $43,932. It is interesting to note that
annual tuition and fees are increasing at a much higher rate than the overall cost of attendance –
7% annually versus 3%. This suggests that although colleges and universities are increasing the
cost of tuition and fees, they are buffering the effect to the total cost of attendance through room
and board pricing strategies.
A more detailed presentation of the amount of the total cost of attendance (STICKER) for
TICUA member schools is presented in Table 12. In this table, the cost of attendance is
calculated at the college or university level. With the exception of Finfoot College, Crane
University, and Penguin University, all of the colleges and universities experienced an increase
in the total cost of attendance from 2007 to 2008 and 2008 to 2009. Crane University and

Wilburn & McMillian, 2012
Penguin University increased their costs from 2007 to 2008, however, decreased the overall costs
the following year. Finfoot College has held their cost of attendance constant for all three years
examined in this project.
Figure 7 Total Costs of Attending TICUA Member Schools from 2007 to 2009
(US DOLLARS)
Data Source: Tennessee Independent College and University Association, Student Database, and
Fact Books for the years 2007, 2008, & 2009.
Tables 13 and 14 show the annual amount of institutional aid, no-loan aid, and total
financial aid awarded to students expressed as a percentage of total cost of attendance from 2007
to 2009. These amounts have remained relatively stable for the three years examined in this
project. On average, TICUA schools cover 28.2% of the cost of attendance through the use of
institutional aid awards. This mirrors findings on student aid trends reported by the College
Board (2009) in which private four-year colleges and universities covered about 25 – 35% of
tuition and fees. When federal, state, community and private grants and scholarships are added,
0
5000
10000
15000
20000
25000
30000
35000
40000
45000
50000
2007 2008 2009

Wilburn & McMillian, 2012
the proportion of total costs covered increases to 48.2%. The addition of loan aid results in
68.0% of the cost of attendance covered for students attending a TICUA member college or
university.
Control Variables Used in the Analysis
In addition to the data entry variables identified above, the file contains a rich array of
control variables – race, gender, high school GPA, ACT and SAT scores.
1. Race (RACE) – This variable indicates the student’s racial/ethnic origin and is
designed to provide information in the form collected by IPEDS. Data entry for this variable
includes 1) Non-resident Alien 2) Black or African-American 3) American Indian or Alaskan
Native 4) Asian 5) Hispanic or Latino 6) White 7) Unclassified 8) Two or more races 9) Native
Hawaiian or Other Pacific Islander. Approximately 25% of all undergraduate students attending
a TICUA member school from 2007 to 2009 describe themselves as being in a minority
(TICUA). Figure 8 highlights the undergraduate enrollment by ethnicity for students attending
TICUA member Schools 2007 to 2009.
Although this study does not attempt to identify the effect of financial aid on minority
retention, it does acknowledge the findings that minority students demonstrate a heightened
sensitivity to the costs of attending college (Dynarski, 2003; Ikenberry and Hartle, 1998; Lillis,
2008; St. John, 1991; St. John and Noell, 1989; St. John and Starkey, 1995; Perna, 2006) which
may lead to differences in enrollment and retention patterns. This study attempts to eliminate
bias in the data analysis by statistically controlling for the effects race has on enrollment and
retention. For the regression analysis, the project team created a binary variable (MINORITY) to
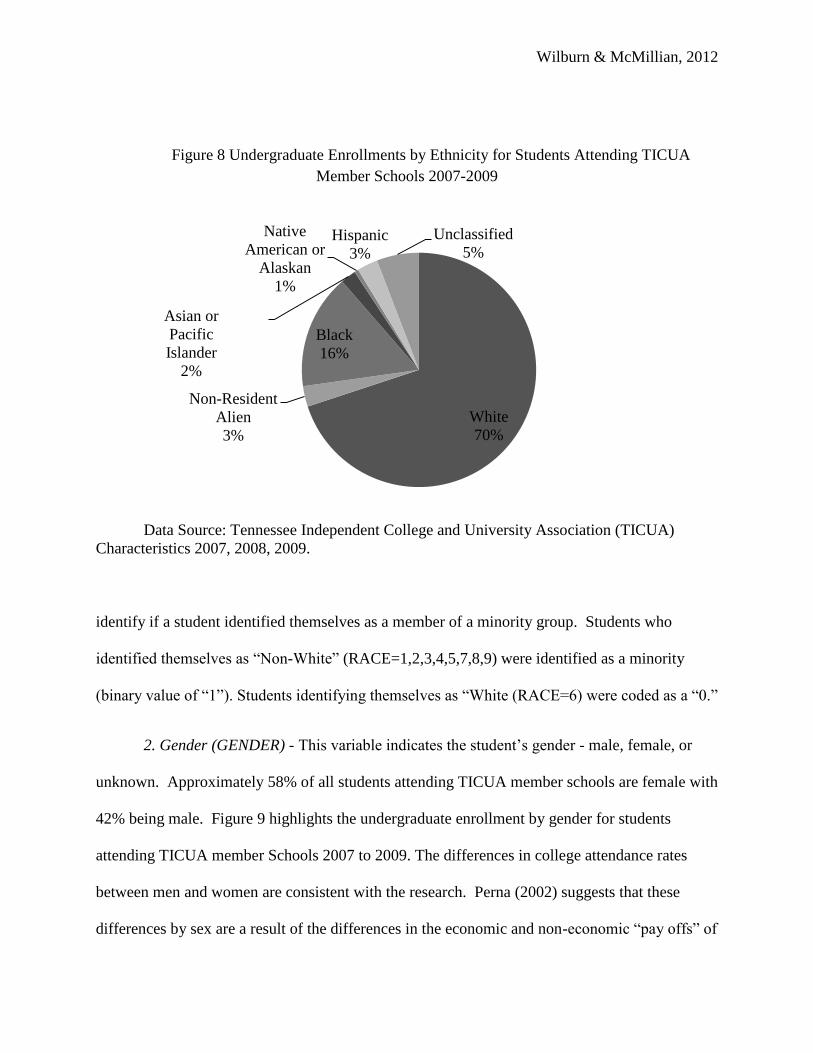
Wilburn & McMillian, 2012
Figure 8 Undergraduate Enrollments by Ethnicity for Students Attending TICUA
Member Schools 2007-2009
Data Source: Tennessee Independent College and University Association (TICUA)
Characteristics 2007, 2008, 2009.
identify if a student identified themselves as a member of a minority group. Students who
identified themselves as “Non-White” (RACE=1,2,3,4,5,7,8,9) were identified as a minority
(binary value of “1”). Students identifying themselves as “White (RACE=6) were coded as a “0.”
2. Gender (GENDER) - This variable indicates the student’s gender - male, female, or
unknown. Approximately 58% of all students attending TICUA member schools are female with
42% being male. Figure 9 highlights the undergraduate enrollment by gender for students
attending TICUA member Schools 2007 to 2009. The differences in college attendance rates
between men and women are consistent with the research. Perna (2002) suggests that these
differences by sex are a result of the differences in the economic and non-economic “pay offs” of
White
70%
Non-Resident
Alien
3%
Black
16%
Asian or
Pacific
Islander
2%
Native
American or
Alaskan
1%
Hispanic
3%
Unclassified
5%

Wilburn & McMillian, 2012
higher education for women versus men. Human capital investment models predict that
individuals will invest in higher education when the economic and non-economic benefits of
attending exceed the costs of not attending (Paulsen, 2001). In an attempt to eliminate bias from
the data analysis, this study attempts to statistically control for the effects of gender on
enrollment and persistence. For the regression analysis, the project team created a binary variable
called “GENDER.” If a student was reported as a female, they were coded a “1.” If the student
was reported as a male, they were coded as a “0.”
Figure 9 Undergraduate Enrollments by Gender for Students Attending TICUA Member
Schools 2007-2009
Data Source: Tennessee Independent College and University Association (TICUA)
Characteristics 2007, 2008, 2009.
3. SAT/ACT – The ACT variable is a two digit element containing the ACT composite
score for the student. The composite score is the average of the four ACT subtests rounded to an
integer. The SAT variable is a four digit element containing the cumulative SAT score for the
student. Hearn (1988) found that student academic preparation and aspirations are among the
most significant predictors of student attendance/enrollment at high-cost institutions. Similarly,
Male 42%
Female 58%
Wilburn & McMillian, 2012
prior studies have demonstrated that high school achievement and standardized test scores are
modest predictors of positive college performance and outcomes (Daugherty & Lane,1999;
Galicki & McEwen, 1989, Munday, 1967; Bowen and Bok, 1998; Burton and Ramist, 2001;
Rothstein, 2004) which has a corresponding effect on student persistence. Also, SAT/ACT
scores play a critical role in the award of merit based financial aid. In an attempt to eliminate
bias from the data analysis, this study attempts to statistically control for the sizeable effects of
SAT/ACT has on student departure and financial aid award. Of note is the fact that GPA and
SAT/ACT data are only required data entries to the TICUA database if the student is receiving a
Tennessee Education Lottery Scholarship (TELS) award. Also, high school data contained in the
TICUA database use different formats and scales depending upon the student. This is most
likely a result of the information sent to the college or university by the high school. In many
cases, the very different scales made the use of HSGPA unusable for this study. The limitations
to the analysis performed in this study brought on by the limitation of the data set are discussed
in greater detail later in this report.
Limitations of the Data Analysis for Project Question 1
Despite the project team’s attempt to mitigate weaknesses and flaws in the design, data
collection and analysis for this project, some limitations still exist. The limitations for this study
include the omission of data on student background characteristics, limited data on student
achievement, possible variations by year in the influence of financial aid, and the absence of
consideration for the students’ experience with the institution.

Wilburn & McMillian, 2012
Omitted Data on Student Background Characteristics – Studies on college student choice
and retention traditionally include several background characteristics in their research that have
been shown to impact enrollment and retention. These characteristics include gender, race or
ethnicity, parental income, parental education, and student grade point average (Bouse and
Hossler, 1991;Coleman, Conley, 2001; Hoffer, and Kilgor, 1982; Hanson, 1994; Karen, 1991;
Sewell, Haller, Hossler and Stage, 1992; Reynolds and Pemberton, 2001; Stage and Hossler,
1989; and Ohlendorf, 1970). No information on parental income or parental education is
maintained in the TICUA database. The capstone team attempted to estimate family income
using the student’s zip code reported in the TICUA database and the mean family income for that
zip code reported in to 2000 US Census data. A regression analysis using this information
resulted in no effect. The omission of parental income and education as control variables in the
regression analysis presents the possibility that any relationship identified between the
independent variables and dependent variables are in fact spurious relationships – a relationship
that occurs when a third variable creates the appearance of a relationship between the two other
variables when in fact the relationship does not exist.
Limited Data on Student Academic Achievement – The TICUA database does include
information on student academic achievement and preparation in the form of high school GPA,
SAT, and ACT scores. With respect to student decisions to attend high-cost institutions, Hearn
(1988) found that student academic preparation and aspirations are among the most significant
predictors of student attendance at high-cost institutions. Unfortunately, TICUA member schools
are only required to report this information if the student is receiving financial assistance from
the Tennessee Education Lottery System (TELS). Of the 25,171 TICUA students included in

Wilburn & McMillian, 2012
this study 14,018 received financial assistance from TELS (55.7%). For this group, the
relationships of GPA and ACT were identified and controlled for. SAT data was omitted due to
the large amount of missing and erroneous data. For students in which this information was
omitted, the possibility of a third variable creating a spurious effect exists.
Possible variations by Year in the Influence of Financial Aid - Year to year changes in the
influence financial aid has on retention were not considered in this project due to the short period
of time assessed (2007-2009). This is not meant to suggest that changes did not occur or do not
exist. Events occurring between data collection intervals for TICUA member schools may have
affected student and family’s attitudes and behaviors towards financial aid such that changes on
the dependent measures by the independent variable is masked, amplified, or mitigated by the
historical event (i.e. economic down turn, new legislation, etc.). The presence of this threat to the
internal validity of the results are assessed to be minimal, however, may still exist.
Absence of Consideration for the Students’ Experience with the Institution
Although the capstone team attempts to account for fixed effects at the institutional level,
a limitation is that the students’ experience with the institution per Tinto (1993) and Braxton,
Hirschy and McClendon (2004) is not addressed in the regression analysis. Proactive social
adjustment, psychosocial engagement, communal potential, perceived commitment of the
institution to student welfare, and institutional integrity are posited too play a role in a student’s
social integration and persistence on the college campus. The absence of student experience as a
control variable in the regression analysis presents the possibility that any relationship identified
between the independent variables and dependent variables are in fact spurious relationships.
Wilburn & McMillian, 2012
Presentation of Findings for Project Question #1
Our goal was to identify the unique or independent effects financial aid has on student
retention. We accomplished this through logistic regression by coding the dependent variable,
retention, as a binary variable RETAINED. Three financial aid packages – institutional aid, “no
loan” aid, and total aid were assessed for those students who departed in comparison to those
students who re-enrolled for their sophomore year. The amount of institutional aid, no loan aid,
and total aid awards for students retained (left column) and students departed (right column) are
highlighted in table 15. In 2007 – 2009, TICUA students retained received more institutional
aid, no-loan aid, and total aid awards than students who chose to depart. On average, students
retained received $8,131 (30.8% of the total cost of attendance) per year in institutional aid in
comparison to $5,430 (22.1%) received by students that departed. Similarly, students retained
received $12,429 (50.1%) per year in no-loan aid and $16,856 (69.2%) per year in total aid in
comparison to students that departed who received $9,228 (40.2%) in no-loan aid and $13,280
(58.9%) in total aid.
To obtain effect estimates on retention, a logistic analysis was conducted for the two
samples groups: 1) all TICUA students and 2) students receiving Tennessee Education Lottery
System funds. For each group, the effect on retention was examined using independent variables
of three financial aid award packages – institutional aid, non-loan aid, and total aid. In the case
of the all TICUA sample group, gender and minority status were controlled for. For the TELS
sample group, ACT scores, gender and minority status were controlled for. To the extent that the
three financial aid variables may have an effect on student retention and enrollment, these
estimates apply to those students we have selected in the two samples. The impact of aid for

Wilburn & McMillian, 2012
students not within the sample may be quite different. The results of each regression are shown
in table 16. To ensure the aggregation of data collected across the years of 2007, 2008, and 2009
was unproblematic, the capstone team examined the differences between values in the
independent variables across all three years. These values are shown in tables 13 and 14. Due to
the very small changes in aid across the three years examined (no greater than 1.8%) the
differences were considered negligible for the analysis.
The logistic regression coefficients in each column of Table 16 show the direction and
strength of the relationship between the retention and each financial aid package. In all cases,
the direction of the relationship between the three financial aid packages and retention is positive
indicating that the more financial aid an individual receives the greater likelihood they will be
retained through their freshman year in college. Of the three independent variables examined,
institutional aid had the strongest relationship with a regression coefficient of 1.173 (p<.001),
followed by no-loan with a regression coefficient of .760 (p<.001) and total aid with a
regression coefficient of .602 (<.001). This pattern was mirrored in the findings on students
receiving TELS awards. In fact, the relationships of the three aid packages to retention were
actually stronger (institutional aid=1.243, no-loan aid=1.118, and total aid= 0.432; (p<.001) for
the TELS sample than the aggregate TICUA sample.
Similar to other research findings on the relationship of race and retention (St. John,
1991; St. John and Noell, 1989; St. John and Starkey, 1995) the results in table 16 suggest a
heightened sensitivity to financial aid for minority students. Being a minority status had a
negative effect on the overall strength of the relationship with regression coefficient of -0.198
(p<.001). This effect remained for the TELS sample when ACT was added to the regression
analysis resulting in regression coefficient -0.276 (p<.001).

Wilburn & McMillian, 2012
The results of the logistic regression also identified a different effect on retention due to a
student’s gender. A female student enrolled at a TICUA school is more likely to stay enrolled
when receiving financial aid (regression coefficient 0..225, p<0.001). This effect remained for
the TELS sample as well (regression coefficient 0.199; p<.001). This could point towards
differences between men and women in their institutional commitment based on their
perceptions of adequacy for a given financial award to assist in a meeting their ability to pay for
higher education. The effect of ACT score was only performed on TELS students and the
resulting effect on retention was positive (regression coefficient 0.017; p<.001).
The strength of the relationship is hard to gauge with the coefficients, since they are
measured on the log scale. The coefficients represent the difference in log-odds of the dependent
variable for each one unit change in the independent variable. In other words, for every one unit
increase in the financial aid award package, the log-odds of a student being retained increase by
the coefficient shown. To make the results more accessible and add clarity to their meaning, we
graph the logistic regression line for each analysis in figure 10.
Figure 10 shows the degree to which the institutional aid, no-loan aid, and total aid
received by a student is associated with retention. For example, a freshman student receiving an
institutional aid award that covers 50% of the cost of attending college has 56% chance of
enrolling for his sophomore year. A student receiving the same award in the form of no-loan aid
has a 51% chance of reenrollment. A total aid award of 50% of the cost of attendance results in
a 48% chance of reenrollment. A student receiving an institutional award that covers all of the
cost of attendance is 70% likely to reenroll for the sophomore year. Institutional aid has the
strongest relationship with retention at all values. Total aid including loans has the weakest
relationship with retention at all values. To confirm the predictive power of the models in figure

Wilburn & McMillian, 2012
13, an omnibus test of model coefficients was conducted. Since all models resulted in low
significance values (sig values .000), we conclude that the models do have predictive power.
Figure 10 Logistics Regression Graph Predicting Student Retention for Students
Attending TICUA Member Schools from 2007 to 2009
Figure 11 shows the results of logistic regression models created using only students that
received TELS financial awards. In this model, academic preparation was controlled for using
student ACT scores. In contrast to the aggregate TICUA sample, institutional aid has the
strongest relationship with retention at all amounts. As shown in table 16, the logistic regression
coefficients for the TELS sample are greater than those found in the analysis for the aggregate
TICUA sample. This indicates a stronger relationship between retention and the three financial
aid packages. The predicted student retention values for the TELS model are much lower than
the TICUA sample model, however. In the TICUA model, a freshman student receiving an
institutional aid award that covers 50% of the cost of attending college has 56% chance of
0.30
0.35
0.40
0.45
0.50
0.55
0.60
0.65
0.70
0.1 0.2 0.3 0.4 0.5 0.6 0.7 0.8 0.9 1.0
Pre
dic
ted S
tuden
t R
eten
tion
Cost of Attendance Covered in Financial Aid Award
Institutional Aid
No-Loan Aid
Total Aid

Wilburn & McMillian, 2012
enrolling for his sophomore year. In the TELs model, a student receiving the same award has a
44% chance of reenrollment – a 12% difference. Once values of aid increase, however, the gap
between the models lessens slightly. A TELS award student receiving an institutional award that
covers all of the cost of attendance is 60% likely to reenroll for the sophomore year – a 10%
difference over the TICUA sample model. The differences between these models are likely due
to the differences in background characteristics, dependent and independent variable values
between the samples as well as the inclusion of ACT scores as control variables.
Figure 11 Logistics Regression Graph Predicting Student Retention for Students
Receiving TELS Financial Awards from 2007 to 2009
A noticeable characteristic of figure 11 is how closely the line representing institutional
aid is mirrored by the no loan aid. This suggests that although the influence of institutional aid
on retention is greater that no-loan aid, the difference is very small. In all cases, an omnibus test
0.30
0.35
0.40
0.45
0.50
0.55
0.60
0.65
0.70
0.1 0.2 0.3 0.4 0.5 0.6 0.7 0.8 0.9 1.0
Pre
dic
ted S
tuden
t R
eten
tion
Cost of Attendance Covered in Financial Aid Award
Institutional Aid
No-Loan Aid
Total Aid

Wilburn & McMillian, 2012
of model coefficients was conducted to test the predictive power of the TELS award models
resulting in low significance values (sig values .000).
The final goal in the analysis of project question #1 was to identify a “tipping point” or a
specific amount of scholarship/grant aid that resulted in the strongest effect in predicting whether
or not a student was retained at a TICUA member school. To identify the tipping point, a
polynomial regression was conducted. Separate regression analyses were conducted on all of the
students in the TICUA data set and students receiving TELs awards. The results of the
regressions using institutional aid as an independent variable are shown in table 17 and the linear
estimation for the polynomial regressions are shown in figure 12. Regression results for “loan
free aid” and “total aid” did not identify a tipping point for retention. However, a tipping point
was identified for institutional aid.
In the case of all TICUA students, an institutional aid amount of 75% (T1 in figure 12) of
the cost of attendance is the strongest predictor of whether or not a student will return their
sophomore year. Using the logistic regression model above, a student receiving this award is
63% likely to reenroll. An institutional aid awards beyond this amount has a diminishing effect
on reenrollment. For students receiving TELs awards, an institutional aid amount of 68% (T2 in
figure 12) of the cost of attendance is the strongest predictor of whether or not a student will
reenroll. A TELs student receiving this award is 50% likely to return their sophomore year.

Wilburn & McMillian, 2012
Figure 12 Polynomial Regression Graph to Identify the “Tipping Point” for Institutional
Aid Awards 2007 to 2009
Summary for Project Question #1
This analysis considers the important problems faced by colleges and universities of
evaluating the effect of their financial aid offers on student retention decisions. The analysis
conducted in this report suggests that the financial aid award does have positive effects on a
student’s decision to remain in. This study examined the direct effect financial aid has on
retention using tangible elements such as institutional aid, no-loan aid, and the total financial aid
package as variables to determine whether a student chooses to reenroll or depart college. The
positive effects of financial aid found in the analysis of the TICUA student database may not be
the only influencing factor, however. National studies examining finance-related factors (student
aid, tuition, and other costs, including living) note that the direct effects of student aid awards do

Wilburn & McMillian, 2012
enter into a student’s decision to remain in college but they are not the considerations and may
not be the most influential in the persistence process (Paulsen and St. Jonh, 1997; St. John,
Paulsen, and Starkey, 1996). Studies have found that financial aid awards increased the chance a
student had to participate and integrate both socially and academically on the college campus
Cabrera et. al. (1992). These indirect effects are likely to be contributing factors to the findings
of this report, however, were not variables in the analysis.
Of note is the fact that the strength of the relationship between financial aid and retention
is weakened for minority students. This supports other findings on the increased sensitivities
minority groups have toward the cost of attending college (St. John, 1991; St. John and Noell,
1989; and St. John and Starkey, 1995) as well as the effects that cultural differences for these
groups play in social integration (Bordieu, 1973; Tinto, 1993) and communal potential (Braxton,
Hirschy, and McClendon, 2004) on the college campus.
When academic achievement/preparation information is controlled for using ACT/SAT
data, the amount of institutional aid awarded to a student is the strongest predictor for student
reenrollment in the sophomore year – slightly stronger than loan-free aid and significantly
stronger than total aid (with loans). There are several possible reasons for the differences
between these aid packages. First, the internal selection mechanisms for awarding institutional
aid accounts for the uniqueness of the campus and the population it serves. The autonomy to
generate institutionally specific criteria for awarding student aid is in contrast to the fixed need
based and merit based formulas used to calculate aid awards at the state and federal level. By
taking into account the unique institutional effects on retention, a more accurate assessment of
who receives aid and the amount of the institutional aid package is made in order to have the
most positive impact on a student remaining at their institution.

Wilburn & McMillian, 2012
Another reason for the strength of the institutional aid award in predicting retention may
be due to the message that an institutional aid offer sends to a student and family in contrast to
the award of state or federal aid. Cabrera et. al. (1992) found that early judgments a student
makes about their financial situation and whether they feel the financial award offer is adequate
influences the initial commitment they make to their institutions. An institutional aid award tells
a student, “we want you here and this award is our commitment to you should you choose to
attend and remain at our college.” A similar aid package in the form of loan-free aid has the
same direct effect on the ability to pay; however, the effect on institutional commitment is lost.
The interest in identifying a financial aid amount that acts as a tipping point in a student’s
decision to enroll and remain in college is of great interest to college administrators for good
reason. It would allow the appropriate allocation of resources to new student recruitment while
also ensuring enough resources were available to fund effective retention programs. This
analysis found that an institutional aid package of 75% of the cost of attendance has the greatest
effect in predicting student reenrollment. For students receiving TELs awards, the analysis
found that an institutional aid package of 68% of the cost of attendance has the greatest effect in
predicting student reenrollment. It is tempting to state that the difference between the awards for
all TICUA students and TELs student awards is a result of the injection of academic
preparation/performance (SAT/ACT score) into the logistic regression equation. This
generalization would be premature, however. Differences in background characteristics between
the two groups were not assessed and this analysis was beyond the scope of this project. As
such, additional research is required to determine if differences between these groups do exist
and if those differences have an influence on the financial aid award received at the individual
student level. Caution must be given to the use of these values, however. The data analysis
Wilburn & McMillian, 2012
identified these aid amounts based upon student level data consolidated at the TICUA level. As
such, student level data at the institutional level may yield very different results.
A final note to the analysis conducted in this report is that the absence of student and
family financial status is a significant delimitation to the findings presented above. When
considering a methodology to examine the direct effect of financial aid on retention St. John et.
al. stated “If they control for family income and multi-institution, then it is possible to assess the
effects of the tuition charges as well as aid subsidies (St. John, Cabrera, Asker, 2000).” Due to
the omission of financial aid data from the TICUA database, family income could not be
considered. It is possible that when the effects of student and family income are added to the
regression analysis performed in this study, the effect of financial aid mentioned above will be
decreased or eliminated altogether. Further research using a more inclusive database is required.
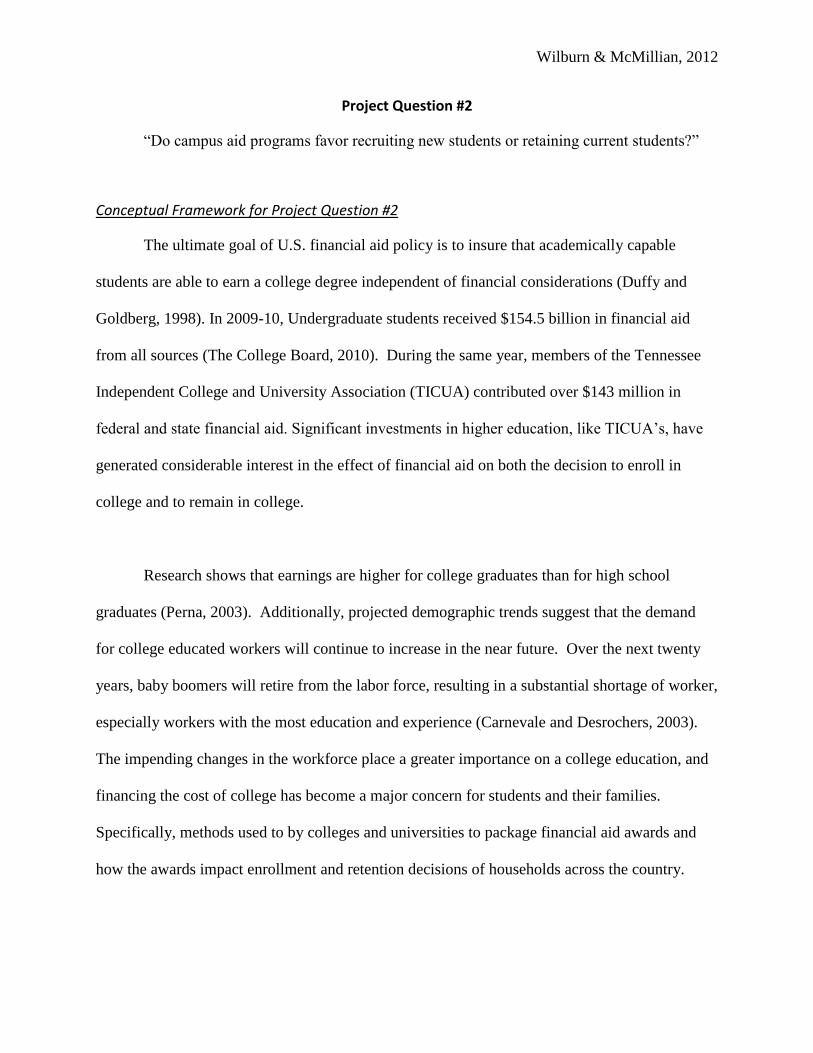
Wilburn & McMillian, 2012
Project Question #2
“Do campus aid programs favor recruiting new students or retaining current students?”
Conceptual Framework for Project Question #2
The ultimate goal of U.S. financial aid policy is to insure that academically capable
students are able to earn a college degree independent of financial considerations (Duffy and
Goldberg, 1998). In 2009-10, Undergraduate students received $154.5 billion in financial aid
from all sources (The College Board, 2010). During the same year, members of the Tennessee
Independent College and University Association (TICUA) contributed over $143 million in
federal and state financial aid. Significant investments in higher education, like TICUA’s, have
generated considerable interest in the effect of financial aid on both the decision to enroll in
college and to remain in college.
Research shows that earnings are higher for college graduates than for high school
graduates (Perna, 2003). Additionally, projected demographic trends suggest that the demand
for college educated workers will continue to increase in the near future. Over the next twenty
years, baby boomers will retire from the labor force, resulting in a substantial shortage of worker,
especially workers with the most education and experience (Carnevale and Desrochers, 2003).
The impending changes in the workforce place a greater importance on a college education, and
financing the cost of college has become a major concern for students and their families.
Specifically, methods used to by colleges and universities to package financial aid awards and
how the awards impact enrollment and retention decisions of households across the country.

Wilburn & McMillian, 2012
According to the College Board, during the last decade, tuition and fees have increased
by 2.8% while family income has declined over the same period (Figure 13). Ensuring that all
individuals have the opportunity to attend college is a critical step toward maximizing the private
and public benefits that result from higher education. Projected demographic changes and
current trends in higher education finance further underscore the need for continued attention to
college choice.
Figure 13 Percentage Growth in Mean Family Income by Quintile in Constant 2009
Dollars, 1979-1989, 1989-1999, and 1999-2009
Source Data: The College Board – Trends in Student Aid (2010).
Federal financial assistance, state finances, and institutional finances have been studied to
investigate their impacts on the choice of college on the part of the student. Perna and Titus
(2002) used multinomial analyses to conclude that four types of state public policies affect the

Wilburn & McMillian, 2012
type of college or university students choose to attend. Those policies include financial aid and
tuition. In addition to examining the influence of financial aid on enrollment, some studies
examine the amount of resources used by private colleges and universities to attract new
enrollments. Noel-Levitz (2011) found that private colleges and universities continue to spend
the most (compared to public colleges and universities) to bring in new undergraduates in 2010-
2011, spending $2,185 per new student at the median. Project question number two extends prior
work in quantifying the amount of financial aid provided to new students attending private
colleges and universities within the state of Tennessee.
Enrollment focused financial aid policies, however, are not the only subjects of interest to
college and university administrators. Policies that are retention focused are also relevant and
support the notion that “There can be no successful enrollment management program without a
successful retention management program (Dennis, 1998).” Several researchers have focused on
the influence of different sources of financial aid on retention (St. John, 1990; Nora and Rendon,
1990). St. John concluded that both tuition prices and financial aid amounts influenced a
student’s reenrollment decision. He found that the amount of all forms of financial aid received
by the student positively influenced the decision to persist. Included in the forms of financial aid
received by students were institutional aid and the total aid, both variables examined in project
question number two.
Higher education, as a whole, has become increasingly dependent on tuition revenue due
to reductions in federal and state support that have not kept pace with tuition increases over the
last two decades (e.g., McPherson and Schapiro, 1998). Moreover, an uncertain US economy,
changing demographics, and changes in federal and state financial aid policies has lead budget-
strapped universities to develop innovative strategies that allocate limited funds to financial aid
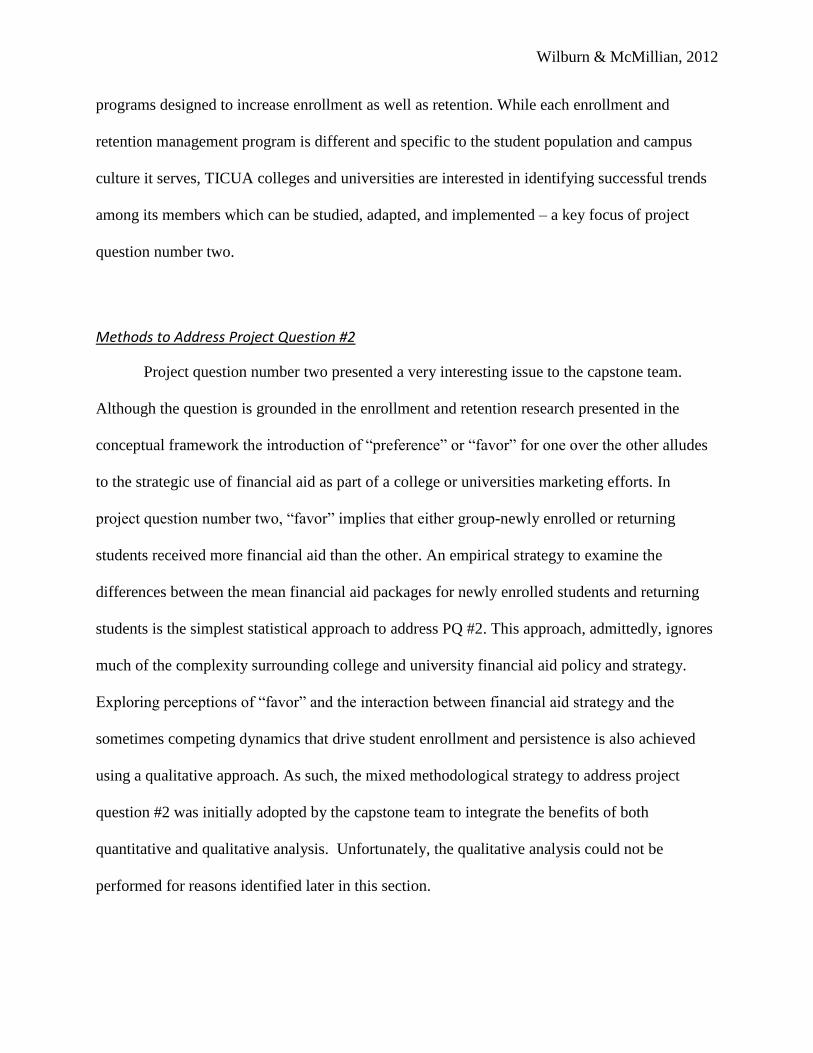
Wilburn & McMillian, 2012
programs designed to increase enrollment as well as retention. While each enrollment and
retention management program is different and specific to the student population and campus
culture it serves, TICUA colleges and universities are interested in identifying successful trends
among its members which can be studied, adapted, and implemented – a key focus of project
question number two.
Methods to Address Project Question #2
Project question number two presented a very interesting issue to the capstone team.
Although the question is grounded in the enrollment and retention research presented in the
conceptual framework the introduction of “preference” or “favor” for one over the other alludes
to the strategic use of financial aid as part of a college or universities marketing efforts. In
project question number two, “favor” implies that either group-newly enrolled or returning
students received more financial aid than the other. An empirical strategy to examine the
differences between the mean financial aid packages for newly enrolled students and returning
students is the simplest statistical approach to address PQ #2. This approach, admittedly, ignores
much of the complexity surrounding college and university financial aid policy and strategy.
Exploring perceptions of “favor” and the interaction between financial aid strategy and the
sometimes competing dynamics that drive student enrollment and persistence is also achieved
using a qualitative approach. As such, the mixed methodological strategy to address project
question #2 was initially adopted by the capstone team to integrate the benefits of both
quantitative and qualitative analysis. Unfortunately, the qualitative analysis could not be
performed for reasons identified later in this section.

Wilburn & McMillian, 2012
The quantitative analysis uses the TICUA database and the same three financial aid
variables introduced in project question #1. These financial aid variables are the total amount of
institutional aid received by the student (INSTAID), the total amount of grant and scholarship
aid received by the student (FREEAID), and the total amount of aid including loans received by
the student (TOTAID). All variables are calculated at the individual student level; however a
difference from PQ#1 is that PQ#2 examines the amount of aid awarded to freshmen in the fall
semester in comparison to the awards given to that same student as sophomores the following
year. Dependent sample t-test was used to statistically compare the means of the two classes at
the aggregate level as well as at the institutional level. To insure the data analysis performed in
this project did not simply account for inflation; all dollars are expressed in 2009 dollars. Values
for 2007 and 2008 were converted to constant 2009 dollars using the consumer price index
(CPI) provided by the Bureau of Labor Statistics.
To effectively capture the various perspectives and strategies of campus aid programs at
TICUA member schools, the capstone team used a standardized open ended survey. The survey
was modeled after an instrument developed by the College Board in conjunction with the
National Association of Student Financial Aid Administrators. This ensured face and content
validity. Face validity is established because the survey appears to measure how financial aid is
administered by TICUA member financial aid officers and content validity is established because
the survey was modeled after an instrument administered by the College Board and the National
Association of Student Financial Aid Administrators. The survey was sent to the financial aid
officers at the 34 TICUA member schools via email. The survey took approximately 20-30
minutes to complete and was sent back the capstone team to summarize the results. The campus
financial aid directors were selected due to their extensive knowledge of college and university
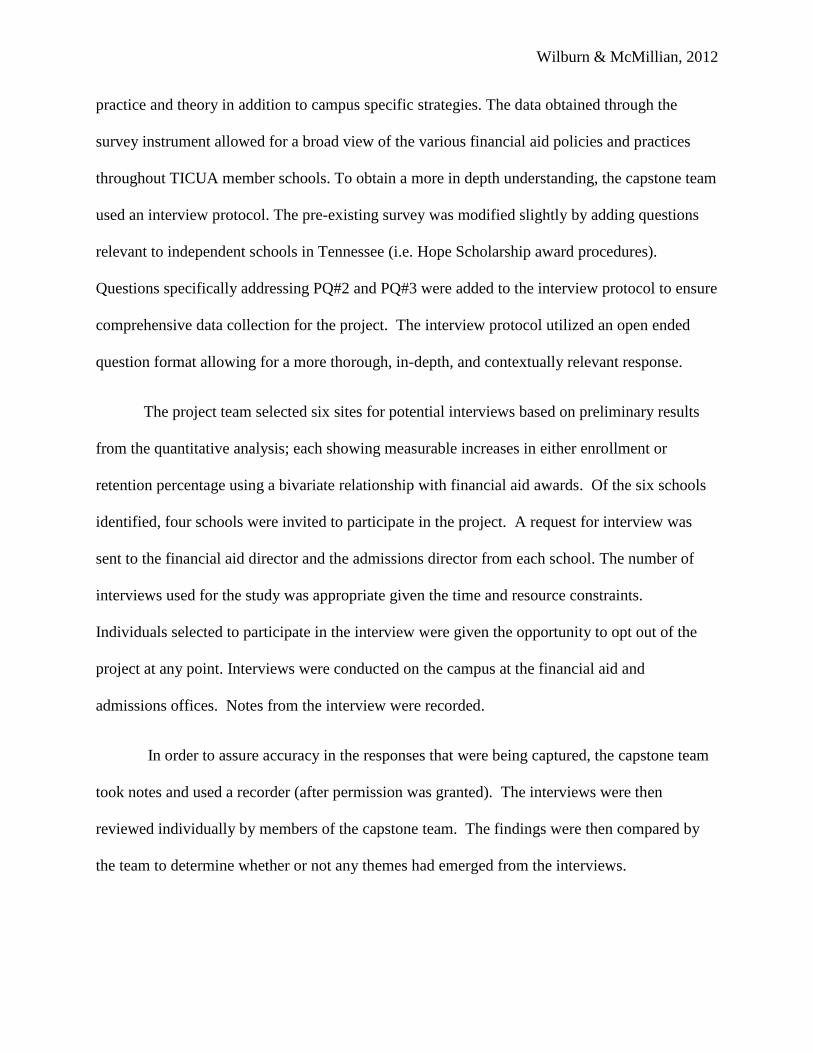
Wilburn & McMillian, 2012
practice and theory in addition to campus specific strategies. The data obtained through the
survey instrument allowed for a broad view of the various financial aid policies and practices
throughout TICUA member schools. To obtain a more in depth understanding, the capstone team
used an interview protocol. The pre-existing survey was modified slightly by adding questions
relevant to independent schools in Tennessee (i.e. Hope Scholarship award procedures).
Questions specifically addressing PQ#2 and PQ#3 were added to the interview protocol to ensure
comprehensive data collection for the project. The interview protocol utilized an open ended
question format allowing for a more thorough, in-depth, and contextually relevant response.
The project team selected six sites for potential interviews based on preliminary results
from the quantitative analysis; each showing measurable increases in either enrollment or
retention percentage using a bivariate relationship with financial aid awards. Of the six schools
identified, four schools were invited to participate in the project. A request for interview was
sent to the financial aid director and the admissions director from each school. The number of
interviews used for the study was appropriate given the time and resource constraints.
Individuals selected to participate in the interview were given the opportunity to opt out of the
project at any point. Interviews were conducted on the campus at the financial aid and
admissions offices. Notes from the interview were recorded.
In order to assure accuracy in the responses that were being captured, the capstone team
took notes and used a recorder (after permission was granted). The interviews were then
reviewed individually by members of the capstone team. The findings were then compared by
the team to determine whether or not any themes had emerged from the interviews.
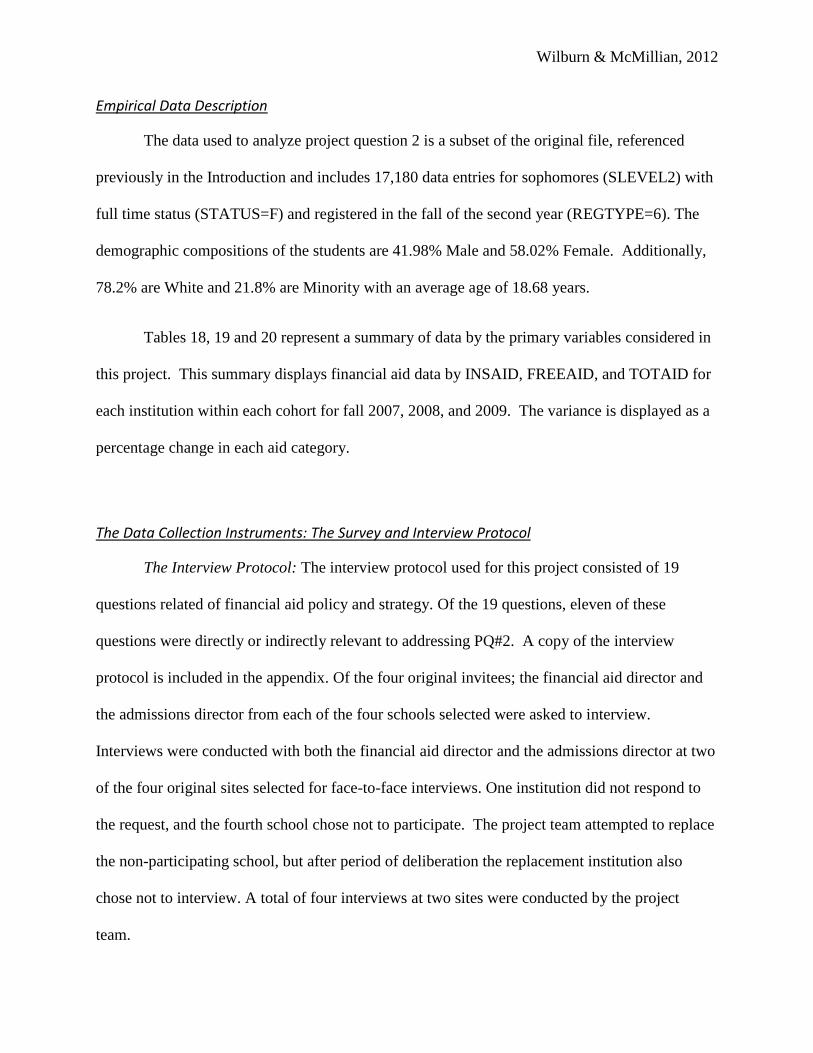
Wilburn & McMillian, 2012
Empirical Data Description
The data used to analyze project question 2 is a subset of the original file, referenced
previously in the Introduction and includes 17,180 data entries for sophomores (SLEVEL2) with
full time status (STATUS=F) and registered in the fall of the second year (REGTYPE=6). The
demographic compositions of the students are 41.98% Male and 58.02% Female. Additionally,
78.2% are White and 21.8% are Minority with an average age of 18.68 years.
Tables 18, 19 and 20 represent a summary of data by the primary variables considered in
this project. This summary displays financial aid data by INSAID, FREEAID, and TOTAID for
each institution within each cohort for fall 2007, 2008, and 2009. The variance is displayed as a
percentage change in each aid category.
The Data Collection Instruments: The Survey and Interview Protocol
The Interview Protocol: The interview protocol used for this project consisted of 19
questions related of financial aid policy and strategy. Of the 19 questions, eleven of these
questions were directly or indirectly relevant to addressing PQ#2. A copy of the interview
protocol is included in the appendix. Of the four original invitees; the financial aid director and
the admissions director from each of the four schools selected were asked to interview.
Interviews were conducted with both the financial aid director and the admissions director at two
of the four original sites selected for face-to-face interviews. One institution did not respond to
the request, and the fourth school chose not to participate. The project team attempted to replace
the non-participating school, but after period of deliberation the replacement institution also
chose not to interview. A total of four interviews at two sites were conducted by the project
team.
Wilburn & McMillian, 2012
Limitations of the Data Analysis
Despite the project team’s attempt to mitigate weaknesses and flaws in the design, data
collection and analysis for this project, some limitations still exist. The limitations for this study
include the availability only freshman and sophomore data and low participation rates for the
survey and interview.
Review of Only Freshman and Sophomore Data: Due the large amount of data available from
TICUA, the capstone team elected to limit the analysis to first and second year students for a
three year period (Entering class fall 2007 through entering class fall 2009). This will limit the
ability to generalize to third and fourth year retention at TICUCA member institutions.
Low Participation Rates for the Survey and Interview: Response bias is a major concern.
Overall response rate is one guide to the representativeness of the sample respondents. A low
response rate is problematic in that the non-respondents are likely to differ from the respondents
in ways other than just their willingness to participate in the survey. The limited number of
surveys and interviews received in this project minimizes the generalizability of the qualitative
assessments to the population because a broad range of institutions will not be represented by the
responses. The project team worked closely with TICUA administration to garner a high
response rate for the project. The project was introduced to several financial aid directors at an
annual TICUA leadership meeting in the fall of 2011. Additionally, each time the survey was
sent to member institutions, the project team had the benefit of an introduction from TICUA.
After a slow initial response rate, we asked TICUA to assist with an additional request to
member site directors, despite these efforts the response rate did not improve. Therefore, the
project team concluded the qualitative portion of the analysis would be omitted.

Wilburn & McMillian, 2012
Presentation of Findings for Project Question #2
Our first goal was to identify if differences exist between the mean financial aid awards
given to incoming freshmen versus the same group of students returning for sophomore year.
Financial aid awards given to a student in the fall semester of the freshman year were compared
to the financial aid awards given to that same student upon their return in the fall semester of the
sophomore year. The project team conducted a dependent or paired sample t-test on data for
each of the following three years: 2007, 2008, 2009 for returning students to compare the
difference in means for TOTAID, FREEAID and INSAID aggregated across the participating
TICUA institutions. To ensure the aggregation of data collected across the years of 2007, 2008,
and 2009 was unproblematic, the capstone team examined the differences between values in the
independent variables by cohort. This resulted in three separate dependent t-tests conducted –
one for each cohort. Figure 14 shows the mean total aid (including loans) awarded per students
in the fall semester of their freshman year compared to the amount of total aid received by the
same students returning in the fall semester of their sophomore year.
The values are aggregate amounts determined using all students in the TICUA database.
The dependent t-tests were conducted on a sample of students aggregated across the participating
TICUA institutions. Figure 14 indicates that, as an aggregated sample, there is little difference in
the funding a student receives in their first year versus their second year. Results for the
dependent t-tests by cohort are shown in tables 21 through 23.
A comparison of the means using a dependent “t” test resulted in no statistical difference
between the means for all cohorts and all aid packages with the exception of one – The 2008
differences in no-loan aid awarded to a student enrolling in the fall semester of their freshman

Wilburn & McMillian, 2012
year was less than the no-loan aid received by the same student enrolling in the fall semester of
their sophomore year (p<0.05). The mean difference in no-loan aid in 2008 was $185.45. This
isolated finding at the aggregate sample level provides little insight into the strategic financial aid
policy making decisions made by TICUA member schools and prompted the capstone team to
conduct a more detailed examination of financial aid trends at the institutional level.
Figure 14 – Mean TOTAID by Cohort
Source Data: Tennessee Independent College and University Association, Student
Database, and Fact Books for the years 2007, 2008, & 2009.
In addition to the aggregated dependent t-tests conducted for the three years, the project
team conducted dependent t-tests for each of the specific TICUA institutions to see if some
institutions are “favoring” students returning for their sophomore year compared to financial aid
awarded upon freshmen enrollment. The comparisons were conducted only on students that
returned for the sophomore year at the same institution. Tables 18, 19 and 20 present the
differences in the mean amount of aid aggregated at the institutional level for the three variables

Wilburn & McMillian, 2012
reviewed in this project – TOTAID, FREEAID and INSAID for each cohort - 2007, 2008, and
2009.
The dependent t-tests for each institution noted several statistically significant results for
differences in the total amount of financial aid awarded to returning students and are shown in
tables 24 through 48. To ensure the aggregation of data collected across the years of 2007, 2008,
and 2009 was unproblematic, the capstone team examined the differences between values in the
independent variables by institution by cohort. That is, three dependent t-tests were conducted
for each institution. Figure 15 shows the distribution of the number of years TICUA member
institutions committed greater financial aid packages to returning students versus new enrolled
students.
Of the 26 universities participating in the study, seven had three years in which they
awarded a greater amount of financial aid to returning students in comparison to first year
students. Six universities awarded greater amounts of aid to returning students in two of the
three years examined and another seven awarded greater amounts of aid to returning students in
one of the three years. Seven of the 26 participating TICUA member institutions had no
difference in aid amounts for returning students in comparison to newly enrolled students from
2007 to 2009.
The results shown in figure 15 divide the TICUA schools into four distinct categories –
1) Zero of three years favoring retention, 2) One of three years favoring retention, 3) Two of
three years favoring retention and 4) Three of three years favoring retention. The 26 school
participating in the study are conveniently dispersed evenly among these four categories.
Although an assessment of the effectiveness of the strategic financial aid policies for TICUA
member schools is beyond the scope of this project, the capstone team was interested in

Wilburn & McMillian, 2012
examining the characteristics and performance of the schools within the most extreme categories
- 1 (no preference for retention versus enrollment; 0 of 3 years) and 4 (strong preference for
retention versus enrollment; 3 of 3 years).
Figure 15 Number of Years in Which Retention Aid Exceeded Enrollment Aid
Intuitively one would expect that the schools favoring retention (category 4) would have
retention rates greater than schools that did not favor retention (category 1). A review of the
retention rates in table 9 for each school, however, did not support this assumption. In fact,
schools in category 1 had higher retention rates than the schools in category 4. The mean
retention rate for all TICUA member schools for 2007 – 2009 is 69.8% (table 9). TICUA
member schools in category 4 had a mean retention rate of 67.4% while TICUA member schools
in category 1 had a mean retention rate of 71.3%. Another interesting finding for member

Wilburn & McMillian, 2012
schools in category 4 was the fact that in each of the three years examined for this study, all of
the institutions had a deceased cost of attendance that ranged from 1% to 6 %( table 12).
In addition to retention rates and cost of attendance for TICUA member institutions in
category 4, the capstone team examined other background characteristics for trends using the
Carnegie Foundation for the Advancement of Teaching database. Background characteristic
examined included student population, undergraduate instructional program, enrollment profile,
undergraduate profile, size and setting, and basic classification. No trends using these
background characteristics were identified. As mentioned earlier, identifying the effectiveness
of financial aid policies favoring retention over enrollment or assessing the characteristics of
TICUA member colleges and universities that choose to employ these strategies is beyond the
scope of project question #2. A more detailed investigation using both qualitative data collection
and statistical analysis of these findings is needed prior to making any generalizations.
Summary for Project Question 2
Institutions often struggle with the most appropriate strategic approach to enrollment
management. Some choose to focus on the first year students, where others, find it easier to
retain students already on campus. The introduction of “preference” or “favor” for one over the
other alludes to the strategic use of financial aid as part of a college or universities marketing
efforts. Even with the substantial investments in financial aid programs, however, inadequate
financial resources continue to limit an institutions ability to fund programs that focus on new
student enrollment and student retention. The persistence of financial barriers despite the

Wilburn & McMillian, 2012
substantial annual investment in student financial aid programs suggest the need to better
understand the role of financial aid in promoting college opportunity (Perna and Steele, 2011).
Of the twenty six TICUA member institutions that participated in the study, nineteen had
at least one year in which they awarded more financial aid to returning students in comparison to
newly enrolled students. This finding suggests that there is a greater trend towards adopting a
financial aid strategy that “favors” retention over initial enrollment. Financial aid policies that
focus on retention versus new enrollments are not new. Hayes (2009) captures the sentiment of
this strategy, “Devoting all of the institution’s time, energy, and money to attracting new
students while making little effort to retain those already enrolled is like trying to fill a leaky
bucket.” Some college administrators admit that it is more costly to recruit a new student in
comparison to retaining a current student. The trend in TICUA member schools favoring
retention is likely due to the increased pressure for colleges and universities to improve
graduation rates coupled with the need for administrators to adopt the most economically
feasible methods to distribute financial resources from 2007 to 2009.

Project Question #3
“If aid is used as a recruiting/retention tool, what factors are used to determine which
students are more attractive and deserving of an enhanced aid package (i.e. what leveraging
strategies are used)?
Conceptual Framework for Project Question #3
Remaining in college is extremely important in higher education. The rising costs of
education, as well as the high cost of program administration mean retaining students is a means
of economic survival (Assessing the Student Attrition Problems, 1984). Attrition costs vary
across campuses and the longer a student stays at a particular college the more significant the
costs associated with losing a student become (Wetzel, et al, 1999). As concerns escalate over
student retention, attention is being focused on methods of increasing retention among college
student population (Gordon, 1995; Jurgens, 2002) and frequently on what factors will influence
successful retention of students (Mayo, Helms, and Codjoe, 2004).
Heightened competition and increased costs have been cited as factors producing changes
over the past 10-20 years in the way private colleges price their services. Supported by
historically lower cost pressure, and government policy focused on access and choice, during
much of the post-war period these colleges increased tuition at relatively low rates compared
with more recent standards (Summers, 2004). Concomitantly, moderate amounts of financial aid
provided from colleges’ own resources were used primarily to boost access to needy students.
Over the past several years, tuition has risen more rapidly while even more rapid increases in
institutional financial aid have apparently been used less to boosting access and more for
Wilburn & McMillian, 2012
strategic enrollment management purposes. These purposes include shaping the characteristic
profiles of student body while attempting to increase net tuition revenues (Summers, 2004).
A myriad of studies have noted student grades, achievement, or academic performance
consistently have an overwhelming impact on persistence (Braunstein, McGrath, and Pescatrice,
2001; Cabrera, et al, 1992; Mallette and Cabrera, 1991; Murtaugh, Burns, and Schuster, 1999;
Perna, 1997; St. John, 1989, 1990; Tinto, 1997). ACT scores and first year GPA will be used as
a proxy for academic performance in this project question.
Another factor to consider in retention and the distribution of financial aid is gender;
Tinto (1993) suggested that college persistence varies by gender. Females, he wrote “are more
likely than males to face external pressures which constrain their educational participation.”
Additionally, Leppel (2002) noted, other variables impact persistence between males and
females which require additional examination. These include the demographic variables of race
and age, as well as, the level of integration.
In light of the role tuition pricing and the awarding of financial aid play in enrollment
management, the burden of paying for college has shifted from the general public to individual
students and their families (Hu and St.John, 2001). Educational attainment for minorities and
low-income students is an important factor. Of particular impetus for underrepresented minority
students is unmet financial need; filling the gap between the costs of attending college and the
resources available to students from their families presents a major barrier to college students
from lower income families (Heller and Marin, 2004).
The structure of financial aid systems provide clear signals to students and their families
about what types of characteristics institutions are looking for in students. Research has shown
Wilburn & McMillian, 2012
that students respond to financial aid and merit aid awards in their retention decision, and that
there are differential responses for different groups of students. (Avery and Hoxby, 2003;
Monks, 2009). Due to changes in the both state and federal aid programs, the distribution of
institutional aid is a clear signal to the values of the institution. Changes in the structure of
institutional aid can provide valuable clues to the types of students that institutions wish to enroll
(Doyle, 2010)
Methods to Address Project Question #3
Project question three inquires about the factors or student characteristics that are
considered when awarding enhanced financial aid packages. The empirical strategy to address
this question is to examine the relationship between the student characteristics identified in the
conceptual framework and financial aid. The dependent variable for this analysis is financial aid.
As mentioned earlier in this project, financial aid comes in many different forms. For the
purpose of this project, the capstone team identified three financial aid constructs to be used in
answering problem questions #1 and #2. These financial aid variables are the amount of
institutional aid (INSAID), the amount of “no-loan” aid (FREEAID), and the total amount of aid
including loans (TOTAID). As stated in the conceptual framework, the structure of the financial
aid system provides a clear signal about what types of student characteristics institutions seek
while shaping their campus demographics. Of the three forms of aid constructed for this project,
aid provided by the institution to a student (INSAID) is the most appropriate and relevant in
answering problem question #3. As such, the dependent variable for this analysis is
institutional aid.
Wilburn & McMillian, 2012
A financial aid award expressed in dollars at one school, however, may have a very
different impact to a student’s ability to pay for college in comparison to another student at a
different school receiving the same dollar amount due to the differences in the cost of attendance.
For this reason, the dependent variable used in the analysis for PQ#3 is expressed as a percentage
of the total cost of attendance (STICKER). This method mirrors student aid award descriptions
used by the College Board. The resulting dependent variable is expressed as PINSAID. To
insure the data analysis performed in this project does not simply account for inflation; all dollars
are expressed in 2009 dollars. 2007 and 2008 values were converted to constant 2009 dollars
using the consumer price index (CPI) provided by the Bureau of Labor Statistics.
The independent variables, or the variables hypothesized to influence change in the
dependent variable, are student characteristics. The conceptual framework for project question
#3 identified several student characteristics that are present in the TICUA database and that the
research has identified as playing a role in a student’s decision to remain in school. These
characteristics include minority status (MINORITY), gender (GENDER), academic preparation
(ACT), and academic performance (1YRGPA). As was discussed in the methods section of
PQ#1, academic preparation (ACT) and performance (1YRGPA) data was only available for
TICUA students receiving Tennessee Education Lottery Scholarship (TELS) awards. Prior
studies have shown a relationship between these background characteristics and retention
(Munday, 1967; Rothstein, 2004) so it was important to ensure that these variables were included
in the analysis. The effect of eliminating students without this data reduces the size of the
sample and is addressed in the limitations section.
MINORITY and GENDER are binary independent variables described in detail in the
methods section of PQ#1. ACT is a numerical independent variable also described in the

Wilburn & McMillian, 2012
methods section of PQ#1. 1YRGPA is a scale independent variable that identifies an individual
student grade point average for their first year in college using a 4.0 scale. First year GPA is
often used by financial aid administrators in determining whether or not a student will continue
to receive merit based financial awards as well as the size of the financial award. Including this
variable in the analysis generated two adjustments in the design of the quantitative methods used
to address PQ#s.
The first adjustment resulting from the inclusion of 1YRGPA as an independent variable
was that only institutional aid awards in the fall semester of the sophomore year are used to
calculate the dependent variable PINSAID. Including aid amounts prior to the completion of
freshman year would result in aid being received by the student prior to the generation of the 1st
year grade point average. The second adjustment was that only students who returned for their
sophomore year are included in the study. Students departing after their freshman year did not
receive financial aid awards for the fall semester of their sophomore year for obvious reasons.
The four independent variables used in this analysis were examined for multi-collinearity.
Multi-collinearity refers to a situation in which two or more explanatory variables in a multiple-
regression model are highly linearly related. As such, the researchers were concerned about the
effects of multi-collinear relationships and its impacts to the predictive power of a multiple
regression analysis that included two or more of these variables. Results from collinearity
diagnostics conducted during the regression analysis resulted in a tolerance of 0.960 and VIF of
1.042 for MINORITY, a tolerance of 0.962 and VIF of 1.040 for GENDER, a tolerance of 0.760
and VIF of 1.316 for ACT, and a tolerance of 0.756 and 1.322 for 1st YEAR GPA. As a general
rule, tolerances less than or equal to 0.10 or VIF statistics greater than 10 are indicators of

Wilburn & McMillian, 2012
extreme multi-collinearity (Ethignton, Thomas, and Pike, 2002). In the case of all four of the
independent variables, therefore, collinearity was not an issue.
To examine the influence of the various student characteristics on the awarding of
institutional aid, the project team determined that a multiple linear regression in which the four
independent variables are included in the regression model was the most appropriate statistical
procedure. This allows the capstone team to identify the cumulative effects of the independent
variables on the dependent variable. A statistically significant finding will determine if a
relationship exists and the resulting regression coefficient obtained for each student characteristic
is interpreted as an indicator of the strength of the influential effect. This analysis is conducted
for the aggregate sample for 2007, 2008 and 2009 – one regression for the consolidated sample.
To ensure the aggregation of data collected across the years of 2007, 2008, and 2009 was
unproblematic, the capstone team examined the differences between values in the independent
variables across all three years. These values are shown in tables 13 and 14. Due to the very
small changes in aid across the three years examined (no greater than 1.8%) the differences were
considered negligible for the analysis.
Empirical Data Description
The data used to analyze project question 3 is a subset of the original file, referenced
previously in the introduction and includes 8,670 data entries for sophomores (SLEVEL2) with
full time status (STATUS=F) registered in the fall of the second year (REGTYPE=6) and
receiving Tennessee Education Lottery Scholarship funds (TELS Amount >0). The demographic
compositions of the students are 40.2% Male and 59.8% Female. Additionally, 83.5% are White
and 16.5% are Minority with an average ACT score of 24.2 and average first year GPA of 3.11.
Wilburn & McMillian, 2012
Limitations of the Data Analysis
Despite the project team’s attempt to mitigate weaknesses and flaws in the design, data
collection and analysis for this project, some limitations still exist. A discussion of the
limitations to this project due to Omitted Data on Student Background Characteristics, Review of
Only Freshman and Sophomore Data, and Limited Data on Student Academic Achievement
were discussed in the limitations section of PQ#1 and also apply to PQ#3. The limitations
unique to problem question #3 include the limited data on student academic performance in the
first year of college.
Limited Data on Student Academic Performance in the First Year of College – The TICUA
database does include information on student academic achievement and preparation in the form
of high school GPA, SAT, and ACT scores. Information on student first year performance is
also included, however, TICUA member schools are only required to report this information if
the student is receiving financial assistance from the Tennessee Education Lottery System
(TELS). First year college grade point average is a critical element in an institution’s decision to
award financial aid. Failing to include this variable in the analysis conducted in PQ#3 would
increase the chance of a type I error. Of the 25,171 TICUA students included in the original data
set 8,670 received financial assistance from TELS (34.4%). For this group, the relationships of
ACT and 1st year college grade point average to institutional aid were examined.

Wilburn & McMillian, 2012
Presentation of Findings for Project Question #3
The goal of project question three was to identify what factors are used by TICUA
member institutions to determine which students are more attractive and deserving of an
enhanced aid package. We accomplished this through multiple linear regression using
institutional aid as the dependent variable. Four student characteristics included in the TICUA
database - ACT, Gender, 1YRGPA and ACT scores, were included in the regression model for
students who re-enrolled at the same institution for their sophomore year. The results from this
linear regression are highlighted in table 50. For each of the four independent variables the
capstone team considered two questions 1) What is the nature of the relationship? and 2) Is the
relationship statistically significant? Finally, the capstone team examines how powerful the
model is in explaining the variation in institutional aid.
Students with higher ACT scores tend to receive higher amounts of institutional aid than
students with lower ACT scores. The standardized regression coefficient for ACT score is
positive and statistically significant (0.246, p<0.001; unstandardized coefficient 0.013, p<0.001)
indicating that increases in ACT score correspond with an increase in aid. Of note is the fact that
of the four independent variables included in the regression model, ACT score has the strongest
relationship with institutional aid – the greatest standardized regression coefficient in the
regression model calculated for problem question 3. This result is not surprising given that
academic preparation and performance is one of the strongest predictors of persistence
(Braunstein, McGrath, and Pescatrice, 2001). Institutional financial aid policies focused on
improving retention are likely to award higher merit based aid in the form of institutional aid to
students with higher ACT scores. The unstandardized coefficient in the first column of table 50
is interpreted as the strength of the relationship between ACT scores and institutional aid. Due

Wilburn & McMillian, 2012
to the multivariate model used in this analysis, this relationship is the unique effect of ACT on
institutional aid after accounting for the other independent variables in the model. For every 1
point increase in a student’s ACT score, the amount of institutional aid expressed as a percentage
of total cost of attendance that a student receives is increased by 1.3%.
The next variable reviewed for project question three was Gender. The relationship
between a student’s gender and institutional aid is not statistically significant.
Minority students tend to receive more institutional aid than White students. The
standardized regression coefficient (0.070, p<0.001; unstandardized coefficient 0.042, <0.001)
for the minority independent variable was positive and statistically significant.
As noted in the methods section of problem question number 3, the independent variable
MINORITY is a binary variable with White students coded as “0” and students of minority
coded as “1.” As such, there is only one unit difference within this independent variable. The
unstandardized regression coefficient measures the size of the difference in the dependent
variable that corresponds with a one-unit difference in the binary independent variable and, in
this case, is interpreted as the difference in institutional aid expressed as a percentage of total
cost of attendance that a minority student receives in comparison to a White student. For the
aggregate data for 2007 to 2009, Minority students reenrolling for their sophomore year and
receiving TELS awards received 4.2% more institutional aid that White students with
institutional aid being expressed as a percent of the total cost of attendance.
Students with higher first year grade point averages tend to receive more institutional aid
than students with lower first year grade point averages. The standardized regression coefficient
(0.068, p<0.001; unstandardized coefficient 0.024, p<0.001) for the 1YRGPA independent
variable was positive and statistically significant. The 1YRGPA is a measure of academic

Wilburn & McMillian, 2012
achievement. Students with higher levels of academic achievement generally receive more
consideration in financial aid distribution specifically in the form of merit based awards. For
every 1 point increase in a student’s first year grade point average, the amount of institutional aid
expressed as a percentage of total cost of attendance that a student receives is increased by 2.4%.
The capstone team examined the strength of the regression model by assessing the
adjusted R square statistic. The adjusted R square statistic compensates for the number of
variables in the model and is used to determine how accurate the model is. The adjusted R
square for the regression model used in this analysis is 0.079. This means that only 7.9% of the
variation in the amount of institutional aid a student receives can be attributed to the four
independent variables – MINORITY, GENDER, ACT, and 1YRGPA. The remaining variation
in the amount of institutional aid received by students is accounted for by variables not examined
in this study.
Summary for Project Question Three
There have been several studies that investigate the distribution of institutional aid to
students. These studies typically investigate the extent to which student characteristics are
associated with higher or lower amounts of institutional aid. Student factors examined often
include GPA, SAT or ACT scores, gender and race/ethnicity (Doyle, 2010). Of the four
characteristics examined in this project, three (ACT, 1YRGPA, MINORITY) were found to play
a role in the amount of institutional aid a TICUA student receives.
The results noting that TICUA students with higher ACT scores and first year college
grade point averages receiving greater amounts of institutional aid are not surprising given that
academic achievement is a strong predictor of persistence. In fact, a study by Boschung et al.
(1998) had similar results also finding that academic ability led to higher amounts of financial
Wilburn & McMillian, 2012
aid. ”Students who achieve academically are more likely to persist… and academic achievement
may be the one factor that supersedes all others (Braunstein, McGrath, and Pescatrice, 2001).”
The capstone team found that a one point increase in a student’s ACT score corresponds
to a 1.3% increase in institutional aid and a one point increase in a student’s first year GPA
results in a 2.4% increase in institutional aid. Although these values are statistically significant,
from a policy making standpoint, the question of “substantive” significance is important.
Substantive significance referrers to the extent to which the findings answer the questions “So
What?” or “How much does it matter?” To answer the question of substantive significance as
well as add context to the findings, an example using information from the TICUA database is
required.
As mentioned earlier, the institutional aid variable is expressed as a percentage of the
total cost of attendance. This variable may be converted to a dollar amount by multiplying the
variable, a percentage, by the total cost of attendance. The average total cost of attendance for a
TICUA member school in 2009 was $25,241 (table 12). Using the regression coefficient above,
a one point increase in a student’s ACT score corresponds to a $328.13 ($25,241 x 1.3%)
increase in institutional aid per year. A one point increase in a student’s GPA corresponds to a
$605.78 ($25,241 x 2.4%) increase in institutional aid per year. This example provides context
to the regression coefficients calculated in the analysis. Extending the effects of these increases
in aid beyond the current regression model is problematic and beyond the scope of the analysis
conducted for problem question 3.
The regression analysis performed in this project revealed that Minority students
reenrolling for their sophomore year and receiving TELS awards receive 4.2% more institutional
aid that White students in the 2007 to 2009 aggregate data. Using the context building technique
Wilburn & McMillian, 2012
above, this results in minority students receiving an amount of institutional aid $1,060 per year
greater that White students. It is likely that the greater amount of aid afforded to minority
students is a purposeful effort by TICUA member colleges and universities to increase the
diversity of their campus. Data on college participation rates by race indicate a large disparity
between white and Asian American students, who have higher college-going rates, and African
Americans and Hispanics, who attend college at lower rates (Heller and Marin, 2002). “Clearly,
financial aid is critical for students to afford to attend and persist in postsecondary educational
opportunities” (Hu and St. John, 2001). Further understanding of the influence of financial aid
awards on persistence by diverse groups can help inform policymakers and institutional
administrators about strategies that can equalize opportunity and improve institutional diversity
(Hu and St. John, 2001).
The use of Institutional aid by TICUA member institutions may have broad implications
on enrollment management at respective institutions. Many colleges and universities use
institutional aid as the last dollar for financial aid packages to “sweeten” the pot for perspective
students. In the past, one’s ability to pay was the primary determinant of how much financial
aid a college bound student would receive. Increasingly, one’s desirability to an institution as a
talented student is becoming more important determining the financial aid package (Monks,
2008). As a result, schools are becoming increasingly creative in packaging and awarding
institutional aid to those students they would like to attract to their campuses (Monks, 2008).
The strongest characteristics noted in this study for higher amounts of institutional aid
were academic achievement (ACT scores and 1YRGPA) and minority status. The positive
effects of these factors found in the analysis of the TICUA database are not the only influencing
factors, however, given the low percent of variance explained (0.077) calculated for the

Wilburn & McMillian, 2012
regression model. It is likely that when the effects of other factors, such as family income, are
added to the regression analysis performed in this study, the effects of the independent variables
mentioned above will decrease or be eliminated altogether. Further research using a more
inclusive database is required.
Wilburn & McMillian, 2012
Conclusions
The purpose of this project was to provide additional information and insight on what
impetus encourages students (with family input) to attend member institutions and to persist at
the respective institution. Three project questions addressing financial aid policies, practices and
procedures were examined. This section summarizes the findings of each of these three
questions.
The first question asked, from the perspective of the students and their families, is there a certain
grant/scholarship aid amount that serves as the “tipping point” for retention. This analysis found that
an institutional aid package of 75% of the cost of attendance has the greatest effect in predicting
student reenrollment. For students receiving TELs awards, the analysis found that an
institutional aid package of 68% of the cost of attendance has the greatest effect in predicting
student reenrollment. No tipping point was found for no-loan or total aid packages including
loans. It is tempting to state that the difference between the awards for all TICUA students and
TELs student awards is a result of the injection of academic preparation/performance (SAT/ACT
score) into the logistic regression equation. This generalization would be premature, however.
Caution must be given to the use of these values, however. The data analysis identified these aid
amounts based upon student level data consolidated at the TICUA level. As such, student level
data at the institutional level may yield very different results.
The next question posited by TICUA was if campus aid programs favor recruiting new
students or retaining current students. Of the twenty six TICUA member institutions that
participated in the study, nineteen had at least one year in which they awarded more financial aid
to returning students in comparison to newly enrolled students. This finding suggests that there
Wilburn & McMillian, 2012
is a greater trend towards adopting a financial aid strategy that “favors” retention over initial
enrollment. The trend in TICUA member schools favoring retention is likely due to the
increased pressure for colleges and universities to improve graduation rates coupled with the
need for administrators to adopt the most economically feasible methods to distribute financial
resources from 2007 to 2009.
The final question examined by the capstone team was if aid is used as a
recruiting/retention tool, what factors are used to determine which students are more attractive
and deserving of an enhanced aid package (i.e. what leveraging strategies are used)? Of the four
factors or student characteristics examined by the capstone team, minority, ACT score, and first
year college GPA had positive relationships with institutional aid packages. This finding
suggests that colleges and universities are using leveraging strategies to shape the demographics
of their respective campus while simultaneously attempting to attract and retain students with the
academic preparation and performance indicators that have been found to increase retention
rates.
Wilburn & McMillian, 2012
Recommendations and Suggestions
The value of institutional aid cannot be overemphasized for private college and universities
This recommendation is based upon the empirical findings of the linear regressions and
polynomial regressions performed in problem question #1. Institutional aid is the strongest
predictor of whether or not a student will reenroll following the freshman year. It’s sizeable
contributions to a student/family’s ability to pay for higher education and the strong message it
sends about the commitment of the institution to the student sets it apart from any other form of
aid. The different motives underlying institutional aid policies can lead to different distributional
patterns as seen by the data presented in project question #1. No-loan aid provides a only a
slightly lower predictive power of re-enrollment, however, with the availability of private, state,
and federal aid becoming more and more uncertain due to economic unpredictability, TICUA
colleges and universities are better served by establishing aid policies that capitalize on
providing institutional aid in an amount that will ensure the enrollment missions are met while
simultaneously allowing for the allocation of resources to programs focused on retention.
Although the analysis conducted in this report suggest that an institutional aid package of 75%
(68% for TELs students) of the total cost of attendance is the most effective aid package for all
students attending TICUA schools, college administrators are encouraged to identify their own
effective pricing benchmarks and “tipping points” that account for the unique institutional effects
of their campus.
Wilburn & McMillian, 2012
Encourage collaboration and the sharing of best practices through recognition
This recommendation is based upon experiences encountered with data collection and
participation from TICUA member schools throughout the conduct of this study. Empirical and
qualitative studies that explore the nature of college access and student retention inform
administrators and policymakers of how colleges and universities can more effectively help
students meet their educational goals. Through public sharing and assessment of established
enrollment and retention initiatives, college and university administrators can learn what has and
has not worked in various institutional settings. The shared ideas can then be assessed regarding
potential values for other college campuses. In many cases, however, the most difficult task
amongst peers in a competitive market is the act of collaboration and sharing best practices.
To better promote cooperation and a more intimate sharing of best practices, the capstone
team recommends that TICUA member colleges and universities be publically recognized
amongst their peers for effective programs in enrollment and retention. As the clearing house of
private college and university data in the state of Tennessee, TICUA, along with the
collaboration of its members, should establish metrics that reflects the organization’s mission as
well as the mission of its member colleges and universities in regards to retention and
enrollment.
Wilburn & McMillian, 2012
Adopt Financial Aid Strategies and Polices that Meet Institutional Goals for Retention and
Enrollment
This recommendation is based upon findings in problem question #2 that found that
TICUA member schools have a greater trend towards adopting a financial aid strategy that favor
retention over initial enrollment. With university budgets becoming more and more constrained,
identifying a financial aid strategy that meets the institutional goals for retention and enrollment
is critical. For some institutions, maintaining a balanced approach to the distribution of financial
aid between enrollment and retention will facilitate a sustained growth. Too often, university
administrators are overly focused on meeting enrollment goals rather than keeping those
enrolled. If an institution has a system or systems in place focused on retaining students,
however, the adverse budgetary effects of a high student departure rate may be avoided. Hayes
(2009) notes that the cost of keeping a student does not nearly approach the cost of enrolling a
new one. TICUA member administrators should carefully evaluate the delicate balance between
institutional funds used for recruitment and retention. Developing a balance appropriate for each
specific institution could lead to additional efficiencies in enrollment management.
Include information critical to studies on retention and enrollment in the TICUA database
This recommendation is based upon experience working with the TICUA database and an
examination of the literature on retention and enrollment studies. As one can observe while
reading this report, there are no shortage of studies examining the effects of financial aid on
enrollment and retention. A reoccurring and traditional theme in the most credible and heavily
cited studies examining these complex issues is that in the absence of many other unobservable

Wilburn & McMillian, 2012
variables that affect enrollment and retention, certain background characteristics MUST be
included to avoid the occurrence of spurious effects. These background characteristics include,
at a minimum, race, gender, age, family income, parental education, academic preparation, and
academic performance.
The TICUA database currently contains information on race, gender, and age for all its
members; however, indicators of academic preparation in the form of high school GPA, ACT
and SAT scores are only available for students receiving Tennessee Education Lottery funds.
The same holds true for academic performance. Information on college GPA is only required for
TELS students. No information is collected on student/family income or parental education
level. This creates issues for both the internal and external validity of any analytical findings on
financial aid policy using the TICUA database.
Another addition to the TICUA database that would be extremely valuable for
researchers looking to identify the most effect financial aid policies for member colleges and
universities is the inclusion of data on students who were offered financial aid packages by
TICUA member schools, however, chose not to enroll. The capstone team acknowledges that
information on offers made and not accepted gives unprecedented insight into the strategical
marketing efforts of a college. These practices are commonly protected within the respective
institution and are not likely to be released without guarantees of anonymity and safeguarding.
The advantages to having such information for higher education research would prove incredibly
valuable in establishing comparison groups that could be examined at the student, institutional,
and state level.

Wilburn & McMillian, 2012
Refine and improve data entry into the TICUA database
This recommendation is based upon experience working with the TICUA for this
capstone project in which more detailed analysis was not possible due to the limitations of the
database. The Tennessee Independent Colleges and Universities Association (TICUA) collects
student level enrollment and completions data from each of its member institutions and stores
this information in a database. The purpose of the database is to allow the private colleges and
universities in the state to understand the enrollment characteristics and patterns of the students
attending and graduating from their institutions. To ensure proper formatting of data submitted to
TICUA by its members, TICUA uses an enrollment data checking program. So long as members
input data in accordance with the formatting variables examined by the program, the information
is accepted and stored. What the program does not do, however, is to check the accuracy of the
data submitted for erroneous entries. In some cases, the capstone team found total financial aid
packages in excess of 250% the total cost of attendance. This created an obvious issue with the
integrity of the analysis conducted.
The capstone team makes several recommendations in regards to the database. To assist
in analyzing financial aid data beyond institutional characteristics and trends, the TICUA
database should include mutually exclusive variables that capture the amount of aid awarded at
the institutional, community/private, state, and federal level. At each of these levels
scholarships, grants, and loans should be broken out as their own variables – also mutually
exclusive of the other variables. Next, the costs of attending college – tuition, fees, room &
board, travel, etc. should also be broken out into their own separate variables mutually exclusive
of each other. The total cost of attending an institution (sum of all costs) could then be used as
metric for identifying and correcting erroneous data. The more specific information on

Wilburn & McMillian, 2012
institutional costs and the various aid packages would also enable TICUA researchers to extend
their analysis of TICUA schools beyond descriptive trends and characteristics.
Wilburn & McMillian, 2012
Closing Thoughts
The determination of financial aid packages by colleges and universities play a
significant role in the retention decision for students and their families. The findings within this
project, hopefully, will serve as an important impetus to reinvigorating more detailed research
and collaboration within and amongst TICUA member schools. This research may come in the
form of refining the influence various types of financial aid play in the student departure puzzle.
Or, perhaps, increased sharing of best practices used to increase a student’s ability to pay for
college while simultaneously increasing the diversity of the college campus. Through such
efforts to meet either of these noble goals, TICUA member institutions, students, families, and
the body of literature surrounding retention become the benefactors.
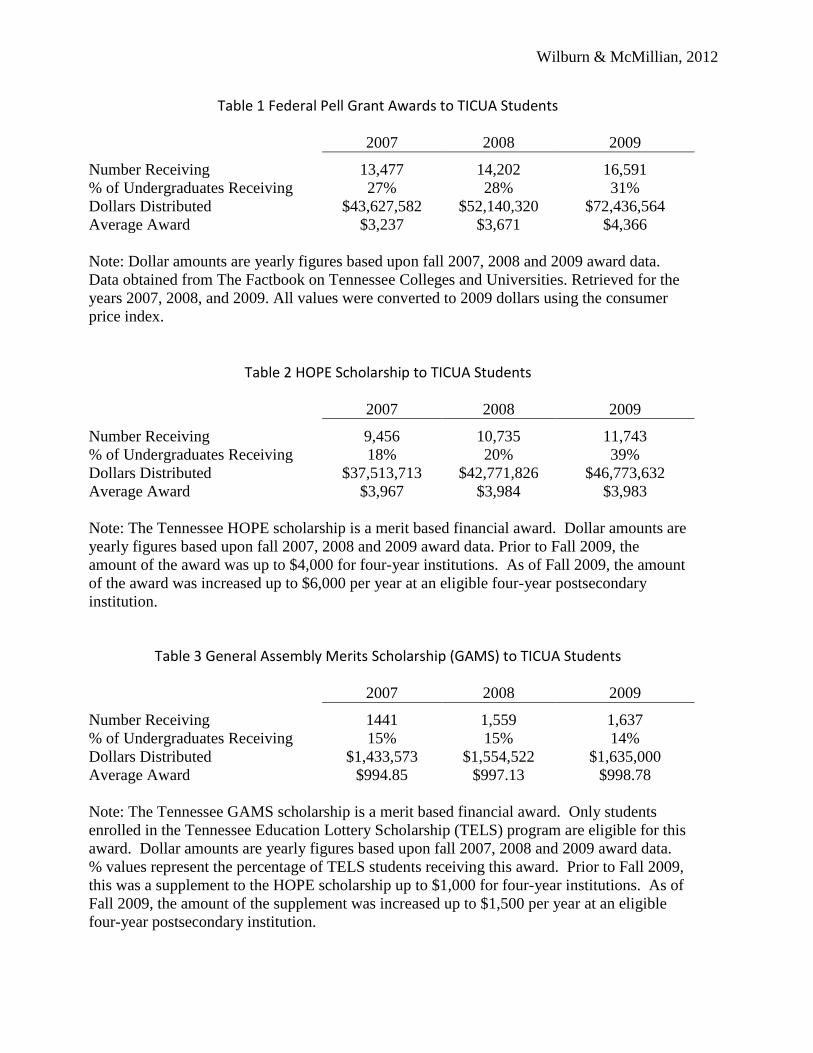
Wilburn & McMillian, 2012
Table 1 Federal Pell Grant Awards to TICUA Students
2007 2008 2009
Number Receiving 13,477 14,202 16,591
% of Undergraduates Receiving 27% 28% 31%
Dollars Distributed $43,627,582 $52,140,320 $72,436,564
Average Award $3,237 $3,671 $4,366
Note: Dollar amounts are yearly figures based upon fall 2007, 2008 and 2009 award data.
Data obtained from The Factbook on Tennessee Colleges and Universities. Retrieved for the
years 2007, 2008, and 2009. All values were converted to 2009 dollars using the consumer
price index.
Table 2 HOPE Scholarship to TICUA Students
2007 2008 2009
Number Receiving 9,456 10,735 11,743
% of Undergraduates Receiving 18% 20% 39%
Dollars Distributed $37,513,713 $42,771,826 $46,773,632
Average Award $3,967 $3,984 $3,983
Note: The Tennessee HOPE scholarship is a merit based financial award. Dollar amounts are
yearly figures based upon fall 2007, 2008 and 2009 award data. Prior to Fall 2009, the
amount of the award was up to $4,000 for four-year institutions. As of Fall 2009, the amount
of the award was increased up to $6,000 per year at an eligible four-year postsecondary
institution.
Table 3 General Assembly Merits Scholarship (GAMS) to TICUA Students
2007 2008 2009
Number Receiving 1441 1,559 1,637
% of Undergraduates Receiving 15% 15% 14%
Dollars Distributed $1,433,573 $1,554,522 $1,635,000
Average Award $994.85 $997.13 $998.78
Note: The Tennessee GAMS scholarship is a merit based financial award. Only students
enrolled in the Tennessee Education Lottery Scholarship (TELS) program are eligible for this
award. Dollar amounts are yearly figures based upon fall 2007, 2008 and 2009 award data.
% values represent the percentage of TELS students receiving this award. Prior to Fall 2009,
this was a supplement to the HOPE scholarship up to $1,000 for four-year institutions. As of
Fall 2009, the amount of the supplement was increased up to $1,500 per year at an eligible
four-year postsecondary institution.
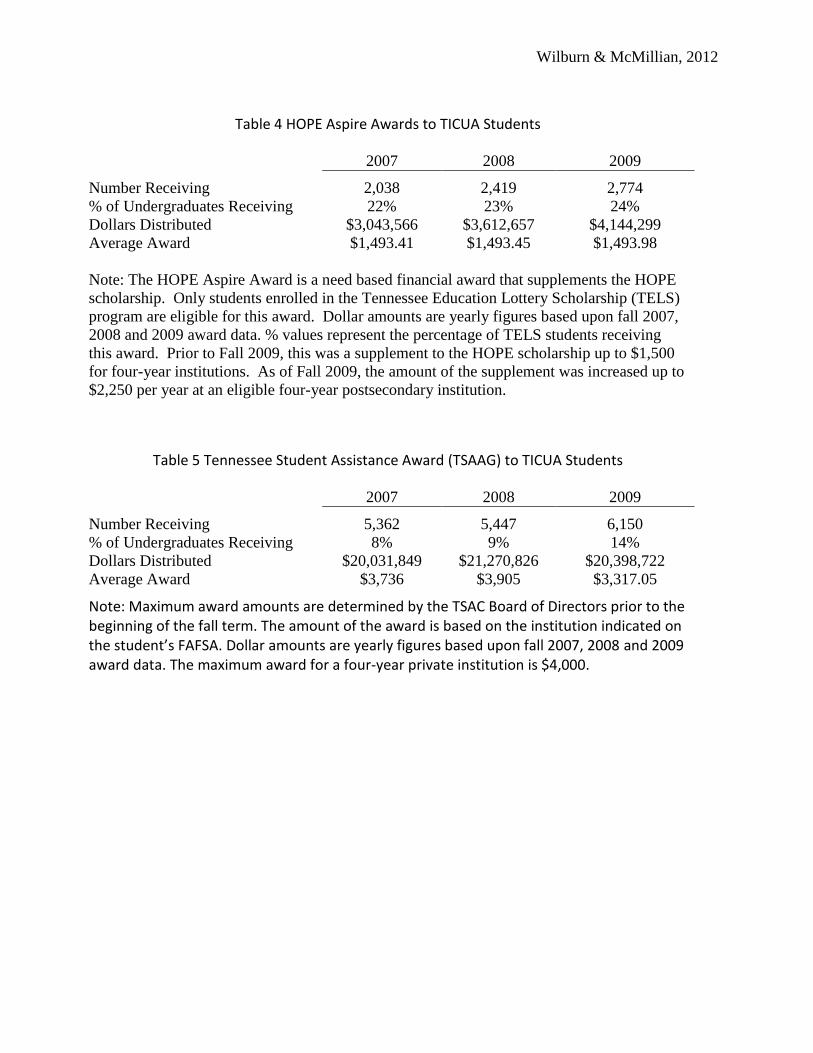
Wilburn & McMillian, 2012
Table 4 HOPE Aspire Awards to TICUA Students
2007 2008 2009
Number Receiving 2,038 2,419 2,774
% of Undergraduates Receiving 22% 23% 24%
Dollars Distributed $3,043,566 $3,612,657 $4,144,299
Average Award $1,493.41 $1,493.45 $1,493.98
Note: The HOPE Aspire Award is a need based financial award that supplements the HOPE
scholarship. Only students enrolled in the Tennessee Education Lottery Scholarship (TELS)
program are eligible for this award. Dollar amounts are yearly figures based upon fall 2007,
2008 and 2009 award data. % values represent the percentage of TELS students receiving
this award. Prior to Fall 2009, this was a supplement to the HOPE scholarship up to $1,500
for four-year institutions. As of Fall 2009, the amount of the supplement was increased up to
$2,250 per year at an eligible four-year postsecondary institution.
Table 5 Tennessee Student Assistance Award (TSAAG) to TICUA Students
2007 2008 2009
Number Receiving 5,362 5,447 6,150
% of Undergraduates Receiving 8% 9% 14%
Dollars Distributed $20,031,849 $21,270,826 $20,398,722
Average Award $3,736 $3,905 $3,317.05
Note: Maximum award amounts are determined by the TSAC Board of Directors prior to the beginning of the fall term. The amount of the award is based on the institution indicated on the student’s FAFSA. Dollar amounts are yearly figures based upon fall 2007, 2008 and 2009 award data. The maximum award for a four-year private institution is $4,000.

Wilburn & McMillian, 2012
Table 6 Annual Freshman Institutional Aid (US Dollars)
2007-08
2008-09
2009-10
Cumulative
% Change
07’ to 09’
Annual
% Change
07’ to 09’
Albatross University 11400 12919 15754 43% 20%
Condor College 6667 7091 7712 20% 10%
Crane University 7526 7871 7805 7% 4%
Eagle College 14586 14385 15951 13% 6%
Emu College 9335 10403 5333 -41% -15%
Falcon College 11433 12932 15056 36% 17%
Finfoot College 1464 2445 987 -30% 13%
Flamingo University 8899 9781 10519 22% 11%
Goose College 3947 3919 4198 10% 5%
Grebe College 4617 3929 4640 4% 3%
Grouse College 6848 8196 9552 44% 20%
Hawk University 2778 1865 1303 -51% -30%
Heron College 8896 7530 7849 -9% -4%
Kiwi University 8764 8917 8863 5% 2%
Maleo University 5650 5362 8026 47% 23%
Osprey University 11178 10974 12186 13% 6%
Ostrich College 11708 11345 12904 14% 7%
Pelican College 7104 7117 7425 8% 4%
Penguin University 6660 6677 7512 17% 8%
Petrel University 4284 5111 5457 32% 15%
Pintail College 418 551 220 -46% -10%
Quail University 7548 7897 7088 -3% -1%
Rail University 5128 3216 5291 7% 13%
Stork University 4508 4560 5130 18% 9%
Sungrebe University 5456 5026 5909 12% 6%
Swan University 6776 7033 7318 12% 6%
Tinamou College 4339 1546 1541 -63% -33%
AVERAGE
6960
6985
7464
2% 2%
Notes: These results are from the TICUA database on undergraduate, graduate, and professional students.
Dollar amounts are expressed in 2009 dollars. Only aid provided by the institution is included in the
dollar amounts. Standard deviations by year were 2007: +/-$3,328, 2008: +/- $3,688, 2009 +/-$4,270. To
identify the cumulative change from 2007 to 2009, the total difference between the amount of institutional
aid awarded to each student in 2007 and 2009 was divided by the amount of institutional aid awarded to
each student in 2009. The average percent change was calculated by averaging the mean change between
2007 and 2008 and the mean change between 2008 and 2009. Individual student data is grouped by
institution. Sample size (n) = 25,171. Number of institutions = 27.

Wilburn & McMillian, 2012
Table 7 Annual Tuition and Fees (US Dollars)
2007-08
2008-09
2009-10
Mean %
Change 07’
to 09’
Albatross University $31,724 $31,594 $34,172 8%
Condor College $17,128 $16,979 $18,638 9%
Crane University $14,900 $15,141 $15,120 1%
Eagle College $26,230 $25,988 $27,971 7%
Emu College $20,187 $19,828 $21,860 8%
Falcon College $31,716 $31,291 $33,710 6%
Finfoot College $10,676 $9,951 $10,318 -3%
Flamingo University $21,377 $20,792 $22,600 6%
Goose College $12,812 $12,620 $13,534 6%
Grebe College $16,886 $16,414 $17,860 6%
Grouse College $16,090 $16,443 $18,600 16%
Hawk Bible College $7,429 $7,503 $8,610 16%
Heron College $17,988 $18,198 $19,530 9%
Kiwi University $19,266 $18,912 $20,940 9%
Maleo University $20,466 $20,358 $22,360 9%
Osprey University $22,101 $21,795 $23,730 7%
Ostrich College $19,930 $19,849 $21,880 10%
Pelican College $17,166 $17,166 $18,702 9%
Penguin University $17,394 $17,919 $20,390 17%
Petrel University $16,137 $15,970 $17,112 6%
Pintail College $7,884 $7,493 $8,000 1%
Quail University $16,090 $16,125 $17,430 8%
Rail University $16,162 $15,662 $17,000 5%
Stork University $11,156 $10,699 $11,560 4%
Sungrebe University $13,650 $13,367 $147,300 5%
Swan College $11,992 $11,806 $12,242 2%
Tinamou College $15,396 $15,286 $17,180 12%
AVERAGE $17,405 $17,228 $18,717 7%
Notes: The results for tuition and fees for each school were provided by TICUA. Tuition is
priced for an academic year (two semesters) taking 15 credits each semester. Dollar amounts are
expressed in 2009 dollars. Only mandatory fees are included. The annual % change is calculated by
averaging the mean change between 2007 and 2008 and between 2008 and 2009. Individual
student data is grouped by institution. Sample size (n) = 25,171. Number of institutions = 27.

Wilburn & McMillian, 2012
Table 8 Freshman Full-time Enrollment Trends
2007-08
2008-09
2009-10
Average %
Change 07’
to 09’
Albatross University 394 407 396 0%
Condor College 171 164 146 -8%
Crane University 206 238 290 19%
Eagle College 317 319 301 -3%
Emu College 187 167 206 6%
Falcon College 436 463 421 -1%
Finfoot College 74 105 137 36%
Flamingo University 69 99 99 22%
Goose College 51 58 45 -4%
Grebe College 211 200 175 -9%
Grouse College 149 239 232 29%
Hawk University 159 113 116 -13%
Heron College 249 285 309 11%
Kiwi University 412 408 482 9%
Maleo University 785 914 967 11%
Osprey University 309 297 292 -3%
Ostrich College 176 179 198 6%
Pelican College 422 441 501 9%
Penguin University 546 612 566 2%
Petrel University 406 486 426 4%
Pintail College 543 597 646 9%
Quail University 196 191 186 -3%
Rail University 155 101 94 -21%
Stork University 699 792 798 7%
Sungrebe University 372 388 382 1%
Swan University 181 249 299 29%
Tinamou College 21 31 22 9%
TOTAL/AVERAGE 7896 8543 8732 5%
Notes: These results are from the TICUA database on undergraduate, graduate, and professional
students. Only freshman students (SLEVEL=1) enrolled full-time (ENROLL=F) in the fall
semester (TERM=1) for the academic year (YEAR) 2007, 2008, and 2009 are included. The
annual % change is calculated by averaging the mean change in enrollment between 2007 and
2008 and between 2008 and 2009. Individual student data is grouped by institution. Sample size
(n) = 25,171. Number of institutions = 27.
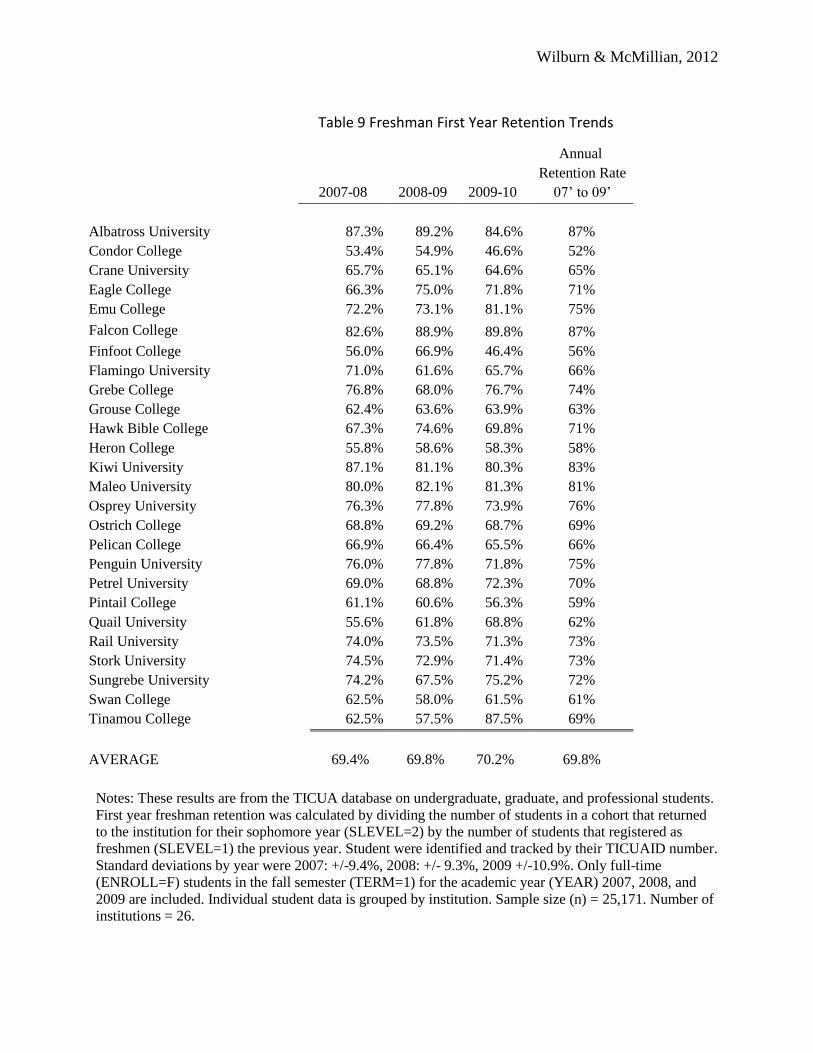
Wilburn & McMillian, 2012
Table 9 Freshman First Year Retention Trends
2007-08
2008-09
2009-10
Annual
Retention Rate
07’ to 09’
Albatross University 87.3% 89.2% 84.6% 87%
Condor College 53.4% 54.9% 46.6% 52%
Crane University 65.7% 65.1% 64.6% 65%
Eagle College 66.3% 75.0% 71.8% 71%
Emu College 72.2% 73.1% 81.1% 75%
Falcon College 82.6% 88.9% 89.8% 87%
Finfoot College 56.0% 66.9% 46.4% 56%
Flamingo University 71.0% 61.6% 65.7% 66%
Grebe College 76.8% 68.0% 76.7% 74%
Grouse College 62.4% 63.6% 63.9% 63%
Hawk Bible College 67.3% 74.6% 69.8% 71%
Heron College 55.8% 58.6% 58.3% 58%
Kiwi University 87.1% 81.1% 80.3% 83%
Maleo University 80.0% 82.1% 81.3% 81%
Osprey University 76.3% 77.8% 73.9% 76%
Ostrich College 68.8% 69.2% 68.7% 69%
Pelican College 66.9% 66.4% 65.5% 66%
Penguin University 76.0% 77.8% 71.8% 75%
Petrel University 69.0% 68.8% 72.3% 70%
Pintail College 61.1% 60.6% 56.3% 59%
Quail University 55.6% 61.8% 68.8% 62%
Rail University 74.0% 73.5% 71.3% 73%
Stork University 74.5% 72.9% 71.4% 73%
Sungrebe University 74.2% 67.5% 75.2% 72%
Swan College 62.5% 58.0% 61.5% 61%
Tinamou College 62.5% 57.5% 87.5% 69%
AVERAGE 69.4% 69.8% 70.2% 69.8%
Notes: These results are from the TICUA database on undergraduate, graduate, and professional students.
First year freshman retention was calculated by dividing the number of students in a cohort that returned
to the institution for their sophomore year (SLEVEL=2) by the number of students that registered as
freshmen (SLEVEL=1) the previous year. Student were identified and tracked by their TICUAID number.
Standard deviations by year were 2007: +/-9.4%, 2008: +/- 9.3%, 2009 +/-10.9%. Only full-time
(ENROLL=F) students in the fall semester (TERM=1) for the academic year (YEAR) 2007, 2008, and
2009 are included. Individual student data is grouped by institution. Sample size (n) = 25,171. Number of
institutions = 26.
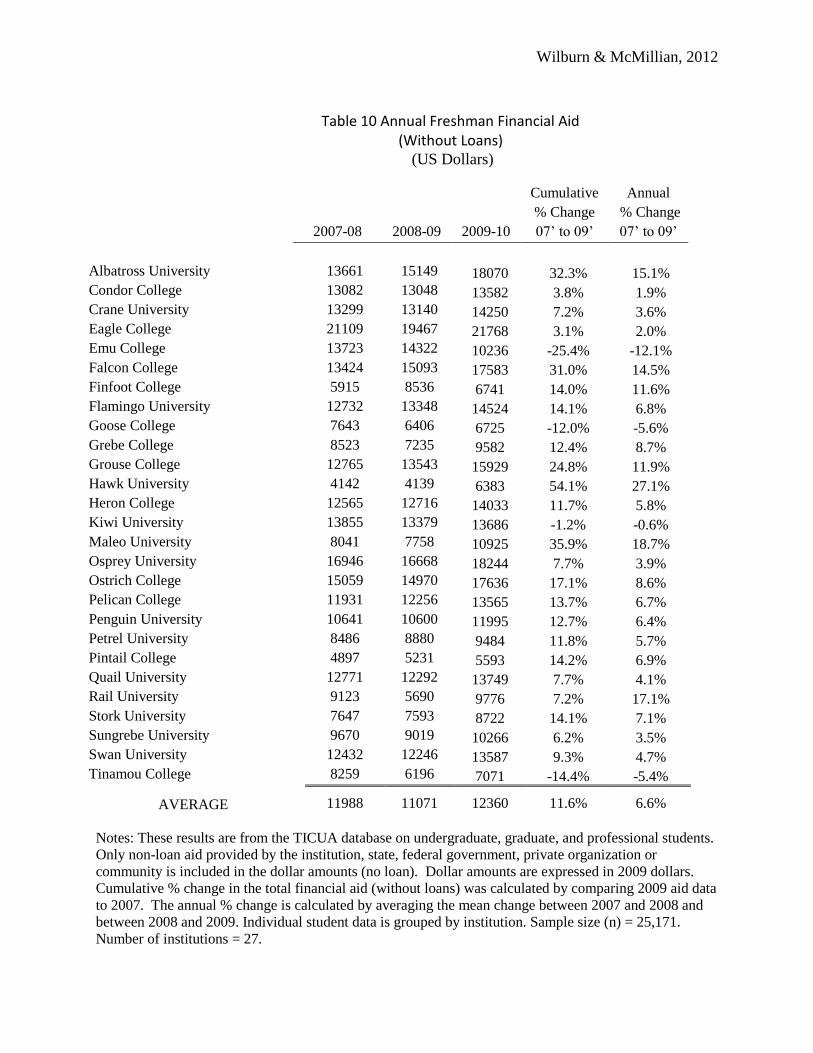
Wilburn & McMillian, 2012
Table 10 Annual Freshman Financial Aid (Without Loans)
(US Dollars)
2007-08
2008-09
2009-10
Cumulative
% Change
07’ to 09’
Annual
% Change
07’ to 09’
Albatross University 13661 15149 18070 32.3% 15.1%
Condor College 13082 13048 13582 3.8% 1.9%
Crane University 13299 13140 14250 7.2% 3.6%
Eagle College 21109 19467 21768 3.1% 2.0%
Emu College 13723 14322 10236 -25.4% -12.1%
Falcon College 13424 15093 17583 31.0% 14.5%
Finfoot College 5915 8536 6741 14.0% 11.6%
Flamingo University 12732 13348 14524 14.1% 6.8%
Goose College 7643 6406 6725 -12.0% -5.6%
Grebe College 8523 7235 9582 12.4% 8.7%
Grouse College 12765 13543 15929 24.8% 11.9%
Hawk University 4142 4139 6383 54.1% 27.1%
Heron College 12565 12716 14033 11.7% 5.8%
Kiwi University 13855 13379 13686 -1.2% -0.6%
Maleo University 8041 7758 10925 35.9% 18.7%
Osprey University 16946 16668 18244 7.7% 3.9%
Ostrich College 15059 14970 17636 17.1% 8.6%
Pelican College 11931 12256 13565 13.7% 6.7%
Penguin University 10641 10600 11995 12.7% 6.4%
Petrel University 8486 8880 9484 11.8% 5.7%
Pintail College 4897 5231 5593 14.2% 6.9%
Quail University 12771 12292 13749 7.7% 4.1%
Rail University 9123 5690 9776 7.2% 17.1%
Stork University 7647 7593 8722 14.1% 7.1%
Sungrebe University 9670 9019 10266 6.2% 3.5%
Swan University 12432 12246 13587 9.3% 4.7%
Tinamou College 8259 6196 7071 -14.4% -5.4%
AVERAGE 11988 11071 12360 11.6% 6.6%
Notes: These results are from the TICUA database on undergraduate, graduate, and professional students.
Only non-loan aid provided by the institution, state, federal government, private organization or
community is included in the dollar amounts (no loan). Dollar amounts are expressed in 2009 dollars.
Cumulative % change in the total financial aid (without loans) was calculated by comparing 2009 aid data
to 2007. The annual % change is calculated by averaging the mean change between 2007 and 2008 and
between 2008 and 2009. Individual student data is grouped by institution. Sample size (n) = 25,171.
Number of institutions = 27.

Wilburn & McMillian, 2012
Table 11 Total Annual Freshman Financial Aid (US Dollars)
2007-08
2008-09
2009-10
Cumulative
% Change
07’ to 09’
Annual
% Change
07’ to 09’
Albatross University 17304 18371 22457 29.8% 14.2%
Condor College 16887 16984 17778 5.3% 2.6%
Crane University 15517 15618 17251 11.2% 5.6%
Eagle College 26078 24817 26591 2.0% 1.2%
Emu College 18502 17993 14774 -20.1% -10.3%
Falcon College 16876 18316 20805 23.3% 11.1%
Finfoot College 10144 11778 12367 21.9% 10.6%
Flamingo University 18158 19566 21655 19.3% 9.2%
Goose College 11961 11315 14621 22.2% 11.9%
Grebe College 12916 11178 13739 6.4% 4.7%
Grouse College 16237 16421 18989 16.9% 8.4%
Hawk University 6296 6806 9235 46.7% 21.9%
Heron College 17011 19167 20379 19.8% 9.5%
Kiwi University 16997 17002 18100 6.5% 3.2%
Maleo University 14707 14715 21229 44.3% 22.2%
Osprey University 20178 19653 22103 9.5% 4.9%
Ostrich College 19285 18971 22829 18.4% 9.4%
Pelican College 15650 16522 18260 16.7% 8.0%
Penguin University 15139 15244 17048 12.6% 6.3%
Petrel University 11409 12341 14139 23.9% 11.4%
Pintail College 9067 10115 11523 27.1% 12.7%
Quail University 16115 15779 17594 9.2% 4.7%
Rail University 14900 9823 17931 20.3% 24.2%
Stork University 12521 10762 12182 -2.7% -0.4%
Sungrebe University 13782 13104 15988 16.0% 8.5%
Swan University 15650 15000 15084 -3.6% -1.8%
Tinamou College 11116 9419 11594 4.3% 3.9%
AVERAGE 15200 15066 17268 15.1% 8.1%
Notes: These results are from the TICUA database on undergraduate, graduate, and professional students.
All financial aid (grant, scholarship, and loan) is included in the dollar amounts. Dollar amounts are
expressed in 2009 dollars. Cumulative % change in total aid was calculated by comparing 2009 aid data
to 2007. The annual % change is calculated by averaging the mean change between 2007 and 2008 and
between 2008 and 2009. Individual student data is grouped by institution. Sample size (n) = 25,171.
Number of institutions = 27.
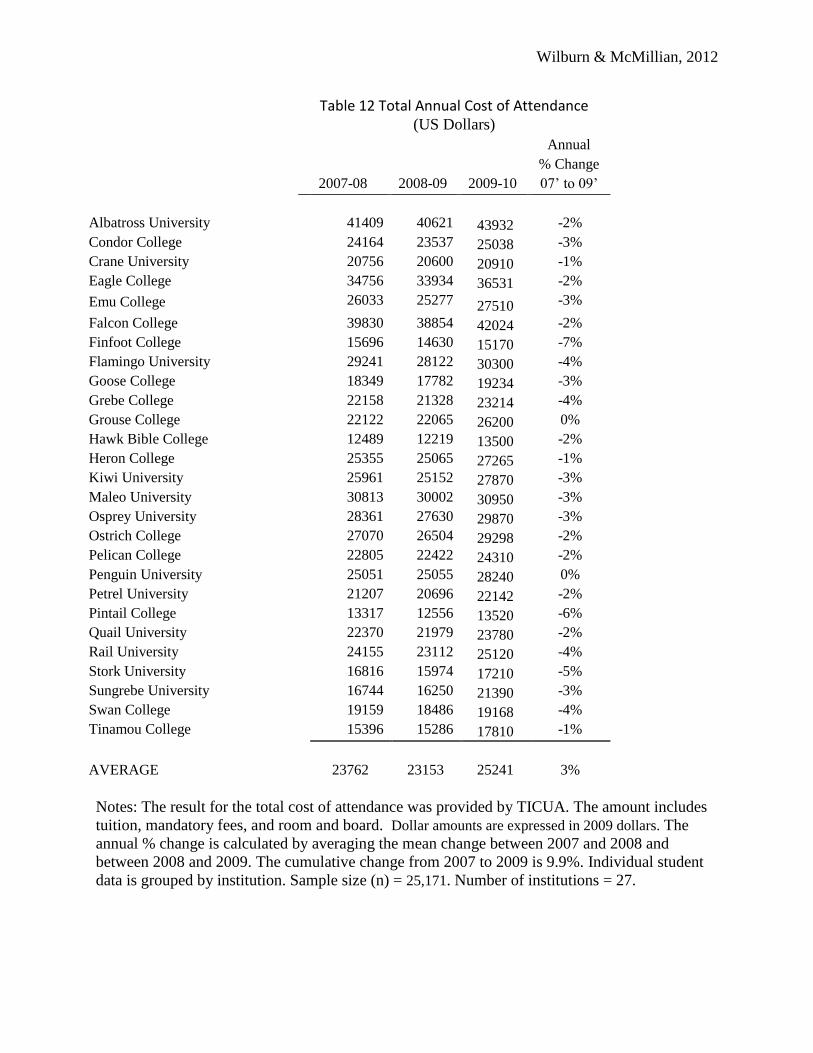
Wilburn & McMillian, 2012
Table 12 Total Annual Cost of Attendance (US Dollars)
2007-08
2008-09
2009-10
Annual
% Change
07’ to 09’
Albatross University 41409 40621 43932 -2%
Condor College 24164 23537 25038 -3%
Crane University 20756 20600 20910 -1%
Eagle College 34756 33934 36531 -2%
Emu College 26033 25277 27510 -3%
Falcon College 39830 38854 42024 -2%
Finfoot College 15696 14630 15170 -7%
Flamingo University 29241 28122 30300 -4%
Goose College 18349 17782 19234 -3%
Grebe College 22158 21328 23214 -4%
Grouse College 22122 22065 26200 0%
Hawk Bible College 12489 12219 13500 -2%
Heron College 25355 25065 27265 -1%
Kiwi University 25961 25152 27870 -3%
Maleo University 30813 30002 30950 -3%
Osprey University 28361 27630 29870 -3%
Ostrich College 27070 26504 29298 -2%
Pelican College 22805 22422 24310 -2%
Penguin University 25051 25055 28240 0%
Petrel University 21207 20696 22142 -2%
Pintail College 13317 12556 13520 -6%
Quail University 22370 21979 23780 -2%
Rail University 24155 23112 25120 -4%
Stork University 16816 15974 17210 -5%
Sungrebe University 16744 16250 21390 -3%
Swan College 19159 18486 19168 -4%
Tinamou College 15396 15286 17810 -1%
AVERAGE 23762 23153 25241 3%
Notes: The result for the total cost of attendance was provided by TICUA. The amount includes
tuition, mandatory fees, and room and board. Dollar amounts are expressed in 2009 dollars. The
annual % change is calculated by averaging the mean change between 2007 and 2008 and
between 2008 and 2009. The cumulative change from 2007 to 2009 is 9.9%. Individual student
data is grouped by institution. Sample size (n) = 25,171. Number of institutions = 27.

Wilburn & McMillian, 2012
Table 13 Annual Freshman Institutional Aid as a
Percentage of Total Cost of Attendance
2007-08 2008-09 2009-10 Average
Albatross University 27.5% 31.8% 35.9% 31.7%
Condor College 27.6% 30.1% 30.8% 29.5%
Crane University 36.3% 38.2% 37.3% 37.3%
Eagle College 42.0% 42.4% 43.7% 42.7%
Emu College 35.9% 41.2% 19.4% 32.1%
Falcon College 28.7% 33.3% 35.8% 32.6%
Finfoot College 8.7% 15.3% 5.7% 9.9%
Flamingo University 30.4% 34.8% 34.7% 33.3%
Goose College 21.5% 22.0% 21.8% 21.8%
Grebe College 20.8% 18.4% 20.0% 19.7%
Grouse College 31.0% 37.1% 36.5% 34.9%
Hawk University 22.2% 15.3% 9.6% 15.7%
Heron College 35.1% 30.0% 28.8% 31.3%
Kiwi University 33.8% 35.5% 31.8% 33.7%
Maleo University 18.3% 17.9% 25.9% 20.7%
Osprey University 39.4% 39.7% 40.8% 40.0%
Ostrich College 43.3% 42.8% 44.0% 43.4%
Pelican College 31.1% 31.7% 30.5% 31.1%
Penguin University 26.6% 26.7% 26.6% 26.6%
Petrel University 20.2% 24.7% 24.6% 23.2%
Pintail College 3.1% 4.4% 1.6% 3.1%
Quail University 33.7% 35.9% 29.8% 33.2%
Rail University 21.2% 13.9% 21.1% 18.7%
Stork University 28.7% 31.2% 33.8% 31.2%
Sungrebe University 32.6% 30.9% 27.6% 30.4%
Swan University 35.4% 38.0% 38.2% 37.2%
Tinamou College 28.2% 10.1% 8.7% 15.6%
AVERAGE 28.3% 28.6% 27.6% 28.2%
Notes: The annual freshman institutional aid is expressed as a percentage of the overall cost of
attending the institution. The overall cost of attendance was provided by TICUA and was
calculated using tuition, mandatory fees, and room and board costs at each institution. Standard
deviations by year were 2007: +/- 9.3%, 2008: +/- 10.5%, 2009 +/- 11.3%.The average % of the
total cost of attending the institution includes data collected from 2007, 2008 and 2009.
Individual student data is grouped by institution. Sample size (n) = 25,171. Number of
institutions = 27.
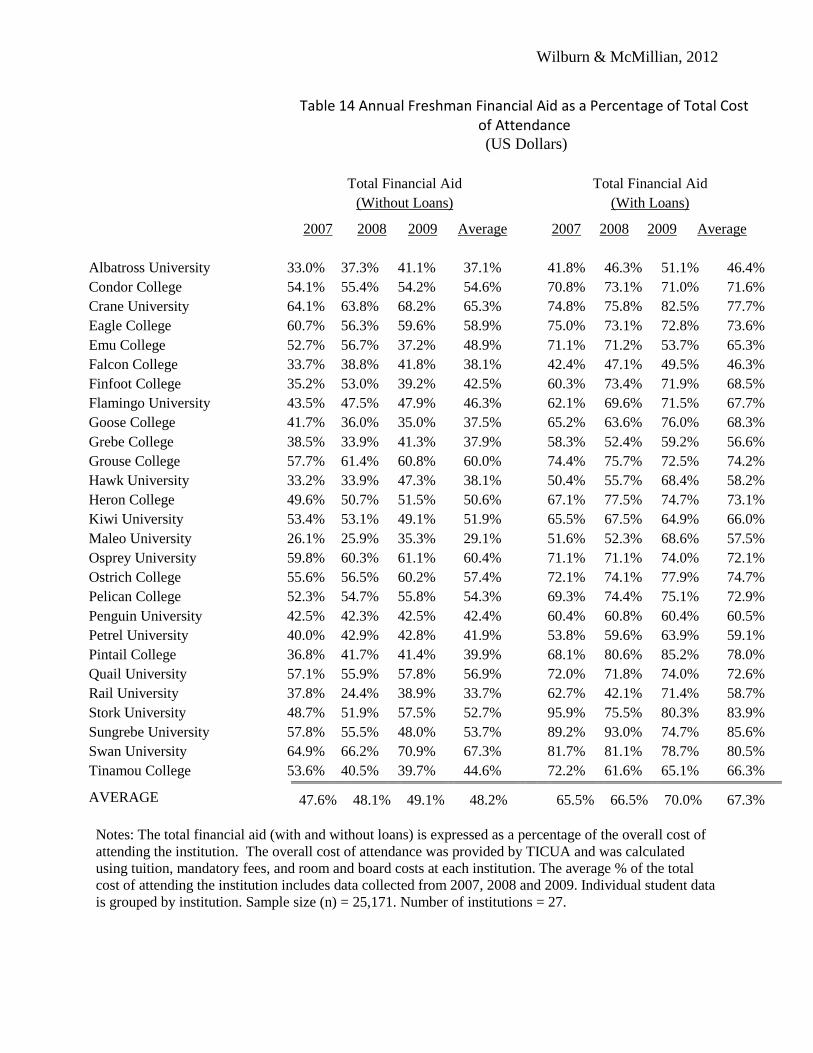
Wilburn & McMillian, 2012
Table 14 Annual Freshman Financial Aid as a Percentage of Total Cost of Attendance (US Dollars)
Total Financial Aid
(Without Loans)
Total Financial Aid
(With Loans)
2007 2008 2009 Average 2007 2008 2009 Average
Albatross University 33.0% 37.3% 41.1% 37.1% 41.8% 46.3% 51.1% 46.4%
Condor College 54.1% 55.4% 54.2% 54.6% 70.8% 73.1% 71.0% 71.6%
Crane University 64.1% 63.8% 68.2% 65.3% 74.8% 75.8% 82.5% 77.7%
Eagle College 60.7% 56.3% 59.6% 58.9% 75.0% 73.1% 72.8% 73.6%
Emu College 52.7% 56.7% 37.2% 48.9% 71.1% 71.2% 53.7% 65.3%
Falcon College 33.7% 38.8% 41.8% 38.1% 42.4% 47.1% 49.5% 46.3%
Finfoot College 35.2% 53.0% 39.2% 42.5% 60.3% 73.4% 71.9% 68.5%
Flamingo University 43.5% 47.5% 47.9% 46.3% 62.1% 69.6% 71.5% 67.7%
Goose College 41.7% 36.0% 35.0% 37.5% 65.2% 63.6% 76.0% 68.3%
Grebe College 38.5% 33.9% 41.3% 37.9% 58.3% 52.4% 59.2% 56.6%
Grouse College 57.7% 61.4% 60.8% 60.0% 74.4% 75.7% 72.5% 74.2%
Hawk University 33.2% 33.9% 47.3% 38.1% 50.4% 55.7% 68.4% 58.2%
Heron College 49.6% 50.7% 51.5% 50.6% 67.1% 77.5% 74.7% 73.1%
Kiwi University 53.4% 53.1% 49.1% 51.9% 65.5% 67.5% 64.9% 66.0%
Maleo University 26.1% 25.9% 35.3% 29.1% 51.6% 52.3% 68.6% 57.5%
Osprey University 59.8% 60.3% 61.1% 60.4% 71.1% 71.1% 74.0% 72.1%
Ostrich College 55.6% 56.5% 60.2% 57.4% 72.1% 74.1% 77.9% 74.7%
Pelican College 52.3% 54.7% 55.8% 54.3% 69.3% 74.4% 75.1% 72.9%
Penguin University 42.5% 42.3% 42.5% 42.4% 60.4% 60.8% 60.4% 60.5%
Petrel University 40.0% 42.9% 42.8% 41.9% 53.8% 59.6% 63.9% 59.1%
Pintail College 36.8% 41.7% 41.4% 39.9% 68.1% 80.6% 85.2% 78.0%
Quail University 57.1% 55.9% 57.8% 56.9% 72.0% 71.8% 74.0% 72.6%
Rail University 37.8% 24.4% 38.9% 33.7% 62.7% 42.1% 71.4% 58.7%
Stork University 48.7% 51.9% 57.5% 52.7% 95.9% 75.5% 80.3% 83.9%
Sungrebe University 57.8% 55.5% 48.0% 53.7% 89.2% 93.0% 74.7% 85.6%
Swan University 64.9% 66.2% 70.9% 67.3% 81.7% 81.1% 78.7% 80.5%
Tinamou College 53.6% 40.5% 39.7% 44.6% 72.2% 61.6% 65.1% 66.3%
AVERAGE 47.6% 48.1% 49.1% 48.2% 65.5% 66.5% 70.0% 67.3%
Notes: The total financial aid (with and without loans) is expressed as a percentage of the overall cost of
attending the institution. The overall cost of attendance was provided by TICUA and was calculated
using tuition, mandatory fees, and room and board costs at each institution. The average % of the total
cost of attending the institution includes data collected from 2007, 2008 and 2009. Individual student data
is grouped by institution. Sample size (n) = 25,171. Number of institutions = 27.

Wilburn & McMillian, 2012
Table 15 Amount of Financial Aid Awarded to TICUA Students 2007 to 2009
Student Retained
(n=17,180)
Students Departed
(n=7,991)
% of Total Cost Dollar Amount % of Total Cost Dollar Amount
Institutional Aid .308 8,131 .221 5,430
No-Loan Aid .501 12,429 .402 9,228
Total Aid .692 16,856 .589 13,280
Data Source: Tennessee Independent College and University Association, Student Database,
2007, 2008, & 2009. Aid values are expressed as a percentage of total cost of attendance. Dollar
amounts are expressed in 2009 dollars. Sample size (n) = 25,171.
Table 16 Logistic Regression of Freshman First Year Retention and Institutional Aid, Loan Free Aid, and Total Aid Awards
All TICUA Students Students Receiving TELS Awards
Coefficient SE Coefficient SE
Institutional Aid (%) 1.173** .104 1.243** 0.143
No-Loan Aid (%) 0.760** .088 1.181** 0.127
Total Aid (%) 0.602** .058 0.432** 0.090
Minority -0.198** .039 -0.276** 0.052
Gender (F) 0.225** .029 0.199** 0.038
ACT Score - - 0.017** 0.006
Constant -0.346** .120 -0.853** 0.172
Notes: These results are from a regression analysis performed on data obtained from TICUA
database for the years 2007, 2008, and 2009. Coefficients for two separate logistic regressions
are shown. The analysis used institutional, no loan, and total aid as expressed as a percentage
of overall cost of attendance. Institutional fixed effects were accounted for in the analysis. All
TICUA sample size (n) = 25,171. TELS Award sample size (n) = 14,018. A double asterisk
indicates significance to the .99 level. A single asterisk indicates significance to the .95 level.

Wilburn & McMillian, 2012
Table 17 – Polynomial Regression To Identify a “Tipping Point” in Institutional Aid
Coefficient Standard Error
All TICUA Sample
Institutional Aid 0.140* 0.069*
Institutional Aid** 1.060** 0.203**
Institutional Aid*** -1.027** 0.157**
Constant 0.583** 0.006**
R = 0.183
R Square =0.034
Students Receiving TELs Awards
Institutional Aid 0.322** 0.107**
Institutional Aid** 1.076** 0.294**
Institutional Aid*** -1.240** 0.223**
Constant 0.530** 0.011**
R = 0.213
R Square =0.045
Notes: These results are from a polynomial regression analysis performed on data
obtained from TICUA database for the years 2007, 2008, and 2009. Coefficients and
standard error are shown. The analysis used institutional aid as expressed as a
percentage of overall cost of attendance. Number of institutions (n) = 27 with 3
observations for each group (2007, 2008, 2009). All TICUA sample size (n) = 25,171.
TELS Award sample size (n) = 14,018. A double asterisk indicates significance to the
.99 level. A single asterisk indicates significance to the .095 level.

Wilburn & McMillian, 2012
Table 18 Summary of Financial Aid Variables by Semester by Institution Cohort 2007
Institution
Mean
INSAID
2007
Mean
INSAID
2008
%
Change
Mean
FREEAID
2007
Mean
FREEAID
2008
%
Change
Mean
TOTAID
2007
Mean
TOTAID
2008 % Change
Albatross University
5,733
5,999 4.44%
1,156
1,027
-
12.48%
8,461
8,760 3.41%
Condor College 3,946
3,967 0.54%
3,306
3,110 -6.33%
9,019
9,611 6.16%
Crane University
3,923
4,410 11.06%
2,933
2,661
-
10.22%
7,958
8,600 7.47%
Eagle College
7,906
7,421 -6.53%
4,217
2,368
-
78.07%
14,826
13,283 -11.62%
Emu College 4,649
4,810 3.35%
2,312
2,178 -6.14%
8,856
9,564 7.40%
Falcon College
5,799
6,365 8.90%
1,036
780
-
32.74%
9,991
8,735 -14.37%
Finfoot College
1,231
1,422 13.42%
2,550
3,076 17.13%
6,398
6,860 6.74%
Flamingo University 4,698
4,835 2.83%
1,947
1,419
-37.19%
10,257
10,740 4.50%
Grebe College
2,451
1,988 -23.29%
1,932
1,732
-
11.59%
6,676
6,696 0.29%
Grouse College
3,744
4,410 15.10%
2,839
2,360
-
20.28%
8,204
8,462 3.05%
Hawk University 1,586
1,151 -37.82%
641
1,081 40.71%
3,561
3,737 4.72%
Heron College
4,763
3,552 -34.11%
2,100
2,410 12.84%
9,340
9,681 3.52%
Kiwi University
4,297
4,387 2.06%
2,616
2,050
-
27.56%
8,595
8,287 -3.72%
Maleo University
2,098
2,386 12.07%
1,092
1,282 14.78%
5,376
6,029 10.83%
Osprey University 5,645
5,756 1.93%
2,844
2,225
-27.80%
10,242
10,458 2.06%
Ostrich College
5,849
5,814 -0.61%
1,631
1,567 -4.08%
9,137
10,366 11.85%
Pelican College
3,762
3,741 -0.56%
2,546
2,147
-
18.57%
8,802
8,791 -0.12%
Penguin University 3,561
3,223 -10.48%
1,925
1,704
-12.99%
7,408
7,251 -2.17%
Petrel University
2,356
1,115
-
111.41%
2,030
2,408 15.67%
5,910
5,945 0.59%
Pintail College
223
138 -61.17%
2,319
2,712 14.49%
5,024
6,193 18.88%
Quail University 3,990
4,697 15.05%
2,615
2,072
-26.23%
8,018
8,857 9.48%
Rail University
2,995
1,859 -61.14%
1,887
1,201
-
57.15%
7,231
5,115 -41.36%
Stork University
2,508
1,365 -83.72%
1,608
1,595 -0.88%
5,499
4,943 -11.24%
Sungrebe University 2,918
2,478 -17.74%
2,054
1,626
-26.31%
8,129
8,380 3.00%
Swan University
3,525
6,022 41.46%
3,039
3,496 13.07%
8,585
12,727 32.54%
Tinamou College
2,884
2,882 -0.06%
2,386
2,489 4.14%
5,952
6,539 8.97%
Notes: The data shown was provided by TICUA and was calculated using tuition, mandatory fees, and room
and board costs at each institution for the fall semester. Dollar amounts are expressed in 2009 dollars. The
annual % change is change in aid amount for 2007 to 2008. Individual student data is grouped by institution.
Sample size (n) = 17,180. Number of institutions = 26.

Wilburn & McMillian, 2012
Table 19 Summary of Financial Aid Variables per Semester by Institution Cohort 2008
Institution
Mean
INSAID
2008
Mean
INSAID
2009
%
Change
Mean
FREEAID
2008
Mean
FREEAID
2009
%
Change
Mean
TOTAID
2008
Mean
TOTAID
2009 % Change
Albatross University 6,838 7,181 4.77% 1,152 1,021 -12.85% 9,502 10,201 6.84%
Condor College 3,916 4,267 8.21% 3,826 3,330 -14.87% 9,977 10,797 7.59%
Crane University 4,596 4,466 -2.91% 2,831 2,880 1.69% 8,607 9,244 6.89%
Eagle College 8,104 8,202 1.20% 2,548 2,393 -6.51% 13,610 14,262 4.57%
Emu College 5,991 420
-
1325.38% 2,080 1,822 -14.18% 9,682 4,412 -119.44%
Falcon College 6,936 6,921 -0.21% 1,099 970 -13.35% 9,504 9,562 0.60%
Finfoot College 1,512 936 -61.58% 3,666 3,638 -0.76% 7,257 6,422 -13.00%
Flamingo University 5,819 5,950 2.20% 2,100 2,298 8.61% 11,603 11,980 3.15%
Grebe College 2,504 2,269 -10.35% 1,689 1,885 10.43% 6,408 6,676 4.02%
Grouse College 4,718 5,120 7.86% 2,922 2,364 -23.64% 9,183 9,477 3.10%
Hawk University 1,065 1,081 1.50% 1,526 1,732 11.92% 4,284 4,404 2.73%
Heron College 3,539 5,146 31.22% 3,175 2,566 -23.74% 9,665 11,075 12.73%
Kiwi University 2,560 2,164 -18.32% 2,832 2,067 -37.01% 8,718 6,692 -30.29%
Maleo University 2,589 3,064 15.52% 1,413 1,563 9.60% 6,225 7,128 12.67%
Osprey University 6,116 6,488 5.73% 3,137 2,720 -15.36% 11,108 11,490 3.33%
Ostrich College 6,317 6,153 -2.68% 1,858 2,116 12.21% 10,557 11,024 4.23%
Pelican College 4,107 4,037 -1.74% 2,754 2,494 -10.43% 9,355 9,354 -0.01%
Penguin University 3,764 3,292 -14.34% 2,105 1,814 -16.03% 8,016 7,839 -2.25%
Petrel University 2,993 1,246 -140.18% 2,117 2,597 18.47% 7,097 6,486 -9.42%
Pintail College 321 185 -73.46% 2,540 2,838 10.48% 6,132 6,795 9.75%
Quail University 4,410 4,662 5.41% 2,498 1,866 -33.87% 8,589 8,761 1.97%
Rail University 1,638 1,631 -0.40% 1,081 1,462 26.09% 4,927 9,864 50.05%
Stork University 2,595 1,548 -67.59% 1,912 1,795 -6.55% 6,264 5,738 -9.17%
Sungrebe University 2,988 2,650 -12.78% 2,186 1,694 -29.02% 9,053 8,828 -2.55%
Swan University 4,303 4,165 -3.31% 3,046 2,571 -18.46% 8,778 8,554 -2.62%
Tinamou College 2,376 2,899 18.05% 3,248 2,025 -60.42% 7,878 7,874 -0.05%
Notes: The data shown was provided by TICUA and was calculated using tuition, mandatory fees, and room and board
costs at each institution for the fall semester. Dollar amounts are expressed in 2009 dollars. The annual % change is
change in aid amount for 2008 to 2009. Individual student data is grouped by institution. Sample size (n) = 17,180.
Number of institutions = 26.
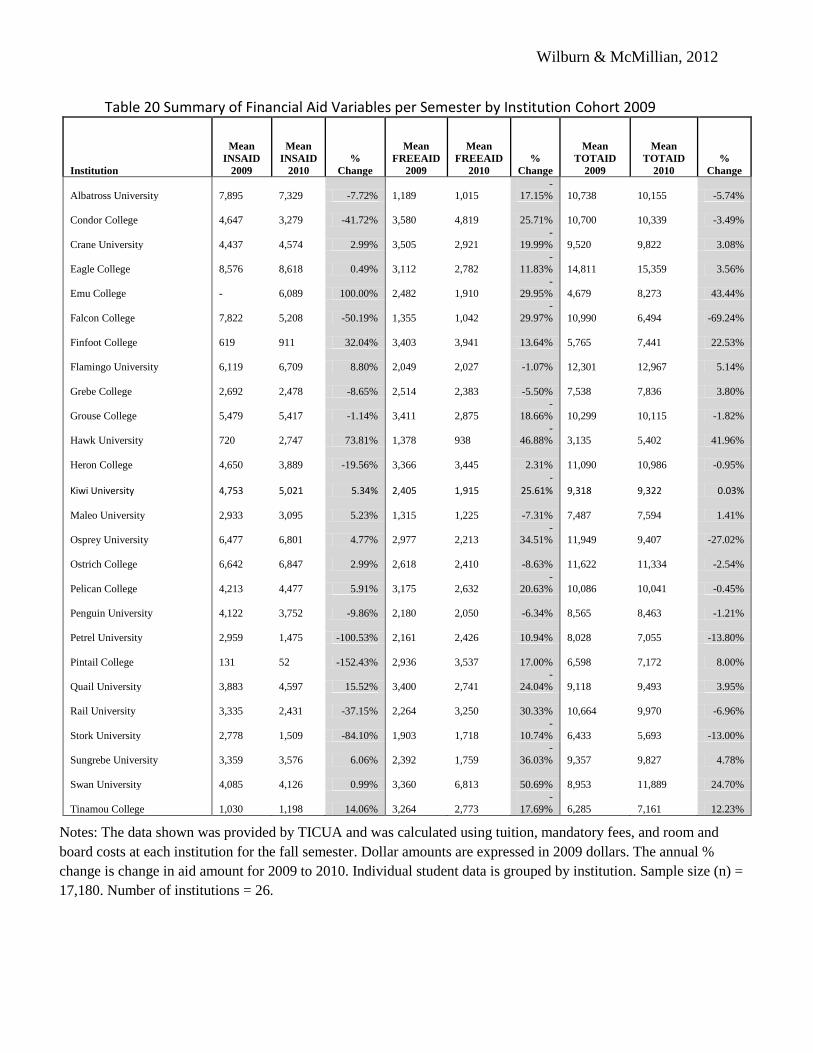
Wilburn & McMillian, 2012
Table 20 Summary of Financial Aid Variables per Semester by Institution Cohort 2009
Institution
Mean
INSAID
2009
Mean
INSAID
2010
%
Change
Mean
FREEAID
2009
Mean
FREEAID
2010
%
Change
Mean
TOTAID
2009
Mean
TOTAID
2010
%
Change
Albatross University 7,895
7,329 -7.72%
1,189
1,015
-17.15%
10,738
10,155 -5.74%
Condor College 4,647
3,279 -41.72%
3,580
4,819 25.71%
10,700
10,339 -3.49%
Crane University
4,437
4,574 2.99%
3,505
2,921
-
19.99%
9,520
9,822 3.08%
Eagle College
8,576
8,618 0.49%
3,112
2,782
-
11.83%
14,811
15,359 3.56%
Emu College -
6,089 100.00%
2,482
1,910
-29.95%
4,679
8,273 43.44%
Falcon College
7,822
5,208 -50.19%
1,355
1,042
-
29.97%
10,990
6,494 -69.24%
Finfoot College
619
911 32.04%
3,403
3,941 13.64%
5,765
7,441 22.53%
Flamingo University 6,119
6,709 8.80%
2,049
2,027 -1.07%
12,301
12,967 5.14%
Grebe College
2,692
2,478 -8.65%
2,514
2,383 -5.50%
7,538
7,836 3.80%
Grouse College
5,479
5,417 -1.14%
3,411
2,875
-
18.66%
10,299
10,115 -1.82%
Hawk University 720
2,747 73.81%
1,378
938
-46.88%
3,135
5,402 41.96%
Heron College
4,650
3,889 -19.56%
3,366
3,445 2.31%
11,090
10,986 -0.95%
Kiwi University 4,753
5,021 5.34%
2,405
1,915
-25.61%
9,318
9,322 0.03%
Maleo University
2,933
3,095 5.23%
1,315
1,225 -7.31%
7,487
7,594 1.41%
Osprey University
6,477
6,801 4.77%
2,977
2,213
-
34.51%
11,949
9,407 -27.02%
Ostrich College 6,642
6,847 2.99%
2,618
2,410 -8.63%
11,622
11,334 -2.54%
Pelican College
4,213
4,477 5.91%
3,175
2,632
-
20.63%
10,086
10,041 -0.45%
Penguin University
4,122
3,752 -9.86%
2,180
2,050 -6.34%
8,565
8,463 -1.21%
Petrel University 2,959
1,475 -100.53%
2,161
2,426 10.94%
8,028
7,055 -13.80%
Pintail College
131
52 -152.43%
2,936
3,537 17.00%
6,598
7,172 8.00%
Quail University
3,883
4,597 15.52%
3,400
2,741
-
24.04%
9,118
9,493 3.95%
Rail University 3,335
2,431 -37.15%
2,264
3,250 30.33%
10,664
9,970 -6.96%
Stork University
2,778
1,509 -84.10%
1,903
1,718
-
10.74%
6,433
5,693 -13.00%
Sungrebe University
3,359
3,576 6.06%
2,392
1,759
-
36.03%
9,357
9,827 4.78%
Swan University 4,085
4,126 0.99%
3,360
6,813 50.69%
8,953
11,889 24.70%
Tinamou College
1,030
1,198 14.06%
3,264
2,773
-
17.69%
6,285
7,161 12.23%
Notes: The data shown was provided by TICUA and was calculated using tuition, mandatory fees, and room and
board costs at each institution for the fall semester. Dollar amounts are expressed in 2009 dollars. The annual %
change is change in aid amount for 2009 to 2010. Individual student data is grouped by institution. Sample size (n) =
17,180. Number of institutions = 26.
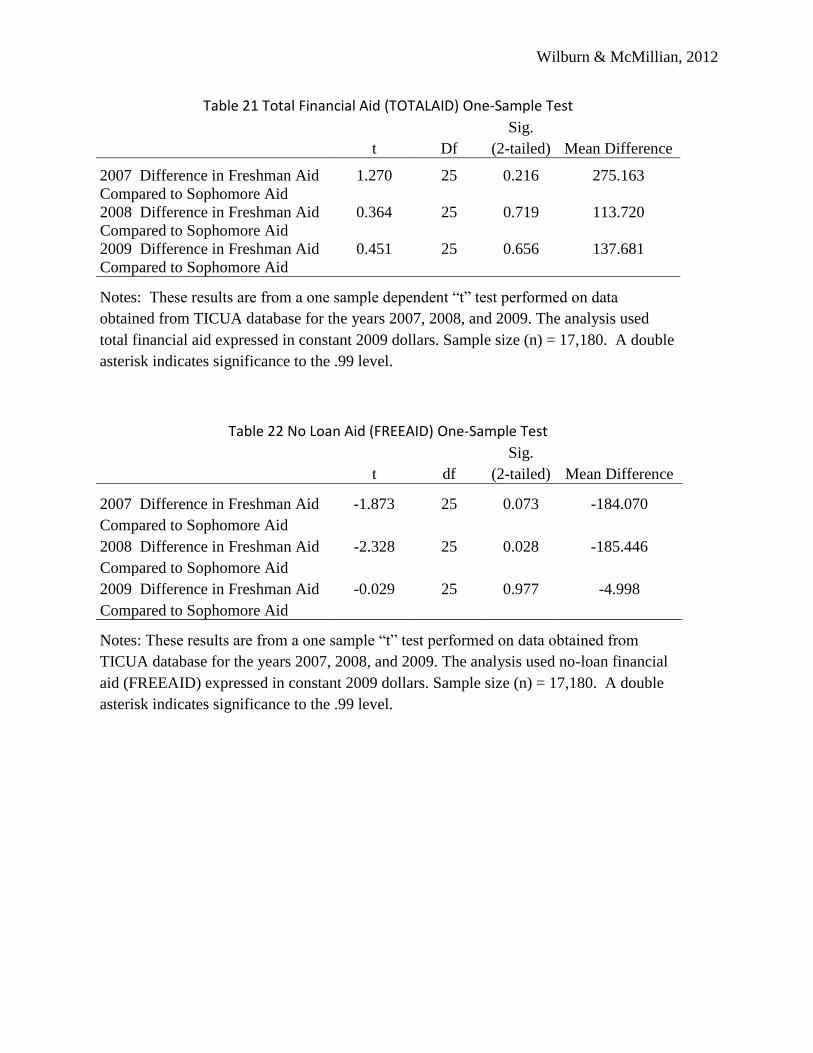
Wilburn & McMillian, 2012
Table 21 Total Financial Aid (TOTALAID) One-Sample Test
t Df
Sig.
(2-tailed) Mean Difference
2007 Difference in Freshman Aid
Compared to Sophomore Aid
1.270 25 0.216 275.163
2008 Difference in Freshman Aid
Compared to Sophomore Aid
0.364 25 0.719 113.720
2009 Difference in Freshman Aid
Compared to Sophomore Aid
0.451 25 0.656 137.681
Notes: These results are from a one sample dependent “t” test performed on data
obtained from TICUA database for the years 2007, 2008, and 2009. The analysis used
total financial aid expressed in constant 2009 dollars. Sample size (n) = 17,180. A double
asterisk indicates significance to the .99 level.
Table 22 No Loan Aid (FREEAID) One-Sample Test
t df
Sig.
(2-tailed) Mean Difference
2007 Difference in Freshman Aid
Compared to Sophomore Aid
-1.873 25 0.073 -184.070
2008 Difference in Freshman Aid
Compared to Sophomore Aid
-2.328 25 0.028 -185.446
2009 Difference in Freshman Aid
Compared to Sophomore Aid
-0.029 25 0.977 -4.998
Notes: These results are from a one sample “t” test performed on data obtained from
TICUA database for the years 2007, 2008, and 2009. The analysis used no-loan financial
aid (FREEAID) expressed in constant 2009 dollars. Sample size (n) = 17,180. A double
asterisk indicates significance to the .99 level.

Wilburn & McMillian, 2012
Table 23 Institutional Aid One-Sample Test
t df
Sig.
(2-tailed)
Mean
Difference
2007 Difference in Freshman
Aid Compared to Sophomore
Aid
-0.218 25 0.829 -32.553
2008 Difference in Freshman
Aid Compared to Sophomore
Aid
-1.026 25 0.315 -248.869
2009 Difference in Freshman
Aid Compared to Sophomore
Aid
0.241 25 0.812 71.203
Notes: These results are from a one sample “t” test performed on data obtained from
TICUA database for the years 2007, 2008, and 2009. The analysis used institutional aid
expressed as constant 2009 dollars. Sample size (n) = 17,180. A double asterisk
indicates significance to the .99 level.
Table 24 Tinamou College Dependent T-Test t df Sig. (2-tailed) Mean Difference
2007 Difference in Freshman Aid compared to Sophomore Aid 1.233 10 .246 596.5909
2008 Difference in Freshman Aid compared to Sophomore Aid 4.799 8 .001** 2706.0000
2009 Difference in Freshman Aid compared to Sophomore Aid -1.666 15 .116 -1111.9688
Notes: These results are from a dependent “t” test performed on data obtained from TICUA
database for the years 2007, 2008, and 2009. The analysis used total financial aid expressed in
constant 2009 dollars. Sample size (n) = 36. A double asterisk indicates significance to the .95
level.

Wilburn & McMillian, 2012
Table 25 Maleo University Dependent T-Test
t Df Sig. (2-tailed) Mean Difference
2007 Difference in Freshman Aid compared to Sophomore Aid 4.568 542 .000** 707.18586
2008 Difference in Freshman Aid compared to Sophomore Aid 5.903 640 .000** 1007.91477
2009 Difference in Freshman Aid compared to Sophomore Aid .985 684 .325 143.06836
Notes: These results are from a dependent “t” test performed on data obtained from TICUA
database for the years 2007, 2008, and 2009. The analysis used total financial aid expressed in
constant 2009 dollars. Sample size (n) = 1,868. A double asterisk indicates significance to the
.95 level.
Table 26 Swan University Dependent T-Test
t Df Sig. (2-tailed) Mean Difference
2007 Difference in Freshman Aid compared to Sophomore Aid 9.158 61 .000** 3957.24597
2008 Difference in Freshman Aid compared to Sophomore Aid -1.768 94 .080 -400.04389
2009 Difference in Freshman Aid compared to Sophomore Aid 13.694 115 .000** 3134.42888
Notes: These results are from a dependent “t” test performed on data obtained from TICUA
database for the years 2007, 2008, and 2009. The analysis used total financial aid expressed in
constant 2009 dollars. Sample size (n) = 273. A double asterisk indicates significance to the .95
level.
Table 27 Grebe College Dependent T-Test
t df Sig. (2-tailed) Mean Difference
2007 Difference in Freshman Aid compared to Sophomore Aid -.564 143 .574 -91.3403
2008 Difference in Freshman Aid compared to Sophomore Aid 2.109 124 .037 320.9120
2009 Difference in Freshman Aid compared to Sophomore Aid .657 117 .512 141.6695
Notes: These results are from a dependent “t” test performed on data obtained from TICUA
database for the years 2007, 2008, and 2009. The analysis used total financial aid expressed in
constant 2009 dollars. Sample size (n) = 387. A double asterisk indicates significance to the .95
level.

Wilburn & McMillian, 2012
Table 28 Pelican College Dependent T-Test
t df Sig. (2-tailed) Mean Difference
2007 Difference in Freshman Aid compared to Sophomore Aid 1.033 169 .303 164.688
2008 Difference in Freshman Aid compared to Sophomore Aid -.064 186 .949 -10.1979
2009 Difference in Freshman Aid compared to Sophomore Aid -.761 204 .448 -156.668
Notes: These results are from a dependent “t” test performed on data obtained from TICUA
database for the years 2007, 2008, and 2009. The analysis used total financial aid expressed in
constant 2009 dollars. Sample size (n) = 562. A double asterisk indicates significance to the .95
level.
Table 29 Osprey University Dependent T-Test
t df Sig. (2-tailed) Mean Difference
2007 Difference in Freshman Aid compared to Sophomore Aid 2.833 206 .005** 337.4976
2008 Difference in Freshman Aid compared to Sophomore Aid 3.638 210 .000** 462.848
2009 Difference in Freshman Aid compared to Sophomore Aid -12.471 184 .000** -2266.130
Notes: These results are from a dependent “t” test performed on data obtained from TICUA
database for the years 2007, 2008, and 2009. The analysis used total financial aid expressed in
constant 2009 dollars. Sample size (n) = 603. A double asterisk indicates significance to the .95
level.
Table 30 Quail University Dependent T-Test
t df Sig. (2-tailed) Mean Difference
2007 Difference in Freshman Aid compared to Sophomore Aid 5.643 60 .000** 1222.72066
2008 Difference in Freshman Aid compared to Sophomore Aid 1.755 56 .085 440.4561
2009 Difference in Freshman Aid compared to Sophomore Aid 2.193 75 .031 446.8953947
Notes: These results are from a dependent “t” test performed on data obtained from TICUA
database for the years 2007, 2008, and 2009. The analysis used total financial aid expressed in
constant 2009 dollars. Sample size (n) = 194. A double asterisk indicates significance to the .95
level.

Wilburn & McMillian, 2012
Table 31 Rail University Dependent T-Test
t df Sig. (2-tailed) Mean Difference
2007 Difference in Freshman Aid compared to Sophomore Aid -2.676 44 .010** -2182.5031111
2008 Difference in Freshman Aid compared to Sophomore Aid 5.955 33 .000** 6282.3385294
2009 Difference in Freshman Aid compared to Sophomore Aid .188 29 .852 187.14633
Notes: These results are from a dependent “t” test performed on data obtained from TICUA
database for the years 2007, 2008, and 2009. The analysis used total financial aid expressed in
constant 2009 dollars. Sample size (n) = 109. A double asterisk indicates significance to the .95
level.
Table 32 Sungrebe University Dependent T-Test
t df Sig. (2-tailed) Mean Difference
2007 Difference in Freshman Aid compared to Sophomore Aid 1.279 197 .202 256.25096
2008 Difference in Freshman Aid compared to Sophomore Aid -.841 192 .402 -194.22741
2009 Difference in Freshman Aid compared to Sophomore Aid 3.043 219 .003** 659.74718
Notes: These results are from a dependent “t” test performed on data obtained from TICUA
database for the years 2007, 2008, and 2009. The analysis used total financial aid expressed in
constant 2009 dollars. Sample size (n) = 611. A double asterisk indicates significance to the .95
level.
Table 33 Hawk University Dependent T-Test
t df Sig. (2-tailed) Mean Difference
2007 Difference in Freshman Aid compared to Sophomore Aid 1.413 90 .161 315.9451648
2008 Difference in Freshman Aid compared to Sophomore Aid 1.285 69 .203 361.900
2009 Difference in Freshman Aid compared to Sophomore Aid 4.589 66 .000** 2104.985
Notes: These results are from a dependent “t” test performed on data obtained from TICUA
database for the years 2007, 2008, and 2009. The analysis used total financial aid expressed in
constant 2009 dollars. Sample size (n) = 228. A double asterisk indicates significance to the .95
level.

Wilburn & McMillian, 2012
Table 34 Ostrich College Dependent T-Test
t df Sig. (2-tailed) Mean Difference
2007 Difference in Freshman Aid compared to Sophomore Aid 2.802 97 .006** 1363.04367
2008 Difference in Freshman Aid compared to Sophomore Aid 1.878 110 .063 555.05387
2009 Difference in Freshman Aid compared to Sophomore Aid -.579 115 .564 -137.62388
Notes: These results are from a dependent “t” test performed on data obtained from TICUA
database for the years 2007, 2008, and 2009. The analysis used total financial aid expressed in
constant 2009 dollars. Sample size (n) = 325. A double asterisk indicates significance to the .95
level.
Table 35 Pintail Dependent T-Test
t df Sig. (2-tailed) Mean Difference
2007 Difference in Freshman Aid compared to Sophomore Aid 7.358 144 .000** 1135.2138
2008 Difference in Freshman Aid compared to Sophomore Aid 6.933 161 .000** 677.9753
2009 Difference in Freshman Aid compared to Sophomore Aid 6.425 138 .000** 736.0216
Notes: These results are from a dependent “t” test performed on data obtained from TICUA
database for the years 2007, 2008, and 2009. The analysis used total financial aid expressed in
constant 2009 dollars. Sample size (n) = 447. A double asterisk indicates significance to the .95
level.
Table 36 Stork University Dependent T-Test
t df Sig. (2-tailed) Mean Difference
2007 Difference in Freshman Aid compared to Sophomore Aid -4.777 352 .000** -677.9093
2008 Difference in Freshman Aid compared to Sophomore Aid -4.507 411 .000** -604.4296
2009 Difference in Freshman Aid compared to Sophomore Aid -6.926 412 .000** -849.2857
Notes: These results are from a dependent “t” test performed on data obtained from TICUA
database for the years 2007, 2008, and 2009. The analysis used total financial aid expressed in
constant 2009 dollars. Sample size (n) = 1,178. A double asterisk indicates significance to the
.95 level.

Wilburn & McMillian, 2012
Table 37 Finfoot College Dependent T-Test
t df Sig. (2-tailed) Mean Difference
2007 Difference in Freshman Aid compared to Sophomore Aid .850 10 .415 995.2273
2008 Difference in Freshman Aid compared to Sophomore Aid -2.616 30 .014** -1169.7097
2009 Difference in Freshman Aid compared to Sophomore Aid 5.347 19 .000** 1482.4500
Notes: These results are from a dependent “t” test performed on data obtained from TICUA
database for the years 2007, 2008, and 2009. The analysis used total financial aid expressed in
constant 2009 dollars. Sample size (n) = 62. A double asterisk indicates significance to the .95
level.
Table 38 Crane University Dependent T-Test
t df Sig. (2-tailed) Mean Difference
2007 Difference in Freshman Aid compared to Sophomore Aid 2.988 65 .004** 916.60818
2008 Difference in Freshman Aid compared to Sophomore Aid 2.329 95 .022** 526.08865
2009 Difference in Freshman Aid compared to Sophomore Aid 2.619 119 .010** 501.73225
Notes: These results are from a dependent “t” test performed on data obtained from TICUA
database for the years 2007, 2008, and 2009. The analysis used total financial aid expressed in
constant 2009 dollars. Sample size (n) = 282. A double asterisk indicates significance to the .95
level.
Table 39 Penguin University Dependent T-Test
t df Sig. (2-tailed) Mean Difference
2007 Difference in Freshman Aid compared to Sophomore Aid .113 283 .910 14.73708
2008 Difference in Freshman Aid compared to Sophomore Aid .175 340 .861 27.32507
2009 Difference in Freshman Aid compared to Sophomore Aid -.270 303 .788 -48.33691
Notes: These results are from a dependent “t” test performed on data obtained from TICUA
database for the years 2007, 2008, and 2009. The analysis used total financial aid expressed in
constant 2009 dollars. Sample size (n) = 929. A double asterisk indicates significance to the .95
level.

Wilburn & McMillian, 2012
Table 40 Condor University Dependent T-Test
t df Sig. (2-tailed) Mean Difference
2007 Difference in Freshman Aid compared to Sophomore Aid 5.358 83 .000** 653.34369
2008 Difference in Freshman Aid compared to Sophomore Aid 4.940 83 .000** 829.4940
2009 Difference in Freshman Aid compared to Sophomore Aid 2.165 33 .038** 443.6471
Notes: These results are from a dependent “t” test performed on data obtained from TICUA
database for the years 2007, 2008, and 2009. The analysis used total financial aid expressed in
constant 2009 dollars. Sample size (n) = 202. A double asterisk indicates significance to the .95
level.
Table 41 Eagle College Dependent T-Test
t df Sig. (2-tailed) Mean Difference
2007 Difference in Freshman Aid compared to Sophomore Aid -4.024 175 .000** -1570.9602
2008 Difference in Freshman Aid compared to Sophomore Aid 2.605 195 .010** 722.3827
2009 Difference in Freshman Aid compared to Sophomore Aid 3.415 184 .001** 556.3297
Notes: These results are from a dependent “t” test performed on data obtained from TICUA
database for the years 2007, 2008, and 2009. The analysis used total financial aid expressed in
constant 2009 dollars. Sample size (n) = 557. A double asterisk indicates significance to the .95
level.
Table 42 Flamingo University Dependent T-Test
t df Sig. (2-tailed) Mean Difference
2007 Difference in Freshman Aid compared to Sophomore Aid 1.226 31 .230 818.0938
2008 Difference in Freshman Aid compared to Sophomore Aid .123 38 .903 51.7051
2009 Difference in Freshman Aid compared to Sophomore Aid 1.058 43 .296 392.76705
Notes: These results are from a dependent “t” test performed on data obtained from TICUA
database for the years 2007, 2008, and 2009. The analysis used total financial aid expressed in
constant 2009 dollars. Sample size (n) = 115. A double asterisk indicates significance to the .95
level.

Wilburn & McMillian, 2012
Table 43 Emu College Dependent T-Test
t df Sig. (2-tailed) Mean Difference
2007 Difference in Freshman Aid compared to Sophomore Aid 4.026 126 .000** 768.7008
2008 Difference in Freshman Aid compared to Sophomore Aid -14.963 121 .000** -5270.2131
2009 Difference in Freshman Aid compared to Sophomore Aid 9.539 153 .000** 3547.0584
Notes: These results are from a dependent “t” test performed on data obtained from TICUA
database for the years 2007, 2008, and 2009. The analysis used total financial aid expressed in
constant 2009 dollars. Sample size (n) = 404. A double asterisk indicates significance to the .95
level.
Table 44 Falcon College Dependent T-Test
t df Sig. (2-tailed) Mean Difference
2007 Difference in Freshman Aid compared to Sophomore Aid -4.448 307 .000** -1141.62013
2008 Difference in Freshman Aid compared to Sophomore Aid .511 358 .610 92.21078
2009 Difference in Freshman Aid compared to Sophomore Aid -16.197 327 .000** -4554.27655
Notes: These results are from a dependent “t” test performed on data obtained from TICUA
database for the years 2007, 2008, and 2009. The analysis used total financial aid expressed in
constant 2009 dollars. Sample size (n) = 995. A double asterisk indicates significance to the .95
level.
Table 45 Albatross University Dependent T-Test
t df Sig. (2-tailed) Mean Difference
2007 Difference in Freshman Aid compared to Sophomore Aid 1.717 341 .087 311.89418
2008 Difference in Freshman Aid compared to Sophomore Aid 3.576 356 .000** 729.73989
2009 Difference in Freshman Aid compared to Sophomore Aid -2.597 331 .010 -580.17395
Notes: These results are from a dependent “t” test performed on data obtained from TICUA
database for the years 2007, 2008, and 2009. The analysis used total financial aid expressed in
constant 2009 dollars. Sample size (n) = 1,031. A double asterisk indicates significance to the
.95 level.
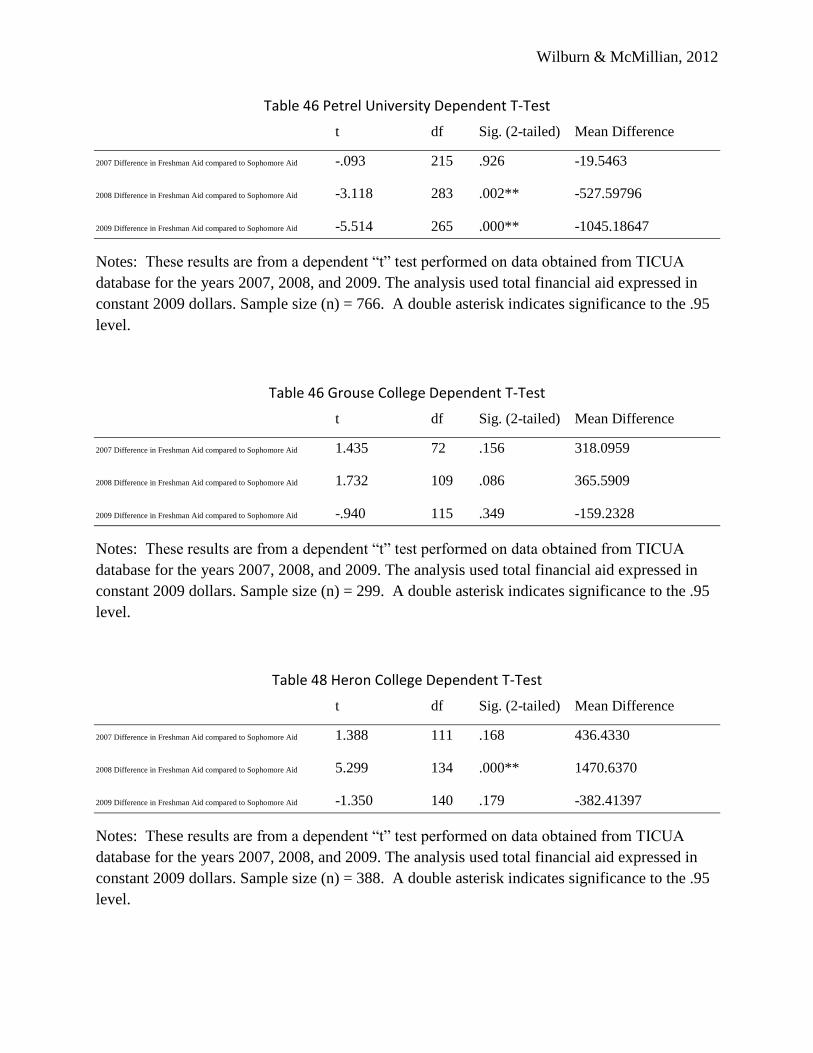
Wilburn & McMillian, 2012
Table 46 Petrel University Dependent T-Test
t df Sig. (2-tailed) Mean Difference
2007 Difference in Freshman Aid compared to Sophomore Aid -.093 215 .926 -19.5463
2008 Difference in Freshman Aid compared to Sophomore Aid -3.118 283 .002** -527.59796
2009 Difference in Freshman Aid compared to Sophomore Aid -5.514 265 .000** -1045.18647
Notes: These results are from a dependent “t” test performed on data obtained from TICUA
database for the years 2007, 2008, and 2009. The analysis used total financial aid expressed in
constant 2009 dollars. Sample size (n) = 766. A double asterisk indicates significance to the .95
level.
Table 46 Grouse College Dependent T-Test
t df Sig. (2-tailed) Mean Difference
2007 Difference in Freshman Aid compared to Sophomore Aid 1.435 72 .156 318.0959
2008 Difference in Freshman Aid compared to Sophomore Aid 1.732 109 .086 365.5909
2009 Difference in Freshman Aid compared to Sophomore Aid -.940 115 .349 -159.2328
Notes: These results are from a dependent “t” test performed on data obtained from TICUA
database for the years 2007, 2008, and 2009. The analysis used total financial aid expressed in
constant 2009 dollars. Sample size (n) = 299. A double asterisk indicates significance to the .95
level.
Table 48 Heron College Dependent T-Test
t df Sig. (2-tailed) Mean Difference
2007 Difference in Freshman Aid compared to Sophomore Aid 1.388 111 .168 436.4330
2008 Difference in Freshman Aid compared to Sophomore Aid 5.299 134 .000** 1470.6370
2009 Difference in Freshman Aid compared to Sophomore Aid -1.350 140 .179 -382.41397
Notes: These results are from a dependent “t” test performed on data obtained from TICUA
database for the years 2007, 2008, and 2009. The analysis used total financial aid expressed in
constant 2009 dollars. Sample size (n) = 388. A double asterisk indicates significance to the .95
level.

Wilburn & McMillian, 2012
Table 49 Kiwi University Dependent T-Test
t df Sig. (2-tailed) Mean Difference
2007 Difference in Freshman Aid compared to Sophomore Aid -1.495 317 .136 -211.61009
2009 Difference in Freshman Aid compared to Sophomore Aid .410 329 .682 65.26436
Notes: These results are from a dependent “t” test performed on data obtained from TICUA
database for the years 2007, 2008, and 2009. The analysis used total financial aid expressed in
constant 2009 dollars. Sample size (n) = 648. A double asterisk indicates significance to the .95
level.
Table 50 Linear Regression for Institutional Aid and Minority, Gender, ACT, and 1st Year GPA for Students Retained and Receiving TELS Awards
Coefficient (Unstandardized) SE
MINORITY 0.070** (0.042**) 0.007
GENDER 0.000 (0.000) 0.005
ACT 0.246** (0.013**) 0.001
1YRGPA 0.068** (0.024**) 0.004
Constant -0.094** 0.017
F Ratio 158.260**
RSquare 0.079
Notes: These results are from a regression analysis performed on data obtained from TICUA
database for the years 2007, 2008, and 2009. Coefficients for the linear regressions are
shown. The analysis used institutional aid expresses as a percentage of the total cost of
attendance as a dependent variable and MINORITY, GENDER, ACT, and 1YRGPA as
independent variables. Institutional fixed effects were accounted for in the analysis.
Regression analysis was conducted on TELS award students that reenrolled for the fall
semester sophomore year. Sample size (n) = 8,670. A double asterisk indicates significance
to the .99 level.
Wilburn & McMillian, 2012
References
Adelman, C. (1999). Answers in the tool box: Academic intensity, attendance patterns,
and bachelor degree attainment. Washington, D.C: Office of Educational Research and
Improvement, U.S. Department of Education.
Avery, C and Hoxby, C.M. (2004). Do and should financial aid packages affect students’
college choices? In C.M. Hoxby (Ed.), College choices: The economics of where to go,
when to go, and how to pay for it (239-302). Chicago: University of Chicago Press.
Baum, S. and Payea, K. (2004). Education Pays 2004: The Benefits of Higher
Education for Individuals and Society. Washington, DC: The College Board.
Basch, D.L., (1997). Private colleges’ pricing experience in the early 1990s: The impact of
rapidly increasing college-funded grants. Research in Higher Education, v38 n3.
Bean, J. P. (1985). Interaction Effects Based on Class Level in an Explanatory Model of College
Student Dropout Syndrome. American Educational Research Journal , 22 (1), 35-64.
Bean, J. P. & Metzner, B. S. (1985). A conceptual model of nontraditional student attrition.
Review of Educational Research, 55, 485-540.
Bean, J. P. & Metzner, B. S. (1987). The Estimation of a Conceptual Model of Nontraditional
Undergraduate Student Attrition. Research in Higher Education, 27(1), pp. 15-28.
Becker, G.S. (1993). Human Capital: A theoretical and empirical analysis with special
Reference to education (3rd
edition). Chicago: University of Chicago Press.
Becker, G.S. (1962). Investment in human capital: A theoretical analysis. Journal of
Political Economy 70(5): 9-49.
Bean, J. P. and Metzner, B. S. (1985). A Conceptual Model of Nontraditional Undergraduate
Student. Review of Educational Research, Vol. 55, No. 4 (Winter), pp. 485-540
Bishop, J. (1977). The effect of public policies on the demand for higher education. Journal of
Human Resources, 5: 285–307.
Bowen, H.R. (1997). Investment in Learning: Individual and Social Value of American
Higher Eduation. Baltimore: Johns Hopkins Press.
Bloom, J. (2007). (Mis)reading social class in the journey towards college: Youth development
in urban America. Teachers College Record, 109(2), 343-368.
Boschung, M.D., Sharpe, D.L., and Ghany, M.A. (1998). Racial, ethnic and gender differences
in post secondary financial aid awards. Economics of Education Review, 17(2), 219-
222.
Bourdieu, P. (1986). The forms of capital. In J.G. Richardson(ed.), Handbook of

Wilburn & McMillian, 2012
Theory and Research for the Sociology of Education, 241-258. New York: Greenwood
Press.
Bourdieu, P. and Passeron, H.C. (1977). Reproduction in Education, Society, and
Culture. Beverly Hills, CA: Sage Publications.
Bourdieu, P. and Wacquant, L.J.D. (1992). An Invitiaton to Reflexive Sociology.
Chicago: University of Chicago Press.
Braxton, J. M. (2003). Persistence as an essential gateway to student access. In S. Komives and
D. Woodard (Eds.), Student Services: A handbook for the profession (4th
ed.). San
Francisco: Jossey-Bass.
Braxton, J.M., Hirschy, A.S., and McClendon, S.A. (2004). Understanding and
Reducing College Student Departure. Adrianna Kezar (ed.), ASHE-ERIC
Higher Education Report, 30(3).
Bowen, H.R. (1997). Investment in Learning: Individual and Social Value of American
Higher Eduation. Baltimore: Johns Hopkins Press.
Bowen, W.G. and D. Bok. 1998. The Shape of the River: Long-term Consequences of
Considering Race in College and University Admissions. Princeton NJ: Princeton
University Press.
Braunstein, A., McGrath, M., and Pescatrice, D. (2001). Measuring the Impact of Financial
Factors on College Persistence. Journal of College Retention 2, (3), 191-203.
Brownstein, Andrew. 2001. "Upping the Ante for Student Aid: Princeton Replaces Loans with
Grants, and the Rest of Higher Education Struggles to Keep Up." The Chronicle oJ
Higher Education, February 16, A47Burton, N.W. and Ramist, L. 2001. "Predeicting
Sucess in College: SAT Studies of Classes Graduating Since 1980," College Board
Report No. 2001-2. New York: The College Board.
Cabrera, A. F., Stampen, J. O., and Hansen, W. L. (1990). Exploring the Effects of Ability to Pay
on Persistence in College. Review of Higher Education, 13, 303-336.
Callendar, D., and Jackson, J (2008). Does the fear of debt constrain choice of university or
subject of study? Studies in Higher Education, 33(4), 405-429.
Carnegie Foundation for the Advancement of Teaching (1986). "Parents: A Key to
College Choice." Change, Vol. 18, No.6, pp. 31-35.
Carnevale, A.P., and Desrochers, D.M. (2003). Standards for What? Economic Roots
of K-16 Reform. Princeton, NJ: Educational Testing Service.
Catsiapis, G. (1987). A model of educational investment decisions. Review of
Economics and Statistics 69: 33-41.

Wilburn & McMillian, 2012
Coleman, J.S. (1998). Social Capital in the creation of human capital. American
Journal of Sociology 94(Supplement):95-120.
The College Board. (2010). Trends in College Pricing 2010. Washington, DC. Author.
The College Board. (2010). Trends in Student Aid 2010. Washington, DC. Author.
The College Board (2002). The financial aid profession at work: The 1996 survey of
undergraduate financial aid policies, practices, and procedures. Washington, DC.
Retrieved from http://www.usnews.com/usnews/edu/college/rankings/about/
02cbrank.htm NASFAA and The College Board. 2000.
Davis, J. (2003) Unitended Consequences of Tution Discounting. Lumina Foundation for
Education 5(1) May.
DeBerard, M. S., Spielmans, G. I and Julka, D. L. (2004) . Predictors of Academic Achievement
and Retention Among College Freshmen: A Longitudinal Study. College Student Journal,
Vol. 38, pp. 66-80.
DesJardins, S.L., Ahlburg, D.A., and McCall, B.P. (2002). Simulating the Longitudinal Effects
of Changes in Financial Aid on Student Departure. The Journal of Human Resources,
37(3), 653-679.
DesJardins, S.L., and Toutkoushian, R.K. (2005). Are students really rational? The
development of rational thought and its applications to student choice. In J.C.
Smart (ed.), Higher Education: Handbook of Theory and Research 20, 191-240.
Dordrecht, The Netherlands: Kluwer Academic Publishers.
DesJardins, S., Ahlburg, D., McCall, B. (2006). An Integrated Model of Application, Admission,
Enrollment, and Financial Aid. The Journal of Higher Education, 77 (3), 381-429.
Dika, S.L., and Singh, K. (2002). Applications of social capital in educational literature: A
critical synthesis. Review of Educational Research 72: 31-60.
DiMaggio, P. and Mohr, J. (1985). Cultural capital, educational attainment, and marital
selection. American Journal of Sociology 90:1231-1261.
Dolinsky, A.L. (2010). The adequacy of the information that students utilize when
choosing a college: an attribute importance and information sufficiency approach.
College Student Journal. 44 (3), 762-776.
Doyle, W.R., (2008). Follow the Money. Change: The Magazine of Higher Learning, v40 n5
p56-57.
Doyle, W.R. (2010). Changes in Institutional Aid, 1992-2003: The Evolving Role of Merit Aid.
Research in Higher Education, 51, 789-810.

Wilburn & McMillian, 2012
Durkheim, Emile. [1897] 1997. Suicide. Translated by J. S. Spaulding and G. Simpson. Glencoe,
IL: Free Press.
Dynarski, S (2000). “Hope for Whom? Financial Aid for the Middle Class and Its Impact
onCollege Attendance” National Bureau of Economic Research Working Paper 7756,
June.
Dynkarski, S. (2002). The behavioral distributional implications of aid for college. Amercian
Economic Review, 92(2) 279-285
Ellwood, D.T., and Kane, T.J. (2000). Who is getting a college education? Family
background and the growing gaps in enrollment. In S. Danziger and J. Waldfogel (eds.),
Securing the Future: Investing in Children for Birth to College (pp. 283
-324). New York: Russell Sage Foundation.
Ehrenberg, R.G and Murphy, S.H., (1993). What Price Diversity? The Death of Need-Based
Financial Aid at Selective Colleges and Universities, Change, v25 n4.
Ehrenberg, Ronald. 2000. Tuition Rising: Why College Costs So Much. Cambridge, Mass.:
Harvard University Press.
Freeman, K. (1997). Increasing African Americans’ participation in higher
education:African American high-school students’ perspectives. The
Journal of Higher Educations 68(5): 523-550.
Financial Aid Policies, Practices, and Procedures. Journal of Student Financial Aid, 32(2), 24-
35.
Galicki, S. J., & McEwen, M. K. (1989). The relationship of residence to retention of black and
white students and a predominantly white university. Journal of College Student
Development, 30 (5), 389-394.
Graber, G. (2011). Private colleges facing sustained pricing pressure: Five strategies for
monitoring and meeting enrollment and financial goals. Retrieved 20 February 2012
online from: http://blog.noellevitz.com/2011/04/27/private-college-pricing-strategies-
enrollment-financial-ai/
Griffith, A. (2011). Keeping up with the Joneses: Institutional changes following the adoption of
a merit aid policy. Economics of Education Review, 30, 1022-1033.
Hayes, T. J. (2009). Marketing Colleges and Universities: A Services Approach. Washington,
DC.
Heller, D. and Marin, P. (2002). Who should we help? The negative consequences of merit
scholarships. Cambridge, MA: The Civil Rights Project, Harvard University.

Wilburn & McMillian, 2012
Heller, D. (2004). State Merit Scholarship Programs: An Overview, in D. Heller & P. Marin
(Eds), State Merit Scholarship Programs and Racial Inequality, (Chap. 1), The Civil Rights
Project, Harvard University.
Horn, L. and Kojaku, L.K. (2001). High School Academic Curriculum and the
Persistence Path through College: Persistence and Transfer Behavior of
Undergraduates 3 years after entering a 4-year institution. National Center
for Educational Statistics, Statistical Analysis Report. Postsecondary Education
Descriptive Analysis Report.
Horvat, E.M. (2001). Understanding equity and access in higher education: The
potential contribution of Pierre Bourdieu. In J.C. Smart (ed.), Higher Education:
Handbook of Theory and Research, 16: 158-171. New York: Agathon Press.
Hossler, D, Braxton, J, and Coopersmith, G. (1989). Understanding student college
choice. In J. Smart (ed.), Higher Education: Handbook of Theory and Research, Vol. V,
231-288. New York, Agathon Press.
Hossler, D., Schmit, J., and Vesper, N. (1999). Going to college: How Social, Economic
and Educational Factors Influlence the Decisions Students Make. Baltimore: Johns
Hopkins University Press.
Howell, J.S., Kurlaender, M., and Grodsky, E. (2010). Postsecondary Prepartation and
Remediation: Examining the Effect of the Early Assessment Program at
California State University. Journal of Policy Analysis and Management, 29 (4),
726-748.
Ikenberry, S. O., and Hartle, T.W. (1998) Too little knowledge is a dangerous thing: What the
public thinks and knows about paying for college. Washington, DC: American Council
on Education
Jackon, G (1978). Financial Aid and Student Enrollment. The Journal of Higher Education, 49
(6), 548-574.
Julian, T. and Kominski, R. (2011) Education and Synthetic Work-Life Earnings
Estimates: American Community Survey Results. Retrieved from
http://www.census.gov/prod/2011pubs/acs-14.pdf
Kane, T.J. (1999). The Price of Admission: Rethinking How Americans Pay for College.
Washington, DC: Brookings Institution Press.
Kern, C.W., Fagley, N.S., and Miller, P.M. (1998). Correlates of college retention and
GPA: learning and study strategy, testwiseness, attitudes, and ACT. Journal of
College Counseling, 1(1), 26-35.
Kirst, M. and Venezia, A. (2004). From High School to College: Improving Opportunities
for Success in Postsecondary Education. Jossey-Bass Publishers, San Francisco.

Wilburn & McMillian, 2012
Klaauw, W. (2002). Estimating the Effect of Financial Aid Offers on College Enrollment: A
Regression Discontinuity Approach. International Economic Review, 43(4), 1249-1287.
Kohn, M. G., Manski, C. F., and Mundel, D. S. (1976). An empirical investigation of the factors
influencing college going behavior. Annals of Economic and Social Measurement, 5:
391–419.
Lemont, M., and Lareau, A. (1988). Cultural Capital: Allusions, Gaps and Glissandos in Recent
Theoretical Developments. Sociological Theory 6:153-68.
Leslie,L.L., and Brinkman, P.T. (1988). The Economic Value of Higher Education. New
York: American council on Educaiton, MacMillan Publishing Company.
Lillis, M. P. (2008). High-tuition, High-loan Financing: Economic segregation in postsecondary
education. Journal of Education Finance, 34(1), 15-30.
Lin,N. (2001). Social Capital: A Theory of Social Structure and Action. New York:
Cambridge University Press.
Long, B.T. (2004). How have College Decisions Changed over time? An application
of the conditional logistic choice model. Journal of Econometrics 121:271-296.
Mallinckrodt, B.. & Sedlacek, W. E. (1987). Student retention and the use of campus facilities by
race. NASPA Journal, 24, 28-32.
Manski, C. F., and Wise, D. A. (1983). College Choice in America. Cambridge, MA: Harvard
University Press.
Manski, C.F. (1993). Dynamic choice in social settings. Journal of Econometrics, 58
(1-2): 121-136.
Marcus, R.D. (1989). Freshmen retention rates at US private colleges: Results from
aggregate data. Journal of Economic and Social Measurement, 15(1), 37-55.
Mayo, D.T., Helms, M.M., and Codjoe, H.M. (2004). Reasons to remain in college: a
comparison of high school and college students. The International Journal of
College Management, 18(6), 360-367.
McDonough, P.M. (1997). Choosing Colleges: How Social class ad Schools Structure
Opportunity. Albany: State University of New York Press.
McPherson, M. S., and Schapiro, M. O. (1991). Keeping College Affordable: Government and
Educational Opportunity. Washington, DC: Brookings Institution.
Wilburn & McMillian, 2012
McPherson, M. S. and Schapiro, M. O. (1991). Does Student Aid Affect College Enrollment?
New Evidence on a Persistent Controversy," American Economic Review 81,309-18.
Monks, J. (2009). The impact of merit-based financial aid on college enrollment: A field
experiment. Ecomomics of Education Review,28(1), 99-106.
Morrow, V. (1999). Conceptualising social capital in relation to the well-being of children
and young people: A critical review. Sociological Review 47 (4): 744-765.
Munday, L. (1967). Predicting College Grades Using ACT Data, Educational and Psychological
Measurement 27: 410-406.
Murdock, T., Nix-Mayer, L., & Tsui, P. (1995, May). The effect of types of financial aid
on student persistence toward graduation. Paper presented at the Association of
Institutional Research 1995 Annual Forum, Boston, MA.
NASFAA and The College Board. 2002. 2001 Survey of Undergraduate Financial Aid Policies,
Practices, and Procedures. Dataset. Washington, DC: Author.
National Commission on the Cost of Higher Education. 1998. Straight Talk About College Costs
and Prices. The Report of the National Commission on the Cost of Higher Educa-tion,
Phoenix, Ariz. Oryx Press.
Nielsen, H.S., and Sorensen, T., and Taber, C. (2008). Estimating the Effect from Student Aid
on College Enrollment from A Government Grant Policy Reform. National Bureau of
Economic Research. Cambridge, MA
Nora, A., Barlow, L. and Crisp, G. (2006). Examining the Tangible and Psychosocial Benefits
of Financial Aid With Student Access, Engagement, and Degree Attainment. The
American Behavioral Scientist, 49 (12), 1636-1651.
Noel-Levitz (2011). 2011 Cost of Recruiting an Undergraduate Student Report.
Nora, A. and Rendon, L.I. (1990). Determinants of predisposition to transfer among community
college students: A structural model. Research in Higher Education, 31(3), 235-255.
Olsen, Florence, and Kit Lively. 2001. "Princeton Increases Endowment Spending to Re-place
Students' Loans With Grants." The Chronicle of Higher Education, February 9, A32.
Parker, J., and Summers, J. (1993). Tuition and enrollment yield at selective liberal arts colleges.
Economics of Education Review 12: 311–324.
Paulsen, M. (1990). College Choice: Understanding Student Enrollment Behavior.
Report No. ASHE-ERIC Higher Education Report No. 6. Washington, DC:
George Washington University, School of Education and Human Development.
Paulsen, M. (2001). The economics of human capital and investment in higher

Wilburn & McMillian, 2012
education. In M.B. Paulsen and J.C. Smart (eds.) The Finance of Higher
Education: Theory, Research, Policy, and Practice (pp. 95-132). New York:
Agathon Press.
Paulsen, M.B. and St. John, E.P. (2002). Social class and college costs: Examining the
financial nexus between college choice and persistence. The Journal of Higher
Education 73(2): 189-236.
Perna, L. W. (2000). Differences in the decision to enroll in college among African
Americans, Hispanics, and Whites. The Journal of Higher Education 71(2):
117-141.
Perna, L..W. and Titus, M.A. (2002). Understanding the barriers to college access for low-
income students: the role of state context. Paper presented at the 19th
annual
NASSGAP/NCHELP Financial Aid Conference, Denver, CO.
Perna, L. (2003). The private benefits of higher education: An examination of earnings
Premium. Research in Higher Education 44, 451-472.
Perna, L. (2004). Studying College Access and Choice: A Proposed Conceptual Model.
In J.C. Smart (ed.), Higher Education Handbook of Theory and Research, Vol. XXI, 99-
157. Netherlands, Springer.
Pernal, L. W. (2005). The benefits of higher education: Sex, racial/ethinic, and socio economic
group differences. Review of Higher Education, 29(1), 23-52.
Perna, L.W. (2006). Studying College Access and Choice: A Proposed Conceptual
Model. In J.C. Smart (ed.), Higher Education Handbook of Theory and Research,
Vol. XXI, 99-157. Netherlands, Springer.
Perna, L. and Steele, P. (2011). The Role of Context in Understanding the Contributions of
Financial Aid to College Opportunity. Teachers College Record, 113 (5), 895-933.
Pittre, P. E. (2006). College choice: A study of African American and white student aspirations
and perceptions related to college attendance. College Student Journal, 40(3), 562-574.
Portes, A. (1998). Social capital: Its origins and applications in modern sociology.
Annual Review of Sociology 24: 1-24.
Rothstein, J.M. 2004. "College Performance Prediction and the SAT," Journal of Econometrics
121: 297-317.
Ryland, E. B., Riordan, R. J., & Brack, G. (1994). Selected characteristics of high-risk students
and their enrollment persistence. Journal of College Student Development, 35 (1), 54-58.

Wilburn & McMillian, 2012
Schultz, T.W. (1961). Investment in human capital. American Economic Review
51: 1-17.
Somers, P.A. (1994). The effect of price on within-year persistence. Journal of Student
Financial Aid, 24(1), 31-45.
St. John, E. P. and Noell, J. (1989). The effects of student financial aid on access to higher
education: An analysis of progress with special consideration of minority enrollment.
Research in Higher Education, 30, 563-581.
St. John, E.P. (1990). Price response in enrollment decisions: An analysis of the high school
and beyond senior cohort. Research in Higher Education, 31, 387-403.
St. John, E.P., Kirshstein, J.R., and Noell, J. (1991). The effects of financial aid on persistence:
A sequential analysis. Review of Higher Education, 14(3), 383-406.
St. John, E. P. (1991). A framework for reexamining state resource-management strategies in
higher education. Journal of Higher Education, 62, 263-287.
St. John, E.P. (1991). What really influences minority attendance? Sequential analysis of the
High School and Beyond sophomore cohort. Research in Higher Education, 32, 141-158.
St. John, E. P. and Starkey, J. B. (1995) An alternative to net price: Assessing the influence of
prices and subsidies on within-year persistence. Journal of Higher Education, 66, 156-
186.
St. John, E. P., Cabrera, A. E., Nora, A., and Asker, E. H. (2000). Economic Influences on
Persistence Reconsidered: How can finance research inform the reconceptualization of
persistence modes? In J. M. Braxton (Ed.) Reworking the Student Departure Puzzle (pp.
29-47). Nashville: Vanderbilt University Press.
St. John, E.P. and Asker, E.H. (2001). The role of finances in student choice: A review
of theory and research. In M.B. Paulsen and J.C. Smart (eds.), Public Policy and
College Access: Investigating the Federal and State Roles in Equalizing
Postsecondary Opportunity, 109-130. New York: AMS Press, Inc.
St. John, E.P. and Paulsen, M.B. (2001). The finance of higher education: Implications
for theory, research, policy, and practice. In M.B. Paulsen and J.C. Smart (eds.),
The Finance of Higher Education: Theory, Research, Policy, and Practice, 545-
568. New York: Agathon Press.
St. John, E.P., Chung, C.G., Musoba, G.D., and Simmons, A.B. (2004).Financial
Access: The impact of state finance strategies. In E.P. St. John (ed.), Public
Policy and College Access: Investigating the Federal and State Roles in
Equalizing Postsecondary Opportunity, 109-130. New York: AMS Press, Inc.

Wilburn & McMillian, 2012
St. John, E.P., Paulsen, M.B., and Carter, D.F. (2005). Diversity, college costs, and
postsecondary opportunity: An examination of the financial nexus between
college choice and persistence. The Journal of Higher Education 76(5): 545-569.
Stewart, S. S., & Rue, P. (1983). Commuter students: Definition and distribution. In S. S.
Stewart( Ed.), Commuters tudents:E nhancing the educational experiences( pp. 3-8). San
Francisco: Jossey-Bass.
Summers, J. (2004). Net Tuition Revenue Generation at Private Liberal Arts Colleges.
Education Economics, 12(3), 219-230.
Terenzini, P. T. (1987). A review of selected theoretical models of student development and
collegiate impact. Paper presented at the Annual Meeting of the Association for the Study
of Higher Education, Baltimore, MD.
Tennessee Higher Education Commission (2010). Tennessee Education Lottery Scholarship
Program Annual Report: Outcomes through Fall 2009. Retrieved from
http://tn.gov/thec/Legislative/Reports/2010/2010ReportFINAL‐revised.pdf.
The Tennessee Independent Colleges and University Association (2007). Characteristics Fall
2007: The Factbook on Tennessee Colleges and Universities. Retrieved on 21 September
2010 from http://www.ticua.org/research/.
The Tennessee Independent Colleges and University Association (2008). Characteristics Fall
2008: The Factbook on Tennessee Colleges and Universities. Retrieved on 21 September
2010 from http://www.ticua.org/research/.
The Tennessee Independent Colleges and University Association (2009). Characteristics Fall
2009: The Factbook on Tennessee Colleges and Universities. Retrieved on 21 September
2010 from http://www.ticua.org/research/.
Tierney, W., Venegas, K., & De La Rosa, M.L. (Eds.) (2006, August). Financial Aid and Access
to College: The Public Policy Challenge. American Behavioral Scientist 49(12). Read three
chapters: Perna, pp. 1620-1635; De La Rosa, pp. 1670-1686; Tierney & Venegas, pp. 1687-
1702.
Tinto, V (1975) Dropout from Higher Education: A Theoretical Synthesis of Recent Research.
Review of Educational Research Vol.45, No1, pp.89-125.
Tinto, V. (1982) Limits of Theory and Practice in Student Attrition. Journal of Higher
Education. Vol. 53, Issue 6, pp.687-700.
Tinto, V. (1986) Theories of student departure revisited. In J. smart (Ed.), Higher education: A
handbook of theory and research (Vol. 2, pp. 359-384). New York: Agathon.
Wilburn & McMillian, 2012
Tinto, V. (1993). Leaving college: Rethinking the causes and cures of student attrition (2nd
ed).
Chicago: University of Chicago Press.
Tinto, V. (1997) Classrooms as Communities: Exploring the Educational Character of Student
Persistence. Journal of Higher Education. Vol. 68, Issue 6, pp.599-623.
U.S. Department of Education (2000). National postsecondary student aid study, undergraduate
data analysis system. Dataset. Washington, DC: National Center for Education Statistics.
U.S. Department of Education (2001), National Center for Education Statistics, Integrated
Postsecondary Education Systems (IPEDS). 2001. Integrated postsecondary education.
US Department of Education (2007), National Center for Education Statistics, Integrated
Postsecondary Education Data Systems (IPEDS) “Student Financial Aid” survey,
(accessed October 2010).
US Department of Education (2011). Trends in Student Financing of Undergraduate Education:
Selected Years, 1995–96 to 2007–08. WEB TABLES. Retrieved 17 January 2012.
Van der Klaauw (2002). Estimating the Effect of Financial Aid Offers on College Enrollment: A
Regression-Discontinuity Approach, International Economic Review, Vol. 43, No. 4
(Nov.), pp. 1249-1287
Wohlgemuth, D., Whalen, D., Sullivan, J., Nading, C., Shelly, M., and Wang, Y. (2007).
Financial, Academic, and Environmental Influences on Retention and Graduation of
Students. Journal of College Student Retention, 8(4), 457-475.
Venezia, A., Kirst, M., & A. Antonio (2005). Betraying the College Dream: How Disconnected
K-12 and Postsecondary Education Systems Undermine Student Aspirations, Stanford
University Bridge Project Policy Brief.
Zhang, L. and Ness, E. C. (2010) Does State Merit-Based Aid Stem Brain Drain? Educational
Evaluation and Policy Analysis. EDUCATIONAL EVALUATION AND POLICY
ANALYSIS June 2010 vol. 32 no. 2. pp. 143-165

1031 17th
Avenue, South • Nashville, TN 37212-2201 • Telephone 615-242-6400 • Fax 615-242-8033
www.ticua.org