effects of extended early childhood intervention: early adult findings from the child-parent centers...
Post on 15-Jan-2016
217 views
TRANSCRIPT

Effects of Extended Early Childhood Intervention: Early Adult Findings from the Child-Parent Centers
Arthur J. Reynolds, Judy A. Temple, & Suh-Ruu Ou, University of Minnesota
Society for Research in Child DevelopmentMarch 30, 2007, Boston, MA.

What is PK-3 Education?
ProgramsPlanned interventions and services
beginning during any of the first 5 years of life and continue up to third grade
Practices Elements of PK-3 programs such as
preschool, full-day kindergarten, class sizes, parent involvement.

Rationale for PK-3
Help sustain effects of preschool and kindergarten programsPromote better early transitions Improve continuity of development Greater “dosage” will help children at risk
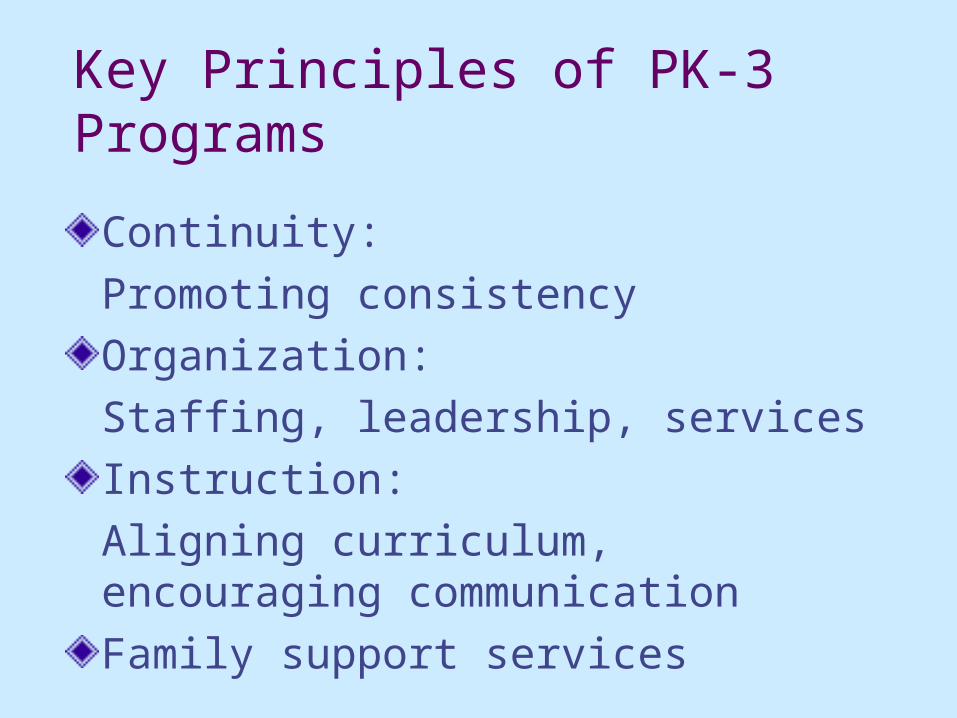
Key Principles of PK-3 Programs
Continuity: Promoting consistencyOrganization:Staffing, leadership, services Instruction: Aligning curriculum, encouraging communication Family support services

PK-3 Programs
Head Start/Follow Through Key: Home-school resource teacherChild-Parent CentersKey: organization and services Abecedarian Project Key: Home-school resource teacher Head Start-Public School TransitionKey: Family service coordinator, services
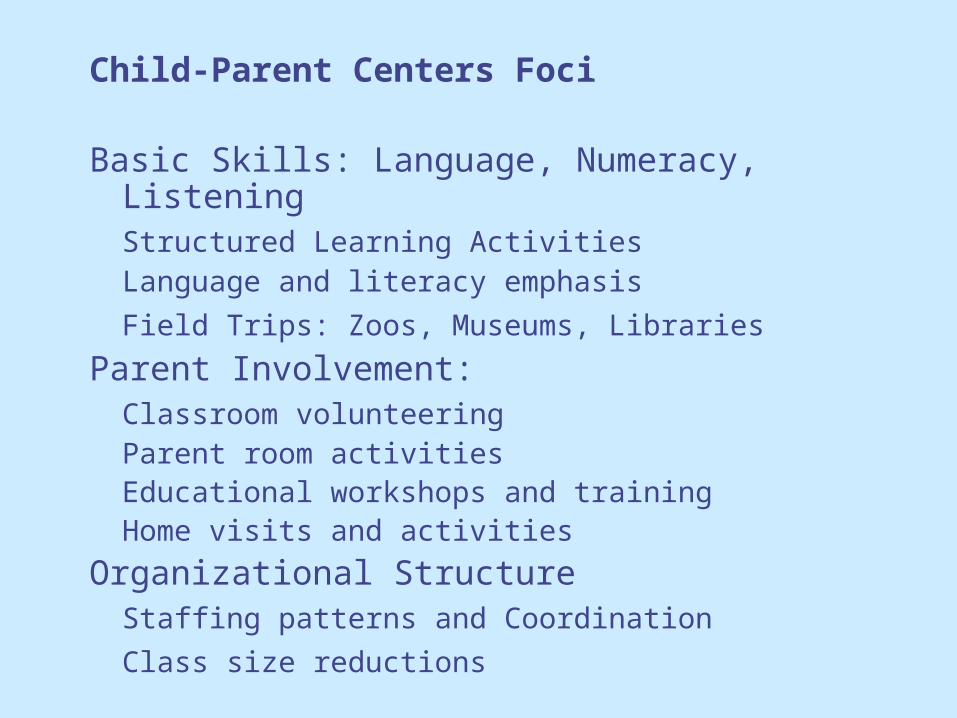
Child-Parent Centers Foci
Basic Skills: Language, Numeracy, ListeningStructured Learning ActivitiesLanguage and literacy emphasis
Field Trips: Zoos, Museums, Libraries
Parent Involvement:Classroom volunteeringParent room activitiesEducational workshops and trainingHome visits and activities
Organizational StructureStaffing patterns and Coordination
Class size reductions
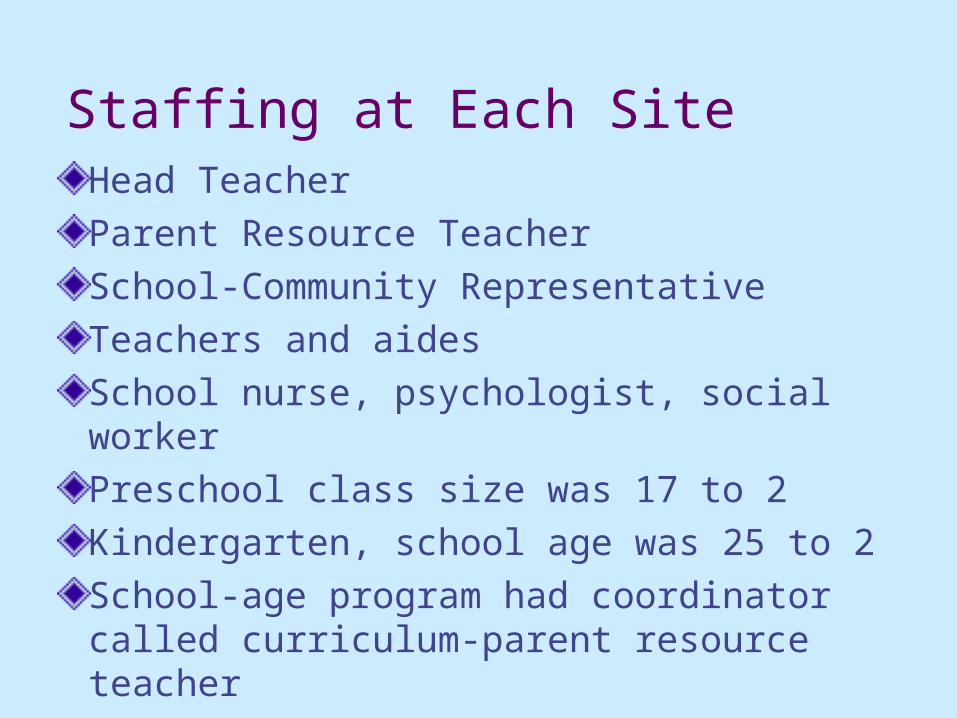
Staffing at Each SiteHead Teacher Parent Resource TeacherSchool-Community RepresentativeTeachers and aidesSchool nurse, psychologist, social workerPreschool class size was 17 to 2Kindergarten, school age was 25 to 2School-age program had coordinator called curriculum-parent resource teacher
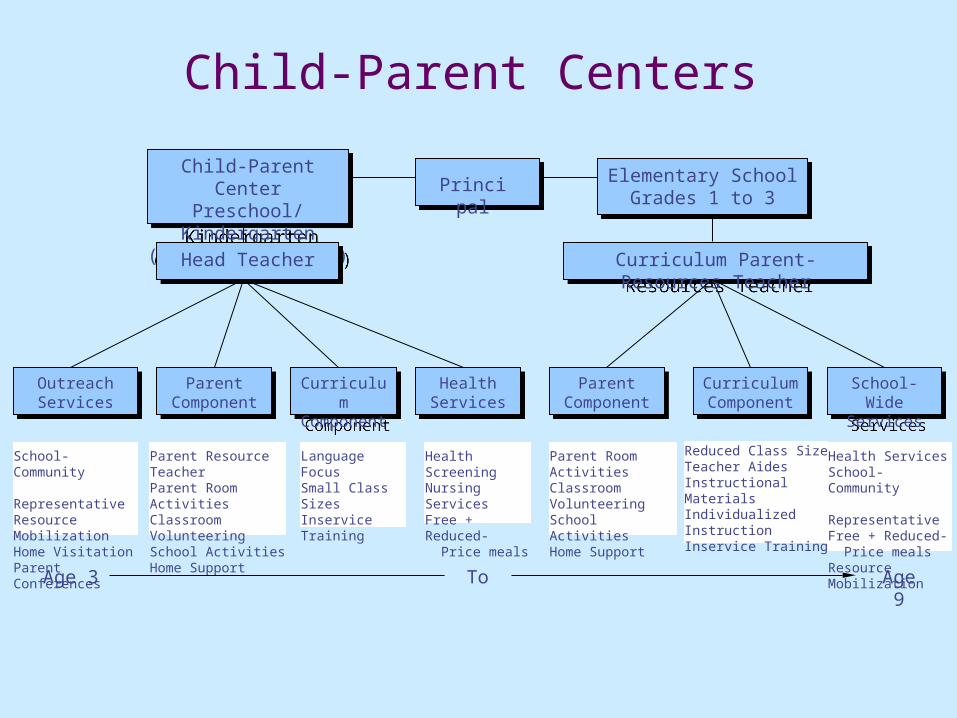
Child-Parent Centers
PrincipalChild-Parent Center
Preschool/Kindergarten(Wing or Building)
Child-Parent CenterPreschool/Kindergarten
(Wing or Building)
Elementary SchoolGrades 1 to 3
Elementary SchoolGrades 1 to 3
Curriculum Parent-Resources TeacherCurriculum Parent-Resources TeacherHead TeacherHead Teacher
OutreachServices
OutreachServices
ParentComponent
ParentComponent
CurriculumComponent
CurriculumComponent
HealthServices
HealthServices
ParentComponent
ParentComponent
CurriculumComponent
CurriculumComponent
School-WideServices
School-WideServices
School-Community RepresentativeResource MobilizationHome VisitationParent Conferences
Parent Resource TeacherParent Room ActivitiesClassroom VolunteeringSchool ActivitiesHome Support
Language FocusSmall Class SizesInservice Training
Health ScreeningNursing ServicesFree + Reduced- Price meals
Parent Room ActivitiesClassroom VolunteeringSchool ActivitiesHome Support
Reduced Class SizeTeacher AidesInstructional Materials Individualized InstructionInservice Training
Health ServicesSchool-Community RepresentativeFree + Reduced- Price mealsResource Mobilization
Age 3 To Age 9

Johnson Child-Parent Center
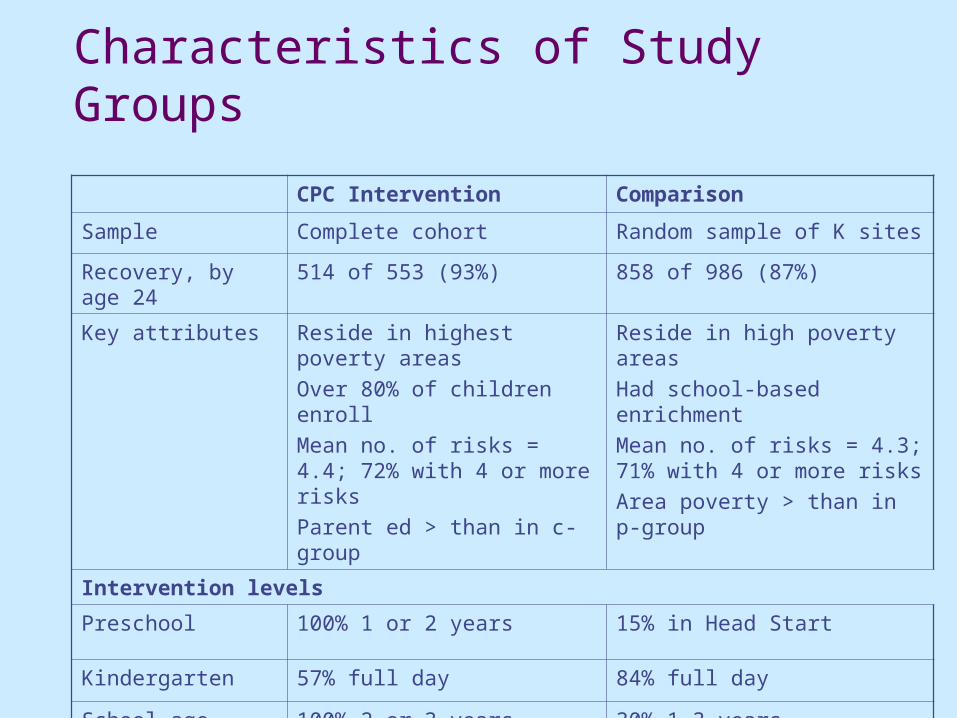
Characteristics of Study Groups
CPC Intervention Comparison
Sample Complete cohort Random sample of K sites
Recovery, by age 24
514 of 553 (93%) 858 of 986 (87%)
Key attributes Reside in highest poverty areasOver 80% of children enrollMean no. of risks = 4.4; 72% with 4 or more risksParent ed > than in c-group
Reside in high poverty areasHad school-based enrichmentMean no. of risks = 4.3; 71% with 4 or more risksArea poverty > than in p-group
Intervention levels
Preschool 100% 1 or 2 years 15% in Head Start
Kindergarten 57% full day 84% full day
School age 100% 2 or 3 years 30% 1-3 years
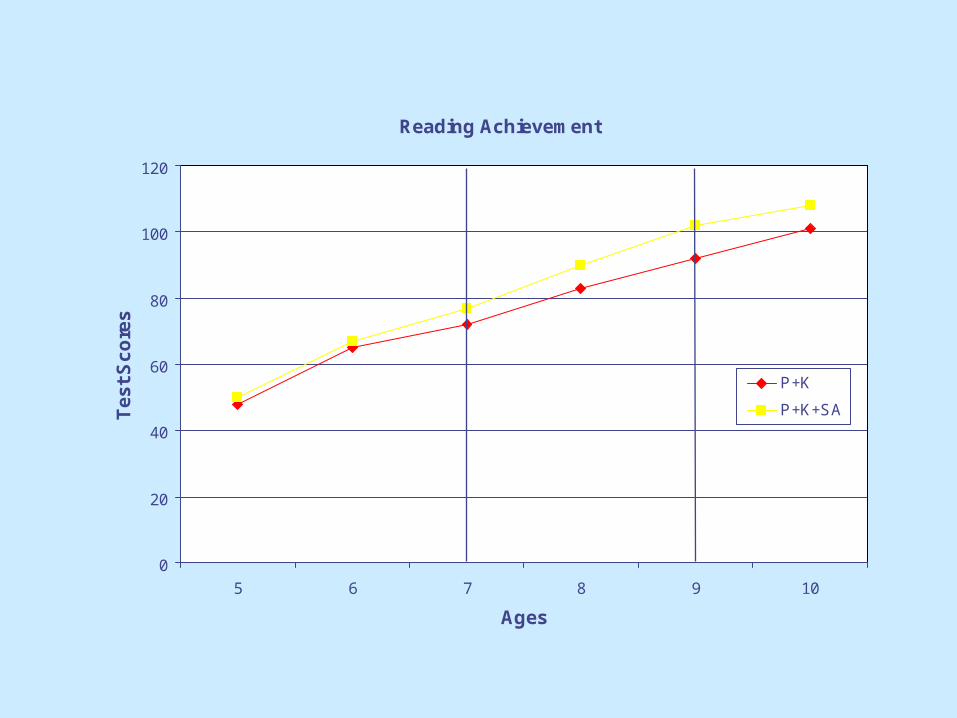
Reading Achievement
0
20
40
60
80
100
120
5 6 7 8 9 10
Ages
Te
st
Sc
ore
s
P+K
P+K+SA

Remedial and Child Welfare Services for Extended Intervention Groups
32.3
21.9 20.7
13.511.3
5.8
0
5
10
15
20
25
30
35
40
Per
cen
tag
e o
f S
amp
le
Grade retention Special education Child maltreatment
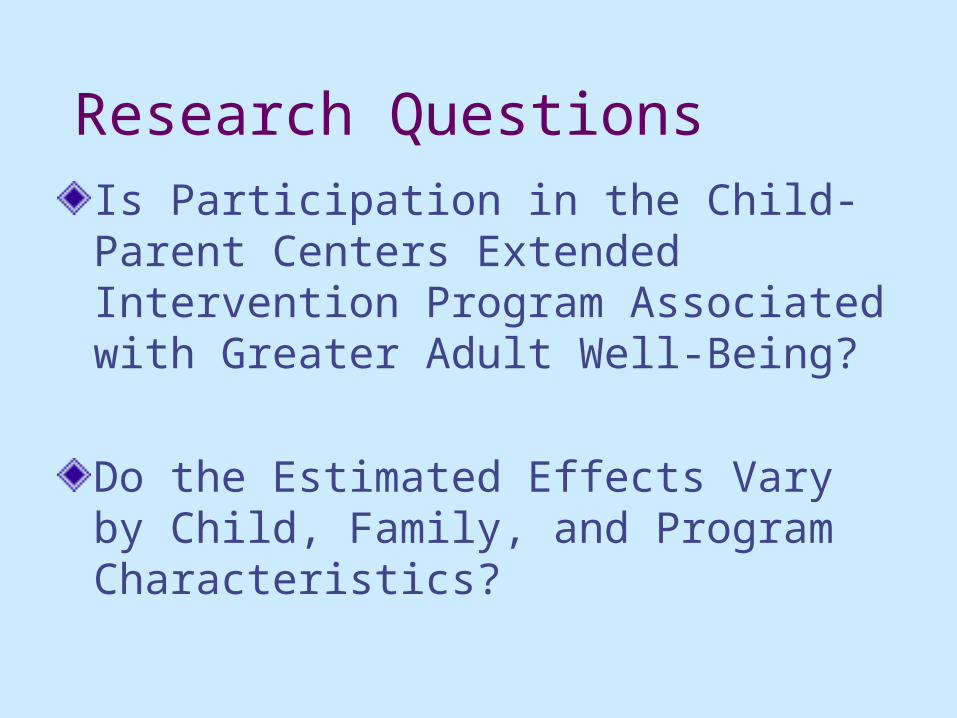
Research QuestionsIs Participation in the Child-Parent Centers Extended Intervention Program Associated with Greater Adult Well-Being?
Do the Estimated Effects Vary by Child, Family, and Program Characteristics?

Major Data SourcesTeacher ratings yearly from K-Grade 7. Parent ratings, Grades 2, 6, 11. Child ratings yearly from Grades 3-6, 10, 12, and at age 22-24.Interviews/essays with selected children at Grades 6 and 10.ITBS test scores yearly starting in K.Administrative records from schools, social services, child welfare, public health, justice system, employers, and higher ed.Community attributes from Census data.
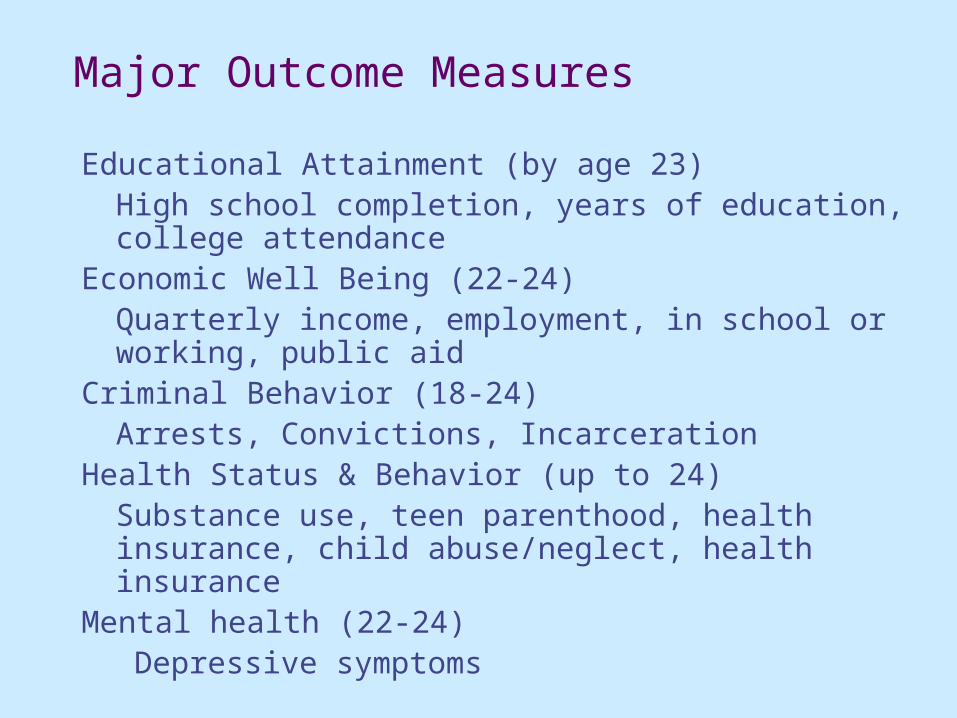
Major Outcome Measures
Educational Attainment (by age 23)High school completion, years of education, college attendance
Economic Well Being (22-24)Quarterly income, employment, in school or working, public aid
Criminal Behavior (18-24)Arrests, Convictions, Incarceration
Health Status & Behavior (up to 24)Substance use, teen parenthood, health insurance, child abuse/neglect, health insurance
Mental health (22-24) Depressive symptoms

Sample Sizes and Recovery Rates for Adult Follow Up
Outcome measure assessed at ages 22-24
Numberof cases
Recovery rate (%)
Educational attainment 1,368 88.9
Employment status 1,249 81.2
Arrest status/Incarceration history 1,418 92.1
Substance use/Mental health (self report)
1,142 76.4
Health insurance (self report/admin records)
1,277 85.5
Public aid history 1,315 88.0

Basic Impact Model1. 4 to 6 years of CPC starting in preschool
vs2a. All others with 0 to 4 years (Contrast 1)
or2b. CPC preschool/kindergarten only
(Contrast 2) Covariates (age 0 to 3)A. Sex of child, race/ethnicity, 8 family risk
indicators, child maltreatment reportB. Kindergarten word analysis (Contrast 2)
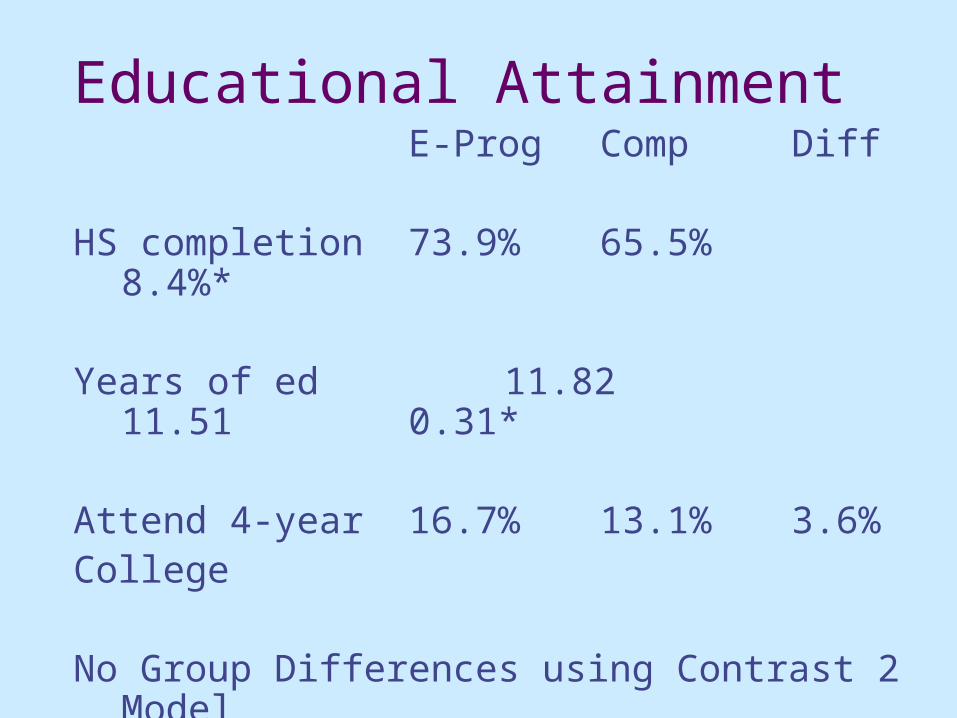
Educational AttainmentE-Prog Comp
Diff
HS completion 73.9% 65.5%8.4%*
Years of ed 11.82 11.510.31*
Attend 4-year 16.7% 13.1% 3.6%College
No Group Differences using Contrast 2 Model
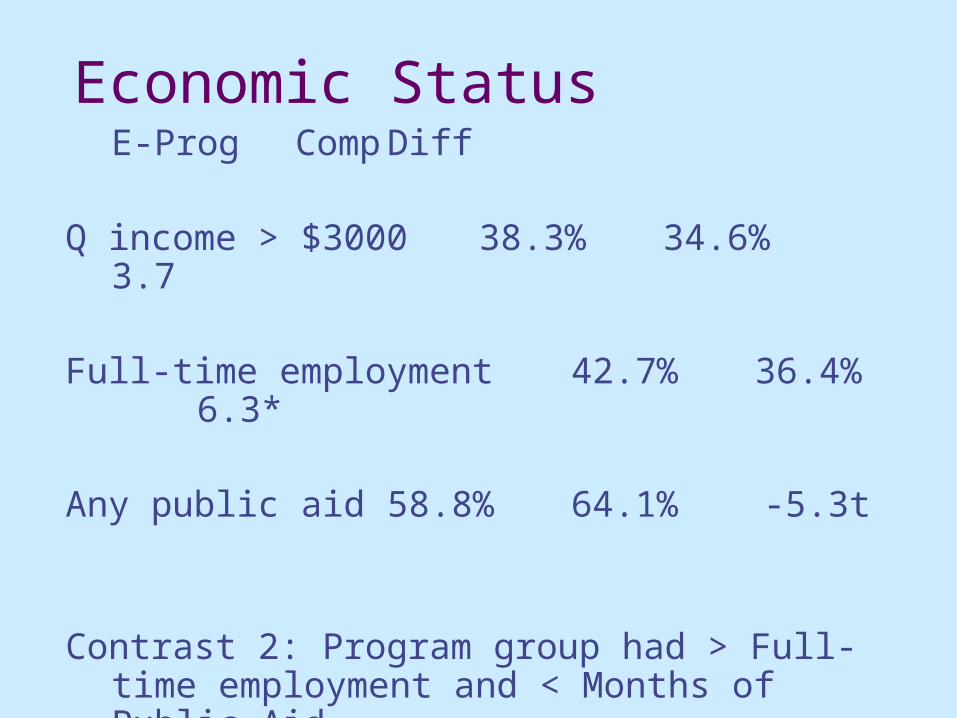
Economic StatusE-Prog Comp
Diff
Q income > $3000 38.3% 34.6% 3.7
Full-time employment 42.7% 36.4% 6.3*
Any public aid 58.8% 64.1% -5.3t
Contrast 2: Program group had > Full-time employment and < Months of Public Aid
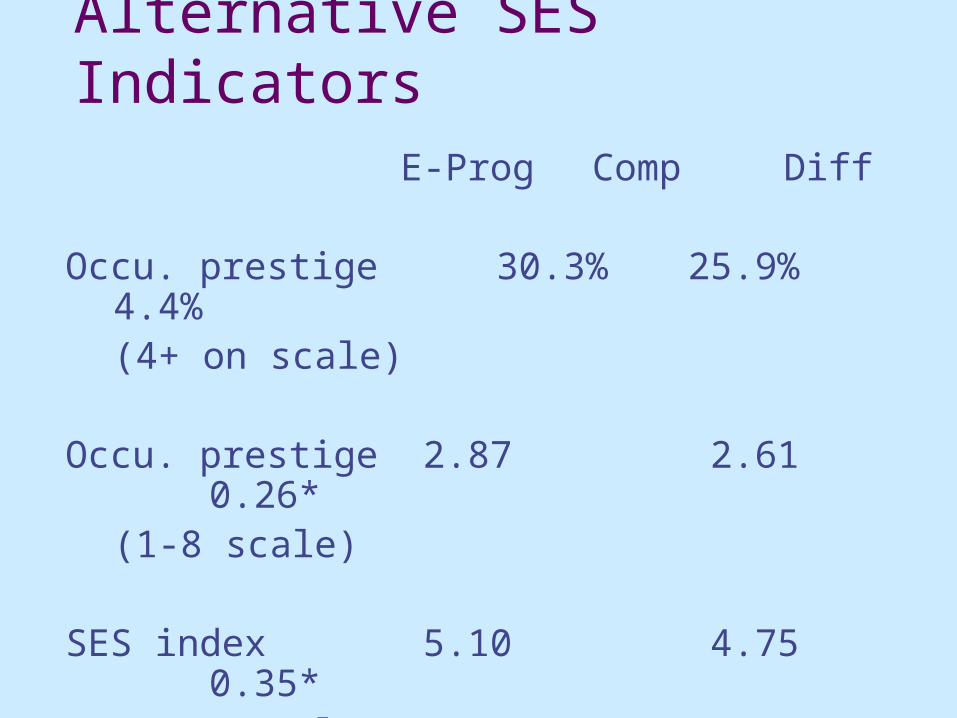
Alternative SES IndicatorsE-Prog Comp
Diff
Occu. prestige 30.3% 25.9% 4.4%(4+ on scale)
Occu. prestige 2.87 2.61 0.26*(1-8 scale)
SES index 5.10 4.75 0.35*(2-10 scale)
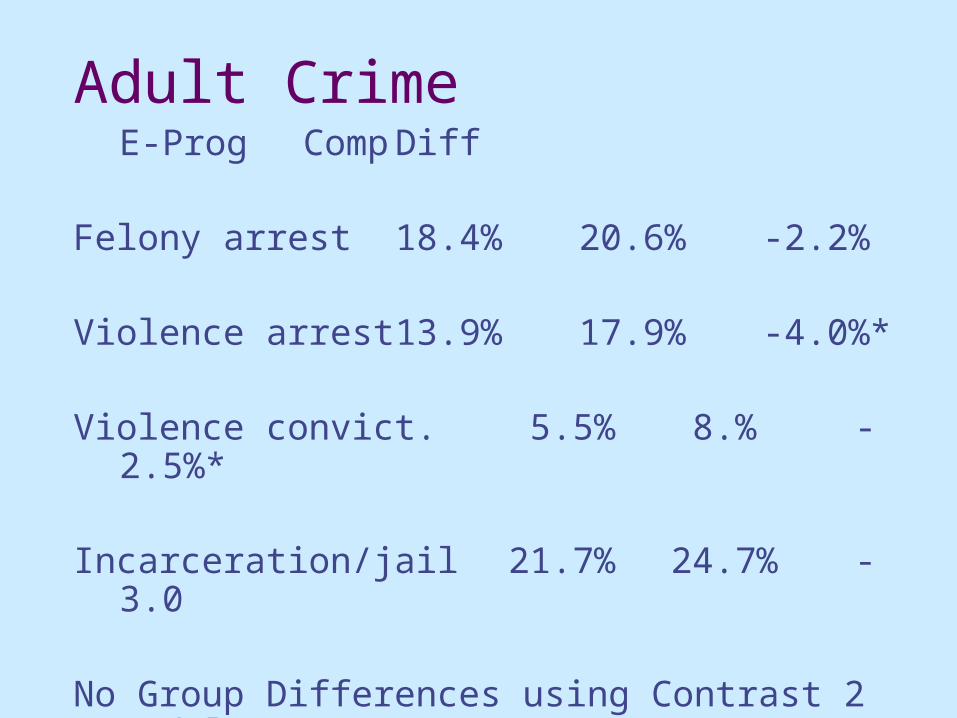
Adult CrimeE-Prog Comp
Diff
Felony arrest 18.4% 20.6% -2.2%
Violence arrest 13.9% 17.9% -4.0%*
Violence convict. 5.5% 8.% -2.5%*
Incarceration/jail 21.7% 24.7% -3.0
No Group Differences using Contrast 2 Model
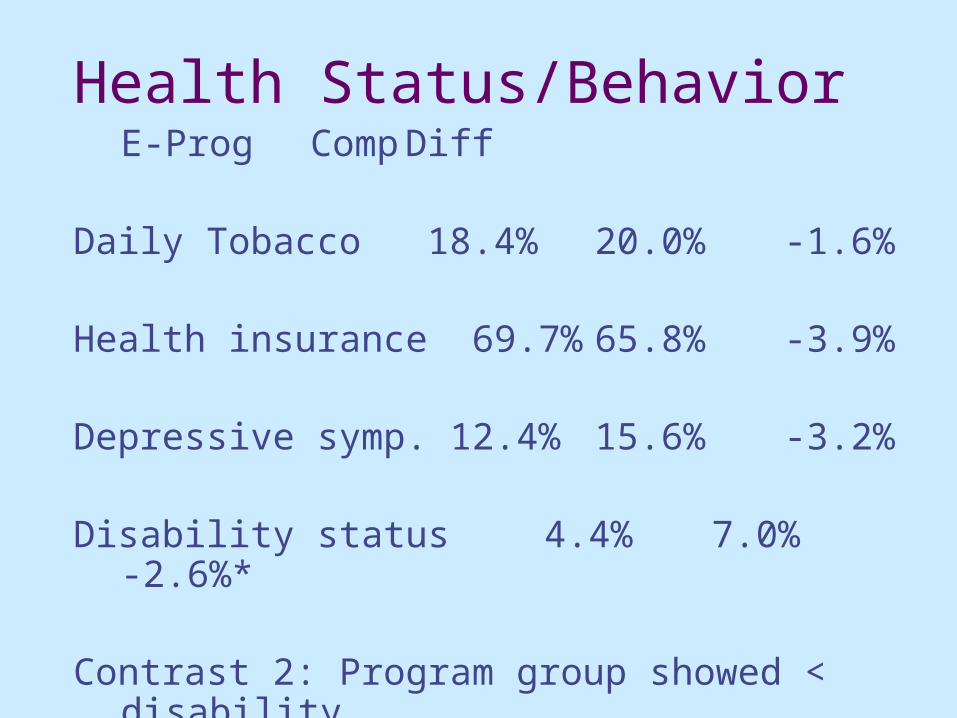
Health Status/BehaviorE-Prog Comp
Diff
Daily Tobacco 18.4% 20.0% -1.6%
Health insurance 69.7% 65.8% -3.9%
Depressive symp. 12.4% 15.6% -3.2%
Disability status 4.4% 7.0% -2.6%*
Contrast 2: Program group showed < disability

PK-3 Effects from ECLS-K Cohort
Selected children with these attributesPreschoolFull-day kindergartenSchool stable K-3High parent involvementInstructional time in readingTeacher certification
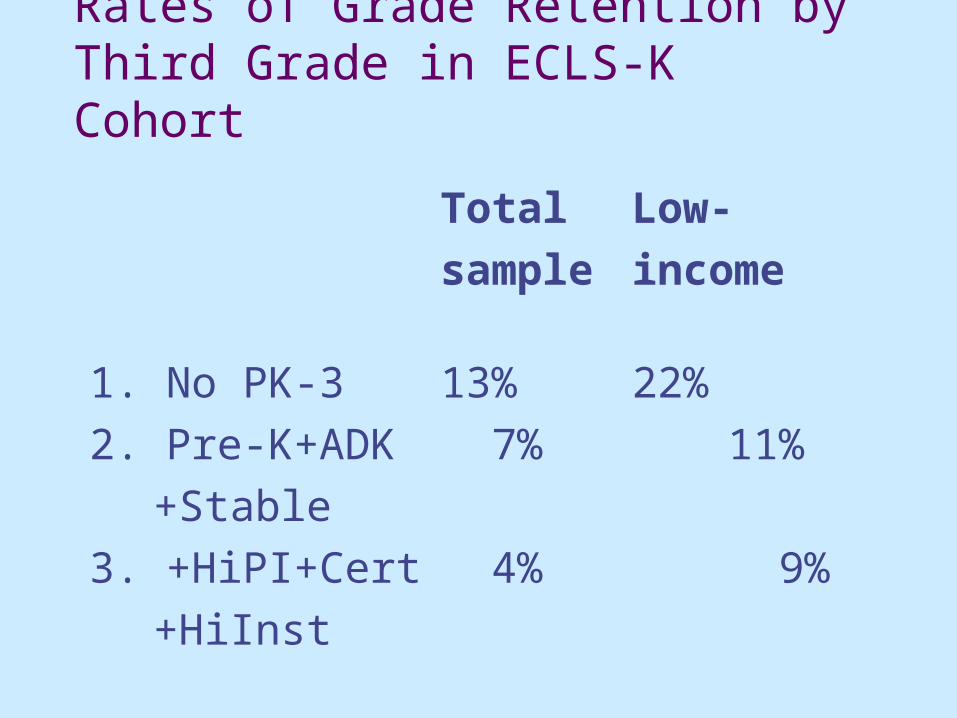
Rates of Grade Retention by Third Grade in ECLS-K Cohort
Total Low-sample income
1. No PK-3 13% 22%2. Pre-K+ADK 7% 11%
+Stable3. +HiPI+Cert 4% 9%
+HiInst

PK-3 Practices (Elements): Hierarchy of Effects on Child Development
Preschool participationSchool mobility/stabilityInstructional practices/Teacher qualityParent involvementReduced class sizesFull-day kindergarten
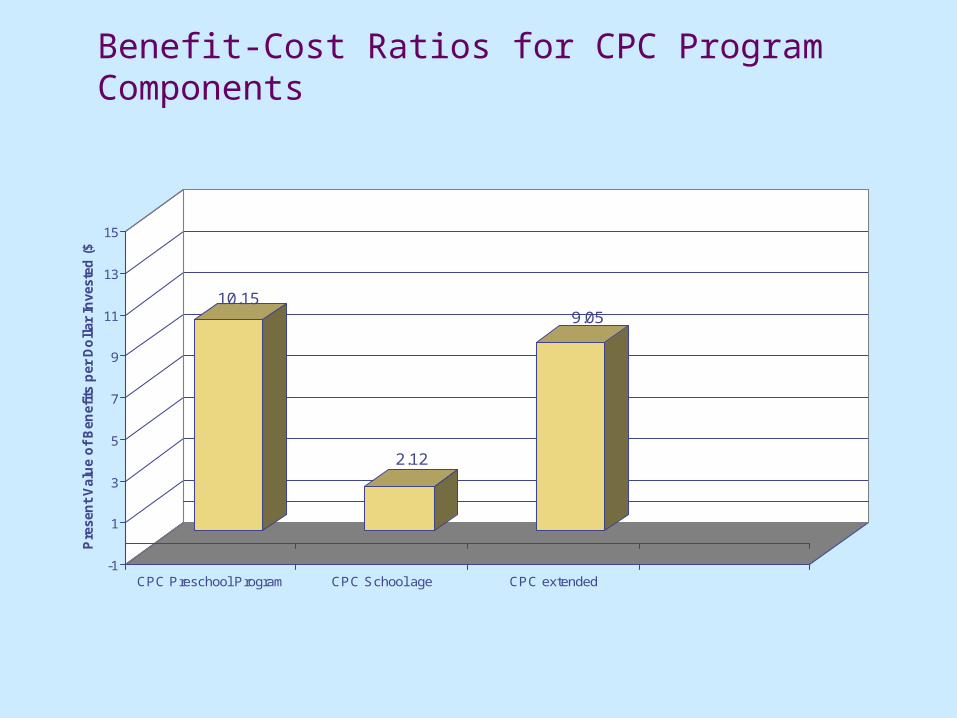
Benefit-Cost Ratios for CPC Program Components
10.15
2.12
9.05
-1
1
3
5
7
9
11
13
15
Pre
sen
t V
alu
e o
f B
en
efi
ts p
er
Do
llar
Investe
d (
$)
CPC Preschool Program CPC School age CPC extended

Conclusions and Implications
1. CPC PK-3 Model Demonstrated Positive Impacts on Some Indicators of Adult Well-Being.
2. Findings Varied by Comparison Group Approach.
3. Impact on Full-Time Employment, Public Aid, and Disability Status were most Consistent.
4. The CPC Model of PK-3 has Demonstrated relatively High Economic Returns.

Recommendations
1. Disseminate PK-3 Programs and Practices based on Key Principles of Effectiveness.
2. Use Evidence on Cost-effectiveness to Better Prioritize Funding of PK-3 Programs & Practices.
3. Different Models of PK-3 should be Investigated across Contexts.
4. More Evidence is Needed on the Relative Contributions of PK-3 Practices/Elements.

For more information about the Chicago Longitudinal Study, contact:
Arthur Reynolds, Institute of Child Development ([email protected])
Judy Temple, Humphrey Institute and Dept. of Applied Economics ([email protected])
Suh-Ruu Ou, Institute of Child Development ([email protected])
Funding support provided by:Foundation for Child DevelopmentNICHDDoris Duke Charitable Foundation
Web Site: www.education.umn.edu/icd/reynoldslab/ www.waisman.wisc.edu/cls/