effects of exhaust gas recirculation on …kirloskar engine, water cooled, direct injection...
TRANSCRIPT

http://www.iaeme.com/IJMET/index.asp 589 [email protected]
International Journal of Mechanical Engineering and Technology (IJMET)
Volume 10, Issue 12, December 2019, pp. 589-611, Article ID: IJMET_10_12_054
Available online at http://www.iaeme.com/ijmet/issues.asp?JType=IJMET&VType=10&IType=12
ISSN Print: 0976-6340 and ISSN Online: 0976-6359
© IAEME Publication
EFFECTS OF EXHAUST GAS RECIRCULATION
ON TEMPERATURE, USING BIODIESEL
BLENDS
Semakula Maroa
Department of Mechanical Engineering, Green Energy Group, South Africa
https://orcid.org/0000-0002-4777-7197
Freddie Inambao
University of KwaZulu-Natal Durban, South Africa
https://orcid.org/0000-0001-9922-5434
ABSTRACT
This experimental work compared the effects of temperature and emissions
produced using waste plastic pyrolysis oil (WPPO) biodiesel blends under the
influence of exhaust gas recirculation (EGR). The mixtures were prepared in the
ratios of 10 %, 20 %, 30 %, 40 % and 100 % for 90WPPO10, 80WPPO20,
70WPPO30, 60WPPO40 and WPPO100 respectively. The EGR flow rate was 5 %, 10
%, 15 %, 20 %, 25 % and 30 % respectively. Testing and performance was on a
Kirloskar engine, water cooled, direct injection operating at 1500 rpm and a torque of
28 Nm. The EGR system was modified with an addition of the EGR and valve in the
exhaust system. The study had three objectives: (i) to investigate the effect of
temperature on the emission characteristics of a diesel engine using WPPO biodiesel
blends compared to conventional diesel (CD) baseline fuel. (ii) To find the effect of
EGR on WPPO biodiesel ratio on the exhaust gas temperature (EGT) compared to
baseline CD fuel. (iii) To find the trade-off point for EGR percentage flow rate in
relation to WPPO biodiesel blends and exhaust gas temperatures (EGTs). Following
testing and evaluation, the highest EGT obtained for CD was 456 ⁰C compared to 490
⁰C for WPPOB100 blend both at 0 % EGR flow rate. However, the other WPPO
blends showed trends of decreasing temperatures with the application of EGR
percentage flow rate. Other results showed that increasing the blend ratio and the
EGR percentage flow rate increased smoke emissions across all the WPPO blends
tested. This study confirms that WPPO biodiesel blends can produce lower EGT
temperatures with application of the EGR technique of NOX control, but with higher
emissions of UHC for WPPO100 blend.
Keywords: Biodiesel blend ratio, EGR flow rate, Exhaust gas temperature, Waste
plastic pyrolysis oil.
Semakula Maroa and Freddie Inambao
http://www.iaeme.com/IJMET/index.asp 590 [email protected]
Cite this Article: Semakula Maroa and Freddie Inambao, Effects of Exhaust Gas
Recirculation on Temperature, Using Biodiesel Blends. International Journal of
Mechanical Engineering and Technology 10(12), 2019, pp. 589-611.
http://www.iaeme.com/IJMET/issues.asp?JType=IJMET&VType=10&IType=12
1. INTRODUCTION
In order to reduce dependency on fossil fuel especially diesel fuel there has been increased
research on the biofuels classified as alternative or renewable fuels. Internationally
government policies are focusing on alternative energy, especially renewable energy, and the
use of and conversion of waste to energy. Despite years of research and improvement in
petroleum fossil fuels and their combustion and emission characteristics, emissions from these
fuels remains a divisive issue in the automotive manufacturing and transport sectors. The
problem of fossil fuels is acute considering their limited supply, unpredicted price increments,
and the turmoil in oil producing regions in the world. This creates the need for utilization of
alternative fuels and blends as sources of fuel energy. This should be done in a sustainable
manner, while meeting stringent production and emission standards now and in the immediate
future.
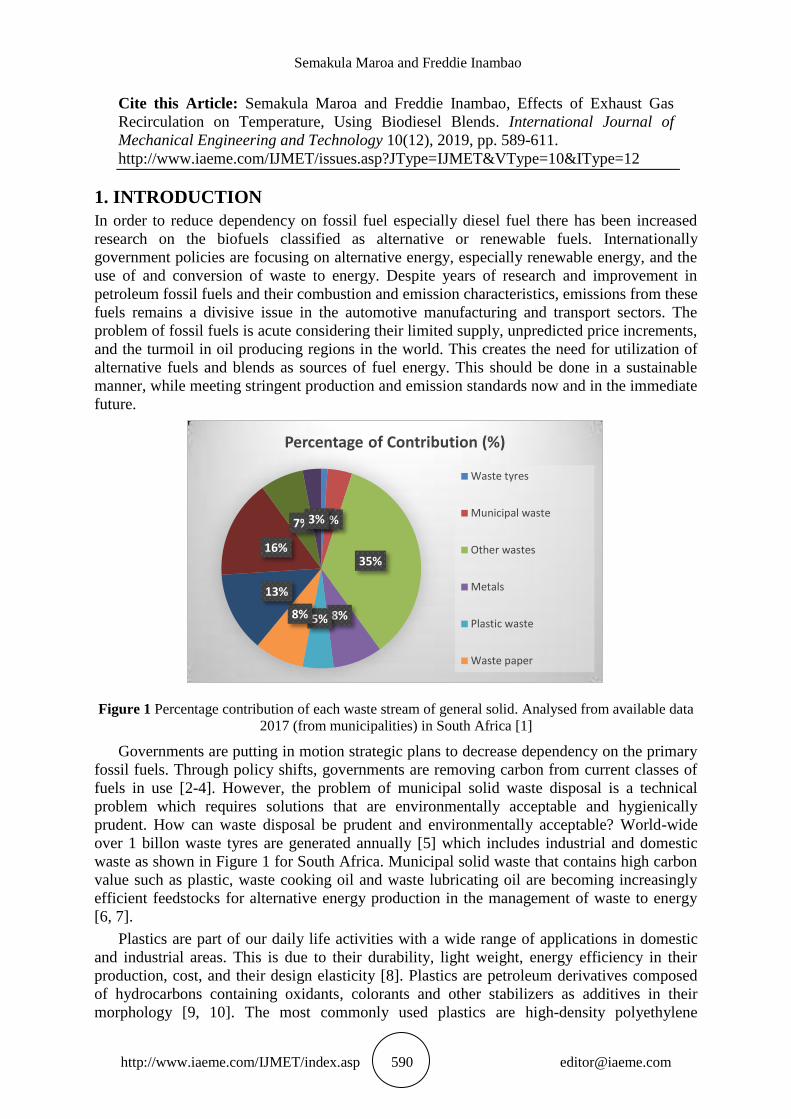
Figure 1 Percentage contribution of each waste stream of general solid. Analysed from available data
2017 (from municipalities) in South Africa [1]
Governments are putting in motion strategic plans to decrease dependency on the primary
fossil fuels. Through policy shifts, governments are removing carbon from current classes of
fuels in use [2-4]. However, the problem of municipal solid waste disposal is a technical
problem which requires solutions that are environmentally acceptable and hygienically
prudent. How can waste disposal be prudent and environmentally acceptable? World-wide
over 1 billon waste tyres are generated annually [5] which includes industrial and domestic
waste as shown in Figure 1 for South Africa. Municipal solid waste that contains high carbon
value such as plastic, waste cooking oil and waste lubricating oil are becoming increasingly
efficient feedstocks for alternative energy production in the management of waste to energy
[6, 7].
Plastics are part of our daily life activities with a wide range of applications in domestic
and industrial areas. This is due to their durability, light weight, energy efficiency in their
production, cost, and their design elasticity [8]. Plastics are petroleum derivatives composed
of hydrocarbons containing oxidants, colorants and other stabilizers as additives in their
morphology [9, 10]. The most commonly used plastics are high-density polyethylene
1% 4%
35%
8% 5% 8%
13%
16%
7% 3%
Percentage of Contribution (%)
Waste tyres
Municipal waste
Other wastes
Metals
Plastic waste
Waste paper

Effects of Exhaust Gas Recirculation on Temperature, Using Biodiesel Blends
http://www.iaeme.com/IJMET/index.asp 591 [email protected]
(HDPE), followed by the polyvinyl chloride (PVC) and the polypropylene (PP) [11, 12]. The
conversion of waste plastic is done through the pyrolysis process which transforms the
polymers into basic monomers or hydrocarbons as a chemical way of recycling of plastic
waste [13]. The pyrolysis process as a technique is effective and is a promising option for
conversion of mass to energy.
This pyrolysis process yields hydrocarbons with almost identical qualities and
characteristics of petroleum-based fossil fuels [14, 15]. The process cracks plastic materials
by heating them into low molecular weight products able to be utilized as energy sources [16,
17]. Pyrolysis involves the thermal decomposition of long-chained hydrocarbon structures
into small components at high temperatures [9, 18]. The required temperature range for the
pyrolysis process is normally between 500 ⁰C to 700 ⁰C. This temperature range is not easy to
achieve and maintain during reaction in a pyrolysis reactor [19], which has led to the
inclusion of temperature catalysts such as SiO2, Al2O3, CaO and zeolite. The inclusion of
these catalysts enables reactors to reduce the temperature requirements to lower temperatures
that can be sustained and maintained for the pyrolysis process [20].
Plastics in municipal solid waste management sites account for 7 % to 8 % of the entire
weight of the waste generated. However, this translates to 20 % to 30 % of the total volume of
waste generated. Therefore, separation of other waste needs to be carried out through sorting
through mechanical and other forms [21, 22]. Municipal solid waste is divided into three main
categories: (1) combustibles like paper, textiles, wood and kitchen waste, (2) incombustibles
such as metals, glass and ceramics, and (3) plastics [23, 24]. Figure 1 shows the waste stream
percentage contributions to waste production in South Africa.
A number of studies have been conducted to study the interaction of waste plastic
pyrolysis oil blends with diesel engines. These researchers include such as: [25-36]. All the
studies reported that waste plastic pyrolysis oil diesel blends can run basic diesel engines,
with or without prior modification of the engines.
Rakopoulos et al. [37] investigated the effects of additives in diesel alcohol blends using
ratios of 8 %, 16 % and 24 % and reported significant reduction in the NOX, exhaust gas
temperature, smoke density (opacity) and carbon monoxide (CO). However, unburned
hydrocarbon (UHC) emissions, brake specific fuel consumption (BSFC) and brake thermal
efficiency (BTE) reportedly increased compared to CD fuel levels. This study is identical to
other studies that have been conducted by other researchers [37, 38-44].
However, it was further observed that WPPO blends have lower BTE coupled with high
exhaust emissions of CO, UHC and NOX. The maximum heat release rate of WPPO blends
was also reported to be higher compared to CD fuel. This was due to the effect of longer
ignition delay associated with WPPO blends. However, regarding emissions, the authors
reported low smoke emissions, which reduced significantly by 40 % to 50 %, with soot
emissions also observed to be low. Additionally, Soloiu et al. [45] reported that the higher
viscosity of the waste plastic pyrolysis oil blends increased the injection duration compared to
diesel fuel [45, 46]. This created a gradual in-cylinder pressure increase and low peak
pressure rise.
There has been additional research in other areas of engine performance notably the
effects of advanced injection timing (AIT) on diesel engines, especially on biodiesels that are
derived from plastic waste by the process of pyrolysis. Researchers such as Gnanasekaran et
al. [47], and Mani and Nagarajan[48] have reported increased carbon dioxide CO2 with the
use of WPPO blends. Further, these authors report a reduction in emissions of CO, UHC and
NOX with application of AIT technique and use of WPPO diesel blends. This has led to
improved fuel utilization during combustion hence increased BTE. However, in other research
using the AIT technique with 20 % tyre pyrolysis oil and 80 % Jatropha ester oil Sharma and

Semakula Maroa and Freddie Inambao
http://www.iaeme.com/IJMET/index.asp 592 [email protected]
Murugan [49] reported increased NOX with lower BSFC, CO, UHC and PM respectively.
Wamankar and Murugan [50] conducted a follow up experiment using a ratio of 90 % diesel
and 10 % waste tyre pyrolysis oil and reported a high BTE and increased NOX emissions, but
decreased values for BSFC and emissions of CO and UHC.
2. EXPERIMENTAL SET-UP
2.1. Experimental Apparatus and Equipment
The engine experimental set up is shown on Figure 2 followed by its position names.
Dynamometer Test Enginecoupling
Diesel tank Blended biodiesel tank
Data AcquisitionCharge amplifier
Gate valve
Gate valve
Exhaust Emissions
Emission Analyzer
Position Sensor
Engine Pressure Sensor
computer
Figure 2 Experimental test engine schematic set-up diagram
1. Cylinder pressure sensor, 2. EGR control valve, 3. EGR cooler, 4. Injection Control Unit, 5.
Exhaust gas exit, 6. Air box, 7. Signal amplifier, 8. Gas analyser, 9. Air flow meter, 10. Data
acquisition system, 11. Crank position sensor, 12. Dynamometer, 13. Engine, 14. Airflow rate meter,
15. Cooling water exit to the cooling tower, 16. Dynamometer drive coupling
Figure 3 Photo of the lab set-up of the additional fabricated and modified exhaust recirculation
mechanism to conform to the engine experimental set-up shown in Figure 2

Effects of Exhaust Gas Recirculation on Temperature, Using Biodiesel Blends
http://www.iaeme.com/IJMET/index.asp 593 [email protected]
Table 1 The engine specifications, position value and their type
Parameters Position value
Ignition type 4 (Stroke) DICI
Number of cylinders 1
Model TV 1
Cooling medium Water
Manufacturer Kirloskar
Revolutions per minute 1500
Brake power 3.75 kW
Cylinder bore 87.5 mm
Piston stroke 110 mm
Compression ratio 18.5:1
Connecting-rod length 234
Engine capacity 0.661 L
Dynamometer make 234
Injection timing 23.4° bTDC
Maximum torque 28 N-m @ 1500
Injection pressure 250 Bar
2.2. Waste Plastic Preparation and the Conversion Process
The plastic waste used in this study was obtained from a municipal solid waste management
site. The waste was taken to a sorting area and dust and other unwanted particles were
removed. The sorted and cleaned plastics were shredded into appropriate sizes of 25 mm to 50
mm. This prepared them for the reactor after which they were loaded onto the reactor loader.
Using an electrical control panel, the system was activated, with the processes from then on
running automatically as shown in Figure 4. After the completion of the pyrolysis process, the
reactor system requires a cooling time of 4 h to 5 h. This can take two forms: natural cooling
and the gas cooling which shortens the cooling time by almost half. The gases recommended
as cooling agents are nitrogen and CO2.
Figure 4 The waste plastic pyrolysis oil processing plant flow chart
1. Pyrolysis reactor, 2. Carbon black discharge, 3. Carbon black deep processing, 4. Exhaust smoke
discharge, 5. Gas separator, 6. Smoke scrubber to take out colour and odour, 7. Condenser, 8.
Chimney, 9. Oil tank, 10. Synchronized gas purification, 11. Synchronised gas-recycling system, 12.
Extra gas burning, 13. Heating furnace during operation, 14. Loading of material.
Semakula Maroa and Freddie Inambao
http://www.iaeme.com/IJMET/index.asp 594 [email protected]
2.3. Physical Properties of Waste Plastic Pyrolysis Oil (WPPO) Sample
Table 2 shows the results of the physical properties of the waste plastic pyrolysis oil obtained
through the pyrolysis process of the waste plastics from municipal solid waste (MSW)
management sites, at optimized conditions and compared to the properties of CD fuel oil.
Table 2 The test fuel properties, their units of measurement, standard methods of testing and the
values for CD in comparison to the values of waste plastic pyrolysis oil
Property Unit CD WPPO STANDARD
Appearance - Clear/brown Clear/amber Visual
Density @ 20 kg/M3 838.8 788.9 ASTM D1298
Kinematic viscosity @
40 ⁰C
cSt 2.32 2.17 ASTM D445
Flash point ⁰C 56.0 20.0 ASTM D93
Cetane index - 46 65 ASTM D4737
Hydrogen % 12.38 11.77 ASTM D7171
Cu corrosion 3hrs @ 100 ⁰C - 1B ASTM D130
Carbon % 74.99 79.60 ASTM D 7662
Oxygen % 12.45 7.83 ASTM D5622
Sulphur content % < 0.0124 0.15 ASTM D4294
IBP temperature ⁰C 160 119 ASTM D86
FBP temperature ⁰C 353.5 353.5 ASTM D86
Recovery % 98 -
Residue and loss % 2.0 -
Gross calorific value kJ/kg 44.84 42.15 ASTM D4868
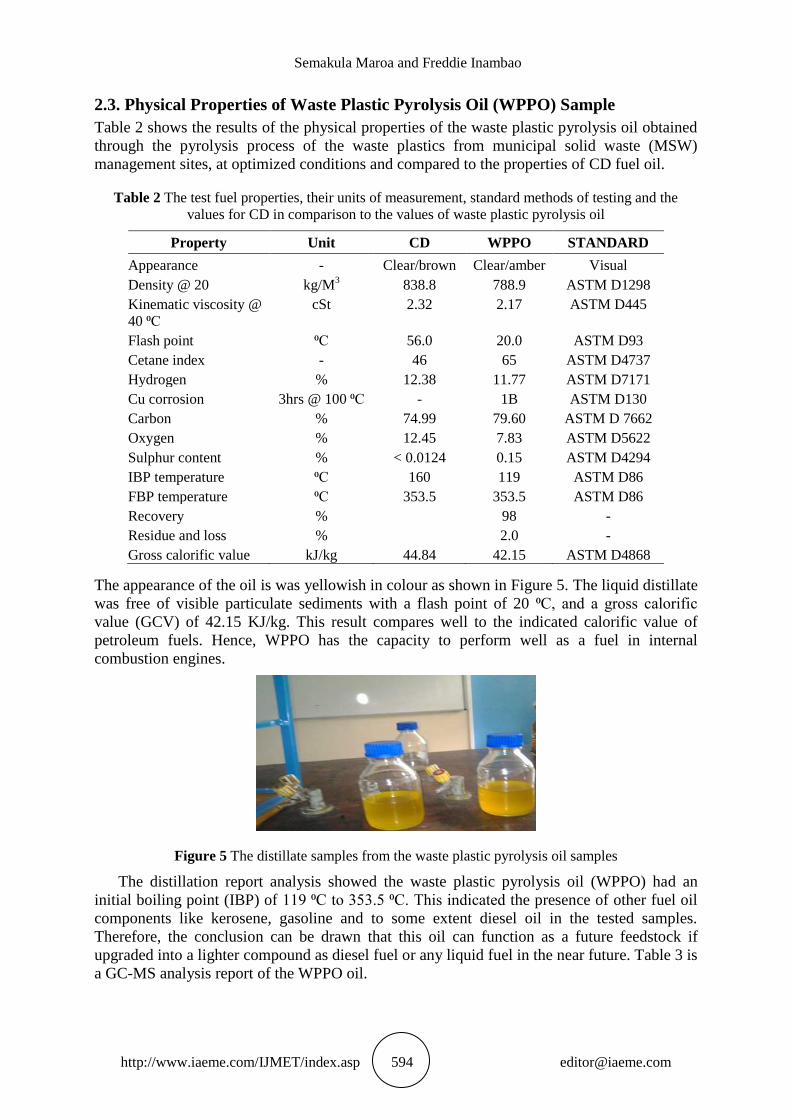
The appearance of the oil is was yellowish in colour as shown in Figure 5. The liquid distillate
was free of visible particulate sediments with a flash point of 20 ⁰C, and a gross calorific
value (GCV) of 42.15 KJ/kg. This result compares well to the indicated calorific value of
petroleum fuels. Hence, WPPO has the capacity to perform well as a fuel in internal
combustion engines.
Figure 5 The distillate samples from the waste plastic pyrolysis oil samples
The distillation report analysis showed the waste plastic pyrolysis oil (WPPO) had an
initial boiling point (IBP) of 119 ⁰C to 353.5 ⁰C. This indicated the presence of other fuel oil
components like kerosene, gasoline and to some extent diesel oil in the tested samples.
Therefore, the conclusion can be drawn that this oil can function as a future feedstock if
upgraded into a lighter compound as diesel fuel or any liquid fuel in the near future. Table 3 is
a GC-MS analysis report of the WPPO oil.

Effects of Exhaust Gas Recirculation on Temperature, Using Biodiesel Blends
http://www.iaeme.com/IJMET/index.asp 595 [email protected]
Table 3 GC-MS laboratory analysis report with chemical compositions, carbon chains, and percentage
compositions of the pyrolytic waste plastic oil
2.4. Experimental Procedure
a. The engine employed for this work was a Kirloskar experimental variable compression
engine, four-stroke single cylinder, water-cooled developing 3.75 kW of power at 1500 rpm.
The schematic is presented in Figure 2.
b. The technical specifications of the experimental variable compression engine are indicated
in Table 1. A dynamometer provided the engine with load during the experimentation.
Measurements for the engine intake airflow was through an air box fitted to the engine intake
manifold system modified to use a standard orifice mechanism.
c. The fuel flow rate to the experimental engine was measured using a digital fuel gauge with
a stopwatch mounted to measure time taken for the fuel to be consumed.
d. The exhaust gas temperatures were measured using mounted temperature thermocouples of
k-2 type, including the EGR temperature, which was measured before it mixed with the intake
air fresh charge and the constituents of the combustion chamber, through the same k-2
thermocouples.
e. A cylinder pressure transducer was mounted on the engine cylinder head to monitor
cylinder combustion pressure and collect data values through a system charge amplifier
connected to a data acquisition machine.
f. The crankshaft position or the crank angle was monitored through a mounted encoder near
the crankshaft pulley area.
g. The emission gases during the experiment were monitored through a five-gas exhaust gas
analyser, and an AVL 437C smoke meter was employed to measure the smoke intensity.
h. Since the engine developed maximum power at 1500 rpm and it being a variable
compression engine, all the experiments were conducted based on this nominal engine speed
at part load and full load. Part engine load was described as 50 % of engine load and full
engine load was described as engine running at 100 % load, with a fixed compression ratio of
18.5:1.
i. The EGR system and the experimental engine were modified to enable data to be collected
so that the study could be conducted. The exhaust gases were tapped from the exhaust pipe
and brought to the intake manifold air intake system via the air flow meter box. Through a
manually controlled gate valve, the mixing of EGR gases and the fresh air intake was
possible.
j. The EGR quantity was determined as per Eq. 1. The EGR percentage rate flow was divided
into the following flow rates 0 %, 5 %, 10 %, 15 %, 20 %, 25 %, and 30 %, at intervals of 5
%.
Equation 1
Molecular formula Percentage composition
C10 66.32
C10-C15 4.38
C15-C20 12.66
C20-C25 8.22
C25-C30 8.42

Semakula Maroa and Freddie Inambao
http://www.iaeme.com/IJMET/index.asp 596 [email protected]
k. The waste plastic pyrolysis oil fuel blends were prepared in percentages and blended with
diesel fuel in ratios of 10 %, 20 %, 30 %, 40 % and 100 %, where WPPO10 blend was 90 %
CD fuel and 10 % waste plastic pyrolysis oil (WPPO) fuel in that order respectively for the
remaining blends. Therefore, throughout this experiment blends were referred to as
90WPPOB10 with 10 denoting the percentage blend of plastic oil by volume supplied.
l. To avoid experimental fuel from contamination each test was conducted after a thorough
evacuation procedure. The previous preceding experiment fuel lines and the fuel injection
system mechanism of the test engine were evacuated before the next trial. This made it
possible to collect good data and measurements with inputs from the test mode only, without
fear of contamination and poor results from error.
2.5. The Analysis of Error and Percentage Uncertainties
This process was carried out for the purpose of performing and identifying the accuracy and
precision of the measuring tools and instruments used in this experiment work. Errors can
occur due to conditions outside of the experiment itself, for example, from calibration of the
instruments, observational errors, manufacturing errors, experimental set-up and planning,
and environmental conditions during the experiment (Senthilkumar & Sankaranarayanan,
2015)[51]. The instruments used and their percentage error of analysis are listed in Table 4
with the uncertainties of CO, CO2, UHC, NOX, exhaust gas temperature (EGT) and smoke
opacity. These percentages of error analysis were derived from the following formula, the root
sum square method and expressed in equation form [27] as:
√∑
Equation 2
Where R is the total uncertainty percentage, is the individual uncertainty of all the
calculated operating parameters, is the total number of the parameters in the experiment and
is the ith
term of the computed parameters.
Table 4 Instruments used for measurements and data collection, their measuring range, accuracies and
percentages of inaccuracies, as calculated from Eq. 3
Instrument Accuracy Measuring Range Percentage
inaccuracies
AVL 437C
(Smoke meter)
Smoke intensity
± 1 %
0 % to 100 %
± 1
AVL pressure
transducer GH14D
± 0.01 bar
0 bar to 250 bar
± 0.01
AVL 365C Angle encoder
± 1⁰
-
± 0.2
AVL digas 444 (five gas
analyser)
CO ± 0.03 % to ± 5 % 0 % to 10 % by vol ± 0.3
CO2 ± 0.5 % to ± 5 % by vol
0 % to 20 % vol
± 0.2
O2
± 5 % by vol
0 % to 22 % by vol
± 0.3
HC
± 0.1 % to ± 5 %
0 ppm to 20000 ppm by
vol
± 0.2
NOx
± 10 %
0 ppm to 5000 ppm by
vol
± 0.2
Effects of Exhaust Gas Recirculation on Temperature, Using Biodiesel Blends
http://www.iaeme.com/IJMET/index.asp 597 [email protected]
K-2 Thermocouple
± 1ºC
0 ⁰C to 1250 ⁰C
± 0.2
Digital stopwatch ± 0.2 s
± 0.2
Digital fuel gauge ± 1 mm
± 2
Burette ± 0.2 cc 1 cc to 30 cc ± 1.5
The total percentage of the uncertainty for the instruments was calculated based on Eq. 3 as
follows:
√
Equation 3
3. RESULTS AND DISCUSSION
3.1. Brake Specific Fuel Consumption (BSFC)
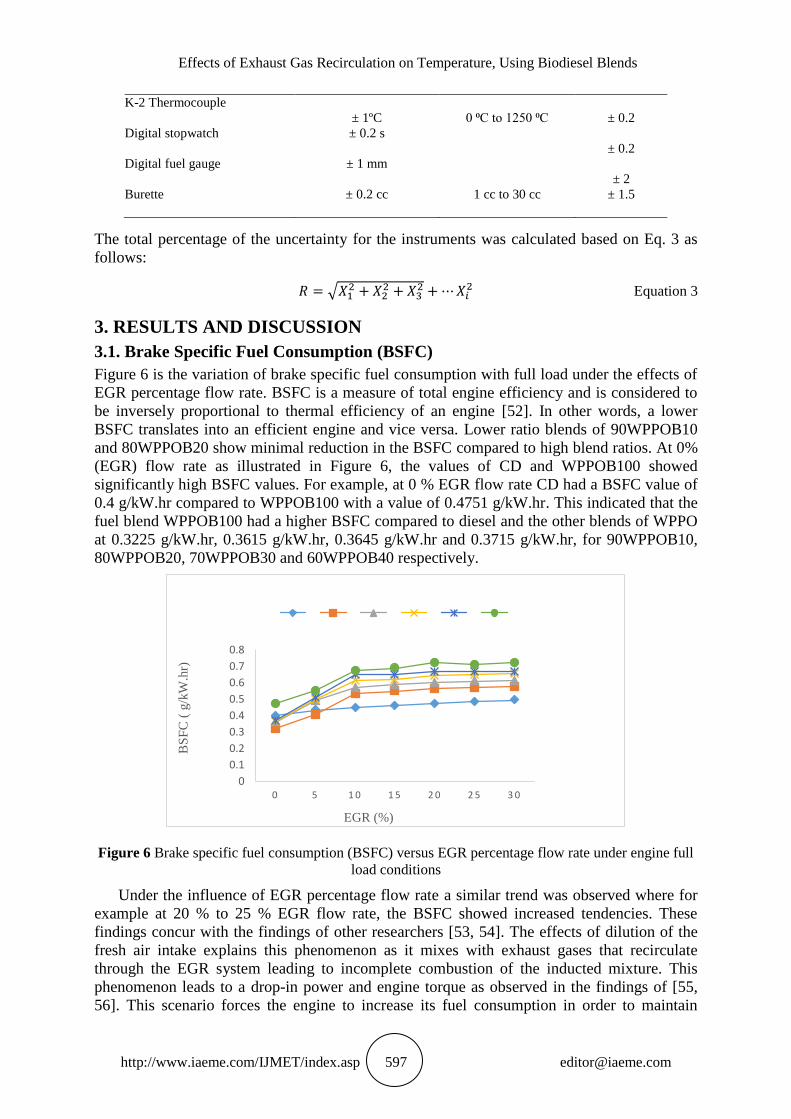
Figure 6 is the variation of brake specific fuel consumption with full load under the effects of
EGR percentage flow rate. BSFC is a measure of total engine efficiency and is considered to
be inversely proportional to thermal efficiency of an engine [52]. In other words, a lower
BSFC translates into an efficient engine and vice versa. Lower ratio blends of 90WPPOB10
and 80WPPOB20 show minimal reduction in the BSFC compared to high blend ratios. At 0%
(EGR) flow rate as illustrated in Figure 6, the values of CD and WPPOB100 showed
significantly high BSFC values. For example, at 0 % EGR flow rate CD had a BSFC value of
0.4 g/kW.hr compared to WPPOB100 with a value of 0.4751 g/kW.hr. This indicated that the
fuel blend WPPOB100 had a higher BSFC compared to diesel and the other blends of WPPO
at 0.3225 g/kW.hr, 0.3615 g/kW.hr, 0.3645 g/kW.hr and 0.3715 g/kW.hr, for 90WPPOB10,
80WPPOB20, 70WPPOB30 and 60WPPOB40 respectively.
Figure 6 Brake specific fuel consumption (BSFC) versus EGR percentage flow rate under engine full
load conditions
Under the influence of EGR percentage flow rate a similar trend was observed where for
example at 20 % to 25 % EGR flow rate, the BSFC showed increased tendencies. These
findings concur with the findings of other researchers [53, 54]. The effects of dilution of the
fresh air intake explains this phenomenon as it mixes with exhaust gases that recirculate
through the EGR system leading to incomplete combustion of the inducted mixture. This
phenomenon leads to a drop-in power and engine torque as observed in the findings of [55,
56]. This scenario forces the engine to increase its fuel consumption in order to maintain
0
0.1
0.2
0.3
0.4
0.5
0.6
0.7
0.8
0 5 1 0 1 5 2 0 2 5 3 0
BS
FC
( g
/kW
.hr)
EGR (%)

Semakula Maroa and Freddie Inambao
http://www.iaeme.com/IJMET/index.asp 598 [email protected]
constant speed and its increased load hence the increase in BSFC (S. Maroa, Inambao,
Freddie,, 2018)[57].
The WPPO biodiesel blends with EGR percentage flow rate showed a better fuel economy
especially the lower blend ratios of 90WPPOB10 and 80WPPOB20 compared to CD test
fuels. However, as the EGR percentage flow rate was increased there was a noticeable
increase in the BSFC across all the test fuels used. At 0 % EGR flow rate CD was 0.4 g/kW.hr
compared to 30% EGR flow rate which was 0.495 g/kW.hr, while the WPPO biodiesel blends
90WPPOB10 was 0.3225 g/kW.hr at 0 % compared to 0.5780 g/kW.hr at 30 % EGR flow
rate. From Figure 6 it is evident that the test fuel that showed the highest BSFC among the
blends of diesel and CD test fuel was WPPOB100, which at 0 % EGR flow rate had a value of
0.4751 g/kW.hr compared to 0.7235 g/kW.hr at 30 % EGR percentage flow rate.
An interesting observation was that after the 10 % EGR flow rate the values for the BSFC
across all the test fuels seemed to show and pick a lineal increment trend as seen in Figure 6
with the flattening of the graph curves and close packed value trends.
3.2. Brake Thermal Efficiency (BTE)
Figure 7 is the variation of the BTE under load with different blends of WPPO without
application of EGR flow percentage. BTE studies specifically help us to know the ability of
the combustion system, and to know if the system will accept the fuel provided, and is a
means of assessing how efficiently fuel conversion is carried out to turn the sample fuel into
mechanical output [46, 58].
Figure 7 Brake thermal efficiency (BTE) versus engine load percentage
There is a noticeable increase in the BTE evident in Figure 7 especially with all low ratio
fuel blends of 90WPPOB10 and 80WPPOB20 compared to CD fuel. The result of this
experiment shows that the BTE increased as the load increased, explained by the reduction in
the heat loss as the engine power (more fuel) increased with load. This observation was
identical to the work reported by [57].
The high BTE values observed for WPPO blends in Figure 7 may be due to the high
viscosity of the WPPO blends as compared to CD during the combustion pre-mixing phase.
The second reason may be due to the presence of high oxygen content in the higher blends,
which improves combustion [59]. The third factor explaining decreased thermal efficiencies
may be because of decreased calorific value as the blend ratio increases, which is identical to
studies by [60]. At high engine load the thermal efficiency for CD was 21.0 % compared to
0
5
10
15
20
25
30
10 20 30 40 50 60 70 80 90 100
BTE
(%
)
ENGINE LOAD (%)
CD 90WPPOB10 80WPPOB20
70WPPOB30 60WPPOB40 WPPOB100
Effects of Exhaust Gas Recirculation on Temperature, Using Biodiesel Blends
http://www.iaeme.com/IJMET/index.asp 599 [email protected]
the WPPO blends at 27 %, 25.75 %, 24.75 %, 23.25 % and 18.95 % for 90WPPOB10,
80WPPOB20, 70WPPOB30, 60WPPOB40 and WPPOB100 respectively.
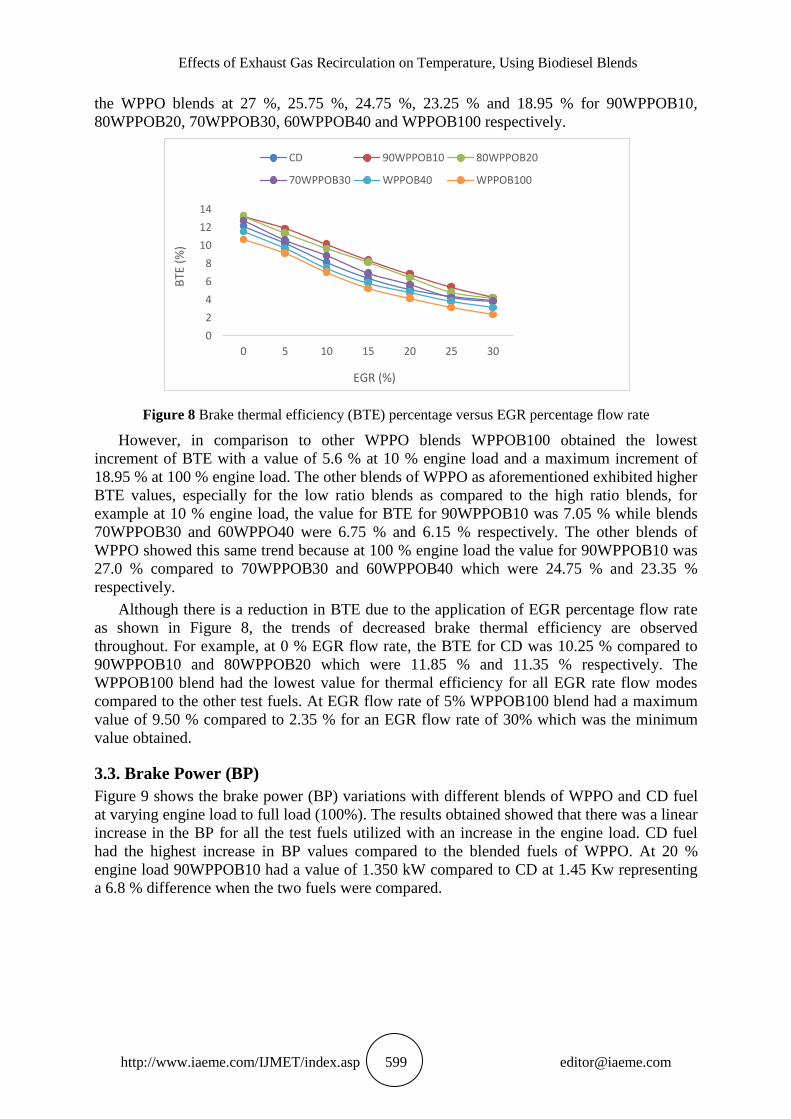
Figure 8 Brake thermal efficiency (BTE) percentage versus EGR percentage flow rate
However, in comparison to other WPPO blends WPPOB100 obtained the lowest
increment of BTE with a value of 5.6 % at 10 % engine load and a maximum increment of
18.95 % at 100 % engine load. The other blends of WPPO as aforementioned exhibited higher
BTE values, especially for the low ratio blends as compared to the high ratio blends, for
example at 10 % engine load, the value for BTE for 90WPPOB10 was 7.05 % while blends
70WPPOB30 and 60WPPO40 were 6.75 % and 6.15 % respectively. The other blends of
WPPO showed this same trend because at 100 % engine load the value for 90WPPOB10 was
27.0 % compared to 70WPPOB30 and 60WPPOB40 which were 24.75 % and 23.35 %
respectively.
Although there is a reduction in BTE due to the application of EGR percentage flow rate
as shown in Figure 8, the trends of decreased brake thermal efficiency are observed
throughout. For example, at 0 % EGR flow rate, the BTE for CD was 10.25 % compared to
90WPPOB10 and 80WPPOB20 which were 11.85 % and 11.35 % respectively. The
WPPOB100 blend had the lowest value for thermal efficiency for all EGR rate flow modes
compared to the other test fuels. At EGR flow rate of 5% WPPOB100 blend had a maximum
value of 9.50 % compared to 2.35 % for an EGR flow rate of 30% which was the minimum
value obtained.
3.3. Brake Power (BP)
Figure 9 shows the brake power (BP) variations with different blends of WPPO and CD fuel
at varying engine load to full load (100%). The results obtained showed that there was a linear
increase in the BP for all the test fuels utilized with an increase in the engine load. CD fuel
had the highest increase in BP values compared to the blended fuels of WPPO. At 20 %
engine load 90WPPOB10 had a value of 1.350 kW compared to CD at 1.45 Kw representing
a 6.8 % difference when the two fuels were compared.
0
2
4
6
8
10
12
14
0 5 10 15 20 25 30
BTE
(%
)
EGR (%)
CD 90WPPOB10 80WPPOB20
70WPPOB30 WPPOB40 WPPOB100
Semakula Maroa and Freddie Inambao
http://www.iaeme.com/IJMET/index.asp 600 [email protected]
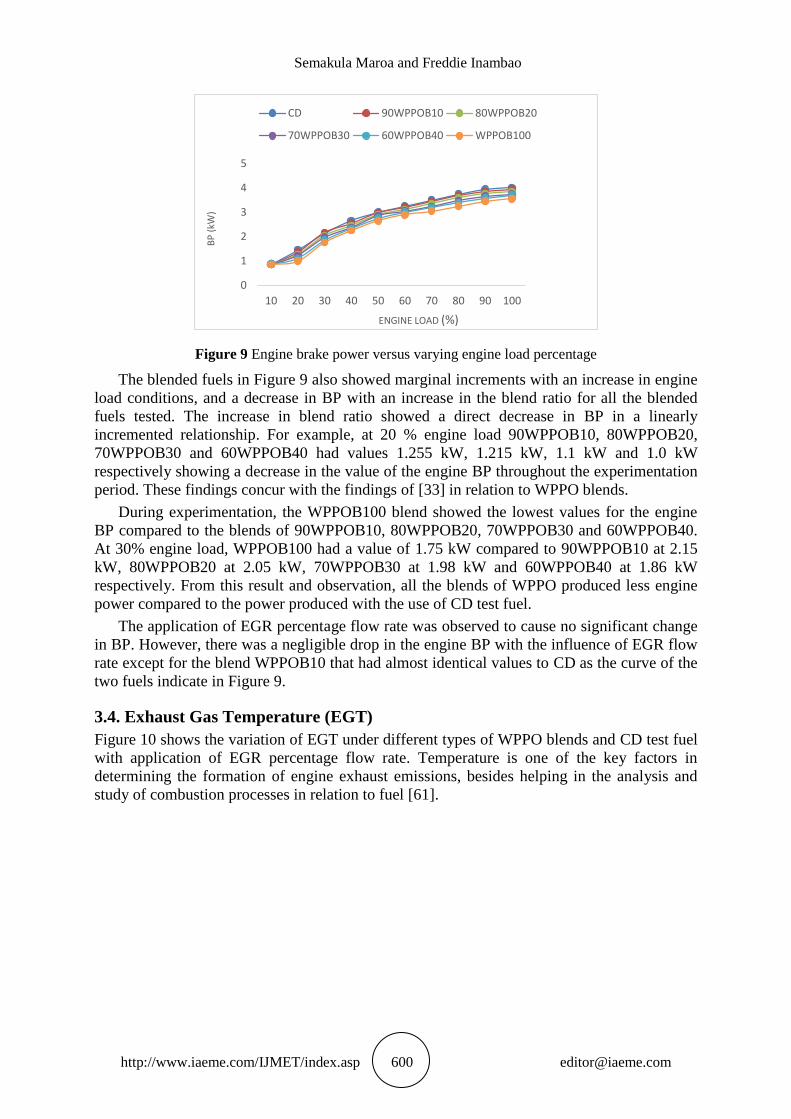
Figure 9 Engine brake power versus varying engine load percentage
The blended fuels in Figure 9 also showed marginal increments with an increase in engine
load conditions, and a decrease in BP with an increase in the blend ratio for all the blended
fuels tested. The increase in blend ratio showed a direct decrease in BP in a linearly
incremented relationship. For example, at 20 % engine load 90WPPOB10, 80WPPOB20,
70WPPOB30 and 60WPPOB40 had values 1.255 kW, 1.215 kW, 1.1 kW and 1.0 kW
respectively showing a decrease in the value of the engine BP throughout the experimentation
period. These findings concur with the findings of [33] in relation to WPPO blends.
During experimentation, the WPPOB100 blend showed the lowest values for the engine
BP compared to the blends of 90WPPOB10, 80WPPOB20, 70WPPOB30 and 60WPPOB40.
At 30% engine load, WPPOB100 had a value of 1.75 kW compared to 90WPPOB10 at 2.15
kW, 80WPPOB20 at 2.05 kW, 70WPPOB30 at 1.98 kW and 60WPPOB40 at 1.86 kW
respectively. From this result and observation, all the blends of WPPO produced less engine
power compared to the power produced with the use of CD test fuel.
The application of EGR percentage flow rate was observed to cause no significant change
in BP. However, there was a negligible drop in the engine BP with the influence of EGR flow
rate except for the blend WPPOB10 that had almost identical values to CD as the curve of the
two fuels indicate in Figure 9.
3.4. Exhaust Gas Temperature (EGT)
Figure 10 shows the variation of EGT under different types of WPPO blends and CD test fuel
with application of EGR percentage flow rate. Temperature is one of the key factors in
determining the formation of engine exhaust emissions, besides helping in the analysis and
study of combustion processes in relation to fuel [61].
0
1
2
3
4
5
10 20 30 40 50 60 70 80 90 100
BP
(kW
)
ENGINE LOAD (%)
CD 90WPPOB10 80WPPOB20
70WPPOB30 60WPPOB40 WPPOB100
Effects of Exhaust Gas Recirculation on Temperature, Using Biodiesel Blends
http://www.iaeme.com/IJMET/index.asp 601 [email protected]
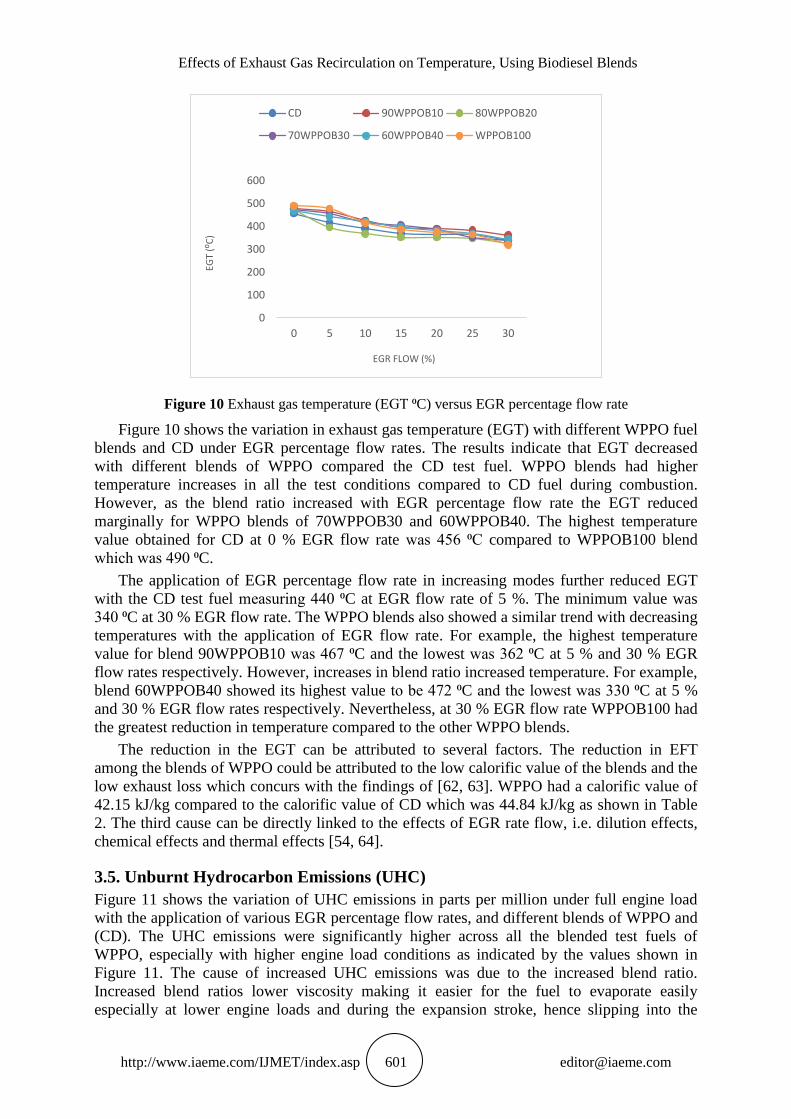
Figure 10 Exhaust gas temperature (EGT ⁰C) versus EGR percentage flow rate
Figure 10 shows the variation in exhaust gas temperature (EGT) with different WPPO fuel
blends and CD under EGR percentage flow rates. The results indicate that EGT decreased
with different blends of WPPO compared the CD test fuel. WPPO blends had higher
temperature increases in all the test conditions compared to CD fuel during combustion.
However, as the blend ratio increased with EGR percentage flow rate the EGT reduced
marginally for WPPO blends of 70WPPOB30 and 60WPPOB40. The highest temperature
value obtained for CD at 0 % EGR flow rate was 456 ⁰C compared to WPPOB100 blend
which was 490 ⁰C.
The application of EGR percentage flow rate in increasing modes further reduced EGT
with the CD test fuel measuring 440 ⁰C at EGR flow rate of 5 %. The minimum value was
340 ⁰C at 30 % EGR flow rate. The WPPO blends also showed a similar trend with decreasing
temperatures with the application of EGR flow rate. For example, the highest temperature
value for blend 90WPPOB10 was 467 ⁰C and the lowest was 362 ⁰C at 5 % and 30 % EGR
flow rates respectively. However, increases in blend ratio increased temperature. For example,
blend 60WPPOB40 showed its highest value to be 472 ⁰C and the lowest was 330 ⁰C at 5 %
and 30 % EGR flow rates respectively. Nevertheless, at 30 % EGR flow rate WPPOB100 had
the greatest reduction in temperature compared to the other WPPO blends.
The reduction in the EGT can be attributed to several factors. The reduction in EFT
among the blends of WPPO could be attributed to the low calorific value of the blends and the
low exhaust loss which concurs with the findings of [62, 63]. WPPO had a calorific value of
42.15 kJ/kg compared to the calorific value of CD which was 44.84 kJ/kg as shown in Table
2. The third cause can be directly linked to the effects of EGR rate flow, i.e. dilution effects,
chemical effects and thermal effects [54, 64].
3.5. Unburnt Hydrocarbon Emissions (UHC)
Figure 11 shows the variation of UHC emissions in parts per million under full engine load
with the application of various EGR percentage flow rates, and different blends of WPPO and
(CD). The UHC emissions were significantly higher across all the blended test fuels of
WPPO, especially with higher engine load conditions as indicated by the values shown in
Figure 11. The cause of increased UHC emissions was due to the increased blend ratio.
Increased blend ratios lower viscosity making it easier for the fuel to evaporate easily
especially at lower engine loads and during the expansion stroke, hence slipping into the
0
100
200
300
400
500
600
0 5 10 15 20 25 30
EGT
(⁰C
)
EGR FLOW (%)
CD 90WPPOB10 80WPPOB20
70WPPOB30 60WPPOB40 WPPOB100

Semakula Maroa and Freddie Inambao
http://www.iaeme.com/IJMET/index.asp 602 [email protected]
cylinder [57, 65]. The second factor is due to the increased ‘lean outer flame zone’ [66]. This
is where blended fuels are in a zone where their spray boundary is beyond the flammability
limit due to overmixing [67].
Figure 11 UHC emissions versus EGR percentage flow rate
For example, when the EGR percentage flow rate was 0%, in other words, no application
effect, Figure 11 shows there was less UHC emissions for all the test fuels applied in this
experiment, compared to 20 % or 30 % EGR percentage flow rates. The value for CD test fuel
was 220 ppm at 0 % EGR flow rate and for the blend fuels the values were 230 ppm, 210
ppm, 200 ppm, and 170 ppm for 90WPPOB10, 80WPPOB20, 70WPPOB30, 60WPPOB40
and WPPOB100 respectively. Although the application of EGR percentage flow rate reduced
the amount of UHC emissions of all test fuels across the board, CD fuel still produced higher
UHC emissions from the test engine compared to all the WPPO blends. For example, at flow
rates of 5 % and 15 % the values were 430 ppm and 700 ppm compared to blend WPPO10
with 320 ppm and 580 ppm.
3.6. NOX Emissions
NOX emission formation is highly dependent on in-cylinder temperature, the concentration of
oxygen and the residence time of the fuel-air mixture in the combustion chamber during the
pre-mixing phase [68]. All tested fuels indicated a reduction in NOX emissions with EGR
percentage flow rate for all load conditions. This can be attributed to the rise in the total heat
capacity of the working gases with increasing EGR percentage flow rate. This finding concurs
with the studies and findings of [30, 69, 70].
The NOX emissions value for CD as shown in Figure 12 at full load was 432 ppm with 30
% EGR percentage flow rate, compared to blend WPPOB100 at 536 ppm. This represents a
decrease in NOX emissions by CD from a high of 536 ppm at 0 % to 432 ppm, which is a 19.4
% reduction.
0100200300400500600700800900
0 5 10 15 20 25 30
UH
C (
pp
m)
EGR FLOW (%)
CD 90WPPOB10 80WPPOB20
70WPPOB30 60WPPOB40 WPPO100

Effects of Exhaust Gas Recirculation on Temperature, Using Biodiesel Blends
http://www.iaeme.com/IJMET/index.asp 603 [email protected]
Figure 12 Variations of NOX emissions (ppm) versus EGR percentage flow rate
Figure 13 Variations of NOX emissions versus load percentage without EGR percentage flow rate
However, during experimentation at engine part load (as shown in Figure 12), the values
for NOX emissions for the same fuels were high towards full load engine conditions. For
example, at part load (50 %) the CD fuel value was 415 ppm compared to full load at 780
ppm, whereas blend WPPOB100 at engine part load (50 %) was 500 ppm as compared to 945
ppm at full engine load. This seems to indicate a concurrence that at part engine load (50 %)
the values of NOX emissions emitted by all the blends of WPPO except WPPO100 were lower
compared to the values at full engine load conditions.
3.7. Carbon Monoxide (CO) Emission
Figure 14 shows variations of CO emission percentage with varying load under the effects of
EGR percentage flow rate, with different fuel blends of WPPO and CD fuel. CO is a toxic gas
that requires substantial control to maintain acceptable levels. CO is caused by poor
combustion of hydrocarbon fuels due to dependency on the air-fuel ratio relative to the
stoichiometric proportions (Mani et al., 2010)[30].
0
200
400
600
800
1000
1200
1400
0 5 10 15 20 25 30
NO
X (
pp
m)
EGR FLOW (%)
CD 90WPPOB10 80WPPOB20
70WPPOB30 60WPPOB40 WPPO100
0
200
400
600
800
1000
0 20 40 60 80 100 120
NO
X (
pp
m)
ENGINE LOAD (%)
CD 90WPPOB10 80WPPOB20
70WPPOB30 60WPPOB40 WPPOB100

Semakula Maroa and Freddie Inambao
http://www.iaeme.com/IJMET/index.asp 604 [email protected]
Figure 14 CO emissions percentage versus varying engine load
For all the test fuels the amount of CO emissions seemed to decrease at lower engine
loads up to part load percentages or intermediate loads of (50 %), thereafter the CO emissions
continued to increase marginally as shown in Figure 14. For example, at 0 % engine load the
value of CD was 510 ppm compared to at 50 % engine load when the value reduced to 300
ppm.
However, as the engine load increased from 50 % there was a continuous marginal
increase in the percentage of carbon emissions as the load increased across all the test fuels
irrespective of the EGR percentage flow rate. For example, at 80 % engine load the value for
WPPOB100 was 200 ppm up from 165 ppm at 50 % engine load, which represented a
marginal increase of 17.5%. On the other hand, the value of CD was 499 ppm compared to
300 ppm at 50 % engine load. The WPPO blends also showed similar trends and concurrency.
For example, blend 80WPPOB20 at 50 % engine load had a value of 215 ppm compared to
336 ppm at 80 % engine load.
3.8. Carbon Dioxide (CO2) Emissions
CO2 is the principal composition of the EGR gases, which indicates the quality of combustion
and temperatures within the combustion chamber [71]. CO2 gas produces high heat capacity
making a thermal heat sink during the combustion process, hence reducing peak cylinder
temperatures and reducing NOX emissions.
Figure 15 Variation of CO2 versus engine Load, with blends of WPPO and CD fuel
0
100
200
300
400
500
600
0 10 20 30 40 50 60 70 80 90 100
CO
(p
pm
)
ENGINE LOAD (%)
CD 90WPPOB10 80WPPOB20
70WPPOB30 60WPPOB40 WPPO100
0
200
400
600
800
1000
1200
1400
10 20 30 40 50 60 70 80 90 100
CO
2 (p
pm
)
ENGINE LOAD (%)
CD 90WPPOB10 80WPPOB20
70WPPOB30 60WPPOB40 WPPO100
Effects of Exhaust Gas Recirculation on Temperature, Using Biodiesel Blends
http://www.iaeme.com/IJMET/index.asp 605 [email protected]
Without EGR percentage flow rate and at lower engine loads, the value of CO2 was high
for all the test fuels used. For example, at 20 % engine load WPPOB100 had the highest
carbon emissions of 465 ppm compared to all the other test fuels used. CO2 emission values
for CD fuel was 300 ppm compared to 60WPPOB40 at 225 ppm as shown in Figure 15.
However, the amount of CO2 increased with increase in the engine load. For example, at
40 % engine load blend 60WPPOB40 was 275 ppm compared to WPPOB30 at 325 ppm.
Nevertheless, at 70 % engine load the value for 60WPPOB40 was 450 ppm while WPPOB30
was 525 ppm respectively. In other words, as the engine load increased with the blend ratios,
more CO2 emissions were emitted. At full engine load, the value of CO2 emissions was
highest for all the test fuels, as shown in Figure 15. For example, CD was 1085 ppm
compared to the blend WPPOB100 at 1275 ppm, 90WPPOB10 at 965 ppm, 80WPPOB20 at
875 ppm, 70WPPOB30 at 835 ppm and 60WPPOB40 at 800 ppm respectively.
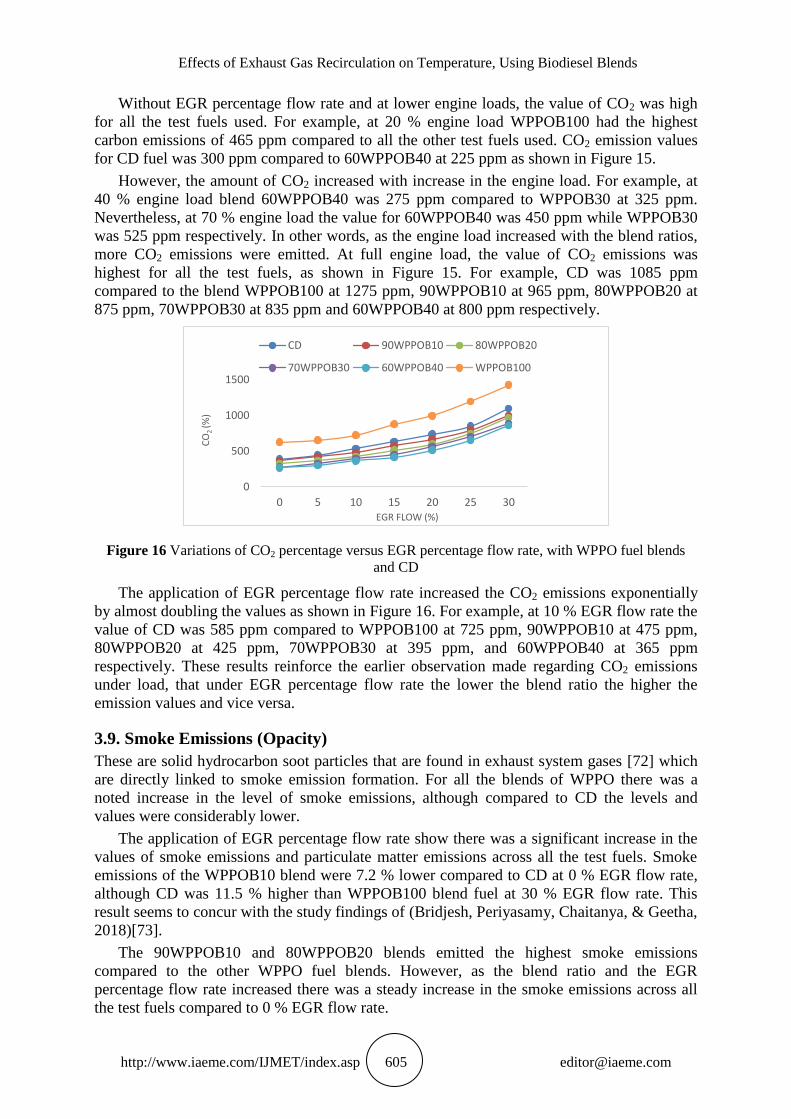
Figure 16 Variations of CO2 percentage versus EGR percentage flow rate, with WPPO fuel blends
and CD
The application of EGR percentage flow rate increased the CO2 emissions exponentially
by almost doubling the values as shown in Figure 16. For example, at 10 % EGR flow rate the
value of CD was 585 ppm compared to WPPOB100 at 725 ppm, 90WPPOB10 at 475 ppm,
80WPPOB20 at 425 ppm, 70WPPOB30 at 395 ppm, and 60WPPOB40 at 365 ppm
respectively. These results reinforce the earlier observation made regarding CO2 emissions
under load, that under EGR percentage flow rate the lower the blend ratio the higher the
emission values and vice versa.
3.9. Smoke Emissions (Opacity)
These are solid hydrocarbon soot particles that are found in exhaust system gases [72] which
are directly linked to smoke emission formation. For all the blends of WPPO there was a
noted increase in the level of smoke emissions, although compared to CD the levels and
values were considerably lower.
The application of EGR percentage flow rate show there was a significant increase in the
values of smoke emissions and particulate matter emissions across all the test fuels. Smoke
emissions of the WPPOB10 blend were 7.2 % lower compared to CD at 0 % EGR flow rate,
although CD was 11.5 % higher than WPPOB100 blend fuel at 30 % EGR flow rate. This
result seems to concur with the study findings of (Bridjesh, Periyasamy, Chaitanya, & Geetha,
2018)[73].
The 90WPPOB10 and 80WPPOB20 blends emitted the highest smoke emissions
compared to the other WPPO fuel blends. However, as the blend ratio and the EGR
percentage flow rate increased there was a steady increase in the smoke emissions across all
the test fuels compared to 0 % EGR flow rate.
0
500
1000
1500
0 5 10 15 20 25 30
CO
2 (%
)
EGR FLOW (%)
CD 90WPPOB10 80WPPOB20
70WPPOB30 60WPPOB40 WPPOB100
Semakula Maroa and Freddie Inambao
http://www.iaeme.com/IJMET/index.asp 606 [email protected]
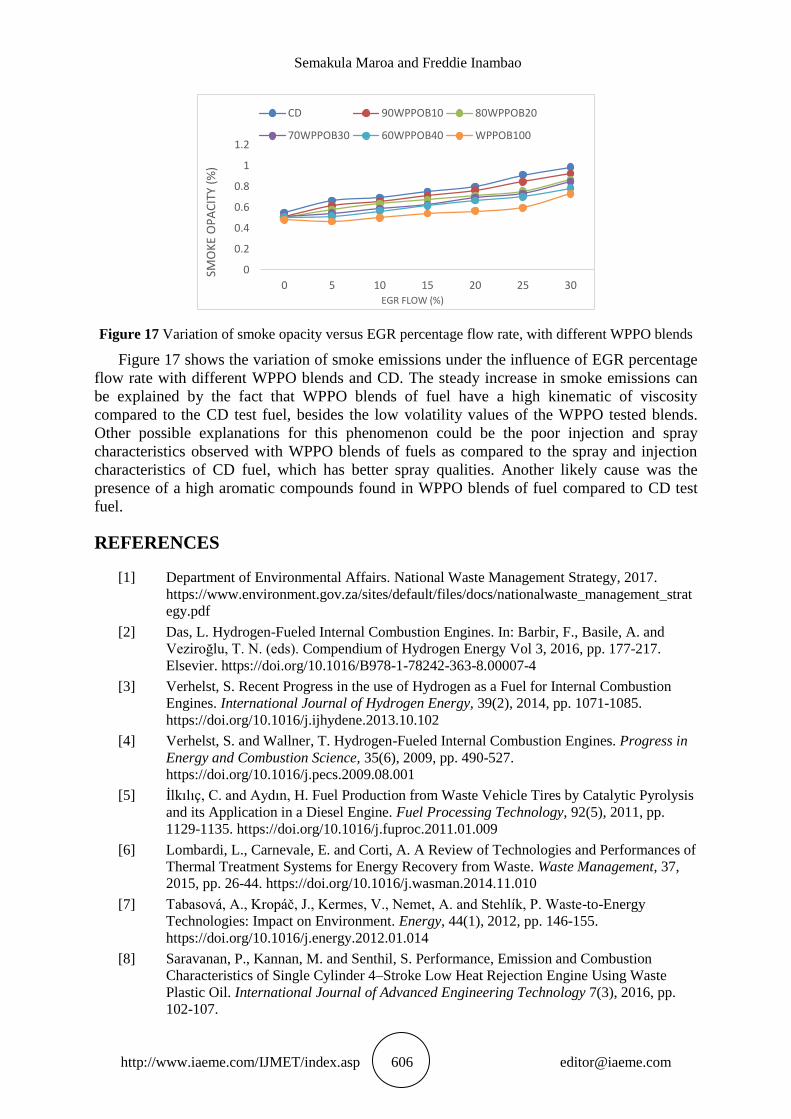
Figure 17 Variation of smoke opacity versus EGR percentage flow rate, with different WPPO blends
Figure 17 shows the variation of smoke emissions under the influence of EGR percentage
flow rate with different WPPO blends and CD. The steady increase in smoke emissions can
be explained by the fact that WPPO blends of fuel have a high kinematic of viscosity
compared to the CD test fuel, besides the low volatility values of the WPPO tested blends.
Other possible explanations for this phenomenon could be the poor injection and spray
characteristics observed with WPPO blends of fuels as compared to the spray and injection
characteristics of CD fuel, which has better spray qualities. Another likely cause was the
presence of a high aromatic compounds found in WPPO blends of fuel compared to CD test
fuel.
REFERENCES
[1] Department of Environmental Affairs. National Waste Management Strategy, 2017.
https://www.environment.gov.za/sites/default/files/docs/nationalwaste_management_strat
egy.pdf
[2] Das, L. Hydrogen-Fueled Internal Combustion Engines. In: Barbir, F., Basile, A. and
Veziroğlu, T. N. (eds). Compendium of Hydrogen Energy Vol 3, 2016, pp. 177-217.
Elsevier. https://doi.org/10.1016/B978-1-78242-363-8.00007-4
[3] Verhelst, S. Recent Progress in the use of Hydrogen as a Fuel for Internal Combustion
Engines. International Journal of Hydrogen Energy, 39(2), 2014, pp. 1071-1085.
https://doi.org/10.1016/j.ijhydene.2013.10.102
[4] Verhelst, S. and Wallner, T. Hydrogen-Fueled Internal Combustion Engines. Progress in
Energy and Combustion Science, 35(6), 2009, pp. 490-527.
https://doi.org/10.1016/j.pecs.2009.08.001
[5] İlkılıç, C. and Aydın, H. Fuel Production from Waste Vehicle Tires by Catalytic Pyrolysis
and its Application in a Diesel Engine. Fuel Processing Technology, 92(5), 2011, pp.
1129-1135. https://doi.org/10.1016/j.fuproc.2011.01.009
[6] Lombardi, L., Carnevale, E. and Corti, A. A Review of Technologies and Performances of
Thermal Treatment Systems for Energy Recovery from Waste. Waste Management, 37,
2015, pp. 26-44. https://doi.org/10.1016/j.wasman.2014.11.010
[7] Tabasová, A., Kropáč, J., Kermes, V., Nemet, A. and Stehlík, P. Waste-to-Energy
Technologies: Impact on Environment. Energy, 44(1), 2012, pp. 146-155.
https://doi.org/10.1016/j.energy.2012.01.014
[8] Saravanan, P., Kannan, M. and Senthil, S. Performance, Emission and Combustion
Characteristics of Single Cylinder 4–Stroke Low Heat Rejection Engine Using Waste
Plastic Oil. International Journal of Advanced Engineering Technology 7(3), 2016, pp.
102-107.
0
0.2
0.4
0.6
0.8
1
1.2
0 5 10 15 20 25 30
SMO
KE
OP
AC
ITY
(%)
EGR FLOW (%)
CD 90WPPOB10 80WPPOB20
70WPPOB30 60WPPOB40 WPPOB100

Effects of Exhaust Gas Recirculation on Temperature, Using Biodiesel Blends
http://www.iaeme.com/IJMET/index.asp 607 [email protected]
[9] Muhammad, C., Onwudili, J. A. and Williams, P. T. Thermal Degradation of Real-World
Waste Plastics and Simulated Mixed Plastics in a Two-Stage Pyrolysis-Catalysis Reactor
for Fuel Production. Energy & Fuels, 29(4), 2015, pp. 2601-2609.
https://doi.org/10.1021/ef502749h
[10] Williams, P. T. and Williams, E. A. Interaction of Plastics in Mixed-Plastics Pyrolysis.
Energy & Fuels, 13(1), 1999, pp. 188-196. https://doi.org/10.1021/ef980163x
[11] Kumar, S., Prakash, R., Murugan, S. and Singh, R. Performance and Emission Analysis of
Blends of Waste Plastic Oil Obtained by Catalytic Pyrolysis of Waste HDPE With Diesel
in a CI Engine. Energy Conversion and Management, 74, 2013, pp. 323-331.
https://doi.org/10.1016/j.enconman.2013.05.028
[12] Rinaldini, C., Mattarelli, E., Savioli, T., Cantore, G., Garbero, M. and Bologna, A.
Performance, Emission and Combustion Characteristics of an IDI Engine Running on
Waste Plastic Oil. Fuel, 183, 2016, pp. 292-303.
https://doi.org/10.1016/j.fuel.2016.06.015
[13] Melendi-Espina, S., Alvarez, R., Diez, M. and Casal, M. Coal and Plastic Waste Co-
Pyrolysis by Thermal Analysis-Mass Spectrometry. Fuel Processing Technology, 137,
2015, pp. 351-358. https://doi.org/10.1016/j.fuproc.2015.03.024
[14] Sharma, B. K., Moser, B. R., Vermillion, K. E., Doll, K. M. and Rajagopalan, N.
Production, Characterization and Fuel Properties of Alternative Diesel Fuel from
Pyrolysis of Waste Plastic Grocery Bags. Fuel Processing Technology, 122, 2014, pp. 79-
90. https://doi.org/10.1016/j.fuproc.2014.01.019
[15] Xue, Y., Zhou, S., Brown, R. C., Kelkar, A. and Bai, X. Fast Pyrolysis of Biomass and
Waste Plastic in a Fluidized Bed Reactor. Fuel, 156, 2015, pp. 40-46.
https://doi.org/10.1016/j.fuel.2015.04.033
[16] Kaimal, V. K. and Vijayabalan, P. A Study on Synthesis of Energy Fuel from Waste
Plastic and Assessment of its Potential as an Alternative Fuel for Diesel Engines. Waste
Management, 51, 2016, pp. 91-96. https://doi.org/10.1016/j.wasman.2016.03.003
[17] Murugan, S., Ramaswamy, M. and Nagarajan, G. Assessment of Pyrolysis Oil as an
Energy Source for Diesel Engines. Fuel Processing Technology, 90(1), 2009, pp. 67-74.
https://doi.org/10.1016/j.fuproc.2008.07.017
[18] Wong, S., Ngadi, N., Abdullah, T. and Inuwa, I. Current State and Future Prospects of
Plastic Waste as Source of Fuel: A Review. Renewable and Sustainable Energy Reviews,
50, 2015, pp. 1167-1180. https://doi.org/10.1016/j.rser.2015.04.063
[19] Frigo, S., Seggiani, M., Puccini, M. and Vitolo, S. Liquid Fuel Production from Waste
Tyre Pyrolysis and its Utilisation in a Diesel Engine. Fuel, 116, 2014, pp. 399-408.
https://doi.org/10.1016/j.fuel.2013.08.044
[20] Syamsiro, M., Saptoadi, H., Norsujianto, T., Noviasri, P., Cheng, S., Alimuddin, Z. and
Yoshikawa, K. Fuel Oil Production from Municipal Plastic Wastes in Sequential Pyrolysis
and Catalytic Reforming Reactors. Energy Procedia, 47, 2014, pp. 180-188.
https://doi.org/10.1016/j.egypro.2014.01.212
[21] Kunwar, B., Cheng, H., Chandrashekaran, S. R. and Sharma, B. K. Plastics to Fuel: A
Review. Renewable and Sustainable Energy Reviews, 54, 2016, pp. 421-428.
https://doi.org/10.1016/j.rser.2015.10.015
[22] Ratnasari, D. K., Nahil, M. A. and Williams, P. T. Catalytic Pyrolysis of Waste Plastics
Using Staged Catalysis for Production of Gasoline Range Hydrocarbon Oils. Journal of
Analytical and Applied Pyrolysis, 124, 2017, pp. 631-637.
https://doi.org/10.1016/j.jaap.2016.12.027
[23] DeNeve, D., Joshi, C., Samdani, A., Higgins, J. and Seay, J. Optimization of an
Appropriate Technology Based Process for Converting Waste Plastic into Liquid Fuel via
Thermal Decomposition. Journal of Sustainable Development, 10(2), 2017, pp. 116.
https://doi.org/10.5539/jsd.v10n2p116

Semakula Maroa and Freddie Inambao
http://www.iaeme.com/IJMET/index.asp 608 [email protected]
[24] Miskolczi, N., Bartha, L., Deak, G. and Jover, B. Thermal Degradation of Municipal
Plastic Waste for Production of Fuel-Like Hydrocarbons. Polymer Degradation and
Stability, 86(2), 2004, pp. 357-366.
https://doi.org/10.1016/j.polymdegradstab.2004.04.025
[25] Güngör, C., Serin, H., Özcanlı, M., Serin, S. and Aydın, K. Engine Performance and
Emission Characteristics of Plastic Oil Produced from Waste Polyethylene and its Blends
with Diesel Fuel. International Journal of Green Energy, 12(1), 2015, pp. 98-105.
https://doi.org/10.1080/15435075.2014.893873
[26] Guntur, R. and Kumar, M. Experimental Evaluation of a Diesel Engine with Blends of
Diesel-Plastic Pyrolysis Oil. International Journal of Engineering Science and
Technology, 3(6), 2011.
[27] Kaimal, V. K. and Vijayabalan, P. A Detailed Study of Combustion Characteristics of a
DI Diesel Engine using Waste Plastic Oil and its Blends. Energy Conversion and
Management, 105, 2015, pp. 951-956. https://doi.org/10.1016/j.enconman.2015.08.043
[28] Kalargaris, I., Tian, G. and Gu, S. Combustion, Performance and Emission Analysis of a
DI Diesel Engine using Plastic Pyrolysis Oil. Fuel Processing Technology, 157, 2017, pp.
108-115. https://doi.org/10.1016/j.fuproc.2016.11.016
[29] Lee, S., Yoshida, K. and Yoshikawa, K. Application of Waste Plastic Pyrolysis Oil in a
Direct Injection Diesel Engine for a Small Scale Non-Grid Electrification. Energy and
Environment Research, 5(1), 2015, pp. 18. http://dx.doi.org/10.5539/eer.v5n1p18
[30] Mani, M., Nagarajan, G. and Sampath, S. An Experimental Investigation on a DI Diesel
Engine using Waste Plastic Oil with Exhaust Gas Recirculation. Fuel, 89(8), 2010, pp.
1826-1832. https://doi.org/10.1016/j.fuel.2009.11.009
[31] Mani, M., Nagarajan, G. and Sampath, S. Characterisation and Effect of using Waste
Plastic Oil and Diesel Fuel Blends in Compression Ignition Engine. Energy, 36(1), 2011,
212-219. https://doi.org/10.1016/j.energy.2010.10.049
[32] Mani, M., Subash, C. and Nagarajan, G. Performance, Emission and Combustion
Characteristics of a DI Diesel Engine Using Waste Plastic Oil. Applied Thermal
Engineering, 29(13), 2009, pp. 2738-2744.
https://doi.org/10.1016/j.applthermaleng.2009.01.007
[33] Pratoomyod, J. and Laohalidanond, K. Performance and Emission Evaluation of Blends of
Diesel Fuel with Waste Plastic Oil in a Diesel Engine. Carbon, 79, 2013, pp. 75-99.
[34] Rehan, M., Nizami, A., Shahzad, K., Ouda, O., Ismail, I., Almeelbi, T., Demirbas, A.
Pyrolytic Liquid Fuel: A Source of Renewable Electricity Generation in Makkah. Energy
Sources, Part A: Recovery, Utilization, and Environmental Effects, 38(17), 2016, pp.
2598-2603. https://doi.org/10.1080/15567036.2016.1153753
[35] Sukjit, E., Liplap, P., Maithomklang, S. and Arjharn, W. Experimental Investigation on a
DI Diesel Engine Using Waste Plastic Oil Blended with Oxygenated Fuels SAE
International, Technical Paper 2017-24-0116, 2017https://doi.org/10.4271/2017-24-0116
[36] Wongkhorsub, C. and Chindaprasert, N. A Comparison of the use of Pyrolysis Oils in
Diesel Engine. Energy and Power Engineering, 5(04), 2013, pp. 350.
doi:10.4236/epe.2013.54B068
[37] Rakopoulos, D., Rakopoulos, C., Hountalas, D., Kakaras, E., Giakoumis, E. and
Papagiannakis, R. Investigation of the Performance and Emissions of Bus Engine
Operating on Butanol/Diesel Fuel Blends. Fuel, 89(10), 2010, pp. 2781-2790.
https://doi.org/10.1016/j.fuel.2010.03.047
[38] Armas, O., García-Contreras, R. and Ramos, Á. Pollutant Emissions from Engine Starting
with Ethanol and Butanol Diesel Blends. Fuel Processing Technology, 100, 2012, pp. 63-
72. https://doi.org/10.1016/j.fuproc.2012.03.003
[39] Chen, Z., Wu, Z., Liu, J. and Lee, C. Combustion and Emissions Characteristics of High
N-Butanol/Diesel Ratio Blend in a Heavy-Duty Diesel Engine and EGR Impact. Energy

Effects of Exhaust Gas Recirculation on Temperature, Using Biodiesel Blends
http://www.iaeme.com/IJMET/index.asp 609 [email protected]
Conversion and Management, 78, 2014, pp. 787-795.
https://doi.org/10.1016/j.enconman.2013.11.037
[40] Doğan, O. The Influence Of N-Butanol/Diesel Fuel Blends Utilization on a Small Diesel
Engine Performance and Emissions. Fuel, 90(7), 2011, pp. 2467-2472.
https://doi.org/10.1016/j.fuel.2011.02.033
[41] Merola, S., Tornatore, C., Iannuzzi, S., Marchitto, L. and Valentino, G. Combustion
Process Investigation in a High-Speed Diesel Engine Fuelled with N-Butanol Diesel
Blend by Conventional Methods and Optical Diagnostics. Renewable Energy, 64, 2014,
pp. 225-237. https://doi.org/10.1016/j.renene.2013.11.017
[42] Yao, M., Wang, H., Zheng, Z. and Yue, Y. Experimental Study of N-Butanol Additive
and Multi-Injection on HD Diesel Engine Performance and Emissions. Fuel, 89(9), 2010,
pp. 2191-2201. https://doi.org/10.1016/j.fuel.2010.04.008
[43] Yilmaz, N. Performance and Emission Characteristics of a Diesel Engine Fuelled with
Biodiesel-Ethanol and Biodiesel-Methanol Blends at Elevated Air Temperatures. Fuel, 94,
2012, pp. 440-443. https://doi.org/10.1016/j.fuel.2011.11.015
[44] Zhang, Z.-H. and Balasubramanian, R. Influence of Butanol-Diesel Blends on Particulate
Emissions of a Non-Road Diesel Engine. Fuel, 118, 2014, pp. 130-136.
https://doi.org/10.1016/j.fuel.2013.10.059
[45] Soloiu, V. A., Yoshihara, Y., Hiraoka, M., Nishiwaki, K., Mitsuhara, Y. and Nakanishi, Y.
The Investigation of New Diesel Fuel Produced from Waste Plastics. Paper presented at
the Proceeding of the 6th International Symposium on Marine Engineering, 2000.
[46] Devaraj, J., Robinson, Y. and Ganapathi, P. Experimental Investigation of Performance,
Emission and Combustion Characteristics of Waste Plastic Pyrolysis Oil Blended with
Diethyl Ether used as fuel for Diesel Engine. Energy, 85, 2015, pp. 304-309.
https://doi.org/10.1016/j.energy.2015.03.075
[47] Gnanasekaran, S., Saravanan, N. and Ilangkumaran, M. Influence of Injection Timing on
Performance, Emission and Combustion Characteristics of a DI Diesel Engine Running on
Fish Oil Biodiesel. Energy, 116, 2016, pp. 1218-1229.
https://doi.org/10.1016/j.energy.2016.10.039
[48] Mani, M. and Nagarajan, G. Influence of Injection Timing on Performance, Emission and
Combustion Characteristics of a DI Diesel Engine Running on Waste Plastic Oil. Energy,
34(10), 2009, pp. 1617-1623. https://doi.org/10.1016/j.energy.2009.07.010
[49] Sharma, A. and Murugan, S. Combustion, Performance and Emission Characteristics of a
DI Diesel Engine Fuelled with Non-Petroleum Fuel: A Study on the Role of Fuel Injection
Timing. Journal of the Energy Institute, 88(4), 2015, pp. 364-375.
https://doi.org/10.1016/j.joei.2014.11.006
[50] Wamankar, A. K. and Murugan, S. Effect of Injection Timing on a DI Diesel Engine
Fuelled with a Synthetic Fuel Blend. Journal of the Energy Institute, 88(4), 2015, pp. 406-
413. https://doi.org/10.1016/j.joei.2014.11.003
[51] Senthilkumar, P. and Sankaranarayanan, G. Production of Waste Polyethylene Bags into
Oil and Studies Performance, Emission and Combustion Characteristics in DI Diesel
Engine. International Journal of Humanities, Arts, Medicine and Science, 3(10), 2015, pp.
149-158.
[52] Azad, A., Uddin, S. A. and Alam, M. A Comprehensive Study of DI Diesel Engine
Performance with Vegetable Oil: An Alternative Bio-Fuel Source of Energy. International
Journal of Automotive and Mechanical Engineering, 5, 2012, pp. 576-586.
http://dx.doi.org/10.15282/ijame.5.2012.4.0045
[53] Hawi, M., Kiplimo, R. and Ndiritu, H. Effect of Exhaust Gas Recirculation on
Performance and Emission Characteristics of a Diesel-Piloted Biogas Engine. Smart Grid
and Renewable Energy, 6(04), 2015, pp. 49. http://dx.doi.org/10.4236/sgre.2015.64005
Semakula Maroa and Freddie Inambao
http://www.iaeme.com/IJMET/index.asp 610 [email protected]
[54] Maroa, S., and Inambao, F. The Effects of Exhaust Gas Recirculation on the Performance
and Emission Characteristics of a Diesel Engine–A Critical Review. International Journal
of Applied Engineering Research, 12(23), 2017, pp. 13677-13689.
https://www.ripublication.com/ijaer.htm
[55] Maroa, S. and Inambao, F. The Effect of Cetane Number and Oxygen Content in the
Performance and Emissions Characteristics of a Diesel Engine Using Biodiesel Blends.
Journal of Energy in Southern Africa, 30(2), 2019, pp. 1-13.
http://dx.doi.org/10.17159/2413-3051/2019/v30i2a5337
[56] Paul Daniel, M., Kumar, K. V., Durga Prasad, B. and Puli, R. K. Performance and
Emission Characteristics of Diesel Engine Operated on Plastic Pyrolysis Oil with Exhaust
Gas Recirculation. International Journal of Ambient Energy, 38(3), 2017, pp. 295-299.
https://doi.org/10.1080/01430750.2015.1086677
[57] Maroa, S. and Inambao, F. Cetane Improvers and Ethanol Performance and Emissions
Characteristics using Pyrorated Biodiesel. Paper presented at the 2018 International
Conference on the Industrial and Commercial Use of Energy (ICUE), 2018.
[58] Li, L., Wang, J., Wang, Z. and Xiao, J. Combustion and Emission Characteristics of
Diesel Engine Fueled with Diesel/Biodiesel/Pentanol Fuel Blends. Fuel, 156, 2015, pp.
211-218. https://doi.org/10.1016/j.fuel.2015.04.048
[59] Maroa, S. and Inambao, F. The Effect of Fuel Additives on Pyrorated Biodiesel Blends on
the Performance of a Diesel Power Generator. Advances in Science, Technology and
Engineering Systems Journal, 4(5), 2019, pp. 88-96. https://doi.org/10.25046/aj040511
[60] Bedar, P., Lamani, V. T., Ayodhya, A. S. and Kumar, G. Combined Effect of Exhaust Gas
Recirculation (EGR) and Fuel Injection Pressure on CRDI Engine Operating with
Jatropha Curcas Biodiesel Blends. Journal of Engineering Science and Technology,
12(10), 2017, pp. 2628-2639.
[61] Jagadish, D., Kumar, P. R. and Madhu Murthy, K. Performance Characteristics of a Diesel
Engine Operated on Biodiesel with Exhaust Gas Recirculation. International Journal of
Advanced Engineering Technology, 2(2), 2011, pp. 202-208.
https://doi.org/10.1016/j.fuproc.2011.01.009
[62] Krishnan, P. N. and Vasudevan, D. Performance, Combustion and Emission
Characteristics of Variable Compression Ratio Engine Fuelled with Biodiesel.
International Journal of ChemTech Research, 7(1), 2015, pp. 234-245.
http://sphinxsai.com/2015/ch_vol7_no1...
[63] Yasin, M. H. M., Mamat, R., Yusop, A. F., Idris, D. M. N. D., Yusaf, T., Rasul, M. and
Najafi, G. Study of a Diesel Engine Performance with Exhaust Gas Recirculation (EGR)
System Fuelled with Palm Biodiesel. Energy Procedia, 110, 2017, pp. 26-31.
https://doi.org/10.1016/j.egypro.2017.03.100
[64] Sharma, A. and Murugan, S. Potential for using a Tyre Pyrolysis Oil-Biodiesel Blend in a
Diesel Engine at Different Compression Ratios. Energy Conversion and Management, 93,
2015, pp. 289-297. https://doi.org/10.1016/j.enconman.2015.01.023
[65] Qi, D., Chen, H., Geng, L. and Bian, Y. Effect of Diethyl Ether and Ethanol Additives on
the Combustion and Emission Characteristics of Biodiesel-Diesel Blended Fuel Engine.
Renewable Energy, 36(4), 2011, pp. 1252-1258.
https://doi.org/10.1016/j.renene.2010.09.021
[66] Mollenhauer, K., Tschöke, H. and Johnson, K. G. (). Handbook of Diesel Engines. Berlin:
Springer, 2010.
[67] Rakopoulos, D. Combustion and Emissions of Cottonseed Oil and its Bio-Diesel in Blends
with Either N-Butanol or Diethyl Ether in HSDI Diesel Engine. Fuel, 105, 2013, pp. 603-
613. https://doi.org/10.1016/j.fuel.2012.08.023
[68] Heywood, J. B. Internal Combustion Engine Fundamentals. New Delhi: MacGraw-Hill
Education, 2012.

Effects of Exhaust Gas Recirculation on Temperature, Using Biodiesel Blends
http://www.iaeme.com/IJMET/index.asp 611 [email protected]
[69] Abaas, K. I. Effect of Exhaust Gas Recirculation (EGR) on the Performance
Characteristics of a Direct Injection Multi Cylinders Diesel Engine. Tikrit Journal of
Engineering Science (TJES), 23(1), 2016, pp. 32-39.
[70] Ghazikhani, M., Feyz, M. E. and Joharchi, A. Experimental Investigation of the Exhaust
Gas Recirculation Effects on Irreversibility and Brake Specific Fuel Consumption of
Indirect Injection Diesel Engines. Applied Thermal Engineering, 30(13), 2010, pp. 1711-
1718. https://doi.org/10.1016/j.applthermaleng.2010.03.030
[71] Muralidharan, K., Vasudevan, D. and Sheeba, K. Performance, Emission and Combustion
Characteristics of Biodiesel Fuelled Variable Compression Ratio Engine. Energy, 36(8),
2011, pp. 5385-5393. https://doi.org/10.1016/j.energy.2011.06.050
[72] Venkatesan, H., Sivamani, S., Bhutoria, K. and Vora, H. H. Assessment of Waste Plastic
Oil Blends on Performance, Combustion and Emission Parameters in Direct Injection
Compression Ignition Engine. International Journal of Ambient Energy, 40(2), 2017, pp.
1-9. https://doi.org/10.1080/01430750.2017.1381155
[73] Bridjesh, P., Periyasamy, P., Chaitanya, A. V. K. and Geetha, N. K. MEA and DEE as
Additives on Diesel Engine using Waste Plastic Oil Diesel Blends. Sustainable
Environment Research, 28(3), 2018, 142-147. https://doi.org/10.1016/j.serj.2018.01.001