effects of endurance exercise on cytochrome c turnover in skeletal muscle
TRANSCRIPT

EFFECTS OF ENDURANCE EXERCISE ON CYTOCHROME C TURNOVER IN
SKELETAL MUSCLE * Frank Booth
Department of Physiology School of Medicine
University of Texas Health Science Center at Houston Houston. Texas 77025
The adaptive responses of skeletal muscle to repeated daily exercise is dependent upon the type of exercise employed. For example, the responses of muscle to distance running and to weight lifting are different. After repeated bouts of distance running, there is an adaptive increase in the concentration of mitochondria within skeletal muscle, but no significant change in muscular mass.' In contrast, skeletal muscles adapt to repeated bouts of weight lifting by an increase in mass with little change in the concentration of mitochondria.' Thus, adaptations in skeletal muscles are specific to the type of exercise em- ployed during training; and any discussion of the effects of distance running on the turnover of mitochondria1 proteins within skeletal muscle must be restricted to those studies that have employed distance running.
Other investigators have reported the final o r "near-final" levels of the adaptive increases in enzymes and proteins in response to endurance running.' However, few reports exist on the time course of these changes.2. The major purpose of this paper will be to provide information on the roles that protein turnover and intensity of physical work play on the time course of adaptive changes that occur in the mitochondria of skeletal muscles in response either to detraining or to increasing the daily intensity of running.
It is now well established that all proteins in animal cells endure a continual process of renewal, i.e., a continual process of degradation and replacement by the synthesis of new proteins.' Such a process has been termed turnover.5 Thus, when the level of protein is unchanging or is in steady state, this level is deter- mined by the rates of both synthesis and degradation, as expressed by: E = k,lkdr in which E is the steady-state level of protein (units mass-l), k, is the zero-order rate constant for synthesis (units time-' mass-'), and k , is the first- order rate constant for degradation (time-l).o From this equation, it is obvious that the steady-state level of a protein can be altered by changing either k, or k , or by changing both. Furthermore, the degradation of a protein is expressed as a first-order rate constant because in all cases studied, except for the red blood cell and hemoglobin, degradation of a protein is proportional to its con- centration.5F For example, if the steady-state level of a protein were 1 unit/ mass and k , were 0.03/day, then 0.03 would be degraded per day. If the steady- state level were to be doubled to 2 unitdmass with k , remaining 0.03; then 0.06 units would be degraded daily. One term frequently employed to express the rate of degradation for a protein is half-life ( r w ) , which is defined as:
*This work was supported by United States Public Health Service Grant AM- 19393 and a grant from the Muscular Dystrophy Associations of America.
43 1

432 Annals New York Academy of Sciences
tw = (In 2 ) l k d in which In 2 is the natural logarithm of 2 and kd is the rate constant for degradation.6 One utilization of this relationship is to obtain t~ of a protein from the time course of the change in protein levels between two steady states7# This is possible because the time course to a new steady state is determined only by the rate constant of degradation, kd.78s The following equation demonstrates this point:
in which Et is the protein concentration at any time t ; E, is the steady-state protein concentration defined by k, and k,; and k / and kJ are the new syn- thesis rate and the new degradation rate constant occurring during the applica- tion of the altered physiological stimulus.5- 6 Thus, only k , determines the time course between two steady states.71 8 Because of this factor, the time course of change between two protein levels can be used to approximate k, for the protein and thus obtain an estimate of t u for this protein.?, By determining the time course of the change in protein levels ( I ) from a lower to a higher steady state during the application of a constant physiological stimulus such as distant running repeated daily and (11) from a higher to a lower steady-state level after the removal of stimulus (which would be detraining), an estimate of k, from these two time courses can be made. When the stimulus of exercise is absent during detraining, the k, of the protein during detraining is assumed to represent the k, value for the same protein under basal, sedentary conditions.8 Consequently, if the k, values during training and basal conditions are similar, then only an increase in k, would be responsible for the higher E found at trained steady state.? On the other hand, a difference in k, values in these two conditions would indicate that either a change only in k, or a change in both k, and k, would cause the higher steady-state level of the p r ~ t e i n . ~
By the use of this methodology to obtain k,! and t w , the time course of the increase in cytochrome c from a lower to a higher steady state was determined during training by distance running. Also, the time course from a higher to a lower steady-state level for cytochrome c was made during detraining. In this r e p ~ r t , ~ no significant difference in k, (and thus t w ) for cytochrome c in skeletal muscle was observed between training and detraining. Thus, it was concluded that a change in k, must play the major role for the adaptive increases and decreases in cytochrome c levels when the amount of daily distant running is altered.9 Implicit in these statements are the assumptions that ( I ) the stimulus to cytochrome c production from distant running ceases relatively abruptly at the start of detraining, (11) the rate of synthesis for cytochrome c immediately, at the onset of detraining, decreases to a synthesis rate that is characteristic of the rate observed in animals that are sedentary and have never undergone train- ing, and (111) the exercise stimulus for cytochrome c to increase during training is applied once in a large amount and this simulus is maintained at the same intensity throughout training. In the experiments performed by us, actual measurements of the time course for the decay in cytochrome c levels did not begin until the second day of detraining.u The reasoning for beginning the time course at this time was the assumption that any lag during detraining for the conversion of cytochrome c synthesis rates to basal levels would have ended by the second day of detraining. Thus, it would be possible to assume that the k, of detraining is reflective of the k, for cytochrome c in sedentary animals.

Booth: Mitochondria1 Protein Turnover 433
The role that the intensity of daily running plays on both the absolute final level of the new steady state and the time course to this new steady state will be discussed next. Duration, speed, and incline contribute to the intensity of the daily run. In our experiments, intensity of distance running has been varied solely by varying the daily duration, while maintaining speed and incline at constant values throughout the training program. Using this experimental pro- tocol, we have observed that the new, apparent steady-state level of cytochrome c after training was a direct function of the intensity of daily running (at the end of training, the daily durations of running varied from 10 to 120 min) lo
(FIGURE 1). From these data, it is possible to suggest a stimulus-response
L i 'O 0 2; 4; 6b so I& li0 DAILY DURATION OF RUNNING ( M i n u t e r )
FIGURE 1. Correlation between the final duration of daily running and the level of cytochrome c in the gastrocnemius muscles of rats. All groups ran at 1.2 mph (0.5 m/sec) on a 15% grade. Measurements of cytochrome c were made after 15 weeks of training. (Data from Fitts et a/.'")
relationship between the daily duration of running (stimulus) and the new apparent steady-state level of cytochrome c (response). Similar conclusions have previously been made for other parameters of physical exercise. For example, Nordesjo l1 has concluded that the absolute change in either brief or extended work capacity by humans is directly dependent upon the intensity of training and consequently the total amount of work during training.
The existence of a stimulus-response relationship between the duration of daily running and the resultant steady-state level of cytochrome c in skeletal muscle provides the basis for the next topic, which is whether the rate of change in the intensity of daily exercise plays any role in the time course of the increase
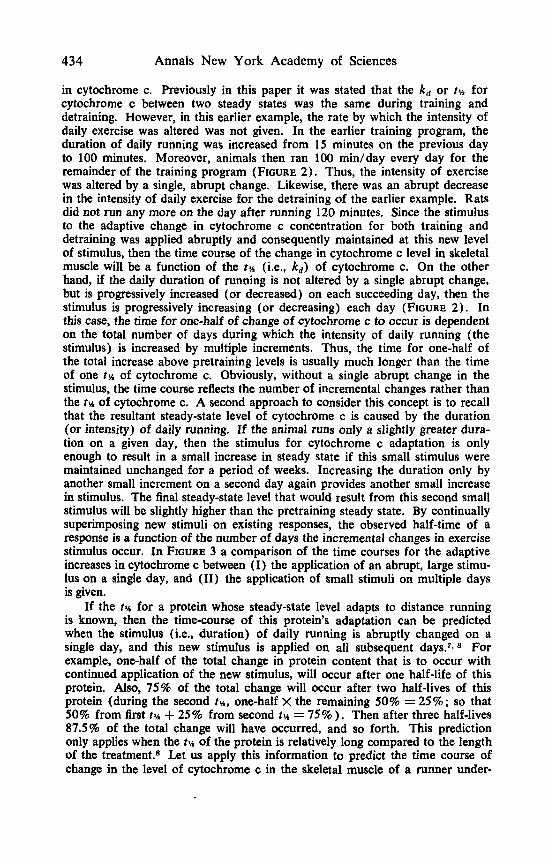
434
in cytochrome c. Previously in this paper it was stated that the k, or trh for cytochrome c between two steady states was the same during training and detraining. However, in this earlier example, the rate by which the intensity of daily exercise was altered was not given. In the earlier training program, the duration of daily running was increased from 15 minutes on the previous day to 100 minutes. Moreover, animals then ran 100 midday every day for the remainder of the training program (FIGURE 2). Thus, the intensity of exercise was altered by a single, abrupt change. Likewise, there was an abrupt decrease in the intensity of daily exercise for the detraining of the earlier example. Rats did not run any more on the day after running 120 minutes. Since the stimulus to the adaptive change in cytochrome c concentration for both training and detraining was applied abruptly and consequently maintained at this new level of stimulus, then the time course of the change in cytochrome c level in skeletal muscle will be a function of the t n (i.e., k,) of cytochrome c. On the other hand, if the daily duration of running is not altered by a single abrupt change, but is progressively increased (or decreased) on each succeeding day, then the stimulus is progressively increasing (or decreasing) each day (FIGURE 2). In this case, the time for one-half of change of cytochrome c to occur is dependent on the total number of days during which the intensity of daily running (the stimulus) is increased by multiple increments. Thus, the time for one-half of the total increase above pretraining levels is usually much longer than the time of one trh of cytochrome c. Obviously, without a single abrupt change in the stimulus, the time course reflects the number of incremental changes rather than the tn of cytochrome c. A second approach to consider this concept is to recall that the resultant steady-state level of cytochrome c is caused by the duration (or intensity) of daily running. If the animal runs only a slightly greater dura- tion on a given day, then the stimulus for cytochrome c adaptation is only enough to result in a small increase in steady state if this small stimulus were maintained unchanged for a period of weeks. Increasing the duration only by another small increment on a second day again provides another small increase in stimulus. The final steady-state level that would result from this second small stimulus will be slightly higher than the pretraining steady state. By continually superimposing new stimuli on existing responses, the observed half-time of a response is a function of the number of days the incremental changes in exercise stimulus occur. In FIGURE 3 a comparison of the time courses for the adaptive increases in cytochrome c between (I) the application of an abrupt, large stimu- lus on a single day, and (11) the application of small stimuli on multiple days is given.
If the t% for a protein whose steady-state level adapts to distance running is known, then the timecourse of this protein’s adaptation can be predicted when the stimulus (i.e., duration) of daily running is abruptly changed on a single day, and this new stimulus is applied on all subsequent days.7~~ For example, one-half of the total change in protein content that is to occur with continued application of the new stimulus, will occur after one half-life of this protein. Also, 75% of the total change will occur after two half-lives of this protein (during the second tu, one-half X the remaining 50% = 25%; so that 50% from first t~ + 25% from second 2% = 75%). Then after three half-lives 87.5% of the total change will have occurred, and so forth. This prediction only applies when the tn of the protein is relatively long compared to the length of the treatment.s Let us apply this information to predict the time course of change in the level of cytochrome c in the skeletal muscle of a runner under-
Annals New York Academy of Sciences

Booth: Mitochondria1 Protein Turnover 435
going detraining, and then undergoing retraining. For this example, let us take a distant runner who has previously undergone endurance training over a period of weeks so that his cytochrome c level in his skeletal muscle has adapted to a
FIGURE 2. Comparison of the application of increases in the duration of daily run- ning for two different training programs for rats. The one-step program involves a single, abrupt change in the duration of daily running from a level of 10-15 midday for 5 days/week to a level of 100 min each day for 7 daydweek. The speed of the treadmill was 1 mph (0.4 m/sec at a 15% grade). The second training program, designated progressive, has been described and involves multiple, 3-min increases in the total duration of running each day. In this program, rats ran at 1 mph up a 10% grade for 6 days/week.
new steady-state level that is twice the level found in the sedentary population. Unfortunately, for the sake of our example, let us consider the consequences of an ankle injury that causes the runner to rest for 7 days, i.e., to undergo detraining for 7 days (FIGURE 4). Furthermore, let us make the assumption

436 Annals New York Academy of Sciences
I
93 I I I 4 Ib 45 2'Q 2'5 30 4 40 45
DAY OF TRAINING
FIGURE 3. Comparison of the time course of increase in the level of cytochrome c in the gastrocnemius muscle of rats undergoing the two types of training programs that were described in FIGURE 2. The increase in the level of cytochrome c for the rats partaking in 100 min of daily running in the one-step program is designated by the upper curve ( L O ) . Note this curve approximates an exponential increase. For the other training program, called progressive, the rate of change in the level of cytochrome c is designated by the lower curve (*- --*), This line approximates a linear change. The cross-hatching is illustrative so as to associate the staircase-like increase in the duration of daily running with the increase of cytochrome c during the progressive program. The wavy lines associate the 100-min daily running and increase in cytochrome c for the one-step training program. (Data from Booth and Holloszy and Terjung et ~ 1 . ' " )
that the r% of cytochrome c in the runner's skeletal muscle is similar to the t n of cytochrome c in rodent skeletal muscle, which is 7 days.g Thus, the runner undergoes detraining for a time period roughly equivealent to 1 half- life of cytochrome c. As previously discussed in this paper, the rate of decay in protein concentration from a higher to a lower steady-state level is solely determined by the t w of the protein. Therefore, one-half of the absolute

Booth: Mitochondria1 Protein Turnover 437
increase in cytochrome c above sedentary levels will be lost in 7 days. To further illustrate this example, the runner has a trained, steady-state level of 20 nmoles of cytochrome c per gram of skeletal muscle while the mean value for cytochrome c in a sedentary population is 10 nmole/g. Thus, after the 7th day of detraining, when the runner has lost one-half the absolute difference be- tween two steady states [% (20 - 10) =5], the runner would have 15 nmole/g of cytochrome c. Obviously, for simplicity of presentation, a number of as- sumptions are implicit and will not be discussed in detail. A few such assump- tions are that (I) the rate of synthesis for cytochrome c at the onset of detrain- ing immediately returns to values supporting a steady state level of 10 nmoles/ g,s and (11) the sedentary steady-state level of cytochrome c in the runner of this example would be 10 nmole/g if detraining lasted long enough. Now, if after 7 days of detraining the runner is immediately able to return to an intensity (or duration) daily running, which would be required for a steady- state level of 20 nmole/g cytochrome c, then after 7 days of distance running, his cytochrome c level will have increased one-half of the absolute difference between 20 and 15 [%(20- 15)+ 15= 17.51. Thus, after one
e s Training 2hrlday
Train 2hrlday
FIGURE 4. The predicted time-course of the change in the level of cytochrome c in the skeletal muscle of a distant runner who undergoes 7 days of detraining and con- sequently undergoes retraining. Prior to detraining, the runner’s steady-state level of cytochrome c in his leg muscle is 20 nmole/g, o r twice the steady-state level found in a population of sedentary people. The runner incurs an ankle injury and must not exercise for 7 days (indicated by the cross-hatched area). After these 7 days of detraining, the level of cytochrome c would be predicted to drop one-half of the trained increase (see text for details). Thus, the rate of change of cytochrome c is shown to exponentially decay from 20 to 15 nmole/g during the detraining. On the first day after detraining, it is presumed that the runner can immediately begin to run the same duration as prior to detraining. which is 2 hr/day. Moreover, this 2 hr/day duration is continued daily during retraining. The level of cytochrome c during re- training is predicted every seventh day to exponentially rise one-half of the difference between 20 and the level at the start of each 7-day period. Thus, after 7 days of retraining, it will be 17.5 nmolelg; after 14 days, it will be 18.8; and after 21 days of retraining, 19.4.

438 Annals New York Academy of Sciences
week of retraining at this intensity, there would be 17.5 nmole/g cytochrome c in the skeletal muscle of the runner. Likewise, if the runner continued running at the same intensity required for a final steady-state level of 20 nmole/g cytochrome c, then after 14 days of retraining cytochrome c would be 18.8 nmolelg [%(20- 17.5)+ 17.5 = 18.81; after 21 days it would be 19.4, and so forth. In summary, although it took only 7 days of detraining for a drop of 5 nmole/g (which is one-half of the difference between 20 and 101, it would take about 28 days of daily running (at a running intensity for a final steady-state level of 20 nmole/g) to regain the lost 5 nmole/g (that is, to increase from 15 to 20).
However, it is often very difficult for a runner to undergo a single, abrupt increase in the intensity of training after many days of detraining. For ex- ample, after 7 days of detraining, the runner may not have the fitness level to endure the duration of distance running necessary to stimulate the synthesis rate of cytochrome c necessary to produce the steady-state level of cytochrome c that was present prior to detraining. Therefore, the runner might progressively increase the intensity of daily running until he reached the intensity necessary to stimulate eventually the production cytochrome c at a level equivalent to that existing before detraining. Consequently, the timecourse of the increase in cytochrome c when exercise duration is increased in multiple increments will be slower than the time-course for a single, abrupt increase in duration. There- fore, when the duration of daily running is progressively increased, the length of training necessary to regain the 5 nmole/g cytochrome c lost during de- training would be much longer than 28 days.
At this point, it might be good to review the roles that cytochrome c adapta- tions might play in permitting increased work capacities. Although the exact cause and effect relationships between increased cytochrome c levels in skeletal muscles and increased work capacities have yet to be shown, a number of correlations have been made between (I) parameters that serve as indexes of work capacity and (11) parameters, such as cytochrome c levels in skeletal muscle, that serve as indexes of the capacity of muscle to aerobically produce ATP. For example, a direct relationship between markers for the capacity of skeletal muscle to produce ATP and maximal oxygen uptake of the whole person have been demonstrated in numerous labs.12-16 Moreover, a direct rela- tionship between running time to exhaustion and cytochrome c levels in rodent skeletal muscle have been shown.10 Finally, a direct relationship between the amounts of liver and muscle glycogen remaining at the end of a stan- dardized work-bout and the capacity of skeletal muscle to aerobically produce ATP has been reported.10 Although these correlations do not indicate the direct mode by which cytochrome c levels might play a role in producing increases in work capacity, they do suggest that knowledge of the t~ of cyto- chrome c can provide information on the time course of adaptive changes related to work capacity, and can also be used to design training and detraining programs. Furthermore, since most physiological and biochemical processes in the organism are controlled by proteins, then the time-course of the change in maximal oxygen uptake is probably related to the timecourse in the adapta- tions of numerous proteins. For example, a preliminary report indicates that the time-course in cardiac enlargement between sedentary and trained steady states follows first-order kinetics when the duration of daily exercise is altered by a single abrupt change." It would be interesting to determine if the time- course of the increase in maximal cardiac output follows a similar time-course

Booth: Mitochondrial Protein Turnover 439
as cardiac enlargement. So, although this paper has dealt with the time- course for the adaptation of a single protein during distance running, the information presented herein might provide models for the timecourses of other adaptations occurring during repeated daily bouts of distance running.
References
1. HOLLOSZY, J. 0. & F. W. BOOTH. 1976. Biochemical adaptations to endurance exercise in muscle. Ann. Rev. Physiol. 38: 273-291.
2. BOSTROM, S.-L., G. HOGBERG & R. G. JOHANSSON. 1974. Enzyme activities in skeletal muscle after contractile activity in vitro. Int. J. Biochem. 5: 487-494.
3. BENZI, G., P. PANCERI, M. DEBERNARDI, R. VILLA, E. ARCELLI, L. DANCELO, E. ARRIGONI & F. BERTZ. 1975. Mitochondrial enzymatic adaptation of skeletal muscle to training. J. Appl. Physiol. 38: 565-569.
4. GOLDBERG, A. L. & J. F. DICE. 1974. lntracellular protein degradation in mammalian and bacterial cells. Ann. Rev. Biochem. 43: 835-869.
5 . ARIAS, I. M., D. DOYLE & R. T. SCHIMKE. 1969. Studies on the synthesis and degradation of proteins of the enoplasmic reticulum of rat liver. J. Biol. Chem. 244: 3303-3315.
6. SCHIMKE, R. T. & D. DOYLE. 1970. Control of enzyme levels in animal tissues. Ann. Rev. Biochem. 3 9 929-976.
7. SCHIMKE, R. T. 1970. Regulation of protein degradation i n mammalian tissues. In Mammalian Protein Metabolism. H. N. Munro, Ed. Vol. 4: 177-228. Academic Press. New York, N.Y.
8. SCHIMKE, R. T. 1975. Methods for analysis of enzyme synthesis and degradation in animal tissues. In Methods in Enzymology. B. W. O’Mailley & J. G. Hardman, Eds. Vol. 40: 241-266.
9. BOOTH, F. W. & J. 0. HOLLOSZY. 1977. Cytochrome c turnover in rat skeletal muscles. J. Biol. Chem. 252: 416-419.
10. FITTS, R. H., F. W. BOOTH, W. W. WINDER & J. 0. HOLLOSZY. 1975. Skeletal muscle respiratory capacity, endurance, and glycogen utilization. Amer. J. Physiol. 228: 1029-1033.
11. NORDESJO, L-0. 1974. The effect of quantitated training on the capacity for short and prolonged work. Acta Physiol. Scand. (Suppl.) 405.
12. HOPPELER, H., P. LUTHI, H. CLAASSEN, E. R. WHEEL & H. HOWALD. 1973. The ultrastructure of the normal human skeletal muscle. Pfliigers Arch. 344: 217- 232.
13. COSTILL, D. L., P. D. GOLLNICK, E. D. JANSSON, B. SALTIN & E. M. STEIN. 1973. Glycogen depletion patterns in human muscle fibers during distance running. Acta Physiol. Scand. 89: 374-383.
14. BOOTH, F. W. & K. A. NARAHARA. 1974. Vastus lateralis cytochrome oxidase activity and its relationship to maximal oxygen consumption in man. Pfliigers Arch. 349: 319-324.
15. KIESSLING, K-H., L. PILSTROM, A.-CH. BYLUNG, B. SALTIN & K. PIEHL. 1974. Enzyme activities and morphometry in skeletal muscle of middle-aged men after training. Scand. J . Clin. Lab. Invest. 33: 63-69.
16. COSTILL, D. L., J. DANIELS, W. EVANS, W. FINK, G. KRAHENBUHL & B. SALTLN. 1976. Skeletal muscle enzymes and fiber composition in male and female track athletes. J. Appl. Physiol. 4 0 149-154.
17. HICKSON, R. C., G. T. HAMMONS, R. K. CONLEE & J. 0. HOLLOSZY. 1976. Time course of the development of cardiac hypertrophy with endurance training. Med. Sci. Sports 8: 55.
18. TERJUNG, R. L., W. W. WINDER, K. M. BALDWIN & J. 0. HOLLOSZY. 1973. Effect of exercise on the turnover of cytochrome c in skeletal muscle. J. Biol. Chem. 248: 7404-7406.