effects of diagenesis on compaction of reservoir rocks · effects of diagenesis on compaction of...
TRANSCRIPT

Effects of Diagenesis on Compactionof Reservoir Rocks
Euro-conference of Rock Physics and Geomechanics, Erice, Sicily, 25-30 September 2007
Dave Olgaard*, Steve Cameron§, John Dunsmuir§, Amy Herhold§, Hubert King§, MJ Gooch*
ExxonMobil: §Corporate Strategic Research, New Jersey, *Upstream Research Co., Houston, Texas, USA
(http://landsat.org)
1
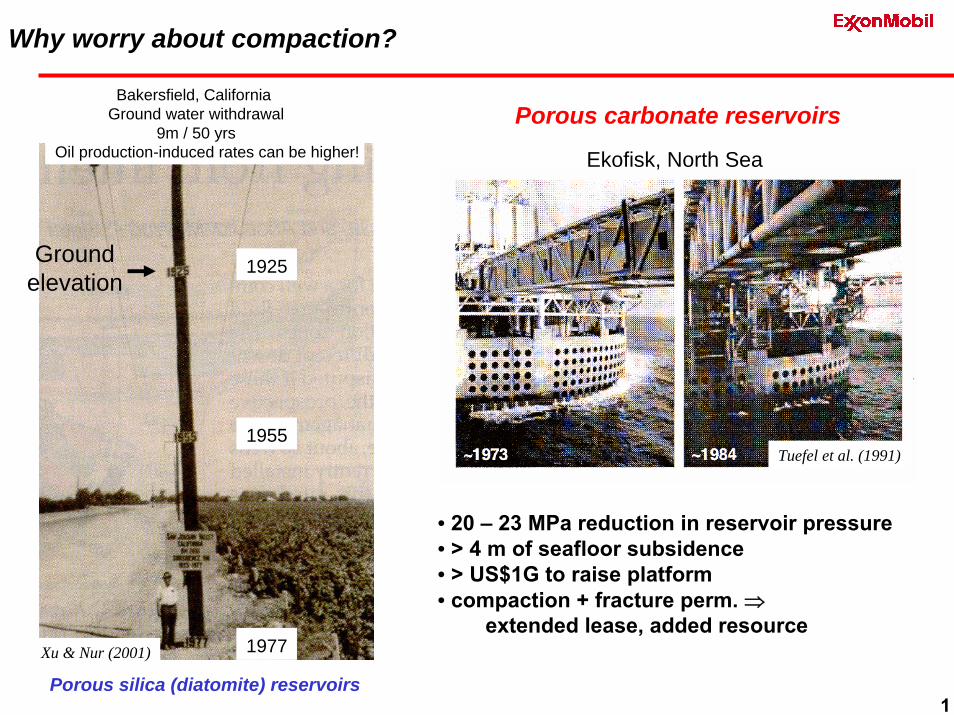
Why worry about compaction?
• 20 – 23 MPa reduction in reservoir pressure• > 4 m of seafloor subsidence• > US$1G to raise platform• compaction + fracture perm. ⇒
extended lease, added resource
Ground elevation
Porous silica (diatomite) reservoirs
Porous carbonate reservoirs
1925
1955
1977
Bakersfield, CaliforniaGround water withdrawal
9m / 50 yrsOil production-induced rates can be higher! Ekofisk, North Sea
Xu & Nur (2001)
Tuefel et al. (1991)
Ground elevation

2
Borehole acoustic televiewer images
Wellbore failure

3
GENESIS, deepwater GOM
Chevron, SPE 84415
Start production
Permeability reduction by depletion
4
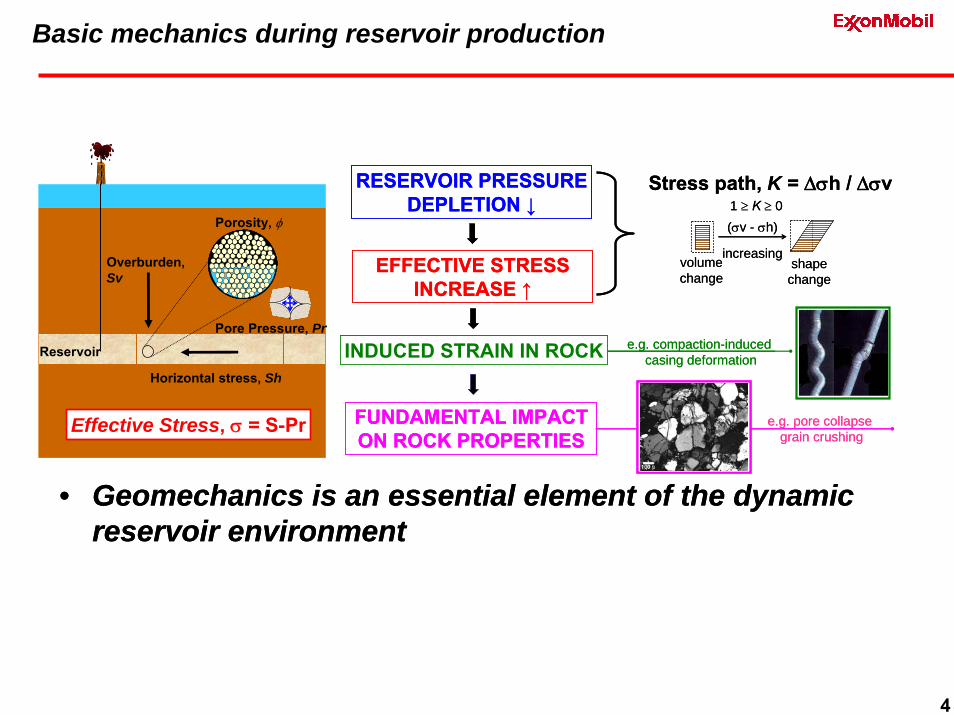
Reservoir
Overburden, Sv
Horizontal stress, Sh
Pore Pressure, Pr
Porosity, φ
Effective Stress, σ = S-Pr FUNDAMENTAL IMPACT ON ROCK PROPERTIES
RESERVOIR PRESSUREDEPLETION ↓
EFFECTIVE STRESSINCREASE ↑
e.g. compaction-induced casing deformation
e.g. pore collapse grain crushing
Stress path, K = ∆σh / ∆σv1 ≥ K ≥ 0(σv - σh)
increasingvolumechange
shapechange
• Geomechanics is an essential element of the dynamic reservoir environment
INDUCED STRAIN IN ROCKReservoir
Overburden, Sv
Horizontal stress, Sh
Pore Pressure, Pr
Porosity, φ
Effective Stress, σ = S-Pr
Reservoir
Overburden, Sv
Horizontal stress, Sh
Pore Pressure, Pr
Porosity, φ
Effective Stress, σ = S-Pr FUNDAMENTAL IMPACT ON ROCK PROPERTIES
RESERVOIR PRESSUREDEPLETION ↓
EFFECTIVE STRESSINCREASE ↑
e.g. compaction-induced casing deformation
e.g. pore collapse grain crushing
Stress path, K = ∆σh / ∆σv1 ≥ K ≥ 0(σv - σh)
increasingvolumechange
shapechange
• Geomechanics is an essential element of the dynamic reservoir environment
INDUCED STRAIN IN ROCK
Basic mechanics during reservoir production
5
Diagenesis and Compaction
Definition: Diagenesis – Physical and chemical changes in a sediment that convert it into a rock. Am. Geol. Inst.(1976)
Outline:• Motivation for research• Typical “porosity / density profiles” (mechanical and chemical effects)• Current research project (emphasis on carbonates)
– State-of-the-Art– Fabrication of synthetic oolitic grainstones– Compaction behavior (porosity versus effective stress)– Quantitative imaging (X-ray microtomography)– Next steps

6
Reservoir Quality Prediction: porosity profiles
Mostly mechanical compaction 2
Chemical compaction dominant
70-100°C2-3 km1
(clastics)
5 km
Dep
th
Porosity
1 Carbonates and evaporites compact chemically at shallower depth than silicates.2 Mineral strength: quartz & feldspar ≥carbonates > gypsum > salt
Mostly mechanical compaction 2
Chemical compaction dominant
70-100°C2-3 km1
(clastics)
5 km
Dep
th
Porosity
Mostly mechanical compaction 2
Chemical compaction dominant
70-100°C2-3 km1
(clastics)
5 km
Dep
th
Porosity
1 Carbonates and evaporites compact chemically at shallower depth than silicates.2 Mineral strength: quartz & feldspar ≥carbonates > gypsum > salt
General
Mostly mechanical compaction 2
Chemical compaction dominant
70-100°C2-3 km1
(clastics)
5 km
Dep
th
Porosity
1 Carbonates and evaporites compact chemically at shallower depth than silicates.2 Mineral strength: quartz & feldspar ≥carbonates > gypsum > salt
Mostly mechanical compaction 2
Chemical compaction dominant
70-100°C2-3 km1
(clastics)
5 km
Dep
th
Porosity
Mostly mechanical compaction 2
Chemical compaction dominant
70-100°C2-3 km1
(clastics)
5 km
Dep
th
Porosity
1 Carbonates and evaporites compact chemically at shallower depth than silicates.2 Mineral strength: quartz & feldspar ≥carbonates > gypsum > salt
General

7
Bulk density
dept
h be
low
sea
floor
Shale
Sandstone
Bulk density
dept
h be
low
sea
floor
Shale
Sandstone
Bulk density
dept
h be
low
sea
floor
Shale
Sandstone
Bulk density
dept
h be
low
sea
floor
Shale
Sandstone
Bulk density
dept
h be
low
sea
floor
Shale
Sandstone
Bulk density
dept
h be
low
sea
floor
Shale
Sandstone
Bulk density
dept
h be
low
sea
floor
Shale
Sandstone
Bulk density
dept
h be
low
sea
floor
Shale
SandstoneEvaporites
dept
h be
low
sea
floor
Salt
2.2 g/cm 3
Bulk density
dept
h be
low
sea
floor
Salt
2.1 g/cm 3
Bulk density
dept
h be
low
sea
floor
Salt
2.2 g/cm 3
Bulk density
dept
h be
low Salt
2.1 g/cm
Bulk density
Evaporites
dept
h be
low
sea
floor
Salt
2.2 g/cm 3
Bulk density
dept
h be
low
sea
floor
Salt
2.1 g/cm
Bulk density
dept
h be
low
sea
floor
Salt
Bulk density
dept
h be
low Salt
Bulk density
dept
h be
low
sea
floor
Salt
Bulk density
dept
h be
low
sea
floor
Salt
Bulk density
Salt
Bulk densityBulk density
Siliciclastics
3
Basin Modeling: density profiles

8
Carbonate Compaction: Sediment Type & Alteration
• Carbonate compaction curves:– Natural carbonates: variety of rock types, both mechanical and chemical alteration
– Experimental: effects of chemical diagenesis not included in mechanical properties
• Current data predicts a wide range of outcomes – which is correct?
Schmoker and Halley (1982) [75-100% limestone]Log analysis
Goldhammer (1997) [ooid, peloid, skeletal grains]Loose sedimentGoldhammer (1997) [mud]Loose sediment, transition +/- 40%
Need a method to predict compaction as function of sediment type and diagenetic alteration
0
1000
2000
3000
4000
0 10 20 30 40 50 60 70
Porosity (%)
Dep
th (m
)
9
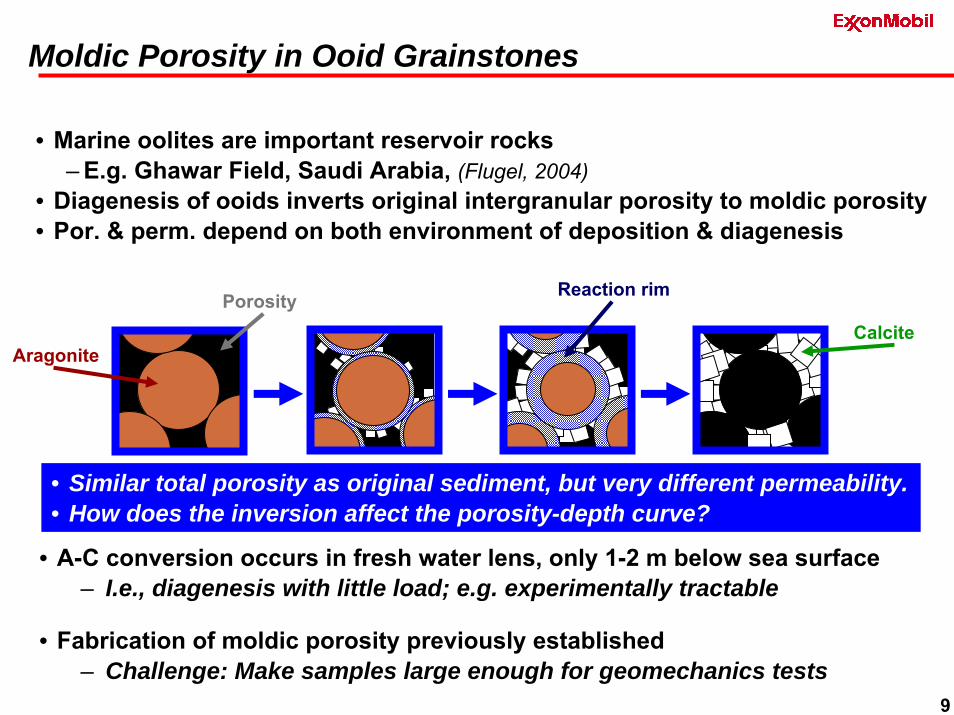
Moldic Porosity in Ooid Grainstones
• Marine oolites are important reservoir rocks– E.g. Ghawar Field, Saudi Arabia, (Flugel, 2004)
• Diagenesis of ooids inverts original intergranular porosity to moldic porosity• Por. & perm. depend on both environment of deposition & diagenesis
• Similar total porosity as original sediment, but very different permeability.• How does the inversion affect the porosity-depth curve?
• A-C conversion occurs in fresh water lens, only 1-2 m below sea surface– I.e., diagenesis with little load; e.g. experimentally tractable
• Fabrication of moldic porosity previously established– Challenge: Make samples large enough for geomechanics tests
AragoniteCalcite
Porosity Reaction rim

10
Research: Determine Effects of Diagenesis on Compaction of Synthetic Oolitic Grainstones
• Synthetic rocks decouple effects
– Adjust kinetics (t/T) to control diagenesis
– Study effect of diagenetic environment without overprinting
– Focus on matrix rather than vugs present in natural samples
Natural ooid sand
Heat to accelerate kinetics
Create diagenetically-altered rocks
Acquire compaction curves from uniaxial strain experiments
Poro
sity
Effective Stress
Natural grainstone (U. Miami)
Synthetic grainstone (current)
Follow microstructure with X-ray microtomography + thin section imaging

11
Samples Fabricated in Autoclave
LA-329/330
Aragonite Ooids
X-ray microtomography
500 µm
25 mm
12
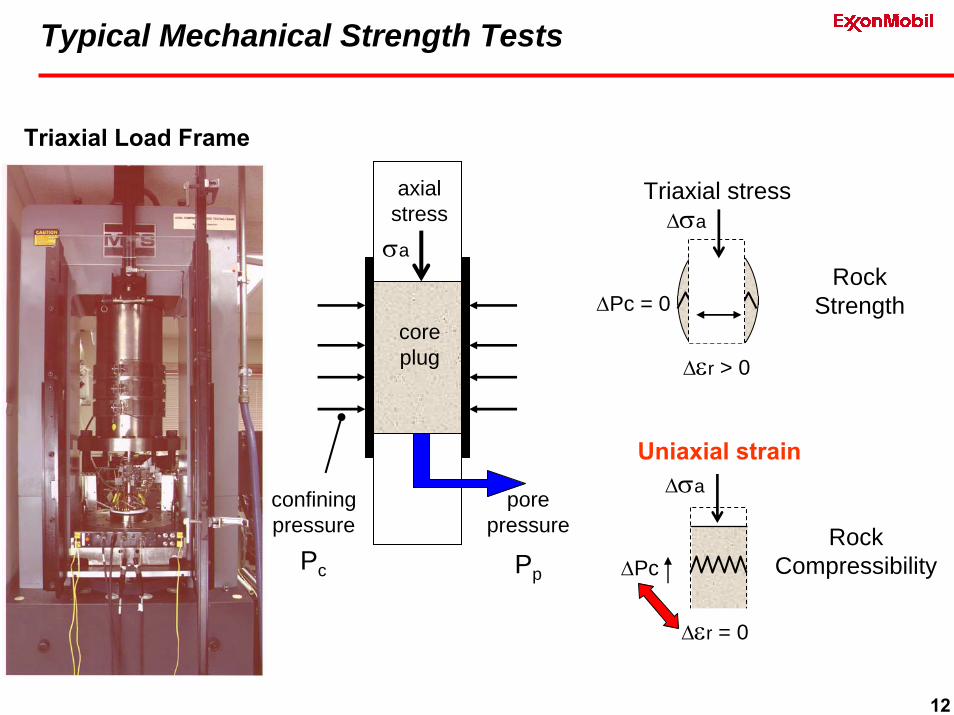
Typical Mechanical Strength Tests
∆Pc = 0
∆σa
∆εr > 0
axialstress
coreplug
porepressure
confiningpressure
σa
Pc Pp
Triaxial stress
RockStrength
∆σa
∆εr = 0
∆Pc
Uniaxial strain
RockCompressibility
Triaxial Load Frame

13
Typical Stress Paths
Reservoir Stress Path - Depletion (Plastic compaction)
0
1000
2000
3000
4000
5000
6000
0 1000 2000 3000 4000 5000 6000
p' (effective mean stress )
q (d
iff s
tress
, σv
- σh
)
Elastic zone
Dilatent zone
Plastic zone
Uniaxial strain path
Near wellbore path
Hydrostatic
Peak Failure Line
Triaxial
(σ’v+ σ’h1+ σ’h2) / 3P*
Uniaxial strain path
Near wellbore path
Hydrostatic
Peak Failure Line
Triaxial
(σ’v+ σ’h1+ σ’h2) / 3P*P*
σ1
σ3
σ1
σ3
σ1
σ3
Triaxial Compression
p’
Hydrostatic CompactionHydrostatic Compaction
q (s
tres
s di
ffere
nce)

14
0.38
0.42
0.46
0.50
0.54
0.58
0.62
0.07 0.7 7 70
Axial Effective Stress (MPa)
Void
Rat
io
Unconsolidated sediment
Typical drained uniaxial strain test
elastic
plastic
unload-reload
unload

Fabricating synthetic oolitic grainstones

16
30 days14 daysCements missing due to screen contact
~500 microns
~500 microns
Uncemented Grains
Laboratory - Simulated Diagenesis
180 daysScreen removal pulled open dissolved ooids
30 daysCements missing due to screen contact
Time at 180 ºC: 2 days
Uncemented Grains Moldic Porosity
~500 microns
~500 microns
~500 microns
~500 microns
>95%15%% A -C reaction: 30%<5%
30 days30 days14 daysCements missing due to screen contactCements missing due to screen contact
~500 microns
~500 microns
~500 microns
~500 microns
Uncemented Grains
Laboratory - Simulated Diagenesis
180 daysScreen removal pulled open dissolved ooidsScreen removal pulled open dissolved ooids
30 days30 daysCements missing due to screen contactCements missing due to screen contact
Time at 180 ºC: 2 days2 days
Uncemented Grains Moldic Porosity
~500 microns
~500 microns
~500 microns
~500 microns
~500 microns
~500 microns
~500 microns
~500 microns
~500 microns
~500 microns
~500 microns
~500 microns
>95%15%% A -C reaction: 30%<5%

17
Morphology of Lab DiagenesisRock Resembles Natural Samples
Autoclave Experiment7 days at 180 C
Pleistocene Grainstonefrom West Caicos
Natural DiagenesisLab Diagenesis
Holocene Ooid SandSchooner Cays, Bahamas
[Budd+Land, J. Sed. Pet., 1990]
Partially-dissolved
rim
Blocky calcite
Morphology of Lab DiagenesisRock Resembles Natural Samples
Autoclave Experiment7 days at 180 CAutoclave Experiment7 days at 180 C
Pleistocene Grainstonefrom West Caicos
Pleistocene Grainstonefrom West Caicos
Natural DiagenesisLab Diagenesis
Holocene Ooid SandSchooner Cays, Bahamas
[Budd+Land, J. Sed. Pet., 1990]
Holocene Ooid SandSchooner Cays, Bahamas
[Budd+Land, J. Sed. Pet., 1990]
Partially-dissolved
rim
Blocky calcite
Morphology of Lab DiagenesisRock Resembles Natural Samples
Autoclave Experiment7 days at 180 C
Pleistocene Grainstonefrom West Caicos
Natural DiagenesisLab Diagenesis
Holocene Ooid SandSchooner Cays, Bahamas
[Budd+Land, J. Sed. Pet., 1990]
Partially-dissolved
rim
Blocky calcite
Morphology of lab diagenesisrock resembles natural samples
Autoclave Experiment7 days at 180 C7 days at 180 C
Pleistocene Grainstonefrom West Caicos
Pleistocene Grainstonefrom West Caicos
Natural DiagenesisLab Diagenesis
Holocene Ooid SandSchooner Cays, Bahamas
[Budd+Land, J. Sed. Pet., 1990]
Holocene Ooid SandSchooner Cays, Bahamas
[Budd+Land, J. Sed. Pet., 1990]
Partially-dissolved
rim
Blocky calcite
Morphology of Lab DiagenesisRock Resembles Natural Samples
Autoclave Experiment7 days at 180 C
Pleistocene Grainstonefrom West Caicos
Natural DiagenesisLab Diagenesis
Holocene Ooid SandSchooner Cays, Bahamas
[Budd+Land, J. Sed. Pet., 1990]
Partially-dissolved
rim
Blocky calcite
Optical thin sections with
Morphology of Lab DiagenesisRock Resembles Natural Samples
Autoclave Experiment7 days at 180 CAutoclave Experiment7 days at 180 C
Pleistocene Grainstonefrom West Caicos
Pleistocene Grainstonefrom West Caicos
Natural DiagenesisLab Diagenesis
Holocene Ooid SandSchooner Cays, Bahamas
[Budd+Land, J. Sed. Pet., 1990]
Holocene Ooid SandSchooner Cays, Bahamas
[Budd+Land, J. Sed. Pet., 1990]
Partially-dissolved
rim
Blocky calcite
Optical thin sections with
Morphology of Lab DiagenesisRock Resembles Natural Samples
Autoclave Experiment7 days at 180 C
Pleistocene Grainstonefrom West Caicos
Natural DiagenesisLab Diagenesis
Holocene Ooid SandSchooner Cays, Bahamas
[Budd+Land, J. Sed. Pet., 1990]
Partially-dissolved
rim
Blocky calcite
Optical thin sections with
Morphology of Lab DiagenesisRock Resembles Natural Samples
Autoclave Experiment7 days at 180 CAutoclave Experiment7 days at 180 C
Pleistocene Grainstonefrom West Caicos
Pleistocene Grainstonefrom West Caicos
Natural DiagenesisLab Diagenesis
Holocene Ooid SandSchooner Cays, Bahamas
[Budd+Land, J. Sed. Pet., 1990]
Holocene Ooid SandSchooner Cays, Bahamas
[Budd+Land, J. Sed. Pet., 1990]
Partially-dissolved
rim
Blocky calcite
Optical thin sections with
Autoclave Experiment7 days at 180 CAutoclave Experiment7 days at 180 C
Pleistocene Grainstonefrom West Caicos
Pleistocene Grainstonefrom West Caicos
Natural DiagenesisLab Diagenesis
Holocene Ooid SandSchooner Cays, Bahamas
[Budd+Land, J. Sed. Pet., 1990]
Holocene Ooid SandSchooner Cays, Bahamas
[Budd+Land, J. Sed. Pet., 1990]
Partially-dissolved
rim
Blocky calcite
Autoclave Experiment7 days at 180 C7 days at 180 C
Pleistocene Grainstonefrom West Caicos
Pleistocene Grainstonefrom West Caicos
Natural DiagenesisLab Diagenesis
Holocene Ooid SandSchooner Cays, Bahamas
[Budd+Land, J. Sed. Pet., 1990]
Holocene Ooid SandSchooner Cays, Bahamas
[Budd+Land, J. Sed. Pet., 1990]
Partially-dissolved
rim
Blocky calcite
Lab / natural diagenesis
Morphology of lab diagenesisrock resembles natural samples

18
Cemented Ooid Grainstones, CT-scans
14 day 30 day 90 day

19
Ooid Thin Sections
30 day
14 dayFresh
90 day
500 µm

Uniaxial Strain Compaction Tests& Analyses

21
Synthetic Oolite Deformation & Analysis
Cement ooidsf( t, 180ºC, Ωaragonite)
Image Cemented CoreX-ray Microtomography (CT)
Compact Core
Re-image CoreCT, thin-section
Determine Degree ofReaction w/XRD
Unaltered ooids
14 day 15%
30 day 30%
90 day 50%
Samples Studied
time A→C reacted

22
Compaction of Unaltered Aragonite Ooids
Uniaxial Strain Results
Unaltered ooids
Effective Axial Stress (MPa)
Poro
sity
(%)
25%
30%
35%
40%
45%
0.07 0.7 7 70

23
Uniaxial strain test results
25%
30%
35%
40%
45%
0.07 0.7 7 70
Effective Axial Stress ( MPa)
Poro
sity unreacted
30% 15% calcite
>50%
25%
30%
35%
40%
45%
0.07 0.7 7 70
Effective Axial Stress ( MPa)
Poro
sity unaltered
30% 15% calcite
≥50%

24
Published carbonate porosity profiles
0
1000
2000
3000
0% 10% 20% 30% 40% 50% 60% 70% 80%
Porosity (%)D
epth
(m)
70-100% limestone
ooid, peloid &skeletal grains
carbonate mud

25
Comparison to Published I
0
500
1000
1500
2000
20% 30% 40% 50% 60%
Porosity D
epth
(m)
Unreacted
15% calcite
70-100% limestone
mixed grains
carbonate mud

26
Comparison to Published II
0
500
1000
1500
2000
20% 30% 40% 50% 60%
Porosity
Dep
th (m
)
Unreacted
15% calcite
30%
>50%
70-100% limestone
mixed grains
carbonate mud

27
Quantitative X-ray Microtomography
• Registration (pre versus post-compaction)– Fiducial markers required to register pre and post compaction samples
+ AutoCorrelation Function analysis for unregistered samples+ 2D visual inspection of local grain changes+ Potential for cross-correlation analysis for local changes
• Imaging difficulties– Calibrate CaCO3 X-ray opacity– Sample prep. techniques and pore fluid affect opacity – Damage in post-compaction cores

28
Fiducial Markers in ~50% calcite Sample
• Initial marker position is difficult to control
• Simple Z scaling registers fiducial markers
• Compaction is homogeneous
Pre-Post Compaction position
y = 0.8553x + 0.1907
0.000
1.000
2.000
3.000
4.000
5.000
6.000
7.000
0.000 1.000 2.000 3.000 4.000 5.000 6.000 7.000 8.000
Pre Compaction cm
Post
Com
pact
ion
cm
AfterLinear (After)
3D marker positionsPre-Compaction(Y)
Post-Compaction(R)
3D marker positions after 1D axial image rescaling

29
3D AutoCorrelation Function
• Computed using FFTs in 3D ACF(u,v,w) = F(u,v,w)F*(u,v,w)– Measures probability that two points separated by r will both lie in the same phase in
binarized pore-grain image (requires resolved grains)– Similar interpretation in calibrated (porosity) gray scale image– Qualitatively, 3D picture of the “averaged” grain environment
Images are not calibrated, but can make qualitative assessments.– ACF arbitrarily rescaled to max = 1 and min = 0– Interpreted as the average density profile around a grain– Interpretation uncertainties in mixed diagenetic structures
It is not necessary to register images to compare the ACFs
2D real space image of ooid grain pack
2D real space ACF of ooid grain pack

30
ACF Results, Compacted Fresh Ooids (17%)
• Small change in axial compression direction.– Decrease in 1st neighbor distance from 570 to 540um– Slight decrease in intergranular contrast
• Interpretation– Some reordering of ooid grains to accommodate strain , little or no
crushing or fines in pore space
Normalized ACF
0.0000
0.0200
0.0400
0.0600
0.0800
0.1000
0.1200
0.1400
0.1600
0.1800
0.2000
0 0.0336 0.0672 0.1008 0.1344
R(cm)
Nor
mal
ized
Inte
nsity
Axial-Post
R1-Postcom
pact
ion
2D Slice from 3D image
2D Slice from 3D ACF
31
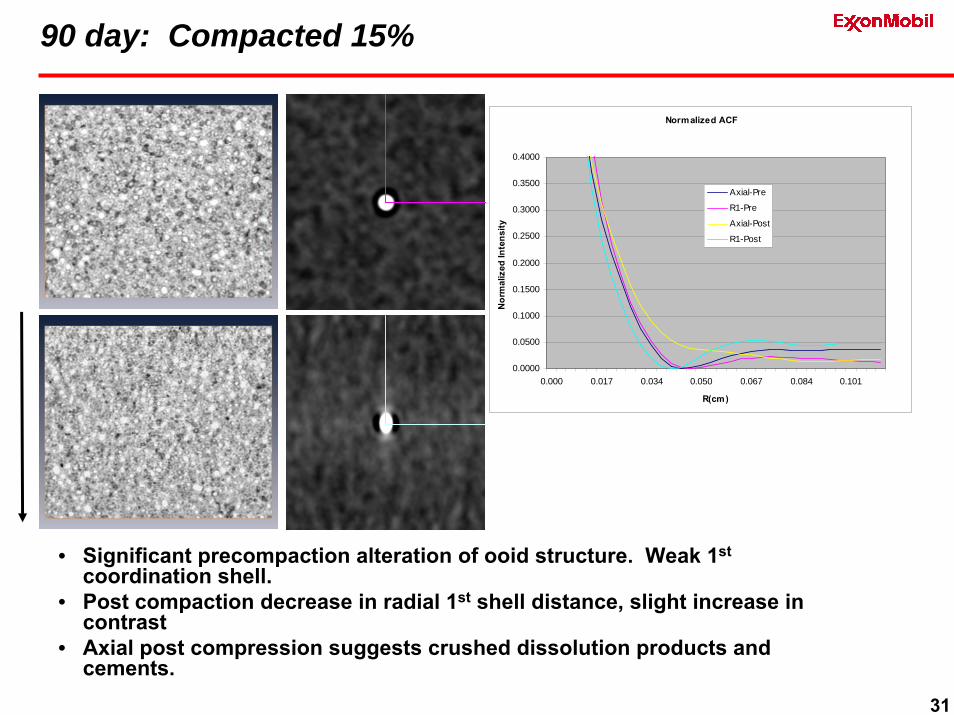
90 day: Compacted 15%
• ;lafglsd
Normalized ACF
0.0000
0.0500
0.1000
0.1500
0.2000
0.2500
0.3000
0.3500
0.4000
0.000 0.017 0.034 0.050 0.067 0.084 0.101
R(cm)
Nor
mal
ized
Inte
nsity
Axial-Pre
R1-Pre
Axial-Post
R1-Post
• Significant precompaction alteration of ooid structure. Weak 1st
coordination shell.• Post compaction decrease in radial 1st shell distance, slight increase in
contrast• Axial post compression suggests crushed dissolution products and
cements.
32
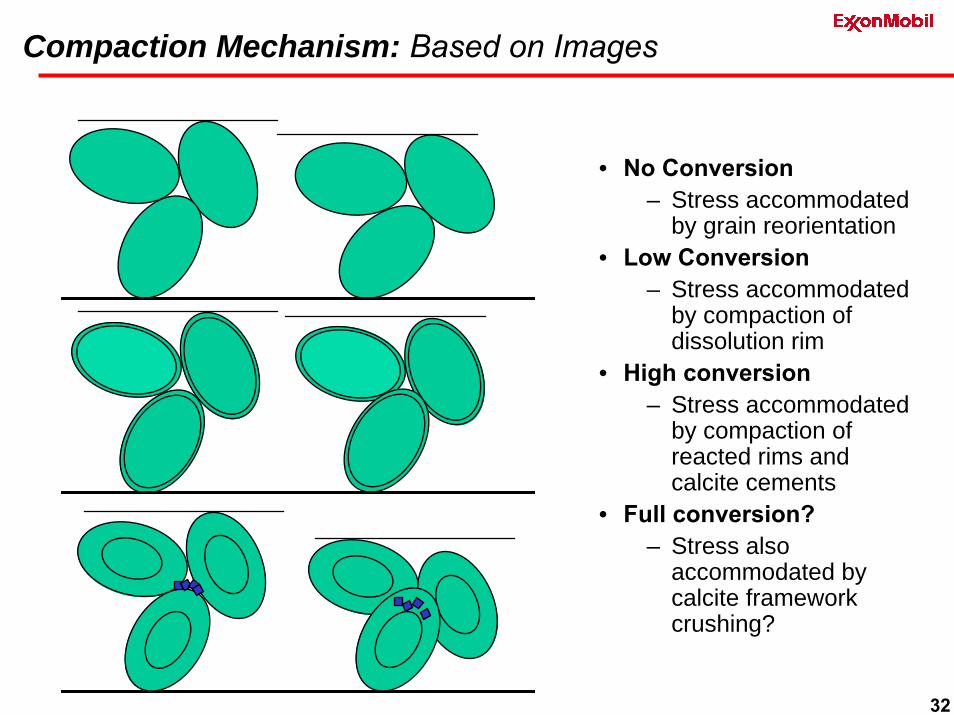
Compaction Mechanism: Based on Images
• No Conversion– Stress accommodated
by grain reorientation• Low Conversion
– Stress accommodated by compaction of dissolution rim
• High conversion– Stress accommodated
by compaction of reacted rims and calcite cements
• Full conversion?– Stress also
accommodated by calcite framework crushing?

33
Model
Lab Diagenesis
• Local, pore -scale, simultaneous dissolution and precipitation• Aragonite partially dissolves from outer surface inward• Calcite grows on outer surface •• Framework of leftover aragonite needles allows structural inversion
Synthesizing diagenetic rocks in the laboratory allows systematic, quantitative investigation
Summary I: Frabricated Poldic Porosity
Rim: Aragonite nonoparticles dissolve first, leaving needles
34
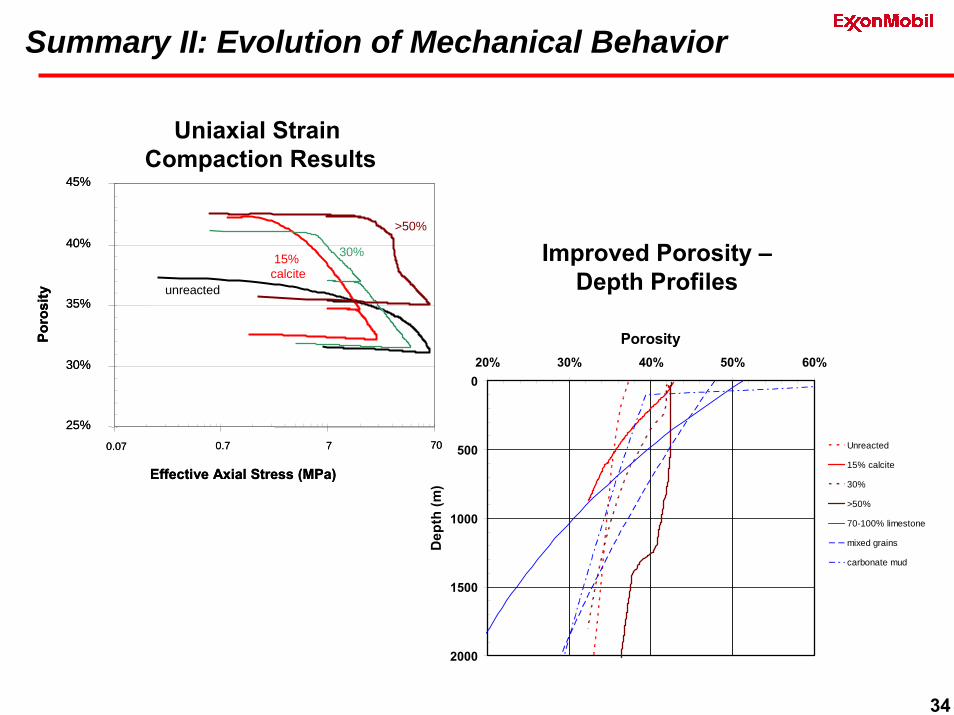
Summary II: Evolution of Mechanical Behavior
0
500
1000
1500
2000
20% 30% 40% 50% 60%
Porosity
Dep
th (m
)Unreacted
15% calcite
30%
>50%
70-100% limestone
mixed grains
carbonate mud
Uniaxial Strain Results
25%
30%
35%
40%
45%
0.07 0.7 7 70
Effective Axial Stress (MPa)
Poro
sity unreacted
30% 15% calcite
>50%
Uniaxial Strain Results
25%
30%
35%
40%
45%
0.07 0.7 7 70
Effective Axial Stress (MPa)
Poro
sity unreacted
30% 15% calcite
>50%
Uniaxial Strain Compaction Results
Improved Porosity –Depth Profiles

Students?
Help!?

36
Hint…
Ooid grainstone with intergranular porosity
Ooid grainstone with moldic porosity
Ooid grainstone with intergranular porosity
Ooid grainstone with moldic porosity
diagenesis
37
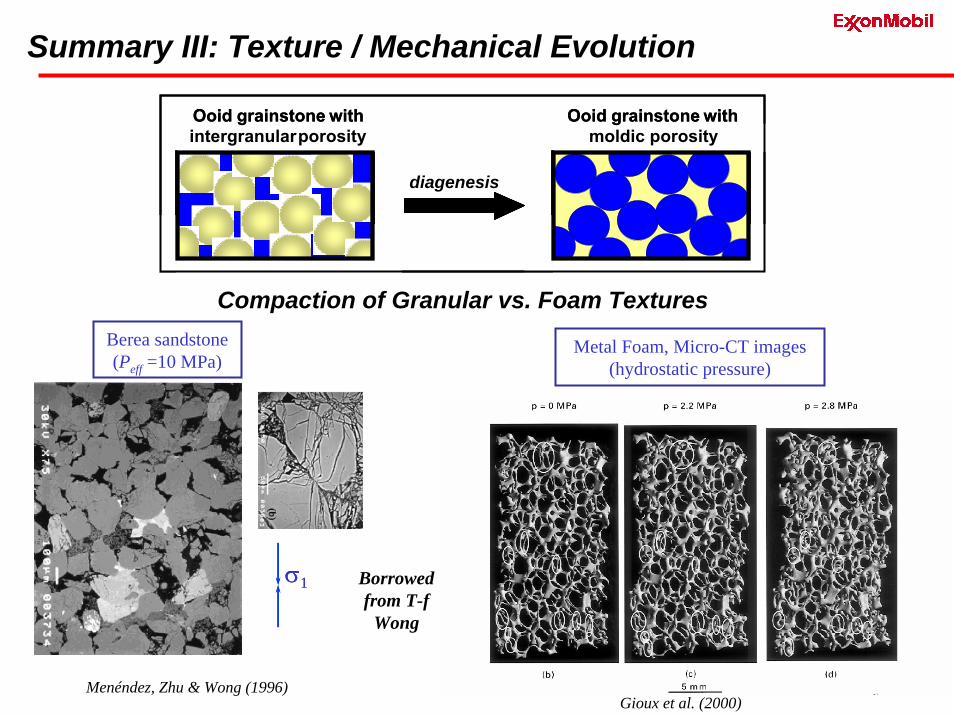
Summary III: Texture / Mechanical Evolution
Menéndez, Zhu & Wong (1996)
Compaction of Granular vs. Foam TexturesBerea sandstone (Peff =10 MPa)
σ1σ1
Metal Foam, Micro-CT images(hydrostatic pressure)
Ooid grainstone with intergranularporosity
Ooid grainstone with moldic porosity
Ooid grainstone with intergranularporosity
Ooid grainstone with moldic porosity
diagenesis
Gioux et al. (2000)
Borrowedfrom T-f
Wong

38
What Next?
• Rock Synthesis– Move beyond moldic porosity to other pore/rock types?
+ Other key carbonate reservoir types+ Cements in siliciclastics
• Geomechanical tests:– Explore other stress paths & physical properties (e.g., AE, vp & vs,
electrical…)– Evolution of permeability
• X-ray Microtomography analysis– Continue to improve techniques– Quantify grain properties
+ Grain type and degree of conversion+ Identify importance to compaction behavior
– Quantify Rock Deformation+ E.g. non-uniform compaction: track local grain displacements and
morphology changes using cross correlation• Seek more direct link to grain-scale geomechanics modeling

39(http://landsat.org)
Thank You!