effects of antagonists of luteinizing hormone- and growth...
TRANSCRIPT

Ph.D. Dissertation
2011
Effects of antagonists of luteinizing hormone- and growth
hormone-releasing hormone on experimental benign prostatic
hyperplasia and prostate cancer
Ferenc G. Rick, M.D.
Department of Anatomy
University of Pécs, School of Medicine
Pécs, Hungary
Department of Pathology
University of Miami, Miller School of Medicine
Miami, Florida, USA
Head of Postgraduate Education: László Lénárd, M.D., Ph.D., D.Sc.
Program leader: Valér Csernus, M.D., Ph.D., D.Sc.
Mentors: Magdolna Kovács, M.D., Ph.D., D.Sc.
Zoltán Rékási, M.D., Ph.D.
Advisors: Andrew V. Schally, Ph.D., M.D.hc(Multi), D.Sc.hc
Norman L. Block, M.D., F.A.C.S., D.A.B.U.

2
Ferenc G. Rick, M.D.
Effects of antagonists of luteinizing hormone- and growth hormone relasing hormone on
experimental benign prostatic hyperplasia and prostate cancer
Mentors:
Magdolna Kovacs, M.D., Ph.D., D.Sc., Professor
and
Zoltan Rekasi, M.D., Ph.D., Professor
Department of Anatomy
University of Pecs, School of Medicine
Pecs, Hungary
Advisors:
Andrew V. Schally, Ph.D., M.D.hc (Multi), D.Sc., Professor
and
Norman L. Block, M.D., F.A.C.S., D.A.B.U., Professor
Department of Pathology, Divisions of Hematology/Oncology and Endocrinology,
Department of Medicine
University of Miami, Miller School of Medicine
Veterans Affairs Medical Center and South Florida Veterans Affairs Foundation for Research
and Education
Miami, Florida, United States of America
The work described in this thesis was supported by the Medical Research Service of the
Veterans Affairs Department, Departments of Pathology, and Medicine, Division of
Hematology/Oncology of the Miller Medical School, University of Miami and
AEterna/Zentaris GmbH through South Florida Veterans Affairs Foundation for Research
and Education (all to A.V.S.), the L. Austin Weeks Endowment for Urologic Research
(N.L.B.), and the Hungarian National Sciences Foundation Grant OTKA K068452 (Z.R.).
© Copyright 2011, F. G. Rick
All rights reserved. No part of this work may be reproduced in any form by any electronic or
mechanical means without permission in writing from the author.

3
Contents:
ABBREVIATIONS .................................................................................................................................. 5
1. INTRODUCTION AND BACKGROUND ................................................................................................ 6
1.1. Benign prostatic hyperplasia ................................................................................................... 6
1.2. Clinical BPH ............................................................................................................................ 6
1.3. Pathological BPH .................................................................................................................... 7
1.4. Theories of the etiology of BPH ............................................................................................... 7
1.5. Models of BPH ....................................................................................................................... 10
1.6. Therapy of BPH ..................................................................................................................... 12
1.7. LHRH antagonists and BPH .................................................................................................. 13
1.8. GHRH antagonists ................................................................................................................. 14
1.9. Prostate cancer ...................................................................................................................... 16
2. AIMS OF OUR STUDIES ................................................................................................................... 19
2.1.Experimental benign prostatic hyperplasia studies ................................................................ 19
2.2.Human prostate cancer xenograft studies............................................................................... 19
3. MATERIALS AND METHODS ........................................................................................................... 20
3.1. Peptides and reagents ............................................................................................................ 20
3.2 Animals ................................................................................................................................... 21
3.3. In vivo experimental models .................................................................................................. 21
3.4. Histological procedures and morphological analyses ........................................................... 26
3.5. Immunohistochemical staining .............................................................................................. 27
3.6. Total DNA Isolation. .............................................................................................................. 27
3.7. Total RNA Isolation and cDNA sythesis. ............................................................................... 27
3.8. Quantitative real-time RT-PCR ............................................................................................. 27
3.9. RT2 Profiler PCR Array ......................................................................................................... 29
3.10. Western-blot ......................................................................................................................... 29
3.11. Radioimmunoassay (RIA) and ELISA. ................................................................................. 30
3.12. Ligand competition assays ................................................................................................... 31
3.13. Statistical Analysis. .............................................................................................................. 31
4. RESULTS ........................................................................................................................................ 32
4.1. Effects of LHRH antagonist cetrorelix on experimental benign prostatic hyperplasia (Study
1) ................................................................................................................................................... 32
4.2. Effects of GHRH antagonists on experimental benign prostatic hyperplasia (Study 2) ........ 39
4.3. Effects of combination of antagonist of LHRH with antagonist of GHRH on experimental
benign prostatic hyperplasia (Study 3). ........................................................................................ 49
4.4 Dose-dependent growth inhibition in vivo of PC-3 prostate cancer with a reduction in
tumoral growth factors after therapy with GHRH antagonist MZ-J-7-138 (Study 4) .................. 55
4.5. Inhibitory effects of antagonists of growth hormone releasing hormone on experimental
prostate cancers are associated with upregulation of wild-type p53 and decrease in p21 and
mutant p53 proteins (Study 5) ....................................................................................................... 59
5. DISCUSSION ................................................................................................................................... 67
5.1. Effects of LHRH antagonist cetrorelix on experimental benign prostatic hyperplasia (Study
1) ................................................................................................................................................... 67
5.2. Effects of GHRH antagonists on experimental benign prostatic hyperplasia (Study 2) ........ 68

4
5.3. Effects of combination of antagonist of LHRH with antagonist of GHRH on experimental
benign prostatic hyperplasia (Study 3). ........................................................................................ 71
5.4. Dose-dependent growth inhibition in vivo of PC-3 prostate cancer with a reduction in
tumoral growth factors after therapy with GHRH antagonist MZ-J-7-138 (Study 4) .................. 73
5.5. Inhibitory effects of antagonists of growth hormone releasing hormone on experimental
prostate cancers are associated with upregulation of wild-type p53 and decrease in p21 and
mutant p53 proteins (Study 5) ....................................................................................................... 77
6. NOVEL FINDINGS: .......................................................................................................................... 81
6.1.Experimental benign prostatic hyperplasia studies ................................................................ 81
6.2. Human prostate cancer xenograft studies.............................................................................. 82
7. REFERENCES .................................................................................................................................. 83
8. LIST OF PUBLICATIONS .................................................................................................................. 94
9. ACKNOWLEDGEMENTS .................................................................................................................. 98

5
Abbreviations
5AR2 = 5α-reductase type 2
α1A-AR = α1A-adrenoreceptor
AR = androgen receptor
BPH = benign prostatic hyperplasia
BOO = bladder outlet obstruction
CET= Cetrorelix
COX = cyclooxygenase
DHT = dihydrotestosterone
EGF = epidermal growth factor
FGF = fibroblast growth factor
GH = growth hormone
GHRH = growth hormone-releasing hormone
GHRH-R = growth hormone-releasing hormone receptor
IFN-γ = interferon-γ
IGF = insulin-like growth factor
IL = interleukin
LH = luteinizing hormone
LHRH = luteinizing hormone-releasing hormone
LHRH-R = luteinizing hormone-releasing hormone receptor
LUTS = lower urinary tract symptoms
NF-κβ = nuclear factor-kappa beta
PSA = prostate specific antigen
STEAP = six-transmembrane epithelial antigen of the prostate
SV1 = splice variant 1 of GHRH-R
TE = testosterone enanthate
TGF-β = transforming growth factor-β

6
1. Introduction and background
1.1. Benign prostatic hyperplasia
Benign prostatic hyperplasia (BPH) is an extremely common urinary tract disorder that can be
described clinically or pathologically. Clinical BPH is commonly viewed as benign enlargement of
the prostate, which contributes to an array of urinary voiding difficulties that can range from
bothersome lower urinary tract symptoms (LUTS) to significantly impacting quality of life among
older men (1). Pathologic BPH is the histological determination of non-neoplastic new prostatic
growth in adult men. Autopsy studies have revealed that the prevalence of pathologic BPH increases
markedly after the 4th decade and is found in up to 90% of men over age 80 (2). The high prevalence
of BPH in older men has led some to consider prostatic hyperplasia to be a ubiquitous result of aging
(3). The precise molecular mechanisms underlying the induction, maintenance, and development of
clinical sequelae resulting from BPH are incompletely understood (4).
1.2. Clinical BPH
The human prostate consists of four separate histologic zones: central, peripheral, transition,
and anterior fibromuscular (5). While prostate cancer is found mostly in the peripheral zone, virtually
all clinically significant BPH develops in the transition zone of the prostate (6). Macroscopic growth
of the transition zone can cause narrowing of the urethra as it passes through the prostate, leading to a
bladder outlet obstruction (BOO), which may affect the flow of urine. In men, the prostate is the most
common cause of obstruction. BPH and subsequent BOO contributes to a variety of urinary voiding
problems that can significantly impact quality of life and are commonly known as LUTS (7). In large
studies of men with BPH and LUTS, no strong correlation was found between prostate size,
symptoms and urinary flow rates (1). However, serum prostatic specific antigen (PSA) does correlate
with prostate volume, and men with larger prostates and elevated serum PSA are at higher risk of
experiencing more significant symptoms, including ultimate progression to acute urinary retention (1).
LUTS include bladder storage symptoms such as increased urinary frequency, urgency, and nocturia;
difficulty starting the stream of urine decreased urinary flow and incomplete emptying are generally
attributed to problems with bladder emptying (8). Other significant causes and contributing factors to
LUTS are age-related declines in detrusor function and systemic medical conditions (8,9). In contrast
to earlier times in man‟s history, with contemporary treatment strategies, BPH is now an atypical
direct cause of mortality. Experiencing an acute urinary retention and nocturia are clinical markers of
increased mortality risk that likely represent the high comorbidity of BPH with other systemic
medical conditions (4,10). Taken together with high morbidity and financial burden, BPH and LUTS
are serious medical matters.

7
1.3. Pathological BPH
Pathologically, BPH is characterized by hyperplastic epithelial and stromal growth that
combine into microscopic and macroscopic nodules in the prostate gland (11). There are five
generalized types of BPH nodules: (1) fibromyoadenomatous (common), (2) fibroadenomatous, (3)
fibrous/fibrovascular, (4) fibromuscular, and (5) muscular (uncommon) (12). More frequently, BPH is
described as epithelial (containing mostly prostate epithelial cells), mixed (containing stromal and
epithelial cells), and stromal (containing mostly stromal cells) (13). The initial nodules that develop in
BPH are found in the periurethral region and are typically stromal, composed of fibrous tissue mixed
with some smooth muscle (12). Infrequently, BPH nodules may be found in the peripheral zone,
which is palpable with digital rectal examination, and are typically composed of epithelial glandular
elements (14). The lack of glandular elements in stromal BPH nodules, and the observation of zonal
differences in the initiation of BPH nodules suggest a distinct etiology of stromal nodules compared to
BPH with glandular components. When the transition zone enlarges macroscopically, due to BPH
nodular growth, it can obstruct the flow of urine through the prostatic urethra and hence contribute to
LUTS. Understanding the key molecular mechanisms for how distinct BPH nodules develop and are
associated with LUTS is essential to developing clinical management tools for these diseases.
1.4. Theories of the etiology of BPH
The precise molecular etiology of BPH is complicated and unknown, but several theories
have been proposed. Hyperplastic growth in BPH has been credited to embryonic reawakening (6), an
imbalance between androgen/estrogen signaling (3,15), tissue remodeling in the aging prostate (16),
epithelial-mesenchymal transition (17), stem cell defects (18), hypoxia (19), chronic inflammation
(20), overexpression of stromal and epithelial growth factors (21) or by other obscure factors (Figure
1).
One prominent theory of BPH pathogenesis was proposed by McNeal and is termed the embryonic
reawakening theory (6). In 1978, McNeal posited that prostatic hyperplasia represents an awakening
of hormonally-mediated developmental processes (6). Through precise study of 63 autopsy prostates,
he noted that BPH nodules arose from the transition zone (6).
Consistent with this observation, Cunha demonstrated that androgen regulation and paracrine
interactions were necessary for prostate glandular development and maintenance, establishing the key
role of stromal–epithelial cell interactions in the prostate (22). A hormonal etiology involving
dysregulation of stromal–epithelial cell interactions is recognized as important for BPH development,
but the precise pathogenesis remains to be elucidated.

8
Figure 1. A schematic showing the confluence of factors for the development of BPH
Androgens, in particular DHT, are widely accepted as essential for the growth and
development of the human prostate (3). Although an association between concentrations of androgens
in the blood or prostate and risk of BPH or LUTS cannot be consistently demonstrated in
epidemiological studies (23), it is believed that androgens play a permissive role in BPH pathogenesis
(3). Androgen ablation by orchiectomy or suppression of the pituitary–testicular axis effectively
reduces prostate volume and improves symptoms caused by BPH, but also leads to adverse effects
unacceptable to many patients.
Increasing evidence from epidemiological, animal and in vitro studies supports a role for
estrogens in the pathogenesis of BPH (3). Most epidemiological studies have shown an association
between circulating estrogen levels and the risk of BPH or LUTS, and many experimental studies
have reported estradiol stimulation of prostate stromal cell proliferation in vitro (24,25). Studies of
human prostate tissues have indicated differential localization of ER subtypes in the two main cell
compartments of the prostate. Expression of ERα and ERβ has been identified mainly, though not
exclusively, in the prostate stroma and epithelium respectively, which suggests that they play different
roles in prostate physiology (26). To date, animal and in vitro studies have shown that ERα and ERβ
mediate the proliferative and apoptotic effects of estrogens on prostate cells, respectively (27).
Current evidence suggests that estrogens and androgens interact with one another in regulating
prostate cell growth in vivo (3).
Age is an associated factor for the development of both histologic and clinically significant
BPH. Although nearly all men will develop histologic BPH with age, it is thought that BPH initiation
occurs in younger men (30 years of age) (2). Furthermore, younger men develop BPH but at much
lower rates compared to aged men (2). It is presumed that there is no single pathomechanism, but a

9
synergistic effect of multiple events within biological communication systems (nerve-, endocrine-,
immune system) during the aging process of the organ (16). These events are predominantly changes
in prostate cell–cell interactions and alterations of highly specialized cell types responsible for tissue
homeostasis and function. In particular, life-long stress, pleiotrope mechanisms/factors and noxes on
metabolically highly active epithelia seem to be main triggers for initiation of BPH and organ
enlargement (16).
Alonso-Magdalena et al proposed that BPH is not a proliferative disease of the stroma but the
result of accumulation of myofibroblasts and smooth muscle cells, as a consequence of epithelial
proliferation and epithelial-mesenchymal transition (EMT) (17). This phenomenon involves changes
in gene expression that disrupt epithelial polarity and establish a mesenchymal phenotype, with
concomitant alterations in cytoskeletal organization, cell adhesion, and production of extracellular
matrix. The TGF-β/Smad3 is a key signaling pathway associated with the induction and maintenance
of EMT (28).
Lin et al demonstrated mesenchymal stem cell markers on primary stromal cells from BPH
patients, which have strong proliferative potential and ability to differentiate to myogenic, adipogenic
and osteogenic lineages (18).
A recent study revealed that prostatic stromal cells respond to hypoxia by upregulattion of
secretion of several growth factors such as VEGF, FGF-2, FGF-7 and TGF-β, suggesting that hypoxia
can trigger prostatic growth (19).
An emerging body of evidence suggests that inflammation may play a key role in the
development and progression of BPH (20,29). Clinically, several cross-sectional studies have
proposed that a relationship exists between the presence of inflammatory infiltrates and an increase in
prostate volume. Di Silverio et al. reported that presence of chronic inflammation increased as
prostate volume augments, from 9% in prostates of 30-39 milliliters (mls) to more than 60% in
prostates of 80-89 mls (30). A minor correlation was observed between presence of prostatic
inflammation and lower urinary tract symptoms (LUTS) in participating men in the Reduction by
Dutasteride of Prostate Cancer Events (REDUCE) trial (31). This minor correlation between prostatic
inflammation and presence of LUTS may be expected given the relatively modest correlations that
have been found between prostate volume and LUTS (32) . Additionally, in a Wistar rat model,
administration of an immunostimulator resulted in epithelial proliferation (33).
Recent reviews of the pathogenesis of BPH highlighted the differential expression of
cytokines and growth factors in BPH tissue suggesting a role for inflammation in the propagation of
BPH (16,34). An up-to-date outline of the current state of knowledge in regard to the impact of
inflammation on the pathogenesis of BPH was reported by Kramer et al. (20). Chronic inflammatory
infiltrates, mostly composed of activated T cells and macrophages, are often associated with BPH
nodules (35,36). Infiltrating T cells and macrophages are responsible for the production of cytokines

10
(IL-2 and IFNγ), which are believed to support fibromuscular growth through cascades of
proinflammatory cytokines and growth factors (21,37,38), leading to LUTS (39). Migration of T cells
into the area is accomplished by increased production of proinflammatory cytokines such as IL-6, IL-
8, IL-15 and IL-17 (16,20,40,41). Subsequently, surrounding cells are killed by unknown mechanism
and are replaced by fibromuscular nodules (42).Various growth factors such as FGF-2, FGF-7, IGF-I,
IGF–II, TGFβ and VEGF, are also involved in the pathogenesis of BPH (21,43).
Recent evidence from cell culture systems and immunohistochemical and mRNA analyses of
BPH tissues on expression profiles of growth-regulatory proteins and cytokines has provided insights
into the potential role of these growth factors and cytokines in the pathogenesis of BPH. Several
stromal and epithelial growth factors and inflammatory cytokines have been reported to be
overexpressed in BPH tissues or BPH-derived stromal cells (21). These include members of the
fibroblast (e.g. FGF-2, FGF-7, FGF-9), insulin-like (e.g. IGF-1 and IGF-2), transforming growth
factor families (e.g. TGF-β1 and TGF-β2), and angiogenic factors (e.g. VEGF-A) and downstream
effector molecules as well as a variety of interleukins (e.g. IL-2, IL-4, IL-8 and IL-17) that, working
together, could lead to abnormal stromal and epithelial cell growth within the transition zone of the
prostate (21,43).
1.5. Models of BPH
There are many in vitro and in vivo models of BPH available, each has its own strengths and
weaknesses (Table 1) (4,44). The best organism to evaluate BPH is man; however, there are ethical
issues that make human BPH studies difficult. Additionally, human genetics, socioeconomic
backgrounds, and lifestyles are highly variable between populations. Finally, the cost associated with
human research is high. For these reasons and others, use of humans is not ideal for early stages of
BPH research (4).
Table 1. Benefits and drawbacks of various BPH models
Model Benefit Drawback
Xenograft Human cells, BPH types Immune function, genetics, SE
Tissue recombination Human cells, SEI, in vitro and in vivo Immune function, SE
Chimpanzee Anatomy,spontaneous, in situ Genetics, SH, cost, anatomy
Dog Literature, spontaneous, in situ Genetics, SH, cost, anatomy
Rat In situ Genetics, anatomy
Mouse (transgenics) Pathway analysis, in situ Lacks multifactorial initiation, anatomy
Key: stromal-epithelial interactions (SEI); special housing (SH); secondary events (SE)
Adapted from Nicholson et al. Differentiation (2011) DOI: 10.1016/j.diff.2011.04.006
Human xenografts (45) or human tissue recombination xenograft models (46) have been
developed and studied extensively. The use of xenografts is particularly well suited for studies
evaluating maintenance or treatment of BPH, however, with all xenograft studies several drawbacks
apply. They are less suitable for researching the development and prevention of BPH. Additionally,

11
use of immunocompromised mouse or rat hosts make xenograft studies less appealing for evaluating
BPH in the context of an intact immune system. Lastly, although no animal model can evaluate LUTS
directly, analysis of secondary complications due to BPH (e.g. BOO) is not possible with xenograft
models.Tissue recombination, a technique that utilizes epithelia and stroma from various species or
organs, has successfully been used for the study of a wide range of normal and pathogenic states
(4,47). In this regard, Barclay and colleagues utilized tissue recombination methods using benign
human prostatic epithelial cells (BPH-1 cell line (48)) and human stroma from BPH or normal
prostates (46). In those experiments it was found that BPH stroma significantly increased epithelial
proliferation relative to control normal stroma, but importantly, malignant transformation did not
occur in the BPH tissue recombinants (48). These data are consistent with the important growth
promoting role of stroma in BPH. There are distinct advantages of utilizing tissue recombination
technology in BPH research. First, human cells can be employed; second, cells are commonly grown
in culture first and then recombined and grown in mouse hosts. While the cells are in culture it is
possible to manipulate gene expression (e.g. use of shRNA or forced expression of gene of interest)
and hence evaluate its consequences, such as growth and differentiation. Furthermore, in vitro
experiments can be inexpensively performed as proof of principle prior to in vivo experiments. Lastly,
tissue recombination is especially useful in evaluation of stromal–epithelial interactions, which are
likely to play a central role in the manifestation and maintenance of BPH.
Models where spontaneous BPH occur are highly desirable because they likely recapitulate
the underlying pathophysiology of human disease. The only animals other than man that develop
spontaneous BPH are dogs (4,44) and nonhuman primates such as chimpanzees (49). The logistics
and costs of carrying out such experiments with these species are typically high, and as such they are
used less frequently. Another limitation of spontaneous models is a lack of genetic manipulation,
which restricts the use of these models for key mechanistic questions.
Like man, dogs and rodents have hormone responsive prostates making them particularly
important in BPH research. The administration of androgens and estrogens to recreate a hormonal
environment similar to men as they age, reliably produces prostatic growth in dogs (50) and Wistar,
Brown Norway and Sprague-Dawley rats (44,51). Key research utilizing these models have
significantly moved the field of BPH research forward although prostate anatomy in dogs and rats
differs significantly from the human prostate. In particular, these prostates may grow outwardly and
away from the prostatic urethra, making prostatic growth less likely to cause obstruction and affect
urine flow, a key feature of human BPH. As such, BOO due to BPH has not been sufficiently
described in these models. Possibly the biggest obstacle to the utilization of many BPH models is the
lack of genetic manipulation. The ability to alter the genetics of cells, tissues, and whole organisms
has greatly advanced the scientific understanding of molecular mechanisms in developmental biology,
cancer, and many other disciplines. Although transgenic rats and dogs are possible (4), they are

12
unlikely to surpass the mouse in availability of genetically altered pathways. Further complications
with the usage of dog and rat hormone induction models are the associated cost and special housing
needed for these studies. Certainly many aspects of dog and rat models, as with all models, have and
will continue to move the field of BPH research forward; however, new genetically tractable models
of BPH with putative „„LUTS‟‟ are needed.
The best genetically workable organism for BPH and BOO research is the mouse, in which
gain and loss of function are easily regulated. In general, mouse models for BPH have been poorly
received due to their prostatic anatomy which is similar to the rat; therefore, the challenges of
modeling human BPH are similar to those encountered with rats and dogs. The prostatic lobes of the
mouse, although hormonally responsive, grow outwardly from the urethra into the abdominal cavity.
Thus, it is intuitive that regardless of prostate size, it may be impossible for BPH related BOO and
subsequent „„LUTS‟‟ to occur. There are several BPH transgenic mouse models (4), however, it
should be recognized that effects of one gene on the induction of multi-factorial disease(s) such as
BPH are likely only to enhance the knowledge of the particular pathway or process evaluated.
1.6. Therapy of BPH
A number of treatment options exist for the care of men with clinical sympthoms due to an
enlarged prostate. The standard of care for BPH is treatment with α-blockers, 5α-reductase inhibitors
(e.g. finasteride), surgery, or a combination there of (1). Drugs that block α-1 adrenergic receptors are
effective in BPH mainly by blocking sympathetically mediated contraction of prostatic smooth
muscle, relieving BOO, and leading to improved urine flow. α-1 adrenergic receptors are present
throughout the smooth muscle of the male urinary tract, and at the level of the spinal cord, ganglia and
nerve terminals, and therefore, are likely to have a wide spectrum of favorable effects on these extra-
prostatic sites (Nitti, 2005). While α-blockers are effective at improving LUTS for many patients, they
do not affect prostate growth and therefore do not decrease the risk of BPH complications such as
acute urinary retention and the need for surgical intervention (52). Hormonal treatment of BPH with
5α-reductase inhibitors blocks the conversion of testosterone to DHT, shrinks the prostate and results
in improved urinary flow rates, underscoring the well-known dependence of BPH on DHT. The gold-
standard surgical treatment for BPH is transurethral resection of the prostate (TURP) which relieves
obstruction by removing BPH nodules in the transition zone; however, a variety of minimally invasive
surgical approaches exist (7). Some patients do not respond well to these standards of care and it is
difficult to predict which patients will respond to a particular treatment. Furthermore, the efficacy and
acceptability of other hormonal treatments, such as antiandrogens or LHRH agonists, is low and can
be associated with side-effects of androgen ablation, such as hot flushes, decrease of potency and
libido and negative effects on bone and other tissues (53). Thus, there remains a need for advances

13
and improvements in treatment and prevention of BPH and LUTS based on a better understanding of
their pathophysiology.
1.7. LHRH antagonists and BPH
LHRH antagonists inhibit the reproductive system through competition with endogenous
LHRH for binding to pituitary LHRH-Rs, thus avoiding the undesirable stimulation and possible
disease flare that precedes the receptor desensitization observed with the agonists (Figure 2) (53).
Cetrorelix, originally developed in our laboratory in the late 1980‟s (54), is a highly potent LHRH
antagonist that induces an immediate inhibition of the pituitary-gonadal axis (Figure 2). Several
clinical studies have shown that therapy with low doses of this LHRH antagonist caused a marked and
long-lasting improvement in LUTS, with no impairment of gonadal function in men with
symptomatic BPH (55-58). During a long-term follow-up of >1 year after discontinuation of
cetrorelix, most patients continued to show a progressive improvement in urinary symptoms, sexual
function, a reduction in the IPSS, and an increase in urinary peak flow rate, with only a slight
reduction in prostate volume (56). In recent studies, during treatment there was a dose-dependent
transient suppression of serum testosterone concentrations, but the levels remained above castration
values. After 2 weeks the serum values returned to baseline (57). In experimental studies in rats, low
doses of cetrorelix, similar to those used in clinical studies, caused only a partial suppression of the
pituitary-gonadal axis and a transient suppression of serum LH and testosterone levels (59). In clinical
studies, the therapeutic effect of cetrorelix appears to be independent of testosterone suppression (55-
58). However, contradictory results of treatment with cetrorelix have been reported, which showed no
difference with placebo (60). Russo et al showed that LHRH antagonist ganirelix counteracts
experimental detrusor overactivity in female rats (60). This suggests that LHRH-R regulates bladder
function and supports reports of beneficial effects of LHRH receptor blockade in LUTS patients. The
improvement in LUTS also could be due to a direct inhibitory effect of cetrorelix on the prostate
through prostatic LHRH-Rs in combination with suppression of inflammatory cytokines, growth
factors and their receptors (61).Cetrorelix was also shown to inhibit the growth of human prostatic
and other cancers xenografted into nude mice with suppression of growth factors EGF and IGF-2 and
EGF receptor (62-64). A recent report demonstrated that apoptosis in primary cultures from prostate
cancer was induced by LHRH antagonist cetrorelix mediated by extrinsic pathway involving p53
phosphorylation (65).
A recent study from our laboratory has shown that in vitro cetrorelix can directly inhibit the
proliferation rate of the human BPH-1 prostate epithelial cell line by counteracting growth factors like
IGF-I and -II and FGF-2, and downregulating the LHRH receptor and α-adrenergic receptors, as well
as transcription factors (66).

14
Figure 2. Mode of action of antagonists of LHRH. (A) Type I LHRH secreted by the hypothalamus binds to its receptor in the pituitary and stimulates release of LH and FSH. These hormones, in turn, stimulate release of sex steroids, which can stimulate growth and development
of normal and tumor cells. (B) Some tumors express LHRH receptors and can respond to LHRH; cells in these tumors can be sex-steroid-
dependent or sex-steroid-independent. (C) LHRH antagonists induce a hypogonadotropic state by competitive blockade of pituitary LHRH receptors. Consequently, levels of FSH and LH, and subsequently levels of sex steroids, are lowered. The decrease in levels of sex steroids
inhibits the proliferation of both benign and malignant sex-steroid-dependent cells. (D) On benign cells that express LHRH receptors,
antagonists of LHRH might exert some direct effects mediated by these LHRH receptors. Abbreviations: FSH, follicle-stimulating hormone; LH, luteinizing hormone; LHRH, luteinizing-hormone-releasing hormone. Schematic figure is adapted from Engel et al. Nat Clin Pract
Endocrinol Metab (2007) 3:157-67).
1.8. GHRH antagonists
The hypothalamic neuropeptide growth hormone-releasing hormone (GHRH) stimulates the
secretion of growth hormone (GH) from the anterior pituitary gland upon binding to its receptors
(GHRH-R) (67). In turn, GH stimulates the production of insulin-like growth factor 1 (IGF-1), a
major anabolic growth factor and a potent mitogen for many cancers (68). GHRH and its pituitary
type receptor as well as its truncated receptor splice variants (SV) are expressed in various normal
human tissues including prostate, kidney, lung, and liver (69) and on many human cancer cell lines
and tumors (67). Pituitary type GHRH-R and SV1 appear to mediate effects of GHRH and its
antagonists on tumors (70). GHRH itself acts as an autocrine/paracrine growth factor in human
cancers (67,71), including prostate (72).
In order to develop new therapies for cancer, our laboratory has synthesized GHRH
antagonists with high antiproliferative activity in numerous experimental cancer models (67). The
inhibitory effect of these analogues is exerted in part by indirect endocrine mechanisms through the
suppression of GHRH-evoked release of GH from the pituitary, which in turn results in the inhibition
of the hepatic production of IGF-I (62). Direct mechanisms involved in the main antitumor effects of
15
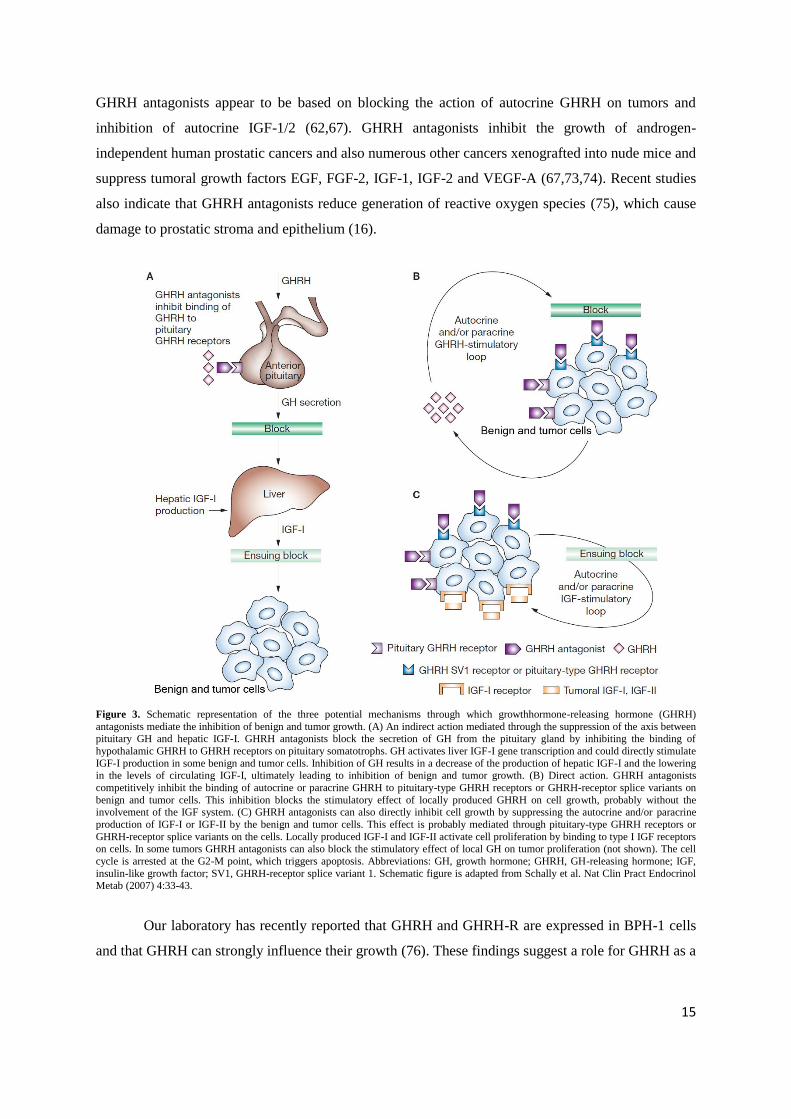
GHRH antagonists appear to be based on blocking the action of autocrine GHRH on tumors and
inhibition of autocrine IGF-1/2 (62,67). GHRH antagonists inhibit the growth of androgen-
independent human prostatic cancers and also numerous other cancers xenografted into nude mice and
suppress tumoral growth factors EGF, FGF-2, IGF-1, IGF-2 and VEGF-A (67,73,74). Recent studies
also indicate that GHRH antagonists reduce generation of reactive oxygen species (75), which cause
damage to prostatic stroma and epithelium (16).
Figure 3. Schematic representation of the three potential mechanisms through which growthhormone-releasing hormone (GHRH)
antagonists mediate the inhibition of benign and tumor growth. (A) An indirect action mediated through the suppression of the axis between pituitary GH and hepatic IGF-I. GHRH antagonists block the secretion of GH from the pituitary gland by inhibiting the binding of
hypothalamic GHRH to GHRH receptors on pituitary somatotrophs. GH activates liver IGF-I gene transcription and could directly stimulate
IGF-I production in some benign and tumor cells. Inhibition of GH results in a decrease of the production of hepatic IGF-I and the lowering in the levels of circulating IGF-I, ultimately leading to inhibition of benign and tumor growth. (B) Direct action. GHRH antagonists
competitively inhibit the binding of autocrine or paracrine GHRH to pituitary-type GHRH receptors or GHRH-receptor splice variants on
benign and tumor cells. This inhibition blocks the stimulatory effect of locally produced GHRH on cell growth, probably without the involvement of the IGF system. (C) GHRH antagonists can also directly inhibit cell growth by suppressing the autocrine and/or paracrine
production of IGF-I or IGF-II by the benign and tumor cells. This effect is probably mediated through pituitary-type GHRH receptors or
GHRH-receptor splice variants on the cells. Locally produced IGF-I and IGF-II activate cell proliferation by binding to type I IGF receptors
on cells. In some tumors GHRH antagonists can also block the stimulatory effect of local GH on tumor proliferation (not shown). The cell
cycle is arrested at the G2-M point, which triggers apoptosis. Abbreviations: GH, growth hormone; GHRH, GH-releasing hormone; IGF,
insulin-like growth factor; SV1, GHRH-receptor splice variant 1. Schematic figure is adapted from Schally et al. Nat Clin Pract Endocrinol Metab (2007) 4:33-43.
Our laboratory has recently reported that GHRH and GHRH-R are expressed in BPH-1 cells
and that GHRH can strongly influence their growth (76). These findings suggest a role for GHRH as a

16
locally acting growth factor in BPH and support the merit of further work on the development of
GHRH antagonists for the therapy of BPH.
1.9. Prostate cancer
Prostate cancer is the most common noncutaneous malignant tumour in men (77,78).
Androgen-dependent prostate cancer constitutes ~70% of all cases of prostate neoplasms (77). The
suppression of androgenic activity with surgical orchiectomy or agonists of luteinizing hormone-
releasing hormone is considered the most adequate first line treatment for advanced prostate cancer.
However, hormonal therapy is successful in only 70% to 80% of cases and the median duration of
response is usually only 12 to 24 months (78). Currently the management of metastatic prostate
cancer remains a complex and difficult problem because there is no curative treatment. The
chemotherapy with docetaxel based combination can lead to significant improvement in survival time.
However, median survival does not exceed 20 months from the start of chemotherapy (79). Therefore,
there is a great need for new and better therapies.
1.9.1. GHRH antagonists and prostate cancer
On the basis of recent advances in the understanding of the role of neuropeptides and growth
factors in the progression of prostate carcinoma and other cancers (77,80), we have developed
antagonists of GHRH for the treatment of various cancers including prostate cancer (77,78,81-84).
GHRH antagonists inhibit the growth of various human tumours xenografted into nude mice,
including androgen-independent prostate cancers (77,81,82,84,85) mainly by direct effects on cancer
cells (73,85-88), although indirect effects mediated by the inhibition of the endocrine pituitary
GH/hepatic IGF-I axis also occur (81,84,86). The direct effects of GHRH antagonists on cancer cells
are mediated through pGHRH-R and splice variants (SV) of the pituitary type of GHRH receptors,
which are present on human prostate cancer specimens and on cell lines (69,70,72,73,81,82,87,89,90).
In addition to blocking GHRH receptors, antagonists of GHRH also inhibit the tumoral expression of
IGF-I and II. These effects contribute to their antiproliferative mechanism (81,82). A decrease of
VEGF, FGF, IGF-I and II protein levels and their mRNA expression, and a downregulation of EGF
receptors was found after treatment of experimental androgen-independent prostate cancers with
GHRH antagonists (73,87,88,91).
Although early GHRH antagonists such as MZ-4-71 or MZ-5-156 significantly inhibited the
growth of PC-3 and DU-145 human androgen-independent prostate cancers in vivo (91,92), they were
deemed unsuitable for clinical development, as they required high doses and frequent administration
(2 x 20 µg/day in nude mice), due to the lack of sufficient potency, protracted activity, and chemical
and enzymatic stability. Subsequently, our laboratory developed more potent and longer acting
GHRH antagonists, in order to reduce the doses necessary for human therapy and to make the
potential clinical use of GHRH antagonists technically and economically feasible (67,84,85). One of

17
the most potent GHRH antagonists prepared to date is MZ-J-7-138, which was developed by using a
number of design criteria, including: (1) replacement of the enzymatically vulnerable Arg and Lys
residues present in native GHRH peptide by enzymatically stable alternative residues while also
preserving the subnanomolar binding affinities of the analogs to GHRH receptors; (2) replacement of
the Asn and Met residues, prone to chemical hydrolysis, by other amino acids; (3) incorporation of a
fatty acyl moiety into the molecule in order to enhance its binding to serum albumin, this strategy
being employed to reduce the blood clearance due to enzymatic degradation and renal filtration of
peptide drugs (67,84,93).
1.9.2. Role of p53 and p21 in prostate cancer
The tumor suppressor gene p53 is mutated in about half of all human cancers (94,95). p53
appears to play an important role in sensing and repairing DNA damage, inhibiting the cell cycle to
allow DNA repair, and inducing apoptosis to eliminate severely damaged cells (96). The multifunctional
p53 protein, which can act as a transcriptional activator or repressor, is induced by DNA damage, and
interacts with proteins involved in DNA replication and repair (96). Mutant p53 (mt-p53) is
preferentially expressed in hormone-refractory and metastatic prostate cancer (97-99). A poor response
to chemotherapy is clearly associated with mutations in the p53 gene (94). Mt-p53 may have lost the
tumor-suppressive functions and acquired additional, new oncogenic “gain-of-function” activities
including transactivation of oncogenic targets such as c-myc, anti-apoptotic gene BAG-1, growth-
promoting genes such as asparagine synthetase and hTERT, and the multi-drug resistance gp180
protein (MDR1) (100-102). The down-regulation of mt-p53 expression by siRNA in various cancer
lines containing endogenous mt-p53 results in a reduction of tumor malignancy (100) and decreases
cellular colony growth due to the induction of apoptosis (95). Overexpressed mt-p53 in tumor cells
may be a suitable therapeutic target for pharmacological interventions aimed at suppressing its
expression in vivo (95,102). The expression of wt-p53 in tumors can be also targeted by new
experimental therapies aimed to restore or upregulate it (103). Thus, it was shown that the expression
of functional wt-p53 protein increased apoptosis and suppressed the growth of human prostate cancer
cells (97,104).
The cyclin-dependent kinase (CDK) inhibitor p21 is involved in p53-mediated growth arrest
and has been identified as a key factor for the regulation of cell growth (105). Recent studies also
indicate to an important anti-apoptotic and pro-survival role of p21 in various cancers including
prostatic, colorectal, breast as well as in renal cell carcinomas and melanomas (106-109). Thus a
reduction in p21 protein levels by an antisense method sensitized the MDA-PCa-2b and LNCaP
prostate cancer cell lines to apoptosis induced by growth factor deprivation and the DNA-damaging
agent doxorubicin (106). p21 appears to play a key role in cellular resistance and escape mechanisms

18
of tumors during treatment with anti-cancer agents including gamma-radiation, doxorubicin, cisplatin,
paclitaxel and tamoxifen (106-112).
An increased expression of p21 was found to be associated with androgen independent prostate
cancer (113). In clinical studies, p21 expression was identified as an indicator of poor survival in
prostate cancer patients (114-116).
In an experimental model of benign prostatic hyperplasia (BPH), GHRH antagonists caused
up-regulation of wt-p53 (117); while in small cell lung carcinomas GHRH antagonists inhibited mt-
p53 levels (118). Consequently, we investigated the effect of GHRH antagonist MZ-J-7-138 on
apoptotic mechanisms including p53, and p21 and growth in human experimental prostate cancers
such as androgen independent PC-3 and DU-145 lines expressing mutant p53 and androgen sensitive
MDA-PCa-2b line expressing wild type p53.
19
2. Aims of our studies
2.1. Experimental benign prostatic hyperplasia studies
2.1.1. To show presence of GHRH-R and LHRH-R on rat prostates
2.1.2. To investigate effects of:
LHRH antagonist cetrorelix
GHRH antagonists JMR-132, MIA-313 and MIA-459
combination of LHRH antagonist cetrorelix and GHRH antagonist JMR-132on androgen-
induced model of BPH
2.1.3. To explore mechanisms of action of antagonists of LHRH and GHRH, and their combination in
experimental BPH
2.2. Human prostate cancer xenograft studies
2.2.1. To investigate the minimum effective dose and dose-response relationship of potent GHRH
antagonist MZ-J-7-138 for the treatment of androgen-independent PC-3 prostate cancer in vivo
2.2.2. To assess effect of GHRH antagonist MZ-J-7-138 on tumoral IGF-II and VEGF in PC-3
xenografts in view of evidence from earlier studies that tumor inhibition by GHRH antagonists affects
multiple tumoral growth factors and their signaling
2.2.3. To investigate inhibitory effects of GHRH antagonist MZ-J-7-138 on growth of androgen
independent human experimental prostate cancer DU-145 and androgen sensitive MDA-PCa-2b
2.2.4. To evaluate the effect of GHRH antagonist MZ-J-7-138 on apoptotic mechanisms including
p53, and p21 in human experimental prostate cancer xenografts such as androgen independent PC-3
and DU-145 lines expressing mutant p53 and androgen sensitive MDA-PCa-2b line expressing wilde
type p53

20
3. Materials and methods
3.1. Peptides and reagents
The GHRH antagonists JMR-132, MIA-313, MIA-459 and MZ-J-7-138 were synthesized by
solid-phase methodology using Boc-chemistry as described (119). Antagonist JMR-132 had the
sequence [PhAc0-Tyr
1, D-Arg
2, Cpa
6, Ala
8, Har
9, Tyr(Me)
10, His
11, Abu
15, His
20, Nle
27, D-Arg
28,
Har29
]hGH-RH(1-29)NH2, MIA-313 [(Ac-Amc)0-Tyr
1, D-Arg
2, Cpa
6, Ala
8, Har
9, Tyr(Me)
10, His
11,
Orn12
, Abu15
, His20
, Nle27
, D-Arg28
, Har29
, Agm30
]hGH-RH(1-30), MIA-459 [(PhAc-Ada)0-Tyr
1, D-
Arg2, Cpa
6, Ala
8, Har
9,Tyr (Me)
10, His
11, Orn
12, Abu
15, His
20, Orn
21, Nle
27, D-Arg
28, Har
29] hGH-
RH(1-29)NH2, and MZ-J-7-138 [CH3-(CH2)6-CO-Tyr1,DArg
2, Cpa
6,Ala
8,His
9,
Tyr(Et)10
,His11
,Orn12
,Abu15
, His20
, Orn21
,Nle27
, D-Arg28
, Har29
]hGHRH(1–29)NH2,where Abu is α-
aminobutyryl, Ac is acetyl, Acm is 8-aminocaprylyl, Ada is 12-aminododecanoyl, Agm is agmatine
(1-amino-4-guanidino-butane), Cpa is 4-chloro-Phe, Har is homoarginine, Nle is norleucine, Orn is
ornithine, PhAc is phenylacetyl, Tyr(Et) is O-ethyltyrosine and Tyr(Me) is O-methyl-Tyr. JMR-132
and MIA-459 with amidated carboxy termini were prepared on p-methylbenzhydrylamine resin (0.5–
0.9 mmol/g). For the synthesis of MIA-313 with C-terminal Agm, Boc-Agm-SPA-p-
methylbenzhydrylamine resin (30 mmol/g; California Peptide Research) was used as the starting
material. After completion of the synthesis and removal of the N-α-Boc–protecting group from Tyr1,
the resin-bound JMR-132, MIA-313, MIA-459, and MZ-J-7-138 peptides were acylated with PhAc,
Ac-Amc, PhAc-Ada, and octanoic acid, respectively. Final deprotection and cleavage of the peptides
from the resin with anhydrous hydrogen fluoride, as well as their purification and analysis by
semipreparative and analytical HPLC and mass spectra, were done as described previously (120).
The LHRH antagonist Cetrorelix ([Ac-D-Nal(2)1,D-Phe(4Cl)
2,D-Pal(3)
3,D-Cit
6,D-Ala
10]-
LHRH) originally synthesized in our laboratory by solid-phase methods (54) was made by Aeterna-
Zentaris (Frankfurt-on-Main, Germany) as Cetrorelix acetate (D20761). For in vitro experiments,
Cetrorelix acetate was dissolved in 0.1% DMSO and diluted in media. For in vivo experiments we
used a depot formulation of Cetrorelix pamoate (D20762), also provided by Aeterna-Zentaris,
containing Cetrorelix peptide-base and pamoic acid in a molar ratio of 2:1, respectively. For the
injection, Cetrorelix pamoate was dissolved in distilled water at a final concentration of 15 mg/ml in
5% mannitol. This depot preparation can be injected every 21–30 days. Aliquots of this suspension
(3mg/0.2ml) were injected s.c. giving an estimated daily release of 100μg/day of Cetrorelix for 30
days.
The peptides were lyophilized and stored in desiccator, and the stability and purity of the long
stored compounds were checked by HPLC before the experiments.
In our rat BPH model, testosterone enanthate (TE) (Watson Pharmaceuticals), corn oil vehicle
(Sigma-Aldrich), and 5α-reductase 2 (5AR2) inhibitor finasteride (Sigma-Aldrich) were used. For

21
daily injection, GHRH antagonists and finasteride were dissolved in 0.1% DMSO in 10% aqueous
propylene glycol solution.
3.2 Animals
In our BPH studies adult male Wistar rats (Charles River Laboratories) weighing 250-400 g
were used. Rats were allowed standard laboratory diet and tap water ad libitum. All rats remained
healthy throughout the experiments.
For xenograft studies, approximately 5–6 weeks old male athymic (Ncr nu/nu) nude mice
were obtained from the National Cancer Institute (Frederick Cancer Research and Develkopment
Center, Frederick, MD), housed in sterile cages under laminar flow hoods and fed autoclaved chow
and water ad libitum.
Rodents were housed in a climate-controlled (22 ± 2 °C, 50 ± 10% humidity), environment
with a 12-h light/dark cycle (light on from 06-18 h). All experiments were conducted in accordance
with the principles and procedures outlined in the National Institutes of Health Guide for the Care and
Use of Laboratory Animals. The protocol of the animal experiments was reviewed and approved by
the Institutional Animal Care and Use Committee (IACUC). Body weights were determined weekly.
3.3. In vivo experimental models
3.3.1. Testosterone-induced model of BPH
It is well known that enlargement of the prostate occurs in the presence of androgens (121) and that
anabolic steroids increase prostatic volume and reduce urine flow, leading to increased urinary
frequency (122). Maggi et al. described a model in male rats wherein BPH was produced by repeated
injections of testosterone (51). The model described by Maggi et al. has been adapted for several
studies (123-126). Given that the mechanism of prostate growth is complex and heterogeneous in
different species and the testosterone-induced models of BPH show an epithelial hyperplasia
(126,127), the androgen-induced models of BPH have limitations. These include the fact that
inflammation was not described as a main characteristic, but rather was incidental (126).
Alonso-Magdalena‟s description of human BPH as predominantly of epithelial origin (17) and the fact
that in our preliminary studies we found that our target receptors GHRH-R and LHRH-R are
exclusively expressed in the rat prostatic epithelium supports the rationale for using a testosterone-
induced model of BPH with predominant epithelial hyperplasia based on the reports of Maggi et al.
(51) and Scolnik et al. (126).

22
In our in vivo experiments on BPH, after 7 days acclimatization, rats were randomly divided into
experimental groups and one negative control group of ten animals each. BPH was induced in
experimental groups by daily subcutaneous injection in the right flank of long acting testosterone
enanthate (2mg/day), dissolved in corn oil from Day -28 to Day 0 (induction phase). Negative control
animals received subcutaneous injections of corn oil alone on the same schedule. The dosage and
duration of testosterone treatment were based on the reports by Maggi et al. (51) and Scolnik et al.
(126).
3.3.1.A. Investigation of effects of LHRH antagonist Cetrorelix
Based on previous clinical (56,57) and experimental (59) reports, animals were administered
subcutaneous injections of the LHRH antagonist Cetrorelix (0.625, 1.25, and 12.5mg/kg body weight)
in the left flank on days 1 and 22 after BPH induction (day_28 to day 0). Experimental groups
consisted of: (1) TE only, (2) TE/ Cetrorelix 0.625 mg/kg, (3) TE/Cetrorelix 1.25 mg/kg, and (4)
TE/Cetrorelix 12.5mg/kg body weight. TE only positive control animals were injected with mannitol
instead of Cetrorelix on the same schedule.
Figure 3. Scheme of the study. Induction phase included daily injections of 2mg TE s.c. per rat for 28 days. In the treatment phase, different doses of a depot preparation LHRH antagonist Cetrorelix pamoate (0.625,1.25, or12.5mg/kg) were administered s.c. on days 1 and 22. Study
groups were as follows: Control, TE, Cetrorelix 0.625mg/ kg, Cetrorelix 1.25mg/ kg and Cetrorelix 12.5mg/kg. BPH, benign prostatic
hyperplasia; LHRH, luteinizing hormone-releasing hormone; s.c., subcutaneous;TE, testosteroneSchematic figure is adapted from Rick et al. Prostate (2011) 71:736-47)
3.3.1.B. Investigation of effects of GHRH antagonist
One group of rats was administered daily s.c. injections of the 5AR2 inhibitor finasteride, 0.1
mg/kg, in the left flank from days 1–42 after BPH induction (Figure 3). This dosage of finasteride, an

23
approved drug for the treatment of BPH, is comparable to the human dosage (5mg/d). The other three
groups of animals were given daily s.c. injections of the GHRH antagonists JMR-132, MIA-313, or
MIA-459 (40, 20, and 20 μg/d, respectively). The dosage of GHRH antagonists was based on prior
experimental oncological use (128). Experimental groups consisted of (i) TE only, (ii) TE/finasteride
(0.1 mg·kg−1·d−1), (iii) TE/JMR-132, (iv) TE/MIA-313, and (v) TE/ MIA-459. TE-only positive control
animals received 0.1% DMSO in 10% aqueous propylene glycol solution instead of finasteride or
GHRH antagonists on the same schedule.
Figure 4. Scheme of the study. Induction phase included daily injections of 2mg TE s.c. per rat for 28 days. In the treatment phase, 5α-
reductase inhibitor finasteride (0.1mg/kg/day), GHRH antagonist JMR-132 (40µg/day), MIA-313 (20µg/day) and MIA-459 (20µg/day)
were administered s.c. daily.
3.3.1.C. Investigation of effects of combination of GHRH antagonist and LHRH antagonist
One group of rats was administered daily s.c. injections of the 5AR2 inhibitor finasteride 0.1
mg/kg in the left flank from days 1 to 42 after BPH induction. One group of animals was given daily
s.c. injections of the GHRH antagonists JMR-132 (40 µg/day). Animals were administered
subcutaneous injections of the LHRH antagonist Cetrorelix (0.625 mg/kg body weight) in the left
flank on days 1 and 22 after BPH induction (day -28 to day 0). The combination group received daily
s.c. injections of the GHRH antagonists JMR-132 (40 µg/day) and subcutaneous injections of the
LHRH antagonist Cetrorelix (0.625 mg/kg body weight) in the left flank on days 1 and 22 after BPH
induction. Experimental groups consisted of: (1) TE only, (2) TE/finasteride 0.1 mg/kg/day, (3)
TE/JMR-132 40 µg/day, (4) TE/Cetrorelix 0.625 mg/kg and (5) TE/JMR-132 40 µg/day and

24
Cetrorelix 0.625 mg/kg. The dosage and duration of JMR-132 and Cetrorelix was chosen based on
prior reports (117,129). TE-only positive control animals received 0.1% DMSO in 10% aqueous
propylene glycol solution instead of finasteride or GHRH antagonists and mannitol instead of
Cetrorelix on the same schedule.
Figure 5. Scheme of the study. Induction phase included daily injections of 2mg TE s.c. per rat for 28 days. In the treatment phase, 5α-
reductase inhibitor finasteride (0.1mg/kg/day), GHRH antagonist JMR-132 (40µg/day), depot preparation LHRH antagonist Cetrorelix
pamoate (0.625mg/kg), and combination of JMR-132 and cetrorelix were administered s.c..
Venous blood samples were collected before the experiment and on the last day of the
experiment (day 42). Serum was separated by centrifugation (10 min at 1000 rpm) and stored at -
80oC. Rats were weighed and sacrificed under anesthesia on the morning of day 42; whole prostates
were immediately removed, weighed and snap frozen. Alternate prostrate lobes were immersed in
phosphate-buffered 10% formalin (pH 7.4) and embedded in paraffin for histological analysis.
3.3.2. Tumor models
3.3.2.A. Cell cultures
PC-3 and DU-145 human androgen-independent prostate cancer and cell lines were obtained
from American Type Culture Collection (Manassas, VA) and cultured at 37 ◦C in a humidified 95%
air/5% CO2 atmosphere, using their designated media supplemented with antibiotics/antimycotics and
10% FBS (Table X). The MDAPCa-2b human androgen sensitive prostate cancer cell line was

25
obtained from Dr. Nora Navone, University of Texas, MD. Anderson Cancer Center ( Houston, TX)
and maintained in culture as described (98).
3.3.2.B. Tumor xenograft model
In our in vivo tumor xenograft assays, 1.5 million of PC-3, DU-145 or MDA-PSa-2b cells
were injected s.c. at each flank to three donor animals. Tumor tissue was harvested aseptically from
donor animals. Nude mice were xenografted subcutaneously with 3 mm3
pieces of respective tumor
tissue using a trocar needle. When tumors had grown to a mean volume of approximately 30-75 mm3,
the animals were randomly assigned to treatment groups and control (n = 8 to 9, (74) and (130)).
Experiment 1:
PC-3 tumor tissue was harvested aseptically from donor animals. Male nude mice were
xenografted subcutaneously with 3 mm3 pieces of PC-3 tumor tissue using a trocar needle. When
tumors had grown to a mean volume of approximately 56 mm3, the animals were randomly assigned
two groups. One group received treatment with MZ-J-7-138 (5μg/day) (n=9) and control group (n=9)
received vehicle solution. The experiment was ended on day 28.
Experiment 2:
Three mm3 pieces of DU-145 tumor tissue, harvested from donor animals were xenografted
s.c into male nude mice. When tumors had grown to approximately 30 mm3 (exponential phase of
growth), the animals were assigned to 2 experimental groups, each group containing 8 animals. Group
1 received GHRH antagonist MZ-J-7-138 at a dose of 5μg/day, group 2, controls was given vehicle
solution. The experiment was ended on day 42.
Experiment 3:
Male nude mice were xenografted subcutaneously with 60 mg minced MDA-PCa-2b tumor
tissue suspended in Matrigel as described (13). When tumors had grown to a mean volume of
approximately 75 mm3, the animals were assigned to 4 experimental groups. Group 1 (n=9) was
injected daily with MZ-J-7-138 (5 μg/day); group 2 (n=9) was given s.c 30 day release preparation of
LHRH antagonist Cetrorelix (100μg/day); group 3 (n=9) received a combination therapy of MZ-J-7-
138 (5 μg/day) injected daily and Cetrorelix (100μg/day) depot formulation, group 4, controls (n=9)
received vehicle solution. The experiment was ended on day 21.
Experiment 4:
Male nude mice were xenografted subcutaneously with 3 mm3 pieces of PC-3 tumor tissue
using a trocar needle. When tumors had grown to a mean volume of approximately 60 mm3, the
animals were randomly assigned to treatment groups and control of nine animals each. The antagonist
MZ-J-7-138 was injected s.c. daily at doses of 1.25, 2.5, 5, 10 µg/day and controls received the
injection vehicle.

26
Tumor volumes (length x width x height x 0.5236) and body weights were recorded every
week. At the end of the experiments, mice were anaesthetized with pentobarbital and sacrificed by
cutting the abdominal aorta. Tumors were carefully excised, weighed, snap frozen and stored at -70
°C for further investigations. Blood was collected and a complete necropsy was performed of all
animals. Liver, heart, lungs, kidneys, spleen, testicles, prostate and seminal vesicles were carefully
removed and weighed.
Tumor doubling time (TDT) and tumor inhibition (TI) were calculated using the formula:
TDT = days of treatment * log 2/(log volumefinal - log volumeinitial),
TI = 100%*(Δvolumecontrol - Δvolumetreated) / (Δvolumecontrol),
where Δvolume = final volume – initial volume.
3.4. Histological procedures and morphological analyses
Serial 5 mm-thick sections from each fixed tissue specimen were prepared, mounted on glass
slides, and stained with hematoxyline-eosin for morphological analysis. The sections were analyzed
with a Nikon Eclipse 90i microscope with a built-in digital camera. The digitalized images of ventral
prostatic lobes, obtained by using NIS-Elements BR 3.00 for Windows image analyzer software, were
used for stereological-morphometric analysis. The mean epithelial height was determined from a total
of 500 random interactive measurements with 40x objective at 10 different points on 10 different
fields from five different individual ventral prostate sections. Measurements were taken from the
intermediate to distal regions of the prostate lobe ducts, which represent the major portions of the
prostatic lobes (131).
The mitotic and apoptotic cells in the ventral prostate from three animals in each group were
counted in 10 random fields at 40x objective magnification from three different individual ventral
prostate sections. Because the size of the glands and the height of epithelial cells vary, the counts were
standardized as follows: (i) the area of epithelium in each field was determined by using a microscope
ocular net, and the crossing points of the net that coincided with epithelial cells were counted; (ii) the
ratio of these points to the number of all points represented the percentage area of epithelia in the
fields; (iii) the numbers of mitotic and apoptotic cells in a theoretical microscopic view field
composed entirely of epithelial cells were calculated.

27
3.5. Immunohistochemical staining
Serial 4-μm sections of rat prostates were used for immunoperoxidase staining following
standard protocols. Briefly, the paraffin was melted at 37 °C overnight and cleared in a bath of xylene
for 10 min. The slides then were rehydrated in decreasing grades of ethanol (10 min each) and washed
in PBS. The antigen retrieval was performed in a pressure cooker with Dako Target Retrieval Solution
(S1968; Dako) at 90°C for 15 min (pH 9.0). Antibodies to GHRH receptor in 1:1,000 dilution
(sc28692; Santa Cruz Biotechnology), to LHRH-R in 1:5 dilution (sc8682, Santa Cruz), and to
androgen receptor (AR) in 1:20 dilution (clone AR441; Dako) were added to the slides and incubated
for 30 min at room temperature. Immunohistochemical analysis was performed using Dako Flex
Detection System 1.0 (polymer-based). Diaminobenzidine was the chromogen in the presence of
hydrogen peroxide. For AR, the slides were exposed briefly to cupric sulfate and counterstained with
fast green. Positive reaction for GHRH-R and LHRH-R appeared as orange-brown granules, whereas
nuclear localization of AR appeared black (117,132).
3.6. Total DNA Isolation.
To quantify the cellular content of rat prostates, total DNA was prepared from 20 mg of
ventral prostate tissue for each sample using the DNeasy Blood and Tissue kit (Qiagen). Five prostate
samples from each group were analyzed. The yield and purity of DNA was determined according to
manufacturer‟s instructions.
3.7. Total RNA Isolation and cDNA sythesis.
Total RNA was isolated from 30 mg of prostate tissue for each sample using the NucleoSpin
kit (Macherey-Nagel). Three prostate samples from each group were analyzed. The yield and quality
of total RNA was determined spectrophotometrically using 260 nm and 260/280 nm ratio
(A260/A280>1,8), respectively. Two micrograms of RNA with a final volume of 40 µl were reverse
transcribed into cDNA with the QuantiTect Reverse Transcription Kit (Qiagen, Valencia, CA) using
the Veriti 96-well Thermal Cycler (Applied Biosystems, Foster City, CA).
3.8. Quantitative real-time RT-PCR
We evaluated the mRNA expression of rat (Table 2) and human (Table 3) target genes using
specific probes and primers (Table X). Specific primers were designed according to the following
criteria: (1) a product-size range of 70-180 bases, (2) a primer size range of 18-24 bases, (3) a Tm
difference of 3oC, and (4) a GC content of 30-80%. The mRNA sequences used for the design of the
primers were taken from the NCBI Reference Sequences. The primers were tested for sequence

28
similarity to other genes with NCBI BLAST (Basic Local Alignment Search Tool). The thermal
cycling conditions for each set of primers comprised an initial denaturation step at 95°C for 3 min and
then 35-40 cycles of two-step PCR including 95°C for 30 s and corresponding annealing tempreature
for 1 min. Data were collected during the annealing step and were further analyzed by the iCyclerTM
iQ Optical system software (Bio-Rad). Real-time PCR melting curve analyses revealed a single
product for each primer set.
All real-time PCR reactions were performed in the iCycler iQ Real-Time PCR Detection
System (Bio- Rad Laboratories, Hercules, CA). All real-time PCR reactions were performed in the
iCycler iQ Real-Time PCR Detection System (Bio-Rad Laboratories, Hercules, CA). All samples
were run in triplicate and each well of PCR reaction contained 25 µl as final volume including 2 µl of
cDNA, 200 nM of gene specific primers and 400 nM of probes. iQ SYBR Green Supermix (Bio-Rad
Laboratories) for PCR reactions performed with primers only, and iQ Supermix (Bio-Rad
Laboratories) was used in the PCR reactions for human pGHRH-R, GHRH and beta-actin. The
efficiencies of all primers (Invitrogen Life Technologies, Carlsbad, CA) and probes (Integrated DNA
Technologies, Coralville, IA) were tested prior to the experiments and they were all efficient in the
range of 95–105%. Rat Gapdh, beta-actin and human beta-actin were used to normalize for
differences in RNA input. Normal human and rat pituitary was used as positive control for pGHRH-R,
SV1 and GHRH. Negative samples were run in each reaction consisting of no-RNA in reverse
transcriptase reaction and no-cDNA in PCR reaction. The relative gene expression ratios were
calculated using Pfaffl‟s method (133).
Table 2. Rat primers used in our studies
Gene Accession
number
Forward (‘5 – 3’) Reverse (‘5 – 3’) Annealing
temp. (oC)
GHRH NM_031577 GGGTGTTCTTTGTGCTCCTC TTTGTTCCTGGTTCCTCTCC 61
Ptgs2/Cox-2 NM_017232 CCCAAGGCACAAATATGATG CTCGCTTCTGATCTGTCTT 59
Adra1a/α1A-AR NM_017191 ACTACTACATTGTCAACCT TCAAAGATGGCAGAGAAG 59
Nf-κβ1 XM_342346 GAAATCTATCTTCTCTGTGA ACCATTTTCTTCCTCTTC 58
Nf-κβ2 NM_001008349 ACTGCTCAATTTAATAATCTGG GAGTTTCTGAATCATAATCTC 55
RelA NM_199267 CCTTCCTGAAGCATGTAC AGAGTGAGATATTGCTGATAA 55
Bcl-2 NM_016993 CCAAACAAATATGAAAAGGT TGTGTGTGTTCTGCTTTA 55
Bax NM_017059 AGATGAACTGGACAATAATATGGA CGGAAGAAGACCTCTCGG 55
p53 NM_030989 GGATTCACAGTCGGATAT CATCTGGAGGAAGAAGTT 55
Gapdh NM_017008 ATTCTTCCACCTTTGATG GCCATATTCATTGTCATAC 60
Hprt1 NM_012583 AGCGTCGTGATTAGTGAT ATCTTCAGCATAATGATTAGGTA 55
IGF-1 NM_178866 GGCATTGTGGATGAGTGTTG CGATAGGGGCTGGGACTT 61
IGF-2 NM_133519 CGCACCCACAGAGAAATAAAA TCCGAGCACCTTCCTAACAC 61
TGF-α NM_012671 GCCTTCTTGCTAACCCACAC GATGTTTCCCCTTGTCCATTT 64
TGF-β1 NM_021578 CGCAATCTATGACAAAACCAAA ACAGCCACTCAGGCGTATC 61
TGF-β2 NM_031131 CGCATCTCCTGCTAATGTTG TTCGGGGTTTATGGTGTTGT 61
EGF NM_012842 CCCGTGTTCTTCTGAGTTCC TGTAACCGTGGCTTCCTTCT 61
FGF-2 NM_019305 CTGTCTCCCGCACCCTATC CTTTCTCCCTTCCTGCCTTT 61
KGF/FGF-7 NM_022182 TCCACCTCGTCTGTCTTGTG CCTTTCACTTTGCCTCGTTT 61
IL-1β NM_031512 GTCACTCATTGTGGCTGTGG GGGATTTTGTCGTTGCTTGT 61
IL-6 NM_012589 GCCAGAGTCATTCAGAGCAA CATTGGAAGTTGGGGTAGGA 61
VEGF-A NM_031836 GACACACCCACCCACATACA ACATCCTCCTCCCAACTCAA 61
LHRH-R NM_031038 GGGGCTGAGCATCTATAACACC TGCTAACCTCTGGACAGGGATC 60
LHRH NM_012767 GGCTTTCACATCCAAACAGAA GCCTTCCAAACACACAGTCAA 61
AR NM_012502 CAAAGGGTTGGAAGGTGAGA GAGCGAGCGGAAAGTTGTAG 61
5α-reductase 2 NM_022711 GCAAAGTTTCTGTGGAGGA AAGCAACTGGAATAACAAGAGA 59
β-actin NM_031144 GGGTTACGCGCTCCCTCAT GTCACGCACGATTTCCCTCTC 60

29
Table 3. Human primers used in our studies
Gene Accession
number
Forward (‘5 – 3’) Reverse (‘5 – 3’) Annealing
temp. (oC)
GHRHR NM_000823 ATGGGCTGCTGTGCTGGCCAAC TAAGGTGGAAAGGGCTCAGACC 65
GHRH NM_021081 ATGCAGATGCCATCTTCACCAA TGCTGTCTACCTGACGACCAA 60
SV1 AF282259.1 TGGGGAGAGGGAAGGAGTTGT GCGAGAACCAGCCACCAGAA 60
SV2 AF282260.1 AGGAAGGCCCCATAGTGTGTC GGCAGCCAGTGGAGAAGCT 60
SV3 AF282261.1 GCCCCATAGGGCTGTGAAAC ACAGCTGGGTGTGGACGTAGT 58
SV4 AF282262.1 CTGAGGAGGGCTGCCCGT GGCCCTTTGATGATCCACCAGT 65
β-actin NM_001101 CTGGAACGGTGAAGGTGACA AAGGGACTTCCTGTAACAATG 60
3.9. RT2 Profiler PCR Array
Rat Growth Factor, Inflammatory Cytokines/Receptors, and Signal Transduction Real-Time
PCR Arrays. Rat Growth Factor (PARN-041), Inflammatory Cytokines and Receptors (PARN-011),
and Signal Transduction Pathway Finder (PARN-014) RT2 Profiler Real-Time PCR arrays
(SABiosciences) were used to examine the mRNA levels of 252 genes related to growth factors,
inflammatory cytokines, and signal transduction. Total RNA extraction was as described. Quality
control of RNA samples, synthesis of cDNA, and its amplification by real-time RT-PCR arrays were
performed per the manufacturer‟s instructions (SABiosciences). Fold-changes in gene expression
were calculated using the ΔΔCt method. Normalization was performed using five housekeeping genes
on the arrays.
3.10. Western-blot
Rat prostate tissue and tumor tissue were homogenized with Mikro-Dismembrator
(Goettingen, Germany). Protein was isolated with NucleoSpin Kit (Macherey-Nagel) and sonicated
with Branson Sonifier (Danbury, CT). Protein lysates were adjusted to equal concentrations
(NanoDrop Technologies, Inc., Wilmington, DE), resuspended in 2× sample loading buffer containing
4% SDS, 20% glycerol, 120mM Tris and bromophenol blue, and boiled for 5min. Protein samples
were subjected to SDS-polyacrylamide gel electrophoresis. Proteins on the gel were transferred onto
nitrocellulose membranes that were blocked with 50–50% Odyssey buffer and phosphate buffered
saline (PBS) for 1 h at room temperature. The membranes were incubated afterwards with
corresponding primary antibody (Table X). After washing with PBS containing 0.1% Tween-20, the
membranes were incubated with the appropriate secondary antibody. The immunoreactive bands were
visualized with the Odyssey Infrared Imaging System and V.3.0 software was used (LI-COR
Biosciences, Lincoln, NE). Immunoblot analyses were performed using the following primary
antibodies following manufacturers‟ instructions:

30
Table 4. Primary antibodies used for Western-blots
Primary antibody Type of antibody Catalogue number Manufacturer
GHRH-R Rabbit polyclonal ab28692 Abcam
GHRH Rabbit polyclonal ab8911 Abcam
NF-κβ/p65 Rabbit polyclonal ab7970 Abcam
NF-κβ/p50 Goat polyclonal sc1191 Santa Cruz
phospho-NF-κβ/p50 (Ser337) Rabbit polyclonal sc33022 Santa Cruz
COX-2 Rabbit polyclonal 4842S Cell Signaling
AR Rabbit polyclonal sc13062 Santa Cruz
5α-reductase 2 Rabbit polyclonal sc20659 Santa Cruz
α1A-adrenoreceptor Mouse monoclonal sc100291 Santa Cruz
IL-1β Rabbit polyclonal sc7884 Santa Cruz
PCNA Mouse monoclonal sc25280 Santa Cruz
β-actin Mouse monoclonal sc47778 Santa Cruz
LHRH-R Rabbit polyclonal sc13944 Santa Cruz
LHRH Mouse monoclonal sc55459 Santa Cruz
p53 Rabbit polyclonal 9282 Cell Signaling
phospho-p53 (Ser46) Rabbit polyclonal 2521 Cell Signaling
p21 Mouse monoclonal sc56335 Santa Cruz
α-tubulin Mouse monoclonal CP06 Calbiochem
3.11. Radioimmunoassay (RIA) and ELISA.
For our rat BPH studies, we used commercial immunoassay kits to determine GH, LH, DHT,
IGF-1, and PSA levels in serum. Serum GH was determined by ELISA using the 32–5104 kit and
serum LH by 29-AH-R002 RIA kit (Alpco Diagnostics, Salem, NH). Serum DHT was determined by
RIA using DSL-9600 kit (Diagnostic Systems Laboratories, Webster, TX). For quantitative serum
PSA and IGF-1 we used ELISA kits DSL-9700, DSL-10-2800. All immunoassays were done
according to manufacturers‟ instructions.
For our human PC-3 prostatic cancer studies, human VEGF and IGF-II levels were
determined by RIA in tumor tissue homogenates (88).VEGFand IGF-II were extracted from tumor
tissue, using a modified acid-ethanol cryoprecipitation method (134). The total protein content was
determined by using the Bio Rad protein assay kit (Bio-Rad Laboratories). The standard for VEGF
was a recombinant human VEGF, 38.2 kDa, consisting of 165 amino acids. Antihuman VEGF was an
affinity-purified, polyclonal antibody. Both VEGF and antihuman VEGF were purchased from
PeproTech, Inc. (Rocky Hill, NJ). The standard was used in the range of 0.006 and 12.8 ng per tube.
The antibody was used at a final dilution of 1:200,000.VEGF was iodinated by the lactoperoxidase
method and purified by high-performance liquid chromatography, using a reverse-phase Vydac C4
column. The assay buffer for VEGF consisted of 0.01M sodium phosphate pH 7.6, 0.025 M EDTA,

31
0.14 M NaCl, and 1% BSA. The antibody and tracer were added simultaneously and incubated
overnight at 48 oC. Bound and free fractions were separated by the polyethylene–glycol double
antibody method. IGF-II concentration was measured by RIA using human recombinant IGF-II
standard (Bachem, Torrance, CA) in the range of 2–2,000 pg per tube. IGF-II was iodinated by the
lactoperoxidase method, and purified as described previously (91). Anti-rat IGF-II (10 mg/ml)
monoclonal antibody (Amano International Enzyme, Troy, VA) was used at a final dilution of
1:12,500. This antibody crossreacts 100% with human IGF-II and rat IGF-II, and 10% with human
IGF-I. The RIA results from all samples were evaluated in a computer-controlled gamma Counter
(Packard Cobra System, Perkin Elmer Life&Analytical Science, Shelton, CT). The intraassay and the
interassay coefficients of variation were less than 10% and 15%, respectively (74).
3.12. Ligand competition assays
Receptors for GHRH and LHRH on rat prostate tissues and receptors for GHRH on human
prostate cancer xenograft tumor tissues from the experimental groups were characterized by the ligand
competition assay. Preparation of membrane fractions for receptor studies was performed as described
previously (135). Radioiodinated derivatives of GHRH antagonist JV-142 and [D-Trp6]LHRH were
prepared by the chloramine-T method and purified by reverse-phase HPLC in our laboratory (90,135).
GHRH receptor binding assays were carried out as reported (90) using in vitro ligand competition
assays based on binding of [125
I]JV-1-42 as radioligand to membrane fractions of rat prostate samples
or human xenograft tumor tissues. LHRH receptor binding assays were carried out as reported (135)
using in vitro ligand competition assays based on binding of [125
I][D-Trp6]LHRH as radioligand to
membrane fractions of rat prostate samples. The LIGAND-PC computerized curve-fitting program
was used to determine the type of receptor binding, dissociation constant (Kd), and maximal binding
capacity of the receptors (Bmax).
3.13. Statistical Analysis.
For statistical evaluation, SigmaStat 3.0 software (Sytat Software) was used. Results are
expressed as means ± SEM. One-way ANOVA followed by Bonferroni t test, Student–Newman–
Keuls test, or a two-tailed Student‟s t test was used where appropriate, and significance was accepted
at P < 0.05.

32
4. Results
4.1. Effects of LHRH antagonist cetrorelix on experimental benign prostatic
hyperplasia (Study 1)
4.1.1. Effect of LHRH antagonist Cetrorelix on rat prostate weight
Body weights at sacrifice were not affected by Cetrorelix+TE compared to TE-only treated
rats (Table 5). Corn oil-injected control prostates (negative control) weighed 264.8±9.6 mg/100 g rat
(Figure 6); while in TE controls prostates were enlarged by 40.52% to 372.1±25.3 mg/100 g rat
(p<0.001; Figure 6). Cetrorelix pamoate 0.625 mg/kg significantly lowered prostate weights by
17.88% (p=0.02). This decrease was similar to that obtained with 1.25 mg/kg Cetrorelix (18.65 %
reduction [p=0.01]);further reduction occured but smaller than with 12.5 mg/kg Cetrorelix (35.17%
reduction [p<0.001]).
Table 5. Effect of LHRH antagonist Cetrorelix at different doses on morphological parameters
Body weight (g) Day 42
Day -28 Day 42 Prostate weight (g) Epithelial height (µm)
Control 255 ± 3 481 ± 9 1.27 ± 0.05 11.65 ± 0.11
TE 257 ± 7 445 ± 20 1.64 ± 0.10‡ 20.43 ± 0.39
TE/Cetrorelix 0.625 mg/kg 258 ± 4 446 ± 15 1.36 ± 0.06* 13.15 ± 0.14***
TE/Cetrorelix 1.25 mg/kg 258 ± 3 449 ± 10† 1.35 ± 0.04* 14.62 ± 0.17***
TE/Cetrorelix 12.5 mg/kg 254 ± 2 445 ± 12† 1.06 ± 0.05*** 12.57 ± 0.15***
† p<0.05, ‡ p<0.01 and p<0.001 as compared to Control, * p<0.05, ***p<0.01 as compared to TE. Statistical analysis was performed
by one-way ANOVA, followed by Bonferroni t-test.
Figure 6. Effect of TE and treatment with LHRH antagonist Cetrorelix at doses of 0.625, 1.25 and 12.5 mg/kg on relative prostate weight,
evaluated 42 days after the start of treatment with Cetrorelix. Statistical analysis was performed by one-way ANOVA, followed by
Bonferroni t-test. Significant differences are marked by asterisks (*p<0.05 and ***p<0.001). CTR = negative control; CET = Cetrorelix;
ANOVA = analysis of variance. Schematic figure is adapted from Rick et al. Prostate (2011) 71:736-47.

33
4.1.2. Morphology and morphometry
Macroscopically, no visible lesions were present in the prostates of Wistar rats in the different
experimental groups, except for the obvious enlargement observed among TE-induced BPH rats.
In the ventral prostates of negative control rats, we noted normal histology (126)
distinguished by monolayered low columnar epithelium with round-shaped nuclei adjacent to the
intact basal membrane and regular acini surrounded by variable amounts of fibromuscular stroma.
The acinar lumen contains only a small number of papillary folds (Figure 7 and Table 5).
Figure 7. Morphological evaluation of ventral prostate sections from control rats (A,D,G), rats with testosterone-induced BPH (B,E,H) and
rats treated with Cetrorelix 0.625 mg/kg (C,F,I). Compared to control, induction of BPH by testosterone decreased luminal area, promoted
epithelial folds (F) and increased the epithelial height (ep). Treatment with Cetrorelix 0.625 mg/kg increased the luminal area of the ducts
(L), diminished the epithelial folds and reduced epithelial height, as compared to TE-induced BPH animals. Bars indicate 100µm (G,H,I).
Arrows indicate fibromuscular stroma, while fine arrows indicate intact basal membrane. Histomorphology is shown at x10 (A,B,C), x20
(D,E,F) and x40 (G,H,I) magnification (hematoxylin-eosin staining). Schematic figure is adapted from Rick et al. Prostate (2011) 71:736-47.
Induction of BPH by testosterone resulted in hyperplastic acinar morphology in the ventral
prostates characterized by high columnar epithelial cells with round nuclei placed near to the intact
basal membrane, secretory vacuoles at the apical zone, numerous intraluminal papillary folds and

34
variable amounts of stroma (Figure 7). These changes in acinar morphology after treatment with
testosterone correspond to the observations of Scolnik et al. (126). We also found a 75% increase in
the epithelial cell height compared to control (Table 5).
After treatment with Cetrorelix 0.625 mg/kg, the ventral prostatic acinar morphology showed
characteristics similar to that of normal rats (Figure 7). The acini were lined with low columnar
epithelium with round basal nuclei. The acinar lumina had only a small degree of infolding. Cetrorelix
0.625 mg/kg significantly decreased the epithelial height by 36% compared to TE-induced BPH
controls (Table 5). The amount of fibromuscular stroma was seemingly not affected by treatment with
Cetrorelix at a low dose.
Figure 8. Inflammatory infiltrate in ventral prostate of testosterone-induced BPH rats. In addition to the primary pathological lesions of the prostatic acini, we observed incidental inflammatory reactions in the stroma, including lymphocytes (fine arrowhead), mast cells (fine
arrow), edema and blood congestion (arrow). This inflammatory infiltrate seemed to be present in the adjacent acinar lumen (arrowhead) as
well. We noted inflammatory infiltrates in all experimental groups. Hematoxylin-eosin staining, x40 magnification. Schematic figure is
adapted from Rick et al. Prostate (2011) 71:736-47.
In addition to the primary pathological lesions of the prostatic acini, incidental inflammatory
reactions including lymphocyte and mast cell infiltration, edema and blood congestion, were also
observed in all experimental groups (Figure 8). In some instances of TE-induced BPH, we found
intraluminal infiltration as well (Figure 8). These inflammatory infiltrates in the ventral prostates of
Wistar rats are consistent with the observations of inflammatory exudates that have been previously
reported for this model (126).
4.1.3. Effect of TE and Cetrorelix 0.625 mg/ kg on expression of inflammatory cytokine/growth
factor mRNA
Using real-time PCR arrays for rat inflammatory cytokines/receptors and growth factors on
control, TE-induced BPH control and TE-induced BPH treated with Cetrorelix 0.625 mg/kg (= lowest
dose), we identified important functional molecules affected by treatment with Cetrorelix and selected
genes potentially related to prostate shrinkage. More than 30 genes were significantly altered after

35
treatment with TE and Cetrorelix (p<0.05; Table 6). Cytokines including IL-3, IL-5, IL-6, IL-13, IL-
15, IL-17β and lymphotoxin-A (LTA) were upregulated by induction of BPH with TE, by 2.95-, 4.54-
, 1.98-, 4.47-, 4.17-, 1.95-, and 4.62-fold, respectively. Treatment with Cetrorelix significantly
downregulated cytokines IFN-γ, IL-1α, IL-3, IL-4, IL-5, IL-6, IL-13, IL-15, IL-17β and LTA by 2.35-
, 3.96-, 4.06-, 4.14-, 2.03-, 2.73-, 4.09-, 2.68-, 5.35- and 3.78-fold, respectively. Among chemokines
and chemokine receptors, expression of C5, CCL25, SPP1, CCR4, CCR9 and BLR-1/CXCR5 was
significantly decreased by Cetrorelix by 3.07-, 4.06-, 2.33-, 3.76-, 12.30- and 2.87-fold, respectively.
Levels of FGF-2, FGF-7, FGF-8 and FGF-14 were significantly reduced by Cetrorelix by 2.02-, 2.07-,
4.72- and 18.90-fold, respectively. Levels of mRNA for TGF-β superfamily members, TGF-β1 and
BMP-7, showed 1.79- and 1.75-fold decrease after Cetrorelix. The level of VEGF-A was 1.83-fold
lower after Cetrorelix.
Figure 9. Real-time PCR quantification of various growth factors involved in prostatic growth and function. Bars represent fold differences
of individual gene expression between prostate samples from A: TE and CTR (negative control) groups or B: Cetrorelix 0.625 mg/kg and TE groups. Positive values (>1.00) mark upregulation of individual genes, while negative values (<1.00) mark downregulation. Data are
shown as mean±SE. Asterisks indicate a significant difference (*p<0.05; **p<0.01and ***p<0.001 Student‟s t-test). Schematic figure is
adapted from Rick et al. Prostate (2011) 71:736-47.
Evaluating our PCR array data, we used real-time RT-PCR to analyze selected
proinflammatory and growth factor genes (Figure 9). We found that levels of mRNA for EGF, FGF-2,
FGF-7 and VEGF-A were significantly elevated in TE-induced BPH by 2.17-, 2.67-, 2.53- and 2.20-
fold, respectively (p<0.05). Treatment with Cetrorelix 0.625 mg/kg significantly decreased expression
of EGF (4.37-fold [p<0.01]), TGF-β1(1.89-fold [p<0.01]), TGF-β2 (1.46-fold [p<0.05]), FGF-2
(2.11-fold [p<0.05]), FGF-7 (2.75-fold [p<0.05]), VEGF-A (2.39-fold [p<0.001]), IL-1β (1.64-fold
[p<0.001]) and IL-6 (1.76-fold [p<0.05]).

36
Table 6. Gene expression of rat inflammatory cytokines and receptors and growth factors in
prostates harvested from TE treated and Cetrorelix 0.625 mg/kg treated rats 42 days after
start of treatment with Cetrorelix. Gene Fold change Description
TE vs.
Control
TE/Cetrorelix
0.625 mg/kg vs TE
Cytokine genes IFN-γ 1.29 -2.35 Interferon gamma, induction of proliferation of BPH stromal cells9
IL-1α 1.41 -3.63 Interleukin 1 alpha, stimulates the production of epithelial growth promoting FGF-7 in
fibroblastic stromal cells IL-1β 1.56 -1.47 Interleukin 1 beta, important mediator of the inflammatory response
IL-2 1.14 -1.27 Interleukin 2, stimulation of growth of stromal cell clones
IL-3 2.95 -4.06 Interleukin 3, secreted by activated T cells to support growth and differentiation of T cells in an
immune response IL-4
1.12 -4.14 Interleukin 4, inhibition of proliferation of slowly growing stromal cell clones, stimulation of
growth of fibroblasts IL-5 4.54 -2.03 Interleukin 5, produced by T helper-2 cells and mast cells, stimulates B cell growth and increase
immunoglobulin secretion IL-6 1.98 -2.73 Interleukin 6, stimulates epithelial cell growth
IL-f6 4.49 -4.02 Interleukin 1 family, member6, function unknown
IL-13 4.47 -4.09 Interleukin 13, a central mediator of the physiologic changes induced by allergic inflammation
in many tissues IL-15 4.17 -2.68 Interleukin 15, a growth factor for BPH memory T cells
IL-17β 1.95 -5.35 Interleukin 17B, a potent inductor of IL-6 and IL-8 production by prostate epithelial and stromal
cells LTA 4.62 -3.78 Lymphotoxin A, produced by lymphocytes, mediates a large variety of inflammatory,
immunostimulatory, and antiviral responses Cytokine receptors IL-5Rα 4.51 -4.15 Interleukin 5 receptor alpha, receptor for IL-5
Chemokines C5 1.04 -3.07 Complement component 5, a protein involved in the complement system
CCL25 4.42 -4.06 Chemokine (C-C motif) ligand 25, chemotactic for macrophages
CXCL2 3.89 -1.43 Chemokine (C-X-C motif) ligand 2, chemotactic for polymorphonuclear leukocytes 42,43
SPP1 2.75 -2.33 Secreted phosphoprotein 1 or osteopontin (OPN), immunmodulator and adhesion protein,
involed in chemotaxis and wound healing Chemokine Receptors CCR4 1.04 -3.76 Chemokine (C-C motif) receptor 4, a receptor for certain CC chemokines
CCR9 1.20 -12.30 Chemokine (C-C motif) receptor 9, the specific ligand of this receptor is CCL25
BLR-
1/CXCR5
2.08 -2.87 Chemokine (C-X-C motif) receptor 5, plays an essential role in B cell migration
Growth factors EGF 3.93 -2.47 Epidermal growth factor, potent mitogenic growth factor for prostatic epithelial cells
IGF-1 1.52 -1.45 Insulin-like growth factor 1, a mitogen for prostatic epithelial cells
IGF-2 -1.15 1.12 Insulin-like growth factor 2, the predominant mitogenic IGF produced chiefly by prostatic
stromal cells FGF-2 2.64 -2.02 Fibroblast growth factor 2, a potent growth factor for prostatic epithelial and stromal cells
FGF-7 1.41 -2.07 Fibroblast growth factor 7, a potent mitogen for prostatic epithelial cells
FGF-8 8.07 -4.72 Fibroblast growth factor 8, a FGF family member possessing broad mitogenic and cell survival
activities FGF-9 1.32 -1.25 Fibroblast growth factor 9, a potent mitogen for both prostatic epithelial and stromal cells
FGF-14 24.25 -18.90 Fibroblast growth factor 14 , involved in cell growth, morphogenesis, tissue repair, tumor
growth and invasion TGF-β superfamily BMP5 4.29 -1.36 Bone morphogenetic protein 5, function unknown in the prostate
BMP7 4.00 -1.75 Bone morphogenetic protein 7, function unknown in the prostate
TGF-β1 1.23 -1.79 Transforming growth factor beta 1, inhibition of stromal cell growth by induction of
differentiation and angiogenesis TGF-β2 1.16 -1.41
Transforming growth factor beta 2, inhibition of stromal cell growth by induction of
differentation and angiogenesis Angiogenic factors VEGF-A 1.75 -1.83 Vascular endothelial growth factor A, angiogenesis
VEGF-B -2.64 -1.27 Vascular endothelial growth factor B, angiogenesis
VEGF-C -1.07 -1.03 Vascular endothelial growth factor C, angiogenesis
Multiple genes related to inflammatory response and growth factors were evaluated for expression using real-time PCR via RT2 Profiler™
PCR Array system. The table lists the genes of interest evaluated and their fold increase or decrease in prostates obtained from TE treated
and TE/Cetrorelix 0.625 mg/kg treated rats 42 days after the start of treatment with Cetrorelix. Data represent fold differences of individual gene expression between study groups TE and control prostate or TE/Cetrorelix 0.625 mg/kg and TE. Positive values mark upregulation of
individual genes, while negative values mark downregulation. Three experiments were run for each study group. The data were evaluated
by two-tailed Student's t-test. Boldface depicts significant changes (p<0.05).Table adapted from Rick et al. Prostate (2011) 71:736-47.

37
4.1.4. Effect of Cetrorelix 0.625 mg/kg on expression of LHRH-R, LHRH, AR and 5α-reductase 2 in
rat prostate
mRNA for LHRH-R and LHRH-R protein and its LHRH ligand were detected in rat prostate
(Figure 10.1 and 2). There were no significant changes in the mRNA and the protein levels of LHRH-
R in TE-induced BPH and also after treatment with Cetrorelix (Figure 10.1., A and B). Expression of
LHRH was elevated after Cetrorelix; this is significant compared to control (Figure 10.2 B). There
were no significant changes in the expression of prostatic androgen receptor (AR) in TE-induced
BPH, while Cetrorelix significantly downregulated mRNA for AR and AR protein levels (Figure 10.3
A and B [p<0.001 and p<0.05, respectively]). Prostatic 5α-reductase 2 protein increased after TE
treatment compared to control (p<0.01); Cetrorelix significantly lowered 5α-reductase 2 mRNA and
protein levels (Figure 10.4 A and B [p<0.01 and p<0.05, respectively]).
Figure 10. A: Real-time PCR and B: Western blot analysis of LHRH-R (1), LHRH (2), AR (3) and 5-alpha-reductase 2 (4) in rat prostate after induction of BPH with TE and treatment with Cetrorelix at low doses of 0.625 mg/kg. A: Real-time PCR analysis of individual genes.
Bars represent fold differences of individual gene expression between prostate samples from TE and control groups or Cetrorelix 0.625
mg/kg and TE groups. Positive values (>1.00) mark upregulation of individual genes, while negative values (<1.00) mark downregulation. Data are shown as mean±SE. Asterisks indicate a significant difference (*p<0.05; **p<0.01 and ***p<0.001 by Student‟s t-test). B:
Western blot analysis of individual proteins showing immunoblot images (a) and corresponding signal intensity values (b). Representative
blots are presented and include 60kDa internal standard α-tubulin. Molecular masses are shown. Data are presented as mean of scaled signal intensity values ± SE. Asterisks indicate a significant difference (*p<0.05 and **p<0.01 by Student‟s t-test). Schematic figure is adapted
from Rick et al. Prostate (2011) 71:736-47.

38
4.1.5. Binding assay for LHRH receptors in rat prostate
Receptor analyses revealed a single class of high affinity binding sites for LHRH in rat
prostate with dissociation constant [Kd] of 0.82±0.12 nM) and a mean Bmax (maximal receptor binding
capacity) value of 143.0±3.81 fmol/mg membrane protein. Non- significant changes were found in Kd
or Bmax values in TE-induced BPH. Bmax for LHRH was significantly (p<0.01) reduced to 68.9±8.28
fmol/mg membrane protein after Cetrorelix (12.5 mg/kg), compared with control; but Kd remained
unchanged.
4.1.6. Effect of Cetrorelix on serum DHT, LH, IGF-1 and PSA
In TE-induced BPH there was a 10-fold increase in the serum DHT as compared to control at
day 42 (328.52±44.51 pg/ml [p<0.001]), while serum DHT was lowered after all doses of Cetrorelix.
A significant reduction in DHT was observed with 1.25 and 12.5 mg/kg doses of Cetrorelix only
(146.97±28.24 and 134.06±21.73 pg/ml, respectively [p<0.05]), but not with 0.625 mg/kg. TE
markedly decreased serum LH as compared to control (0.22±0.02 ng/ml [p<0.001]). Cetrorelix caused
an additional decrease in serum LH, however, significant changes were only seen with the highest
dose (0.15±0.01 ng/ml [p<0.05]). Serum PSA and IGF-1 changes were not significant (Table 6).
Table 6. Effect of Treatment with Cetrorelix on serum levels of DHT, LH, PSA and IGF-1
DHT (pg/ml) LH (ng/ml) PSA (ng/ml) IGF-1 (ng/ml)
Day -28 Day 42 Day -28 Day 42 Day -28 Day 42 Day -28 Day 42
Control 39.75±5.61 36.11±7.84 0.36±0.02 0.35±0.02 0.62±0.21 0.55±0.35 3.35±0.53 4.40±0.22
TE 39.89±2.03 328.52±44.51† 0.35±0.01 0.22±0.02† 0.53±0.30 0.50±0.23 4.21±0.25 4.84±0.77
TE/Cetrorelix 0.625 mg/kg 35.74±6.40 227.37±41.63 0.34±0.03 0.18±0.01 0.48±0.18 0.34±0.06 3.67±0.27 5.05±0.49
TE/Cetrorelix 1.25 mg/kg 40.44±7.52 146.97±28.24* 0.36±0.02 0.16±0.01 0.46±0.25 0.30±0.14 5.58±0.25 3.75±0.33
TE/Cetrorelix 12.5 mg/kg 38.62±4.72 134.06±21.73* 0.32±0.05 0.15±0.01* 0.51±0.11 0.29±0.05 4.93±1.13 4.06±0.50
†p<0.001 as compared to Control; *p<0.05 as compared to TE. The data were evaluated by two-tailed Student's t-test. Table adapted from
Rick et al. Prostate (2011) 71:736-47.

39
4.2. Effects of GHRH antagonists on experimental benign prostatic
hyperplasia (Study 2)
4.2.1. Expression of GHRH receptor, SV1 and GHRH.
Protein and mRNA for GHRH-R and for GHRH, as well as the protein of splice variant SV1
of GHRH-R were detected in rat prostate (Figure 11A and 11B). Levels of prostatic GHRH-R protein
were significantly increased after testosterone-enanthate (TE) treatment compared to control (P<0.01;
protein signal intensity values are shown in Figure 12); GHRH antagonist JMR-132 and finasteride
significantly elevated GHRH-R protein levels compared to TE (testosterone-enanthate) controls (P <
0.05 and P < 0.01, respectively; Figure 11B and Figure 12). Radioligand binding assays revealed a
single class of high affinity binding sites for GHRH in rat prostate with dissociation constant (Kd) of
4.13±0.09 nM and a mean maximal receptor binding capacity (Bmax) of 313.0±25.9 fmol/mg
membrane protein. The number of receptors for GHRH in rat BPH tissues induced by TE was
significantly (P<0.01) increased to 540.7±50.1 fmol/mg membrane protein; receptor Kd was
unchanged (4.02±0.20 nM). No significant changes were found in Kd or Bmax values in rat BPH
tissues after treatment with finasteride or GHRH antagonists JMR-132, MIA-313, and MIA-459,
compared with TE-induced rat BPH tissues. Further, protein expression of GHRH-R encoded by SV1
was quantified in rat prostates by Western blot (Figure 11B and Figure 12). Expression of GHRH
mRNA and protein was elevated after treatment with TE, while GHRH antagonists and finasteride
significantly suppressed expression of prostatic GHRH mRNA and protein levels compared to TE-
induced BPH (Figure 11A and 11B and Figure 12).
Figure 11. Effect of GHRH antagonists JMR-132, MIA-313 and MIA-459 on the expression of GHRH, GHRH-R, SV1, 5AR2, α1A-AR, and AR (A and B). Bar graph (A) showing real-time RT-PCR analysis of GHRH, GHRH-R, 5AR2, α1A-AR, and AR. Bars represent relative
expression of individual genes between prostate samples (n=3) from TE and control groups or between finasteride, JMR-132, MIA-313 or
MIA-459 and TE groups. Values > 1.00 mark upregulation of individual genes, while values < 1.00 mark downregulation. Data are shown as means ± SEM. Asterisks indicate a significant difference (*P < 0.05 and **P < 0.01 by Student‟s t-test). Western blot analysis (B) of of

40
GHRH, GHRH-R, SV1, 5AR2, α1A-AR, and AR. Representative blots of three independent experiments are presented and include internal
standard β-actin; corresponding signal intensity values are shown in Fig. S1A. Grouping of representative bands for each experimental
group was digitally performed. Expression of GHRH receptors(C) in representative ventral prostate of control rats was confined to the
cytoplasm and luminal membrane of prostatic acinar cells (Arrow). Localization of GHRH receptors are shown in 10X (Left) and 40X
(Right) magnification (Scale bars: 50µm). Androgen receptors (D) in representative ventral prostates of control rats were localized in the in the nuclei of prostatic acinar cells (Arrow), as shown by 20X (Left) and 40X (Right) magnification (Scale bars: 50µm). Schematic figure is
adapted from Rick et al. Proc Natl Acad Sci USA (2011) 108:3755-60.
4.2.2. Immunohistochemical confirmation of the expression of GHRH receptor protein.
Immunohistochemical analyses revealed that expression of GHRH-R is confined to the
cytoplasm and luminal membrane of prostatic acinar cells in rat (Figure 11C).
Figure 12. Protein expression of GHRH, GHRH-R, SV1, 5AR2, α1A-AR and AR (A) and IL-1β, NF-κβ/p65, COX-2 and PCNA (B) in rat
prostates (n=3 in each study group) obtained by Western blotting. Signal intensity values are compared to control (* P < 0.05, ** P < 0.01 and ***P < 0.01 as compared to TE; †P < 0.05, ‡P < 0.01 and §P < 0.001 as compared to control by Student‟s t-test). Schematic figure is
adapted from Rick et al. Proc Natl Acad Sci USA (2011) 108:3755-60.
4.2.3. Reduction of prostate size by GHRH antagonists.
Body weights of rats at sacrifice were not affected by any GHRH antagonist+TE- or by treatment with
finasteride+TE compared to TE-only (Table 7). Corn oil-injected control prostates weighed
234.9±16.7 mg/100 g rat; while in TE controls prostates were enlarged by 55.5% to 365.4±20.3
mg/100 g rat (P<0.001; Table 7). GHRH antagonists JMR-132 at 40µg/day, MIA-313 at 20µg/day,
and MIA-459 at 20µg/day significantly lowered prostate weights by 17.8%, 17.0% and 21.4%,
respectively compared to TE controls(P<0.05; Table 7). These reductions in prostate weight were
superior to that obtained with finasteride 0.1 mg/kg/day (nonsignificant 14.43 % reduction; Table 7).
In addition, GHRH antagonists significantly decreased prostatic DNA content as well (Table 7).
Testicular weights did not change after treatment with GHRH antagonists (Table 7).

41
Table 7. Effect of GHRH antagonists JMR-132, MIA-313 and MIA-459 on morphological
parameters
Body weight (g) Relative prostate
weight (mg/100g rat
BW)
Prostatic DNA
content (ng DNA/mg
tissue)
Relative testicle
weight (mg/100g
rat BW)
Day -28 Day 42 Day 42 Day 42 Day 42
Control 400.9 ± 9.9 551.6 ± 13.3 234.9 ±16.7 224.8 ± 8.6 617.6 ± 22.2
TE 392.8 ± 6.8 482.6 ± 7.1† 365.4 ± 20.3§ 266.8 ± 5.9 565.5 ± 25.7
TE/finasteride 0.1mg/kg/day 396.0 ± 8.8 476.0 ± 12.7† 337.6 ± 26.0 214.1 ± 9.4* 507.2 ± 30.6†
TE/JMR-132 40 µg/day 409.2 ± 10.2 517.4 ± 20.2 300.4 ± 18.1* 216.1 ± 8.7* 522.2 ± 28.5
TE/MIA-313 20 µg/day 403.7 ± 8.4 499.0 ± 14.2 303.4 ± 17.3* 186.0 ± 8.3*** 541.6 ± 10.4
TE/ MIA-459 20 µg/day 410.4 ± 8.8 510.1 ± 15.2 287.0 ± 16.3* 214.6 ± 7.8* 525.4 ± 19.1
† P<0.05, ‡ P<0.01 and § P<0.001 as compared to control; * P<0.05 and ***P<0.01 as compared to TE. Statistical analysis was performed
by one-way ANOVA, followed by Bonferroni t-test. Table is adapted from Rick et al. Proc Natl Acad Sci USA (2011) 108:3755-60.
4.2.4. Effect of GHRH antagonists on 5AR2, α1A-AR and AR.
There were no significant changes in levels of prostatic 5AR2 protein in TE-induced BPH.
GHRH antagonists JMR-132, MIA-313, and MIA-459 as well as finasteride significantly lowered
protein levels of 5AR2 (P<0.05 for all; Figure 11B and protein signal intensity values are shown in
Figure 12). While finasteride and JMR-132 significantly elevated the α1A-AR protein levels (P<0.05
for both, Figure 11B and Figure 12), MIA-313 and MIA-459 caused a nonsignificant increase in α1A-
AR protein levels. Levels of prostatic AR protein was significantly elevated in TE-induced BPH
(P<0.05); only treatment with JMR-132 resulted in significant change in AR protein level (2.30 fold
upregulation and P<0.05; Figure 11B and Figure 12). AR was localized to localized to the nuclei of
prostatic acinar cells by immunohistochemical staining (Figure 11D).
4.2.5. GHRH antagonists suppress proinflammatory IL-1β, NF-κβ and COX-2.
Prostatic IL-1β protein was significantly increased after TE treatment compared to control
(P<0.001), while GHRH antagonists JMR-132, MIA-313, and MIA-459 and finasteride significantly
reduced IL-1β levels (P<0.001 for all; Figure 13B and signal intensity values are shown in Figure 12).
Expression of NF-κβ/p65 (RelA) protein was significantly elevated after treatment with TE (P<0.01).
GHRH antagonists JMR-132, MIA-313 and MIA-459 and finasteride significantly decreased prostatic
NF-κβ/p65 protein levels compared to TE-induced BPH (P<0.001, P<0.01, P<0.01 and P<0.01,
respectively; Figure 13B and Figure 12). Prostatic COX-2 protein was elevated after TE treatment,
but not significantly. All three GHRH antagonists and finasteride significantly lowered prostatic

42
COX-2 protein levels (P<0.05 for all; Figure 13B and Figure 12). There was a suppression of NF-κβ2
and RelA genes after treatment with all three GHRH antagonists and finasteride (P<0.01for all; Figure
13A), while COX-2 gene was significantly downregulated after MIA-313, MIA-459, or finasteride
(P<0.05, P<0.01 and P<0.01, respectively; Figure 13A).
Figure 13. GHRH antagonists suppress expression of IL-1β, NF-κβ and COX-2 in rat prostates. Bar graph (A) showing real-time RT-PCR
analysis of IL-1b, NF-κβ1, NF-κβ2, RelA and COX-2. Bars represent relative expression of individual genes between prostate samples (n=3) from TE and control groups or between finasteride, JMR-132, MIA-313 or MIA-459 and TE groups. Values > 1.00 mark upregulation
of individual genes, while values < 1.00 mark downregulation. Data are shown as means ± SEM. Asterisks indicate a significant difference
(*P <0 .05 and **P < 0.01 by Student‟s t-test). Western blot analysis (B) of IL-1β, NF-κβ/p65, and COX-2. Representative blots of three independent experiments are presented and include internal standard β-actin; corresponding signal intensity values are shown in Fig. 12B.
Schematic figure is adapted from Rick et al. Proc Natl Acad Sci USA (2011) 108:3755-60.
4.2.6. GHRH antagonists inhibit cell division and induce apoptosis.
Morphologic evaluation on H&E slides revealed that sizes of average epithelial areas in the
ventral prostate did not differ among the study groups. Mitoses were significantly fewer in all groups
compared to TE treated BPH controls. Apoptotic cell numbers were higher in the groups treated with
GHRH antagonists MIA-313, MIA-459, and finasteride, but the differences from TE treated controls
were not statistically significant (Table 8). Representative apoptotic cells among epithelial cells in
ventral prostates of rats treated with MIA-459 are displayed in Figure 14F.
Figure 14. GHRH antagonists induce apoptosis and inhibit proliferation of prostatic epithelial cells in rats. Bar graphs (A-E) showing real-time RT-PCR analysis of Bcl-2, Bax and p53. Bars represent relative expression of individual genes between prostate samples (n=3) from

43
TE and control groups (A) or between finasteride (B), JMR-132 (C), MIA-313 (D) or MIA-459 (E) and TE groups. Values > 1.00 mark
upregulation of individual genes, while values < 1.00 mark downregulation. Data are shown as means ± SEM. Asterisks indicate a
significant difference (*P < 0.05 by Student‟s t-test). Representative apoptotic cells (Arrows) among prostatic acinar epithelial cells of a
MIA-459 treated rats are shown (F) in H&E stained slide (40X; scale bar: 50µm). Western blot analysis (G) of PCNA. Representative blots
of three independent experiments are presented; corresponding signal intensity values are shown in Fig. 12B. Grouping of representative bands for each experimental group was digitally performed. Schematic figure is adapted from Rick et al. Proc Natl Acad Sci USA (2011)
108:3755-60.
We found transcriptional upregulation of Bcl-2 and downregulation of Bax after TE treatment
(P<0.05 for both; Figure 14A). The expression of mRNA for Bax was elevated after treatment with all
three GHRH antagonists or finasteride (P<0.05 for all; Figure 14B-E), while that of Bcl-2 was
decreased after treatment with JMR-132, MIA-313 and MIA-459 (P<0.05, P<0.05 and P<0.01,
respectively; Figure 14C-E). No significant change in prostatic PCNA (proliferating cell nuclear
antigen) protein levels occurred after TE treatment; GHRH antagonists JMR-132 and MIA-459
significantly reduced PCNA protein (P<0.05 for all; Figure 14G).
Table 8. Effect of GHRH antagonists on cell proliferation and apoptosis in rat prostatic
epithelium
Mean epithelial area
in view fields (%)
Number of mitoses in one
theoretical field composed
entirely of epithelial cells
Number of apoptotic cells in one theoretical field
composed entirely of epithelial cells
Control 14.3 ± 1.6 1.93 ± 1.32 3.40 ± 0.43
TE 17.1 ± 2.3 5.86 ± 1.81† 3.12 ± 0.69
TE/finasteride 0.1mg/kg/day 15.9 ± 2.6 0.69 ± 0.35 * 6.42 ± 2.30
TE/JMR-132 40µg/day 15.0 ± 0.4 0.87 ± 0.43 * 3.55 ± 0.16
TE/MIA-313 20µg/day 14.7 ± 1.3 1.73 ± 0.47 * 5.18 ± 1.10
TE/MIA-459 20µg/day 16.0 ± 2.3 0.00 ± 0.00 * 5.69 ± 1.47
†P<0.05 as compared to control; *P<0.05 as compared to TE. The data were evaluated by one way ANOVA, followed by Student-Newman-
Keuls method. Table is adapted from Rick et al. Proc Natl Acad Sci USA (2011) 108:3755-60.
4.2.7. GHRH antagonists cause transcriptional downregulation of multiple genes involved in
growth, inflammatory response and signaling.
Growth factors, inflammatory cytokines and receptors and signal transduction factors were
evaluated for control, TE-induced BPH control and TE-induced BPH treated with GHRH antagonists
JMR-132, MIA-313, and MIA-459 by real-time RT-PCR arrays for rat. We identified important
functional molecules affected by treatment with GHRH antagonists and selected genes potentially
related to prostate shrinkage. More than 80 genes were significantly altered after treatment with TE
and GHRH antagonists (p<0.05; Table 9-11).
Transcriptional levels of several growth factors including Bmp1, Bmp2, Bmp3, Bmp8a, Egf,
Fgf1, Fgf2, Fgf11, Fgf12, Fgf14, Igf22, Igf2, Ntf4, Pdgfa, Spp1, Tgfa, Tgfb1, Tgfb2, Tgfb3 and
Vegfa were significantly lowered by GHRH antagonists (P<0.05; Table 9).
Expression of inflammatory cytokines including IL-1α, IL-1β, IL-13, IL-15, IL-17β, Spp1 and
Cd40lg were decreased by GHRH antagonists (P<0.05; Table 10). Among chemokines and their

44
receptors, expression of Ccl 6, Ccl7, Ccl12, Ccr1, Ccr6, Cxcr3 and Gpr2 was significantly decreased
by GHRH antagonists (P<0.05; Table 10 ).
From PCR array for signal transduction (Table 11), we identified putative downstream
pathways responsible for GHRH antagonist effects in this model. We found mRNAs for Egr1, Fos,
Jun and Nab2 mitogenic pathway genes significantly downregulated after treatment with GHRH
antagonists (P<0.05). Expression of Hedgehog pathway target genes (Bmp2, Bmp4, Hhip, Ptch1,
Wnt1 and Wnt2) was significantly affected by GHRH antagonists (P<0.05). Levels of PI3K/AKT
pathway-related genes such as Bcl2, Fn1, Jun and Mmp7 decreased after GHRH antagonists (P<0.05).
Expression of genes involved in phospholipase C pathway, such as Bcl-2, Egr1, Fos, Icam1, Jun, Junb
and Vcam1 was significantly lowered by GHRH.
Table 9. Gene expression of growth factors after treatment with TE and GHRH antagonists
JMR-132, MIA-313 and MIA-459 in rat prostates
Gene Accession no.
Fold change
TE vs.
Control
TE/JMR-132 40µg/day
vs. TE
TE/MIA-313 20µg/day
vs. TE
TE/MIA-459 20µg/day
vs. TE
Artn NM_053397 1.38 -1.84 -2.50 -3.37
Bmp1 XM_573814 1.45 -1.91 -2.33 -2.22
Bmp2 NM_017178 1.82 -1.43 -3.26 -2.93
Bmp3 NM_017105 -1.02 -1.61 -1.90 -2.08
Bmp8a XM_001059507 15.28 -21.86 -9.13 -28.91
Egf NM_012842 1.85 -2.41 -1.94 -4.25
Fgf1 NM_012846 1.07 -2.43 -1.90 -3.15
Fgf2 NM_019305 1.57 -1.57 1.88 -2.12
Fgf11 NM_130816 1.62 -2.05 -2.26 -2.16
Fgf13 NM_053428 -1.02 -2.30 -3.01 -2.80
Fgf14 NM_022223 1.27 -1.53 -1.24 -2.23
Fgf22 NM_130751 1.06 -2.02 -2.39 -2.74
Gdf5 XM_001066344 -1.08 -1.53 -1.81 -2.17
Igf1 NM_178866 1.42 -1.33 1.00 1.16
Igf2 NM_031511 1.85 -2.41 -1.58 -2.27
Inha NM_012590 -1.23 -1.89 -1.94 -2.74
Inhbb XM_344130 -1.12 -2.12 -2.59 -2.22
Lep NM_013076 2.70 -3.14 -3.34 -6.44
Ntf4 NM_013184 1.26 -1.62 -2.62 -2.61
Pdgfa NM_012801 1.95 -2.00 -2.13 -2.68
Pgf NM_053595 1.41 -1.48 -2.08 -1.50
Rabep1 NM_019124 1.07 -2.00 -2.06 -2.56
S100a6 NM_053485 1.26 -1.68 -2.45 -2.08
Spp1 NM_012881 -2.00 -2.38 -1.61 -6.90
Tgfα NM_012671 1.68 -1.87 -2.06 -2.50
Tgfβ1 NM_021578 4.81 -1.82 -2.01 -1.85
Tgfβ2 NM_031131 1.23 -2.14 -2.62 -1.54
Tgfβ3 NM_013174 1.12 -1.80 -1.92 -1.37
Vegfa NM_031836 1.59 -1.87 -1.92 -2.44
Vegfb NM_053549 1.05 -1.93 -1.51 -2.50
Table S1. Multiple genes related to growth were evaluated for expression using real-time PCR via RT2 Profiler™ PCR Array system. The
table lists the genes of interest evaluated and their fold increase or decrease in prostates obtained from TE treated and TE/JMR-132,
TE/MIA-313 and TE/MIA-459 treated rats 42 days after the start of treatment with GHRH antagonists. Data represent fold differences of
individual gene expression between study groups TE and control prostate or TE/JMR-132, TE/MIA-313, TE/MIA-459 and TE. Positive
values mark upregulation of individual genes, while negative values mark downregulation. Three experiments were run for each study
group. The data were evaluated by two-tailed Student's t-test. Boldface depicts significant changes (P<0.05). Table is adapted from Rick et
al. Proc Natl Acad Sci USA (2011) 108:3755-60.

45
We used real-time RT-PCR to verify changes in the expression of selected proinflammatory
and growth factor genes (Figure 15). Levels of mRNA for IGF-1, IGF-2, TGF-α, TGF-β2, EGF and
FGF-2 were significantly elevated in TE-induced BPH by 1.36-, 1.64-, 1.89-,1.98-, 2.21- and 1.83-
fold, respectively (P<0.05 for all; Figure 15A). Finasteride 0.1 mg/kg significantly decreased the
expression of mRNA for IGF-2 and IL-6 by 1.97- and 2.21-fold, respectively (P<0.05 for all; Figure
15B). Antagonist JMR-132 significantly lowered the expression of IGF-2, TGF-β1, TGF-β2, EGF,
VEGF-A and IL-6 by 1.36-, 1.96-, 1.59-, 1.61-, 1.51- and1.65-fold, respectively (P<0.05 for all;
Figure 15C). Treatment with MIA-313 significantly decreased the expression of TGF-α, TGF-β2,
EGF, FGF-7, VEGF-A and IL-6 by 1.49-, 1.47-, 1.53-, 1.72-, 1.63-, and 1.52-fold, respectively
(P<0.05 for all; Figure 15D). GHRH antagonist MIA-459 exerted the greatest downregulation at the
transcriptional level: IGF-2 (2.35-fold [P<0.01]), TGF-α (4.98-fold [P<0.01]), TGF-β1 (1.63-fold
[P<0.05]), TGF-β2 (1.45-fold [p<0.05]), EGF (2.75-fold [P<0.01]), FGF-2 (2.10-fold [P<0.05]) and
FGF-7 (1.87-fold [P<0.05]) (Figure 15E).
Figure 15. Real-time RT-PCR quantification of various growth
factors and inflammatory cytokines involved in prostatic growth and function. Bars represent fold differences of individual gene
expression between prostate samples from TE and control (A)
groups; finasteride 0.1 mg/kg/day and TE groups (B); JMR-132 40 µg/day and TE groups (C); MIA-313 20 µg/day and TE groups (D)
or MIA-459 20 µg/day and TE groups (E). Values > 1.00 mark
upregulation of individual genes, while values < 1.00 mark downregulation. Data are shown as means ± SEM. Asterisks
indicate a significant difference (*P < 0.05 and **P < 0.01 by
Student‟s t-test). Schematic figure is adapted from Rick et al. Proc Natl Acad Sci USA (2011) 108:3755-60.
4.2.8. Effect of GHRH antagonists on serum GH, IGF-1, DHT and PSA.
TE markedly increased serum GH (104.8±13.4 ng/ml [p<0.01]) as compared to control (49.4 ± 3.9
ng/ml). GHRH antagonists and finasteride did not cause a significant decrease in serum GH levels
(Table 12). Serum IGF-1 was significantly elevated after TE (4.9±0.6 ng/ml [p<0.05]) while GHRH

46
antagonists did not significantly lower serum IGF-1 levels. In TE-induced BPH rats there was an
approximately 10-fold increase in the serum DHT as compared to control at day 42 (337.4±53.5 pg/ml
[P<0.001]), however, no significant differences in serum DHT levels were observed after treatment of
GHRH antagonists. A significant 60%reduction in DHT was observed after treatment with finasteride
0.1mg/day(P<0.05). Serum PSA changes were not significant. Values for serum markers: see Table
12.
Table 10. Expression of genes involved in inflammatory response after treatment with TE and
GHRH antagonists JMR-132, MIA-313 and MIA-459 in rat prostates
Gene Accession no.
Fold change
TE vs.
Control
TE/JMR-132 40µg/day
vs. TE
TE/MIA-313 20µg/day
vs. TE
TE/MIA-459 20µg/day
vs. TE
Bcl6 XM_221333 1.69 -3.12 -5.06 -4.53
RGD1561905/
C5a
XM_345342 2.23 -2.36 2.57 -3.43
Ccl12 XM_213425 1.36 -1.78 -1.36 -1.21
Ccl24 NM_001013045 1.12 -1.10 -1.45 -1.13
Ccl6 NM_001004202 2.20 1.12 -1.47 -1.39
Ccl7 NM_001007612 -1.67 -2.91 -3.34 -1.43
Ccr1 NM_020542 -1.67 -2.20 -1.18 -1.50
Ccr6 NM_001013145 2.08 -1.37 -1.45 -1.30
Cxcl4 NM_001007729 1.58 1.20 -1.56 1.09
Cxcr3 NM_053415 1.12 -1.69 1.10 -1.39
Gpr2 XM_343968 2.23 -1.56 -1.36 -1.98
Il13 NM_053828 3.39 -1.36 -1.55 -1.97
Il15 NM_013129 2.57 -1.44 -1.03 -1.63
Il17b XM_341621 2.08 1.24 -1.67 -1.54
Il1α NM_017019 1.69 -1.95 1.28 -3.06
Il1β NM_031512 1.66 -1.58 -2.23 -2.17
Spp1 NM_012881 4.17 1.12 -1.03 -2.79
Tnfrsf1a NM_013091 1.38 -1.45 -1.67 -2.26 :
Cd40lg NM_053353 2.57 1.04 -2.06 -1.38
Tollip XM_341961 1.28 -1.27 -1.45 -2.11
Tnf NM_012675 2.57 1.31 -1.24 1.07
Multiple genes related to inflammatory response were evaluated for expression using real-time PCR via RT2 Profiler™ PCR Array system.
The table lists the genes of interest evaluated and their fold increase or decrease in prostates obtained from TE treated and TE/JMR-132,
TE/MIA-313 and TE/MIA-459 treated rats 42 days after the start of treatment with GHRH antagonists. Data represent fold differences of
individual gene expression between study groups TE and control prostate or TE/JMR-132, TE/MIA-313, TE/MIA-459 and TE. Positive
values mark upregulation of individual genes, while negative values mark downregulation. Three experiments were run for each study
group. The data were evaluated by two-tailed Student's t-test. Boldface depicts significant changes (P<0.05). Table is adapted from Rick et
al. Proc Natl Acad Sci USA (2011) 108:3755-60.

47
Table 11. Expression of genes involved in signal transduction after treatment with TE and
GHRH antagonists JMR-132, MIA-313 and MIA-459 in rat prostates
Gene Accession no.
Fold change
TE vs. Control TE/JMR-132 40µg/day
vs. TE
TE/MIA-313 20µg/day
vs. TE
TE/MIA-459 20µg/day
vs. TE
Bax NM_017059 -1.69 1.65 2.20 1.47
Bcl2 NM_016993 1.45 -1.49 -1.78 -1.20
Bmp2 NM_017178 -1.04 -2.33 -3.12 -6.32
Bmp4 NM_012827 -1.28 -2.87 -3.84 -2.95
Brca1 NM_012514 1.18 -2.68 -3.58 -1.95
Cdh1 NM_031334 1.27 -1.01 -1.10 -1.69
Cdk2 NM_199501 1.10 1.06 -1.28 -1.47
Cdkn1a NM_080782 -1.20 -1.09 1.27 1.40
Cdkn1b NM_031762 -1.28 1.34 1.06 2.23
Csf2 XM_340799 -3.39 1.30 -1.45 -2.95
Cxcl9 NM_145672 -1.95 2.11 2.23 2.91
Egr1 NM_012551 2.20 -1.35 -1.79 1.03
Fas NM_139194 -1.20 -1.43 -1.67 -1.95
Fn1 NM_019143 -1.82 -2.33 -2.06 -1.58
Fos NM_012743 -1.04 -1.89 -2.20 1.27
Hoxa1 NM_013075 1.67 3.20 4.17 2.51
Icam1 NM_012967 -1.28 -1.54 -1.10 -1.69
Igfbp3 NM_012588 -1.82 -2.33 -1.67 -2.39
Ikbkb NM_053355 1.79 1.13 -1.10 -1.28
Il4ra NM_133380 -1.04 -1.43 -1.68 -1.67
Irf1 NM_012591 -1.69 -1.54 -1.67 -1.47
Jun NM_021835 1.92 -1.09 -1.79 -1.69
Junb NM_021836 1.45 -2.03 -1.92 -3.16
Hhip XM_238042 -1.69 -2.05 -2.53 -1.47
Mmp7 NM_012864 -1.38 -3.78 -2.53 -6.77
Nab2 XM_235224 -1.58 -2.03 -1.92 -2.75
Nfκβ1 XM_342346 2.20 -1.34 -1.18 -1.95
Pparg NM_013124 1.10 -4.66 -3.34 -2.39
Ptch1 XM_345570 -1.47 4.23 3.63 2.36
Selp NM_013114 -3.89 -24.59 -17.63 -33.36
Tcf7 XM_343891 1.36 1.60 2.23 1.92
Tp53 NM_030989 -1.56 1.39 -1.10 1.27
Vcam1 NM_012889 -1.58 -2.17 -1.79 -2.04
Wisp1 NM_031716 -3.16 -2.03 -2.53 -2.08
Wnt1 XM_235639 1.27 -1.65 1.15 -1.46
Wnt2 XM_575397 1.36 -2.33 -1.18 -2.23
Multiple genes involved in signal transduction were evaluated for expression using real-time PCR via RT2 Profiler™ PCR Array system.
The table lists the genes of interest evaluated and their fold increase or decrease in prostates obtained from TE treated and TE/JMR-132,
TE/MIA-313 and TE/MIA-459 treated rats 42 days after the start of treatment with GHRH antagonists. Data represent fold differences of
individual gene expression between study groups TE and control prostate or TE/JMR-132, TE/MIA-313, TE/MIA-459 and TE. Positive
values mark upregulation of individual genes, while negative values mark downregulation. Three experiments were run for each study
group. The data were evaluated by two-tailed Student's t-test. Boldface depicts significant changes (P<0.05). Table is adapted from Rick et
al. Proc Natl Acad Sci USA (2011) 108:3755-60.

48
Table 12. Effect of treatment with GHRH antagonists on serum levels of GH, IGF-1, DHT and
PSA in rat
GH (ng/ml) IGF-1 (ng/ml) DHT (pg/ml) PSA (ng/ml)
Day -28 Day 42 Day -28 Day 42 Day -28 Day 42 Day -28 Day 42
Control 43.4 ± 4.1 49.4 ± 3.9 2.9 ± 0.4 3.6 ± 0.3 39.1 ± 6.7 34.2 ± 3.9 2.1 ± 0.5 1.6 ± 0.4
TE 43.8 ± 3.9 104.8 ± 13.4‡ 3.3 ± 0.5 4.9 ± 0.6† 32.1 ± 2.6 337.4 ± 53.5§ 1.5 ± 0.4 2.6 ± 0.5
TE/finasteride
0.1mg/kg/day
45.1 ± 4.3 90.4 ± 12.1 3.3 ± 0.4 5.2 ± 0.5 29.9 ± 3.2 134.1 ± 15.4** 2.9 ± 0.7 3.0 ± 0.6
TE/JMR-132
40µg/day
38.5 ± 3.7 76.9 ± 11.7 3.9 ± 0.4 4.4 ± 0.4 38.1 ± 5.1 225.0 ± 34.5 1.47 ± 0.4 1.8 ± 0.3
TE/MIA-313
20µg/day
40.5 ± 3.5 85.1 ± 9.8 3.7 ± 0.3 4.8 ± 0.5 36.1 ± 5.0 238.3 ± 29.7 1.7 ± 0.3 2.3 ± 0.7
TE/MIA-459
20µg/day
39.0 ± 3.6 79.2 ± 10.4 2.9 ± 0.3 3.9 ± 0.3 37.5 ± 4.6 249.8 ± 28.4 2.3 ± 0.2 4.2 ± 0.3 †P<0.05, ‡P<0.01 and §P<0.001 as compared to Control; **P<0.01 as compared to TE. The data were evaluated by two-tailed Student's t-
test. Table is adapted from Rick et al. Proc Natl Acad Sci USA (2011) 108:3755-60.

49
4.3. Effects of combination of antagonist of LHRH with antagonist of GHRH
on experimental benign prostatic hyperplasia (Study 3).
4.3.1. Expression of GHRH-R, LHRH-R and their ligands
Protein for GHRH, GHRH-R, and protein of SV1 of GHRH-R were shown in rat prostate
(Figure 16A, Table 13). Combinations of GHRH and LHRH antagonists significantly suppressed the
expression of GHRH protein by 53% (P<0.05). The expression of LHRH-R protein and LHRH
protein was also detected. GHRH antagonist JMR-132, LHRH antagonist cetrorelix and the
combination significantly lowered the expression of LHRH protein by 25%, 24% and 22%,
respectively (P<0.05 for all, Figure 16A, Table 13).
Figure 16. Effect of growth hormone-releasing hormone (GHRH) antagonist JMR-132, LHRH antagonist cetrorelix (0.625 mg/kg) and their
combination on the protein expression of GHRH receptor (GHRH-R), its splice variant 1 (SV1), GHRH, luteinizing hormone-releasing hormone receptor (LHRH-R), LHRH, 5α-reductase 2 (5AR2), α1A-adrenoreceptor (α1A-AR), androgen receptor (AR), prostate specific
antigen (PSA) and six-transmembrane epithelial antigen of the prostate (STEAP) by Western blot analysis (A). Representative blots of three
independent experiments are presented and include internal standard β-actin; corresponding signal intensity values are shown in Table 1. Grouping of representative bands for each experimental group was digitally performed. Expression of GHRH receptors (B) and LHRH
receptors (C) in representative ventral prostate of control rats was confined to the cytoplasm and luminal membrane of prostatic acinar cells
(Arrows). Localization of GHRH and LHRH receptors are shown in 20X magnification (scale bars: 50µm). CTR, negative control; TE, testosterone enanthate; FIN, finasteride; JMR, JMR-132; CET, cetrorelix; COM, combination of JMR-132 and cetrorelix.
4.3.2. Immunohistochemical confirmation of the expression of GHRH-R and LHRH-R protein.
Immunohistochemical analyses revealed that expression of both GHRH-R (Figure 16B) and
LHRH-R (Figure 16C) is limited to the cytoplasm and luminal membrane of rat prostatic acinar cells.

50
Table 13. The effect of GHRH antagonist JMR-132, LHRH antagonist cetrorelix and their
combination on the expression of various prostatic proteins in androgen-induced model of BPH
Protein expression as % of TE
Control TE TE/finasteride 0.1 mg/day
TE/JMR-132 40 µg/day
TE/cetrorelix 0.625 mg
TE/JMR-132 and cetrorelix
GHRH-R 54.2 ± 53.2 100.0 ± 34.0 172.9 ± 25.0 152.1 ± 26.6 132.6 ± 41.0 82.6 ± 6.9
SV1 121.2 ± 29.0 100.0 ± 25.1 251.3 ± 9.1 267.0 ± 9.0 99.2 ± 24.6 108.4 ± 10.3
GHRH 85.1 ± 18.7 100.0 ± 14.8 105.7 ± 61.0 86.7 ± 24.7 147.4 ± 21.1 47.3 ± 11.3*
LHRH-R 178.9 ± 28.8 100.0 ± 25.8 123.0 ±31.0 100.2 ± 16.9 83.5 ± 21.8 133.4 ± 32.1
LHRH 74.5 ±35.7 100.0 ±5.3 82.1 ± 17.8 74.9 ± 10.1* 74.0 ± 15.5* 72.7 ± 7.4*
5AR2 84.3 ± 42.1 100.0 ± 9.2 64.3 ± 8.5 34.9 ± 20.2 105.9 ± 34.0 46.6 ± 25.4
Α1A-AR 88.9 ± 1.1 100.0 ± 16.8 83.5 ± 14.8 105.1 ± 11.2 12.0 ± 22.2* 86.9 ± 7.5
AR 26.6 ± 19.1 100.0 ± 16.9† 168.9 ± 19.4 248.2 ± 3.3* 57.8 ± 11.9 70.4 ± 11.2
PSA 249.4 ± 2.9 100.0 ± 23.4‡ 95.3 ± 26.5 106.0 ± 35.8 66.7 ± 29.7 16.6 ± 15.8*
STEAP 100.9 ± 31.1 100.0 ± 6.0 79.6 ± 28.3 26.5 ± 33.0* 60.5 ± 44.4 3.8 ± 17.9*
IL-1b 87.3 ± 59.8 100.0 ± 5.7 156.7 ± 60.2 61.7 ± 19.3 83.8 ± 17.4 43.2 ± 25.0*
NF-kb/p65 78.1 ± 9.4 100.0 ± 10.1 32.9 ± 10.1** 52.4 ± 21.9* 63.2 ± 10.6* 45.6 ± 8.7**
NF-kb/p50 63.7 ± 23.7 100.0 ± 9.4 432.6 ± 17.5* 203.5 ± 14.0 89.9 ± 36.5 170.2 ± 9.3
pNF-kb/p50 97.6 ± 33.5 100.0 ± 6.2 130.2 ± 2.7* 212.3 ± 15.6* 82.5 ± 79.6 59.6 ± 15.3
COX-2 72.9 ± 11.4 100.0 ± 16.4 30.0 ± 13.0* 21.4 ± 6.6* 69.4 ± 5.0 2.6 ± 12.0**
PCNA 78.0 ± 36.9 100.0 ± 33.0 65.2 ± 23.4 52.5 ±32.3 76.2 ± 24.2 42.2 ± 10.2* †P<0.05 and ‡P<0.01 as compared to Control; *P<0.05 and **P<0.01 as compared to TE. The data were evaluated by two-tailed Student's
t-test.
4.3.3. Reduction of prostate size by GHRH antagonist JMR-132, LHRH antagonist cetrorelix and
their combination.
Control prostates weighed 248.0±10.7 mg/100 g rat BW; while in TE controls prostates were
enlarged by 48.2% to 367.5±15.9 mg/100 g rat BW (P<0.001; Figure 17). GHRH antagonist JMR-132
at 40µg/day, LHRH antagonist cetrorelix at 0.625 mg/kg, and their combination significantly lowered
prostate weights by 18.6% (P<0.05), 21.3% (P<0.05) and 30.3% (P<0.01), respectively compared to
TE controls (Fig. 2). This reduction of prostate weight was superior to that obtained with finasteride
0.1 mg/kg/day (nonsignificant 13.8 % reduction; Figure 17). In addition, JMR-132, cetrorelix and
combinations decreased prostatic DNA content by 18.3% (P<0.05), 14.9% (P<0.05) and 34.5%
(P<0.01), respectively (Table 14).
Table 14. Effect of GHRH antagonist JMR-132, LHRH antagonist cetrorelix and their
combination on morphological parameters
Body weight (g) Prostatic DNA content (ng
DNA / mg tissue)
Relative testicle weight
(mg / 100g rat BW)
Day -28 Day 42 Day 42 Day 42
Control 389.5 ± 8.3 548.4 ± 14.8 221.0 ± 10.9 634.9 ± 24.1
TE 393.7 ± 9.5 476.8 ± 12.6† 271.9 ± 7.5 570.2 ± 23.6
TE/finasteride 0.1 mg/kg/day 408.1 ± 9.3 475.2 ± 11.9† 218.2 ± 8.3* 509.7 ± 28.2†
TE/JMR-132 40 µg/day 398.4 ± 8.8 520.3 ± 16.4 222.2 ± 5.1* 538.3 ± 26.3
TE/Cetrorelix 0.625 mg/kg 411.5 ± 10.3 523.7 ± 18.2 231.4 ± 12.5* 521.8 ± 28.9
TE/ Combination 403.2 ± 7.9 537.0 ± 18.5 178.1 ± 7.1** 524.3 ± 21.6 †P<0.05 as compared to Control; *P<0.05 and **P<0.01 as compared to TE. Statistical analysis was performed by one-way ANOVA,
followed by Bonferroni t-test.

51
Figure 17. Effect of TE and treatment with GHRH antagonist JMR-132 (40 µg/day), LHRH antagonist cetrorelix (0.625 mg/kg) and combination of JMR-132 and cetrorelix on relative prostate weight, evaluated 42 days after the start of treatments. Statistical analysis was
performed by one-way ANOVA, followed by Bonferroni t-test. Significant differences are marked by asterisks (*P<0.05, **P<0.01 and
***P<0.001). CTR, negative control; TE, testosterone enanthate; FINA, finasteride; JMR, JMR-132; CETRO, cetrorelix; COMBI, combination of JMR-132 and cetrorelix; ANOVA, analysis of variance.
4.3.4. Effect of GHRH antagonist JMR-132, LHRH antagonist cetrorelix and their combination on
5AR2, α1A-AR, AR, PSA and STEAP.
GHRH antagonist JMR-132 lowered protein levels of 5AR2 (P<0.05, Figure16A). LHRH
antagonist cetrorelix caused a decrease in α1A-AR protein levels (P<0.05). Protein levels of prostatic
AR were significantly increased in TE-induced BPH (P<0.05); among treatments only JMR-132 alone
resulted in a significant increase in AR protein (P<0.01, Fig1A). Prostatic PSA protein was lowered
significantly after TE treatment by 62% compared with control (P<0.01), whereas combination of
GHRH/LHRH antagonists significantly reduced PSA levels by 83% (P<0.05, Figure 16A). Prostatic
STEAP protein expression was significantly decreased by JMR-132 and combination therapy by 74%
(P<0.05) and 96%, (P<0.01), respectively (Figure 16A).
4.3.5. Combination of GHRH and LHRH antagonists suppresses IL-1β, NF-κβ and COX-2
The expression prostatic IL-1β protein was significantly decreased by the combination by
57% (P<0.05, Figure 18A). JMR-132, cetrorelix and combination treatment also significantly lowered
prostatic NF-κβ/p65 protein levels by 48% (P<0.05), 37% (P<0.05) and 54% (P<0.01), respectively
(Figure 18A). Prostatic COX-2 protein was significantly lowered after JMR-132 and combination
treatment by 79% (P<0.05) and 97 % (P<0.01), respectively (Figure 18A).

52
Relative expression of pNF-κβ/p50 markedly decreased after finasteride and combination treatment
(RI 0.06 and 0.07, respectively vs. RI of 0.20 in TE, Figure18B).
Figure 18. Combination of GHRH antagonist JMR-132 and LHRH antagonist cetrorelix suppresses expression of IL-1β, NF-κβ and COX-2
in rat prostates. Western blot analysis (A) of IL-1β, NF-κβ/p65, NF-κβ/p50, phosphorylated NF-κβ/p50 (p NF-κβ/p50) and COX-2. Representative blots of three independent experiments are presented and include internal standard β-actin; corresponding signal intensity
values are shown in Table 1. Grouping of representative bands for each experimental group was digitally performed. Bar graph (B) showing relative expression of phosphorylated NF-κβ/p50. Bars represent average relative intensity values of p NF-κβ/p50. CTR, negative control;
TE, testosterone enanthate; FIN, finasteride; JMR, JMR-132; CET, cetrorelix; COM, combination of JMR-132 and cetrorelix.
4.3.6. GHRH antagonists inhibit cell division and induce apoptosis.
Morphologic evaluation on H&E slides revealed that JMR-132, cetrorelix, their combination
and finasteride significantly decreased the sizes of average epithelial areas in the ventral prostate by
51.4% (P<0.05), 43.8% (P<0.01), 42.2% (P<0.01), and 48.6% (P<0.05) respectively (Table 15). The
number of mitoses was significantly reduced in all groups compared to TE treated BPH controls.
Apoptotic cell numbers were higher in the groups treated with JMR-132, cetrorelix and their
combination and finasteride, but the differences from TE treated controls were not statistically
significant. Representative apoptotic cell is displayed in Figure 19F.
Table 15. Effect of JMR-132, cetrorelix and their combination on cell proliferation and
apoptosis in rat prostatic epithelium
Group Mean epithelial area in
view fields (%)
Number of mitoses in one theoretical
field composed entirely of epithelial
cells
Number of apoptotic cells in one
theoretical field composed
entirely of epithelial cells
Control 21.8 ± 1.7 1.35 ± 0.35 0.89 ± 0.39
TE 31.3 ± 0.6† 1.76 ± 0.13 0.95 ± 0.31
TE/finasteride 0.1mg/kg/day 16.1 ± 2.5* 0.48. ± 0.1* 1.68 ± 0.62
TE/JMR-132 40µg/day 15.2 ± 2.4* 0.29 ± 0.29* 2.14 ± 0.99
TE/Cetrorelix 0.625 mg/kg 17.6 ± 2.3** 0.26 ± 0.15** 2.00 ± 0.58
TE/Combination 18.1 ± 1.8** 0.85 ± 0.18* 2.83 ± 0.86 †P<0.05 as compared to Control; *P<0.05 and **P<0.01 as compared to TE. The data were evaluated by one-way ANOVA followed by
Student-Newman-Keuls test.
No significant changes in prostatic PCNA protein levels occurred after TE treatment. The
combination of GHRH and LHRH antagonists reduced PCNA protein by 58% (P<0.05, Figure 19G).
We observed transcriptional downregulation of Bcl-2 after treatment with JMR-132, cetrorelix, and

53
combination (P<0.05, P<0.05, and P<0.01, respectively, Figure 19 C-E). Bax mRNA expression was
elevated after treatment with finasteride and combination (P<0.05 for all, Figure 19B,E).
Transcriptional suppression of p53 was found after treatment with finasteride, JMR-132, cetrorelix
and combination (P<0.05 for all, Figure 19B-E).
Figure 19. Combination of GHRH antagonist JMR-132 and
LHRH antagonist cetrorelix induces apoptosis and inhibit proliferation of prostatic epithelial cells in rats. Bar graphs (A-
E) showing real-time RT-PCR analysis of Bcl-2, Bax and p53.
Bars represent relative expression of individual genes between prostate samples (n=3) from TE and control groups (A) or
between finasteride (B), JMR-132 (C), cetrorelix (D) or
combination (E) and TE groups. Values > 1.00 mark upregulation of individual genes, while values < 1.00 mark
downregulation. Asterisks indicate a significant difference (*P
< 0.05 and **P<0.01 by Student‟s t-test). Representative apoptotic cell (Arrow) among prostatic acinar epithelial cells of
rat prostate treated with combination treatment is shown (F) in
H&E stained slide (40X; scale bar: 50µm). Western blot analysis (G) of PCNA. Representative blots of three
independent experiments are presented; corresponding signal
intensity values are shown in Table 1. Grouping of representative bands for each experimental group was digitally
performed. CTR, negative control; TE, testosterone enanthate;
FIN, finasteride; JMR, JMR-132; CET, cetrorelix; COM, combination of JMR-132 and cetrorelix.
4.3.7. Effect of JMR-132, cetrorelix and their combination on serum GH, LH, IGF-1, DHT and PSA.
TE increased serum GH by 65% compared to control (P<0.05); while JMR-132, cetrorelix
and their combination caused no significant changes in GH levels as compared to TE (Table 16). No
significant changes in serum IGF-1 levels were observed. In TE-induced BPH rats there was an
approximately 8-fold increase in serum DHT compared to control at day 42 (242.7±41.3 pg/ml
[P<0.001]), however, no significant differences in serum DHT levels were observed after treatment of
JMR-132, cetrorelix and their combination. A significant 57%reduction in DHT was observed after
treatment with finasteride 0.07 mg/day(P<0.05). Combination treatment decreased serum PSA levels
by 41% (P<0.05). Values for serum markers: see Table 16.

54
Table 16. Effect of treatment with JMR-132, cetrorelix and their combination on serum levels of
GH, LH, IGF-1, DHT and PSA in rats
GH (ng/ml) LH (ng/ml) IGF-1 (ng/ml) DHT (pg/ml) PSA (ng/ml)
Day -28 Day 42 Day -28 Day 42 Day -28 Day 42 Day -28 Day 42 Day -28 Day 42
Control 28.5±4.7 34.5±4.8 0.32±0.02 0.34±0.03 3.1±0.3 2.9±0.4 32.2±3.8 29.9±3.2 0.39±0.03 0.54±0.07
TE 33.7±3.8 57.1±8.3† 0.34±0.02 0.21±0.02 2.8±0.4 4.3±0.7 34.4±4.2 242.7±41.3§ 0.51±0.08 0.49±0.11
TE/finasteride
0.1 mg/kg/day
30.5±4.1 50.1±6.7 0.34±0.03 0.23±0.02 3.2±0.2 4.0±0.6 29.5±3.1 103.2±13.8* 0.46±0.04 0.53±0.05
TE/JMR-132
40µg/day
35.1±6.6 45.4±7.1 0.31±0.01 0.27±0.04 3.0±0.4 3.6±0.4 36.1±2.9 179.4±21.4 0.63±0.15 0.47±0.12
TE/Cetrorelix
0.625 mg/kg
31.3±4.8 54.7±5.2 0.36±0.04 0.17±0.02 3.3±0.4 4.1±0.3 39.1±4.8 161.9±22.3 0.55±0.09 0.35±0.06
TE/Combination 36.8±5.3 52.7±6.9 0.33±0.02 0.21±0.03 2.7±0.2 3.8±0.3 33.4±3.7 158.5±24.7 0.48±0.06 0.29±0.04*
†P<0.05 and §P<0.001 as compared to Control; *P<0.05 as compared to TE. The data were evaluated by two-tailed Student's t-test.
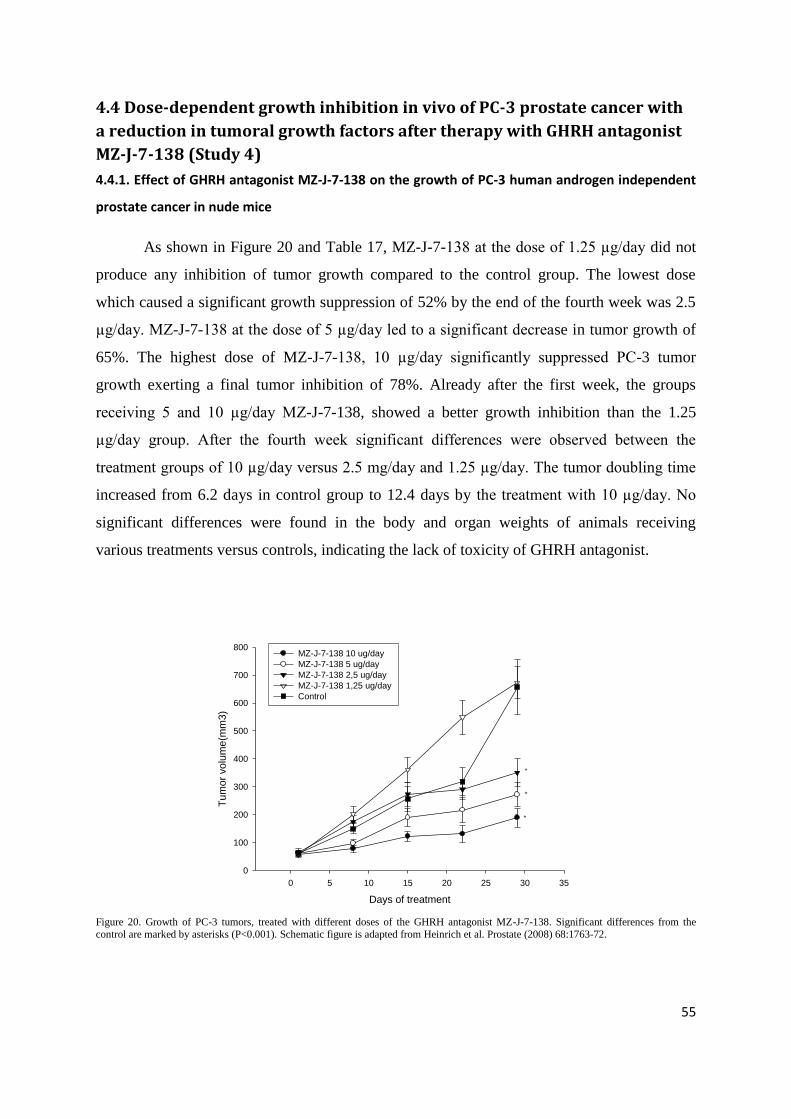
55
4.4 Dose-dependent growth inhibition in vivo of PC-3 prostate cancer with
a reduction in tumoral growth factors after therapy with GHRH antagonist
MZ-J-7-138 (Study 4)
4.4.1. Effect of GHRH antagonist MZ-J-7-138 on the growth of PC-3 human androgen independent
prostate cancer in nude mice
As shown in Figure 20 and Table 17, MZ-J-7-138 at the dose of 1.25 µg/day did not
produce any inhibition of tumor growth compared to the control group. The lowest dose
which caused a significant growth suppression of 52% by the end of the fourth week was 2.5
µg/day. MZ-J-7-138 at the dose of 5 µg/day led to a significant decrease in tumor growth of
65%. The highest dose of MZ-J-7-138, 10 µg/day significantly suppressed PC-3 tumor
growth exerting a final tumor inhibition of 78%. Already after the first week, the groups
receiving 5 and 10 µg/day MZ-J-7-138, showed a better growth inhibition than the 1.25
µg/day group. After the fourth week significant differences were observed between the
treatment groups of 10 µg/day versus 2.5 mg/day and 1.25 µg/day. The tumor doubling time
increased from 6.2 days in control group to 12.4 days by the treatment with 10 µg/day. No
significant differences were found in the body and organ weights of animals receiving
various treatments versus controls, indicating the lack of toxicity of GHRH antagonist.
Days of treatment
0 5 10 15 20 25 30 35
Tum
or
vo
lum
e(m
m3)
0
100
200
300
400
500
600
700
800MZ-J-7-138 10 ug/day
MZ-J-7-138 5 ug/day
MZ-J-7-138 2,5 ug/day
MZ-J-7-138 1,25 ug/day
Control
*
*
*
Figure 20. Growth of PC-3 tumors, treated with different doses of the GHRH antagonist MZ-J-7-138. Significant differences from the
control are marked by asterisks (P<0.001). Schematic figure is adapted from Heinrich et al. Prostate (2008) 68:1763-72.

56
Table 17. Effect of GHRH antagonist MZ-J-7-138 on the Growth of Human PC-3 Androgen
Independent Prostate Cancers in Nude Mice.
Tumor volume (mm3) Tumor volume doubling
time (days)
Tumor weight (mg)
Treatment Initial Final (%inhibition)
Control 62.44±14.63 657.02±99.39 6.18 762.22±271.71
MZ-J-7-138 (1.25 µg/day) 58.78±7.74 672.84±57.07 (0.35%) 6.05 737.50±298.89
MZ-J-7-138 (2.5 µg/day) 62.85±10.07 350.25±26.60 (52%)*† 8.47 710.00±204.95
MZ-J-7-138 (5 µg/day) 61.46±9.42 271,67±44.07 (65%)*† 9.79 592.50±70.59 *
MZ-J-7-138 (10 µg/day) 58.47±7.96 189.37±34.33 (78%)*† 12.39 385.71±53.14 *
*p=<0.001 vs controls; †p=<0.05 vs lower dose step.
4.4.2. Effect of GHRH antagonist MZ-J-7-138 on the expression of IGF-II and VEGF
The treatment with GHRH antagonist MZ-J-7-138 decreased the expression of
tumoral proteins of VEGF and IGF-II (Figs. 21 and 22). Administration of 10 mg/day
induced a significant reduction to 47.3% for IGF-II and to 55% for VEGF versus the control
groups (P<0.05 in both cases). Lower doses of the antagonist caused a smaller reduction in
both proteins (Figs. 21 and 22). VEGF protein levels were reduced to 75% of the control
group by 5 µg/day (P<0.05), to 80% by 2.5 µg/day (NS) and to 82% by 1.25 µg/day (NS).
Treatment with 1.25, 2.5, and 5 mg/day of MZ-J-7-138 reduced tumoral IGF-II protein to
66.8%, 64%, and 57.2% respectively of the control group (NS). Significant differences
between the different doses (10 µg/day vs. 2.5 µg/day and 1.25 µg/day) were seen in the
VEGF expression.

57
Figure 21. Effect of GHRH antagonist MZ-J-7-138 at different doses on the protein levels of tumoral VEGF after 4 weeks of daily
treatment. Significant differences from the control are marked by asterisks (p<0.05). Schematic figure is adapted from Heinrich et al.
Prostate (2008) 68:1763-72.
Figure 22. Effect of GHRH antagonist MZ-J-7-138 at different doses on the protein levels of tumoral IGF-II after 4 weeks of daily
treatment. Significant differences from the control are marked by asterisks (p<0.05). Schematic figure is adapted from Heinrich et al.
Prostate (2008) 68:1763-72.
tumoral IGF-II
Control 1,25µg/day 2,5µg/day 5µg/day 10µg/day
0
500
1000
1500
2000
2500
3000
3500
treatment groups
pg
/mg
pro
tein
*

58
4.4.3. Effect of GHRH antagonist MZ-J-7-138 on the mRNA expression for pGHRH-R, SV1 and GHRH
The presence of mRNA for the SV1 of the GHRH receptor and GHRH ligand in PC-3
tumors was reported previously (136). In this study, using real-time PCR we demonstrated
the presence of mRNA for pituitary type of GHRH receptor pGHRH-R. The reaction
efficiencies for the probes of pGHRH-R, GHRH, and beta-actin were 103.7%, 101.3% and
97.4% respectively. The relative expression of pGHRH-R in PC-3 tumors treated with MZ-J-
7-138 was significantly elevated, being 2.75-fold higher than the control group. Moreover,
real-time PCR also revealed a non-significant downregulation of SV1 receptor and significant
downregulation of GHRH after treatment withGHRH antagonist, the ratios being 0.63 and
0.25, respectively. The results are shown in Table 18.
Table 18. Real-time PCR values of the relative expression of mRNA for pGHRH-R, SV1, and
GHRH in PC-3 tumors after treatment with GHRH antagonist MZ-J-7-138
Control MZ-J-7-138
CT values, mean ± SEM CT values, mean ± SEM Ratio
pGHRH-R 38.18±0.37 36.86±0.25 2.75*
SV1 33.87±0.46 34.66±0.42 0.63
GHRH 36.94±0.30 39.09±0.71 0.25*
β-actin 19.74±0.09 19.88±0.03 -
The ratio represents the gene expression level in the treatment group as compared to the control group. *P<0.05 vs. controls. Table is
adapted from Heinrich et al. Prostate (2008) 68:1763-72.
4.4.4. Binding assays for GHRH receptors in PC-3 tumors
The presence of GHRH receptors was assessed by radioligand binding assays in
control tumors. Binding studies demonstrated the presence of a single class of specific, high
affinity (dissociation constant, Kd = 0.63 ± 0.08 nM) binding sites for GHRH antagonist JV-
1-42 in the membrane preparation of PC-3 tumors with a mean maximal binding capacity
(Bmax) of 178.5 ± 24.7 fmol/mg membrane protein. In competition displacement experiments
on subcutaneously grown PC-3 tumors from the control group, GHRH antagonist MZ-J-7-
138 was able to displace the [125
I]JV-1-42 radioligand with an IC50 = 0.32 nM. This IC50
value indicates a high affinity binding of MZ-J-7-138 to GHRH receptors expressed on PC-3
tumors.

59
4.5. Inhibitory effects of antagonists of growth hormone releasing hormone
on experimental prostate cancers are associated with upregulation of wild-
type p53 and decrease in p21 and mutant p53 proteins (Study 5)
4.5.1. Experiment 1: Effect of GHRH antagonist MZ-J-7-138 on the growth of PC-3 human
androgen independent prostate cancers in nude mice
As shown in Table 19 and Figure 23, treatment with MZ-J-7-138 significantly inhibited PC-3
tumor growth after four weeks of treatment. The final tumor inhibition was 77%, as compared to
controls (p<0.01). This antiproliferative effect is also reflected by final tumor weights (Table 19
indicating a 66% inhibition). The tumor volume doubling time was similarly significantly (p<0.01)
extended by MZ-J-7-138 compared to controls. No significant differences were observed in the body
and organ weights of treated animals versus controls (not shown), indicating that the GHRH antagonist
was not toxic.
Table 19. The effect of GHRH antagonist MZ-J-7-138 on growth of PC-3 and DU-145 androgen
independent prostate cancers xenografted subcutaneously into nude mice
Treatment
Tumor volume (mm3) Tumor volume
doubling time
(days)
Tumor weight (mg)
(% inhibition) Initial final (% inhibition)
Experiment 1: (PC-3)
Control 56.31±10.76 1136.50±351.06 7.3±0.5 1450.9±342.5
MZ-J-7-138 (5μg/day)
56.21±13.34 300.82±65.22** (77%) 11.0±0.9** 489.5±114.1**(66%)
Experiment 2: (DU-145)
Control 32.78±9.08 604.28±145.34 10.6±0.5 727.4±182.2
MZ-J-7-138 (5μg/day)
23.55±4.07 218.58±48.10** (66%) 25.2±4,0 279.4±69.1** (62%)
**p<0.01 vs. Control.

60
Figure 23. Effect of GHRH antagonist MZ-J-7-138 (5μg/day) on growth of subcutaneous PC-3 human androgen independent prostate
cancer xenografted into nude mice. Treatment was started when tumors had grown to about 56mm3 and lasted for 28 days. Bars ± SE.
**p<0.01 vs. controls.
4.5.2. Experiment 2: Effects of GHRH antagonist MZ-J-7-138 on the growth of DU-145
human androgen independent prostate cancers in nude mice
MZ-J-7-138 significantly suppressed the proliferation of s.c. implanted DU-145 xenografts
after 6 weeks of treatment and led to a 66% inhibition of tumor volume (Table 19, Figure 24). This
tumor inhibition is also reflected by tumor weights, which were lower by 62% (p<0.01) in animals
treated with GHRH antagonist MZ-J-7-138 compared to controls. Tumor volume doubling time was
extended from 10.6 to 25.2 days, but that did not reach statistical significance. No significant
differences were observed in the body and organ weights of animals receiving treatment versus
controls, indicating that the GHRH antagonist was not toxic.
4.5.3. Experiment 3: Effects of GHRH antagonist MZ-J-7-138 and LHRH antagonist
Cetrorelix on the growth of MDA-PCa-2b human androgen sensitive prostate cancer in nude
mice
An even greater inhibition of tumor growth than in PC-3 and DU-145 tumors was observed in
mice bearing MDA-PCa-2b cancers that received a combination therapy of MZ-J-7-138 and
Cetrorelix. The inhibition of tumor volume became significant after the first week of treatment
(p<0.05) (not shown) and remained significant until the end of the experiment on day 21. At this point
in time, significant tumor inhibition was found in all treated groups and combined therapy with MZ-J-

61
7-138 and Cetrorelix caused the greatest inhibition (p<0.001) (Figure 25). Final tumor weights of all
treated groups, were also significantly smaller as compared to controls, the combination of MZ-J-7-
138 and Cetrorelix causing the greatest inhibition (not shown). Tumor volume doubling time (TDT)
was also significantly extended in animals treated with Cetrorelix alone (p<0.05) and with
combination of GHRH antagonist and Cetrorelix (p<0.01) as compared to controls (not shown).
Figure 24: Effect of GHRH antagonist MZ-J-7-138 (5μg/day) on growth of subcutaneous DU-145 human androgen independent prostate cancer xenografted into nude mice. Treatment was started when tumors had grown about 28mm3 and lasted for 42 days. Bars ± SE. *p<0.05 vs controls,
**p<0.01 vs. controls.
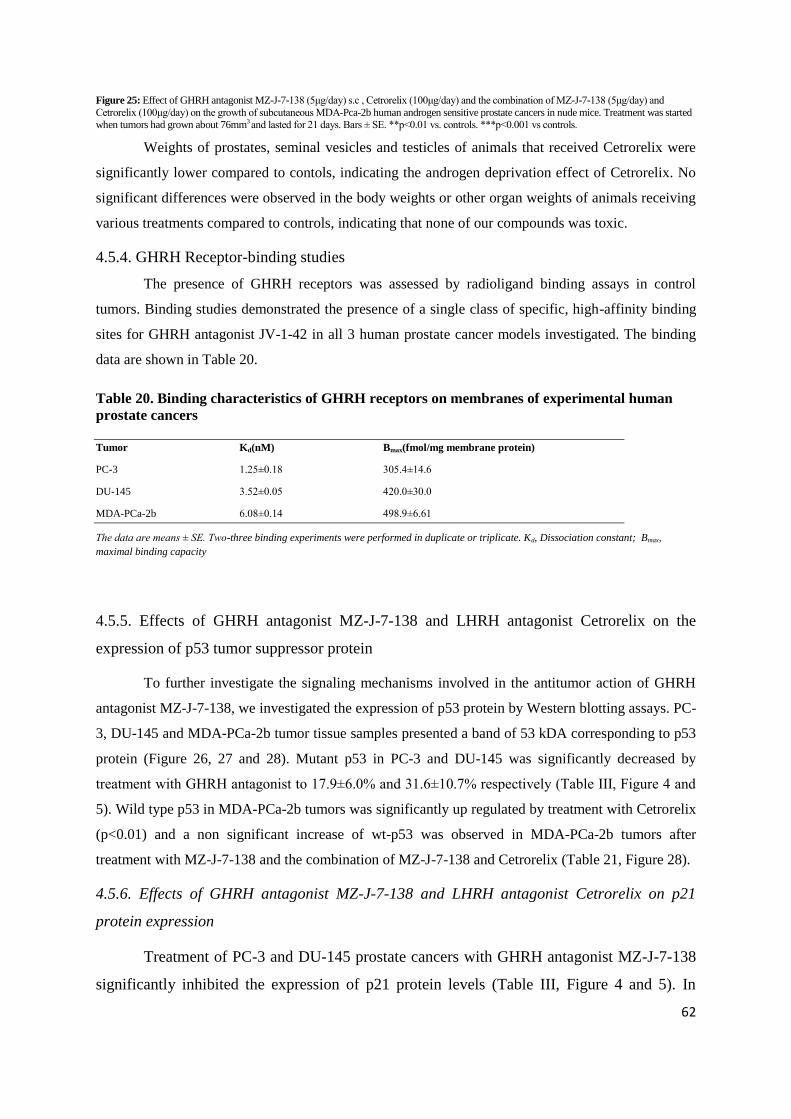
62
Figure 25: Effect of GHRH antagonist MZ-J-7-138 (5μg/day) s.c , Cetrorelix (100μg/day) and the combination of MZ-J-7-138 (5μg/day) and
Cetrorelix (100μg/day) on the growth of subcutaneous MDA-Pca-2b human androgen sensitive prostate cancers in nude mice. Treatment was started
when tumors had grown about 76mm3 and lasted for 21 days. Bars ± SE. **p<0.01 vs. controls. ***p<0.001 vs controls.
Weights of prostates, seminal vesicles and testicles of animals that received Cetrorelix were
significantly lower compared to contols, indicating the androgen deprivation effect of Cetrorelix. No
significant differences were observed in the body weights or other organ weights of animals receiving
various treatments compared to controls, indicating that none of our compounds was toxic.
4.5.4. GHRH Receptor-binding studies
The presence of GHRH receptors was assessed by radioligand binding assays in control
tumors. Binding studies demonstrated the presence of a single class of specific, high-affinity binding
sites for GHRH antagonist JV-1-42 in all 3 human prostate cancer models investigated. The binding
data are shown in Table 20.
Table 20. Binding characteristics of GHRH receptors on membranes of experimental human
prostate cancers
Tumor Kd(nM) Bmax(fmol/mg membrane protein)
PC-3 1.25±0.18 305.4±14.6
DU-145 3.52±0.05 420.0±30.0
MDA-PCa-2b 6.08±0.14 498.9±6.61
The data are means ± SE. Two-three binding experiments were performed in duplicate or triplicate. Kd, Dissociation constant; Bmax,
maximal binding capacity
4.5.5. Effects of GHRH antagonist MZ-J-7-138 and LHRH antagonist Cetrorelix on the
expression of p53 tumor suppressor protein
To further investigate the signaling mechanisms involved in the antitumor action of GHRH
antagonist MZ-J-7-138, we investigated the expression of p53 protein by Western blotting assays. PC-
3, DU-145 and MDA-PCa-2b tumor tissue samples presented a band of 53 kDA corresponding to p53
protein (Figure 26, 27 and 28). Mutant p53 in PC-3 and DU-145 was significantly decreased by
treatment with GHRH antagonist to 17.9±6.0% and 31.6±10.7% respectively (Table III, Figure 4 and
5). Wild type p53 in MDA-PCa-2b tumors was significantly up regulated by treatment with Cetrorelix
(p<0.01) and a non significant increase of wt-p53 was observed in MDA-PCa-2b tumors after
treatment with MZ-J-7-138 and the combination of MZ-J-7-138 and Cetrorelix (Table 21, Figure 28).
4.5.6. Effects of GHRH antagonist MZ-J-7-138 and LHRH antagonist Cetrorelix on p21
protein expression
Treatment of PC-3 and DU-145 prostate cancers with GHRH antagonist MZ-J-7-138
significantly inhibited the expression of p21 protein levels (Table III, Figure 4 and 5). In

63
MDA-PCa-2b tumors treated with the same GHRH antagonist or Cetrorelix, the decrease in
p21 protein expression did not reach statistical significance as compared to controls due to
the high standard error (Table 21, Figure 28b).
Figure 26. Effect of GHRH antagonist MZ-J-7-138
(5μg/day) s.c on the expression of mutant p53 and p21
protein expression in PC-3 tumors grown in nude mice. a)
Western blot representative samples are shown lane 1-3,
controls; lane 4-6, samples treated with MZ-J-7-138; b) bar
chart for p53 mutant protein and p21 protein expression:
Bars ± SE. *p<0.05 vs controls, ***p<0.001 vs. controls.

64
Figure 27. Effect of GHRH antagonist MZ-J-7-138
(5μg/day) s.c on the expression of mutant p53 and p21
protein in DU-145 tumors. a) Western blot: lane 1-3,
controls; lane 4-6, samples treated with MZ-J-7-138, ; b) bar
chart for p53 mutant protein and p21 protein expression. Bars
± SE. **p<0.01 vs. controls, ***p<0.001 vs controls.

65
Figure 28. Effect of GHRH antagonist MZ-J-
7-138 (5μg/day) s.c , Cetrorelix (100μg/day)
and the combination of MZ-J-7-138 (5μg/day)
and Cetrorelix (100μg/day) on the protein
expression of wt p53 and p21 in MDA-PCa-2b
human androgen independent prostate cancer
grown in nude mice.
a) Western blot: lanes 1-3 controls, lane 4-6
samples treated with Cetrorelix, lanes 7-9
samples treated with MZ-J-7-138, lane 10-12
samples treated with a combination of
Cetrorelix and MZ-J-7-138. *p<0.05,
**p<0.01. b) Bar chart for p53 mutant protein and
p21 protein expression: Bars ± SE. **p<0.01 vs.
controls.

66
Table 21. The effect of GHRH antagonist MZ-J-7-138, Cetrorelix and their combination on the
protein expression of p53 and p21 in PC-3, DU-145 androgen independent and MDA-PCa-2b
androgen sensitive prostate cancers xenografted into nude mice
PC-3 protein expression in % of controls
DU-145 protein expression in % of controls
MDA-PCa-2b protein expression in % of controls
p53
Control:
MZ-J-7-138:
Cetrorelix:
MZ-J-7-138 and Cetrorelix
100.0±27.1
(mt) 17.9±6.0*
n.i. n.i.
100.0±21.6
(mt) 31.6±10.7*
n.i. n.i.
100.0±8.6
(wt) 123.0±11.8
(wt) 172.9±17.8** (wt) 152.9±23.3
p21
Control: MZ-J-7-138:
Cetrorelix:
MZ-J-7-138 and Cetrorelix
100.0±16.0 37.9±17.3*
n.i.
n.i.
100.0±5.9 44.4±6,2***
n.i.
n.i.
100.0±20.6 61.9±10.3
58.2±15.2
45.8±15.7
*P<0.05, **P<0.01 and ***P<0.001 vs controls; n.i.-not investigated

67
5. Discussion
5.1. Effects of LHRH antagonist cetrorelix on experimental benign prostatic
hyperplasia (Study 1)
Clinical data have demonstrated that therapy with LHRH antagonist Cetrorelix resulted in
long-lasting improvement in LUTS (55,56,58). This improvement, including reduction in prostate
volume and increase in urinary peak flow rate, appears to be superior to that produced by α-blockers
or 5α-reductase inhibitors(57). Low doses of Cetrorelix used in recent clinical trials cause only a
partial suppression of pituitary-gonadal axis and testosterone levels.
In the present study, we have shown that Cetrorelix significantly reduced prostate weights by
18% in non-castrating doses of 0.625 mg/kg (59). Histological observations in our rat model of BPH
revealed marked hyperplastic morphological changes in the prostates of testosterone-treated BPH
animals, while treatment with a low dose of Cetrorelix (0.625 mg/kg) caused an involution of these
hyperplastic changes resulting in a morphology similar to that of normal animals. Although
inflammation is not a main characteristic of the BPH model used in this study, we also observed
incidental inflammatory infiltrates in all experimental groups.
The presence of LHRH and LHRH-R in rat prostate was demonstrated by real-time PCR and
Western blot. Furthermore, ligand competition assay detected specific high affinity receptors for
LHRH in rat prostate. Cetrorelix 0.625 mg/kg significantly lowered prostatic AR and 5α-reductase 2
levels, however, serum DHT and LH were only slightly decreased. Changes in serum PSA were not
significant after treatment with Cetrorelix at 0.625 mg/kg. Moreover, the expression of LHRH and
LHRH-R and direct antiproliferative effects of LHRH and its analogs have been demonstrated in
many malignant human tumors (61,62,137). Recently we showed that Cetrorelix inhibits the
proliferation of human prostate epithelial BPH-1 cell line in vitro (66). These findings suggest that
low doses of Cetrorelix did not impair gonadal function in rats as was also shown by experimental
(59) and clinical findings (55-58). Prostate shrinkage is a result of direct inhibitory effects of
Cetrorelix exerted through prostatic LHRH receptors, implies the presence of an LHRH-based
autocrine regulatory system.
Herein, we used real-time PCR arrays to investigate the beneficial molecular mechanisms of
Cetrorelix in a BPH-model. The analyses showed several proinflammatory pathways and growth
factors were upregulated in control animals with induced BPH and markedly downregulated in
Cetrorelix-treated animals. Verifying PCR array results and more precisely determining changes in
gene expression, we studied the expression of selected proinflammatory and growth factor encoding
genes by real-time RT-PCR. Of the 11 genes analyzed, nine (IGF-1, EGF, TGF-β1 and-β2, FGF-2,
FGF-7, VEGF-A, IL-1β and IL-6) showed the same change pattern as in the PCR arrays, i.e.

68
upregulation after TE treatment and downregulation after Cetrorelix. These insulin-like, transforming
and fibroblast growth factors and downstream effector molecules as well as a variety of interleukins,
can lead to abnormal stromal and epithelial prostate cell growth (21,37,40).
Our observation of the transcriptional activation of inflammatory chemokine ligands (e.g., C5,
CCL25 and CXCL2) and interleukins (e.g., IL-3, IL-5, IL-6, IL-13, IL-15 and IL-17) in the prostate of
rats with induced BPH is consistent with clinical findings (138) and with experimental findings in rats
(139). Chemokines promote neutrophil recruitment and T-lymphocyte infiltration and the subsequent
progression of the inflammation associated with BPH. We found that Cetrorelix significantly lowered
transcriptional expression of several chemokines including C5 and CCL25.
Low doses of Cetrorelix caused a marked reduction in cytokine mRNA levels for IFN-γ, IL-
1α, IL-3, IL-4, IL-5, IL-6, IL-13, IL-15 and IL-17. These cytokines are part of an inflammatory
network in BPH including several growth factors (20,38,140). IFN-γ,produced by infiltrating T-cells,
is a natural antagonist of growth inhibiting TGF-β; FGF-2 stimulates growth (37). IFN-γ also
stimulates IL-15, thereby augmenting increased influx of T-lymphocytes (41). These T-cells further
produce lymphokines such as IL-4 and IL-13, facilitating formation of active androgens and estrogens
by inducing 3β-hydroxydehydrogenase/isomerase. T-cell derived IL-17 fine tunes immune response,
stimulating IL-6, IL-8 and IL-1α and β (38,40-42).
In summary, our wide-range analysis of gene expression in the prostate of rats with
testosterone-induced BPH revealed the transcriptional activation of several genes including those for
proinflammatory interleukins, chemokines and prostatic growth factors. The expression of these genes
was suppressed in Cetrorelix-treated animals. These findings suggest that Cetrorelix exerts its
beneficial effects on BPH by suppressing proinflammatory cytokines and growth factors at the
transcriptional level.
The results of this study indicate that the reduction in prostate volume could be due to direct
inhibitory effects of Cetrorelix exerted through prostatic LHRH receptors as well as transcriptional
suppression of proinflammatory cytokines and growth factors. These findings shed light on the
mechanism of action of LHRH antagonists in BPH and also suggest a role for LHRH as a locally
acting growth factor in BPH. It is possible that LHRH antagonists could be clinically used for therapy
of BPH in combination with other agents.
5.2. Effects of GHRH antagonists on experimental benign prostatic
hyperplasia (Study 2) The main finding of our study is that GHRH antagonists JMR-132, MIA-313 and MIA-459
reduce prostate size in an experimental model of BPH. In addition to prostate shrinkage in rats,

69
multiple factors related to growth and inflammation, which are crucial in the pathogenesis and
progression of BPH (21), were markedly reduced by treatment with GHRH antagonists. The
expression of GHRH, GHRH-R and its splice variant SV1 in rat prostate was demonstrated by
Western blot. The antibody used to detect GHRH receptors identifies both pituitary type GHRH-R
and its splice variant SV1 (141). Furthermore, ligand competition assay detected specific high affinity
receptors for GHRH in rat prostate and immunohistochemical analyses revealed that this expression
of GHRH-R is confined to luminal epithelial cells of the rat prostate. Changes in serum GH, IGF-1,
DHT, and PSA were not significant after treatment with GHRH antagonists. Recently we showed that
GHRH antagonists inhibit the proliferation of human prostate epithelial BPH-1 cell line in vitro
(76).These findings strongly suggest that prostate shrinkage is a result of direct inhibitory effects of
GHRH antagonists exerted through prostatic GHRH receptors, not involving the GH/IGF-1 axis. The
demonstration of the co-expression of GHRH and its receptors in rat prostate supports the hypothesis
that GHRH produced locally in the prostate could act in an autocrine/paracrine manner through an
interaction with the GHRH receptors (72). The presence of this pathway, which is disrupted by
GHRH antagonists, provides a mechanistic explanation for the antiproliferative effects of such
antagonists in prostate cell growth in culture (76) and in nude mice xenograft models of prostate
cancer (67,73,74). Our data also imply that GHRH could be involved in the pathogenesis of BPH.
Herein, we used real-time PCR arrays to investigate the beneficial molecular mechanisms of
GHRH antagonists in a BPH-model. The analyses showed that several growth factors were
upregulated in TE-induced BPH control rats and markedly downregulated in animals treated with
GHRH antagonists. Growth factors are regulatory peptides that govern the response of cells to injury
and mediate the highly coordinated processes of cell growth, differentiation, and apoptosis. Among
them there are many polypeptides which use autocrine or paracrine pathways to signal stromal and
epithelial cells in the microenvironment (21). Verifying PCR array results and more precisely
determining changes in gene expression, we studied the expression of selected growth factor and
proinflammatory encoding genes by real-time RT-PCR. We confirmed that GHRH antagonists
suppress transcriptional expression of IGF-2, TGF-α, TGF-β1 and-β2, EGF, FGF-2, VEGF-A and IL-
1β. Several of these growth factors were reported to be involved in the pathogenesis of BPH: EGF and
TGF-α (EGF family); FGF-2, FGF-7and FGF-9 (FGF family); IGF-1and IGF-2 (IGF family); TGF-
β1and TGF-β2 (TGF-β family) and VEGF (VEGF family) (21).
Our observation of the transcriptional activation of inflammatory cytokines (e.g. Ccl6, Ccl12,
IL-1α, IL-1β, IL-13, IL-15 and IL-17β) in the prostate of rats with induced BPH is consistent with
clinical findings (138) and with experimental findings in rats (139). We found that GHRH antagonists
significantly lowered transcriptional expression of several cytokines including IL-1α, IL-1β, IL-13,
IL-15 and IL-17β. These cytokines are part of an inflammatory network in BPH including several

70
growth factors (20); they promote T-lymphocyte infiltration and the subsequent inflammation
progression associated with BPH (42).
We showed that treatment with TE results in elevated levels of IL-1β, NF-κβ and COX-2
protein in the rat prostate, while GHRH antagonists JMR-132, MIA-313, and MIA-459 caused a
pronounced comparative decrease in IL-1β, NF-κβ and COX-2 protein levels. Vykhovanets et al
recently demonstrated that IL-1β, an inflammatory cytokine, causes NF-κβ activation in the mouse
prostate (142). The NF- κβ family proteins, like NF-κβ/p65 (RelA) are inducible transcription factors
that regulate the expression of hundreds of genes in immune response, angiogenesis, cell adhesion,
proliferation, differentiation, and apoptosis. The activation of NF-κβ is one of the earliest events in
chronic inflammation (143). COX-2, an inducible isoform of cyclooxygenase enzyme, is an early
response gene upregulated by specific stimuli such as mitogens, growth factors, and a variety of
cytokines including IL-1 (144). Expression of COX-2, and COX-2-dependent prostanoid production
induced by proinflammatory mediators are predominantly regulated by NF- κβ dependent gene
transcription (145), suggesting a causal relationship between the lowered NF- κβ/p65 levels,
inhibition of COX-2 upregulation and decreased IL-1β production caused by GHRH antagonists.
Overexpression of COX-2 in human BPH samples was reported (146), while GHRH antagonists were
shown to lower levels of COX-2 in experimental lung cancer (147) and prostate cancer (75).COX-2
was also shown to upregulate anti-apoptotic Bcl-2 with an associated decrease in apoptosis in prostate
tissue (148).
All three GHRH antagonists were demonstrated to inhibit cell proliferation, elevate tumor
suppressor p53, and lower PCNA levels in rat prostatic epithelium. We observed an increased
expression of anti-apoptotic Bcl-2 in TE-induced BPH prostates. This overexpression of Bcl-2
corresponds to observations of Alonso-Magdalena et al (17) in human BPH samples, which suggest
that BPH is not a proliferative disease, but rather an accumulation of cells resistant to death. Our work
shows that treatment with GHRH antagonists causes significant translational upregulation of
proapoptotic Bax and suppression of anti-apoptotic Bcl-2 in rat prostates. The number of apoptotic
cells in prostatic epithelium after GHRH antagonists was also decreased, although this decrease was
not statistically significant. These propapoptotic effects of GHRH antagonists might be due to the
significant suppression of prostatic COX-2 or to inhibition of both intrinsic and extrinsic pathways of
p53 mediated apoptosis (149).
Analyzing transcriptional changes in signal transduction pathways with quantitative PCR
arrays, we observed the involvement of the mitogenic, hedgehog, PI3/AKT and phospholipase C
pathways and their downstream effectors.These may be responsible for transmitting beneficial effects

71
of GHRH antagonists in experimental BPH. GHRH antagonists can strongly inhibit the proliferation
rate of cancer cells through the inhibition of the MAPKs pathway (150).
Therapeutic effects of GHRH antagonists were superior to that of finasteride in many aspects
of our study including prostatic shrinkage, suppression of growth factors and proinflammatory COX-
2, as well as antiproliferative and proapoptotic effects. The adverse effects of finasteride may
inculpate GHRH antagonists as an alternative medical therapy of BPH.
In summary, herein we demonstrated that GHRH antagonists JMR-132, MIA-313, and MIA-
459 reduce prostate volume in an experimental BPH model. Our data suggest that this reduction in
prostate volume is due to direct inhibitory effects of GHRH antagonists exerted through prostatic
GHRH receptors as well as through transcriptional suppression of enumerated growth factors and
proinflammatory cytokines. We also showed strong inhibition of proinflammatory IL-1β, NF-κβ, and
COX-2. Antiapoptotic effects of these GHRH antagonists have also been demonstrated. These
findings suggest mechanisms of action of GHRH antagonists in BPH and also indicate a role for
GHRH as a locally acting growth factor in BPH. It is possible that GHRH antagonists could be
clinically useful for therapy of BPH alone or in combination with other agents.
5.3. Effects of combination of antagonist of LHRH with antagonist of GHRH
on experimental benign prostatic hyperplasia (Study 3).
Our study shows that the combination of GHRH antagonist JMR-132 with LHRH antagonist
cetrorelix augments prostate shrinkage and reduction in cellular content in experimental BPH.
Similarly, multiple functional molecules potentially related to pathogenesis and progression of BPH,
were markedly reduced by treatment with GHRH antagonist.
Immunohistochemical analyses revealed that this expression of GHRH-R and LHRH-R is
confined to luminal epithelial cells. The expression of GHRH, LHRH and their receptors in rat
prostate was demonstrated by Western blot. Previously, we reported that ligand competition assay
detected specific high-affinity receptors for GHRH and LHRH in rat prostate (117,129). Serum GH,
LH, IGF1, and DHT were not significantly affected by treatment with combination of GHRH and
LHRH antagonist. Prostatic and serum PSA, a well-known tumor marker markedly declined after
combination treatment. Levels of STEAP, a cell surface antigen expressed predominantly in prostate
cancer (151) and a potential target for immunotherapy in various solid tumors (152), were radically
lowered after combination treatment.
Recently we showed that antagonists of GHRH and LHRH inhibit the proliferation of the
human prostate epithelial BPH-1 cell line in vitro (66,76). These findings strongly suggest that
prostate shrinkage is a result of direct inhibitory effects of GHRH and LHRH antagonists exerted

72
through their prostatic receptors, not involving the hypothalamic-pituitary axis. The demonstration of
co-expression of GHRH-R or LHRH-R and their ligands in rat prostate supports the view that
prostatic GHRH and LHRH could act in an autocrine/paracrine manner through interaction these
receptors (72). This pathway, which is disrupted by antagonists of GHRH and LHRH, provides a
mechanistic explanation for the antiproliferative effects of these antagonists on prostate cell growth in
culture and in nude mouse xenograft models (67,74,153). Our data also imply that GHRH and LHRH
could be involved in the pathogenesis of BPH.
We demonstrated that combination of JMR-132 and cetrorelix caused a pronounced decrease
in IL-1β, NF-κβ/p65, and COX-2 protein levels and decreased phosphorylation of NF-κβ/p50. A
recent report confirmed that IL-1β, an inflammatory cytokine, causes NF-κβ activation in mouse
prostate (142). The NF-κβ family proteins are inducible transcription factors that control the
expression of multiple genes of immune response, angiogenesis, cell adhesion, proliferation,
differentiation, and apoptosis. The activation of NF-κβ is one of the initial events in chronic
inflammation (143). COX-2, an inducible isoform of the cyclooxygenase enzyme, is an early-response
gene, up-regulated by specific stimuli such as mitogens, growth factors, and many cytokines including
IL-1 (144). Expression of COX-2 and COX-2–dependent prostanoid production induced by
proinflammatory mediators is regulated predominantly by NF-κβ–dependent gene transcription (145),
indicating an underlying relationship between the lowered NF-κβ levels, inhibition of COX-2 up-
regulation, and decreased IL-1β production caused by combination of GHRH and LHRH antagonists.
Overexpression of COX-2 in human BPH samples was reported (146); GHRH antagonists were
shown to lower levels of COX-2 in experimental lung cancer (147) and prostate cancer (75). COX-2
was also shown to upregulate antiapoptotic Bcl-2 with an associated decrease in prostatic apoptosis
(148).
Our study showed that combination treatment markedly decreases the sizes of average
epithelial areas in ventral prostate, prostatic DNA content and protein levels of proliferation marker
PCNA. Significant transcriptional downregulation of anti-apoptotic Bcl-2, and upregulation of pro-
apoptotic Bax were observed.
The therapeutic effects of JMR-132 and cetrorelix combination were superior to those of
finasteride on prostatic shrinkage and suppression of PSA, STEAP, IL-1β and COX-2 and so were its
antiproliferative and proapoptotic effects. The adverse effects of finasteride may support the use of
combination of GHRH and LHRH antagonists as an alternative medical therapy for BPH.
This study shows that combination of GHRH antagonist with LHRH antagonist potentiates
reduction in prostate volume in an experimental BPH model. Our data indicate that shrinkage of
prostate is induced by direct inhibitory action of GHRH and LHRH antagonists exerted through

73
prostatic receptors as well as by strong suppression of PSA, STEAP, IL-1β, NF-κβ, and COX-2.
Proapoptotic and antiproliferative effects of combination therapy were also demonstrated. Our
findings shed light on the mechanisms of action of combinations of GHRH plus LHRH antagonists
and also imply that GHRH and LHRH may serve as a local growth factor in BPH. Our study suggests
that GHRH antagonists should be considered for further development of a therapy for BPH, possibly
in combination with LHRH antagonists.
5.4. Dose-dependent growth inhibition in vivo of PC-3 prostate cancer with
a reduction in tumoral growth factors after therapy with GHRH antagonist
MZ-J-7-138 (Study 4)
Treatment of relapsed androgen-independent prostate cancer remains a major challenge
(77,78,80,82). New therapeutic modalities are being developed based on antagonists of LHRH,
GHRH and targeted cytotoxic peptide analogs (61,67,154). Polypeptide growth factors such as
GHRH, gastrin-releasing peptide, IGF-I and -II, VEGF, bFGF, EGF, and their receptors are widely
expressed in prostate cancer (67,72,77,90,134,136,155-159). Some of these growth factors aberrantly
stimulate the androgen receptor pathway (80,157,160) and contribute to the androgen-independent
growth of prostate cancer cells. The involvement of GHRH in the growth of various human
neoplasms prompted the development of GHRH antagonists for the endocrine therapy of these
cancers (67,77,82,84). GHRH antagonists can inhibit the growth of various human experimental
prostate cancers indirectly by reducing pituitary GH and hepatic IGF-I secretion and directly by
blocking tumoral GHRH receptors and decreasing tumoral IGF-I and –II (67,73,84,136,154).
The PC-3 tumor model represents an advanced stage androgen independent prostate cancer
and has been extensively utilized in our previous investigations for the assessment of antitumor
effects of less potent GHRH antagonists such as MZ-4-71, MZ-5-156, JV-1- 38, MZ-J-7-118 (77,86-
88,92,93,161). In the present study we used the latest and most potent GHRH antagonist MZ-J-7-138
developed very recently. Our results indicate that the minimum effective dose of GHRH antagonist
MZ-J-7-138 is 2.5 µg/day for the inhibition of PC-3 cancers in nude mice, and a clear relationship of
dose-dependent tumor inhibition is observed in the dose range of 2.5–10 µg/day. This pattern of dose–
response relationship where greater inhibition of tumor growth is observed with higher doses of
GHRH antagonist represents an advantage compared to some of the other peptide hormones used in
cancer treatment. By comparison, several studies found that the response of cells to exposure of
somatostatin analog octreotide produces a biphasic dose–response curve, implying that overdosing or
underdosing of somatostatin analogs may result in suboptimal antitumor activity (162). The present
study and previous work also indicates that MZ-J-7-138 and otherGHRHantagonists are devoidof
toxic side-effects and have an extremely broad therapeutic window(67). Thus, here we obtained
significant inhibition of PC-3 tumor growth with 2.5 µg/day of MZ-J-7-138, but in other studies in

74
nude mice, this antagonist was used at a 32-fold higher dose level of 2 x 40 µg/day, without any
visible side-effects or toxicity (163).
Table 3. Comparative effects of various GHRH antagonists on the growth of human PC-3 and
DU-145 androgen independent and MDA-PCa-2b androgen-sensitive prostate cancers in nude
mice.
PC-3 tumors xenografted s.c. into nude mice
GHRH antagonist
(Reference No.)
Dose
(Reference No.)
Inhibition of
tumor
volume
Other human prostate cancers xenografted s.c. into nude mice
MZ-4-71 (92) 2 x 20 μg/day 70% ** DU-145 (92): MZ-4-71 (2x20 μg/day) significantly inhibited tumor
volumes by 81% (**). MZ-5-156a (86) 20 μg/daya (Exp. 1) 53% n.s.a DU-145 (91): MZ-5-156 (2x20 μg/day) significantly inhibited tumor
volumes by 57% (*). JV-1-38 (86)
JV-1-38 (87)
JV-1-38b (93)
20 μg/daya (Exp. 1)
20 μg/day (Exp. 2)
20 μg/day
10 μg/dayb
65% *a
65% *
49% **
0% n.s.b
DU-145 (73): JV-1-38 (20 μg/day) significantly inhibited tumor volumes by 57% (*).
MDA-PCa-2b (73) : JV-1-38 (20 μg/day) did not inhibit tumor volumes.
MDA-PCa-2b (164): In two separate experiments
JV-1-38 (20 μg/day) did not significantly affect tumor volumes.
MZ-J-7-114b (93) 5 μg/dayb
43% *b
MZ-J-7-118 (161)
MZ-J-7-118 (88)
5 μg/day
5 μg/day
56% *
65% *
DU-145 (88): MZ-J-7-118, at 2.5 μg/day and 5 μg/day, inhibited tumor volumes by 67% (*) and 82% (*), respectively.
MDA-PCa-2b (153): MZ-J-7-118 (5 μg/day) slightly inhibited tumor
volumes by 24% (n.s.). MZ-J-7-138
(present study)
2.5 μg/day
5 μg/day
10 μg/day
52% ***
65% ***
78% ***
MDA-PCa-2b (153): MZ-J-7-138 (5 μg/day) significantly inhibited tumor
volumes by 50% (**).
aGHRH antagonists MZ-5-156 and JV-1-38 directly compared in the same experiment. bJV-1-38 and MZ-J-7-114 directly compared in the
same experiment. Accurate comparisons of the potencies of GHRH antagonists are only possible when they are used in the same
experiment. Nevertheless, inhibitory results obtained in different experiments are helpful for a rough estimation of the order of potencies
and effective doses of various antagonists. *p<0.05 vs. controls; **p<0.01 vs. controls; ***p<0.001 vs. controls; n.s., not significant. Table
is adapted from Heinrich et al. Prostate (2008) 68:1763-72.
A comparison between the effects of MZ-J-7-138 and older antagonists on the growth of
various human prostate cancers in nude mice is given in Table 22. Collectively, the data presented in
Table 22 indicate that potent such as MZ-J-7-118 and MZ-J-7- 138 are effective against androgen-
independent prostate cancers PC-3 and DU-145 at doses 8- to 16-fold lower than early GHRH
antagonists MZ-4-71 and MZ-5-156 that had to be used at doses of up to 2 x 20 µg/day to inhibit
tumor growth. In addition, MZ-J-7-138 is the first GHRH antagonist that was effective alone as a
therapeutic agent for the treatment of MDA-PCa-2b human androgen-sensitive prostate cancers in
nude mice (153). Thus, MZ-J-7-138 at a dose of 5 µg/day inhibited the growth of MDA-PCa-2b
tumors to a similar degree as LHRH antagonist Cetrorelix at a dose of 100 µg/day (153). Earlier
antagonists such as JV-1-38 or MZ-J-7-118 were not effective when used alone against MDA-PCa-2b
cancers, although in combination with androgen deprivation therapies such as LHRH antagonist
Cetrorelix they enhanced the antitumor effects of the latter agents (73,153,164). Recently, we also

75
performed experiments to directly compare the effects of MZ-J-7-138 with other highly potent GHRH
antagonists including MZ-J-7-118. In these studies, we found that MZ-J-7-138 more potently
inhibited the growth of PC-3 cancers in vivo and showed an increased binding affinity to the GHRH
receptors on PC-3 tumor membranes, as compared to other antagonists tested (Zarandi M, Schally
AV, Varga JL et al., unpublished data).
The present data allow an extrapolation from the doses effective in nude mice to the doses
recommended for clinical trials, based on extensive preclinical (nude mice) and clinical data available
with other classes of peptide drugs for cancer, such as somatostatin analogs, and agonists and
antagonists of LHRH. In the nude mouse model, GHRH antagonist MZ-J-7-138 is effective at much
lower doses (2.5–5 µg/day) against androgen-independent PC-3 and androgen-sensitive MDA-PCa-2b
prostate cancers than other types of peptide drugs that are already in clinical use or showed efficacy in
clinical trials. Thus, somatostatin analog RC-160 (Vapreotide) inhibited the growth of PC-3 prostate
cancers in nude mice at 100 µg/day, but was ineffective at the lower dose of 50 µg/day (87,165).
Likewise,LHRH agonist triptorelin (Decapeptyl), and LHRH antagonist SB-75 (cetrotide, Cetrorelix)
need to be used in a dose range of 50–100 µg/day for a significant inhibitory effect on the growth of
MDA-PCa-2b androgensensitive tumors in nude mice (153,164). Thus, GHRH antagonist MZ-J-7-
138 is effective against prostate cancers in nude mice at dose levels that are 10–40 times lower than
those of the mentioned somatostatin and LHRH analogs. For the clinical therapy of prostate cancer,
Decapeptyl is used at a dose of 0.125 mg/day (3.75 mg/month), Cetrorelix showed clinical efficacy at
a dose of 2 x 0.5 mg/day, and Vapreotide produced clinical responses in patients with advanced
prostate cancer at a dose of 3 x 1 mg/day (55,61,62,166,167). Thus, supposing that GHRH antagonists
will be active in human cancer therapy at dose levels 10–40 times lower than these analogs of
somatostatin and LHRH, the clinically effective doses of GHRH antagonists would fall into the range
of 0.0125–0.3 mg/day. A clinical therapy based on sub-milligram daily doses of GHRH antagonist
would be feasible both from a pharmaceutical technological and economical standpoint, as it would
permit the use of depot formulations containing full monthly dose of peptide. The cost of the
pharmaceutical preparation at such low doses would also be reasonable.
The present studydemonstrates the dose-dependent inhibitory effect of GHRHantagonist MZ-
J-7-138 on the tumoral growth factors VEGF and IGF-II in PC-3 prostate cancer. In the past few
years, different GHRH antagonists have been tested at various doses in studies on growth inhibition of
prostate cancer xenografts in vivo (67,73,77,82,84,86-88,91-93,153,161).
The effects of previous GHRH antagonists on tumor inhibition and expression of tumoral
growth factors have been discussed (62,67,82,84). GHRH antagonists used in the earlier studies by
our group were administered at doses as high as 20–40 µg/day, because of their lower tumor
76
inhibitory potency and at these doses they significantly affected the expression of tumoral growth
factors. With more potent GHRH antagonists such as MZ-J-7-118, effective tumor inhibition was
demonstrated at lower doses like 5 µg/day, with a decrease in VEGF, but not in the levels of IGF-II
(88). In this study, with the one of the most potent GHRH antagonist, MZ-J-7-138 developed so far in
our laboratory, we were able to clearly demonstrate dose-dependent effects on both tumor inhibition
and growth factor suppression. We observed significant (P<0.05) decrease in VEGF protein levels at
the doses of 5 µg and 10 µg/day. IGF-II was also significantly decreased by the highest dose of 10
µg/day, but 5 mg/day caused a non-significant reduction (P<0.07). The inhibition of tumoral VEGF
and IGF-II is in agreement with the data obtained previously in our laboratory, where a reduction of
growth factors was detected with high doses of GHRH antagonists. However, the present study shows
that the tumor inhibition obtained with a low dose of GHRH antagonist is not associated with a
significant decrease of tumoral growth factors, and it may be chiefly due to the direct inhibitory effect
of this antagonist on the tumoral GHRH receptors.
In previous studies (136), we could not detect the expression ofmRNAfor the pituitaryGHRH-
R in PC-3 cell line using conventional RT-PCR. Moreover,GHRH binding sites could not be detected
with [His1,Nle
27]hGHRH(1–32)NH2 ligand which binds with high affinity to the pituitary isoform of
GHRH-R. Thus, it was concluded that PC-3 cell line does not express pituitary GHRH-R. However,
in the present investigation using the more sensitive real-time PCR method, we detected the
expression of mRNA for pituitary GHRHR. Based on the low expression of mRNA for pituitary
GHRH-R, it is likely that the corresponding receptor protein is expressed only at minimal levels in
PC-3 cells, which would explain the negative results obtained in previous receptor binding studies.
Specific high affinity binding sites forGHRHwere found on PC-3 tumor membranes using ligand
competition assays with 125
I-labeled GHRH antagonist JV-1-42 which detects both SV-1 and the
pituitary type of GHRH receptors. In competition assays GHRH antagonist MZ-J-7-138 displaced the
[125
I]JV-1-42 radioligand with an IC50 = 0.32 nM, which indicates a high affinity binding of MZ-J-7-
138 to GHRH receptors on PC-3 tumors. However, future investigations are warranted to better
characterize the expression of pituitary GHRH-R in PC-3 cell line, especially at protein level.
The effect of treatment with GHRH antagonist MZ-J-7-138 (10 µg/day) on the expression of
mRNA for pituitary GHRH-R and SV1 was also investigated. The expression of mRNA for SV1,
which is probably the main GHRH receptor expressed at high levels in PC-3 tumors, was slightly and
not significantly downregulated after treatment. Conversely, the expression of mRNA for pituitary
GHRH-R was significantly upregulated, but it may contribute very little to total binding. Finally, we
also studied the expression of GHRH ligand and found that the mRNA level of GHRH peptide was
strongly downregulated after treatment with the GHRH antagonist to about one quarter of the level
found in control tumors.

77
Our results demonstrate the effectiveness of a new GHRH antagonist in reducing tumor
growth of androgen independent prostate cancer in a dosedependent manner. The reduction of growth
factors like VEGF and IGF-II by this GHRH antagonist was evident at higher doses and after
prolonged treatment. Further investigations with GHRH antagonists are required to determine their
potential utility for the therapy of prostate cancer. It is likely that the synthesis of still more potent
GHRH antagonists might be necessary to convert this class of compounds into a therapeutic tool.
5.5. Inhibitory effects of antagonists of growth hormone releasing hormone
on experimental prostate cancers are associated with upregulation of wild-
type p53 and decrease in p21 and mutant p53 proteins (Study 5)
Mutations of the tumor suppressor gene p53 are among the most common genetic changes found
in malignant tumors (94,96). Since p53 protein modulates cellular functions, such as gene transcription,
DNA synthesis and repair, cell cycle arrest, and apoptosis, mutations in the p53 gene can abrogate these
functions and may lead to genetic instability and progression to cancer (94-99). Alterations of p53 are
clearly associated with androgen independent prostate cancer (168,169) and significant overexpression of
mt-p53 is found in hormone-refractory and metastatic prostate cancer tissue (97,98). Particularly the bone
metastases show p53 alterations in 50-79% of specimens (168-170). Clonal expansion of p53 mutations
from the primary tumor to metastases in paired samples of primary cancers and metastases from the same
patients was demonstrated (168-170). It was suggested that foci of p53 mutants in the primary tumor may
have a selective growth advantage and a higher metastatic potential (97).
Different growth characteristics in vivo and in vitro as well as different responses to the treatment
with various anticancer agents observed in androgen independent prostate cancer models such as PC-3 and
DU-145, compared to androgen sensitive models MDA-PCa-2b and LNCaP have been attributed to the
status of p53 as the former models express mutant type and the latter wt p53 (104,171). The present study
demonstrates that inhibition of human experimental prostate cancers by GHRH antagonist MZ-J-7-
138 and LHRH antagonist Cetrorelix involves a different effect on wt-p53 and mt-p53 protein levels.
MZ-J-7-138 inhibited proliferation of PC-3 and DU-145 tumors inducing a decrease in the levels of
mutant p53. MZ-J-7-138 also suppressed MDA-PCa-2b tumors with an upregulation of wt-p53.
Cetrorelix also significantly increased the wt-p53 protein expression. Induction of the expression of pro-
apoptotic wt-p53 protein may be involved in the inhibitory effect of GHRH and LHRH antagonists on
MDA-PCa-2b tumor growth observed in our study. Our results are in accord with recent findings
showing an increase of wt-p53 expression after treatment with GHRH antagonists in an experimental
BPH model (117), and a decrease of mt-p53 expression after therapy with GHRH antagonists in
DMS-153 small cell lung carcinomas (118). In MDA-PCa-2b, combined treatment with LHRH
antagonist Cetrorelix and the GHRH antagonist MZ-J-7-138 resulted in a greater tumor inhibition.
MZ-J-7-138 is the first GHRH antagonist that significantly decreased growth of MDA-PCa-2b human
78
androgen sensitive prostate cancers without concomitant androgen deprivation. In previous studies
using earlier and less potent GHRH antagonists, the androgen deprivation was required in order to achieve
significant tumor inhibition of androgen sensitive experimental prostate cancers by GHRH antagonists
(67,84,164). The presence of GHRH receptor and LHRH receptor on PC-3, DU-145 and MDA-PCa-2b
human prostate cell lines was demonstrated previously (73,74,153,172).
GHRH antagonists inhibit the growth of various human experimental prostate cancers directly by
blocking tumoral GHRH receptors and by decreasing the production of tumoral IGF-I and II (67,84,88). The
intracellular signal transduction mechanisms leading to tumor inhibition following treatment with GHRH
antagonists include changes in the expression of PKC isoforms, inhibition of the p42/44 MAPK
(pERK1/2) – c-jun pathway, and Ca2+
entry into the cells which induces apoptosis (164,173).
Most p53 mutations are clustered into the central conserved DNA binding domain, and within this
region, a number of hot spot p53 mutations has been observed (174). In DU-145, two mutations are
described on the p53 gene. These mutations are found at codon 274 (pro>leu) and codon 223 (val>phe)
(104,175). Functionally, one or two of these mutations stabilizes the mutant p53, resulting in its strong
expression as shown by Western Blot and staining with immunohistochemistry (171). PC-3 cells are
reported to be hemizygous for chromosome 17p. The single copy of the p53 gene has a base pair deletion
at codon 138 that generated a frame shift and a new in-frame stop codon at position 169 (171,175). In our
experiments PC-3 tumors also expressed detectable mt-p53 protein levels. This is in contrast to earlier
studies who described high levels of mutant p53 in DU-145 but no p53 expression in PC-3(171,175).
The detection of p53 expression in our PC-3 line was achieved by three different p53
antibodies with different speciation and all specific for human p53.
In contrast to PC-3 and DU-145 tumors, the androgen sensitive MDA-PCa-2b prostate cancer
model was found to express wt-p53 (176). Treatment of MDA-PCa-2b tumors with MZ-J-7-138 led to a
non-significant up-regulation of wt-p53.
Based on the role of p53 in the control of apoptosis after DNA damage, the p53 gene has been
implicated as a major determinant of tumor responsiveness to cytotoxic therapies. Wild-type p53
protein can suppress tumorigenesis and promote apoptosis, acting as a transcriptional factor while
mutant p53 proteins are linked to a number of pathophysiological processes and exert effects that are
opposite to those of wild-type p53. The efficacy of chemotherapy with DNA-damaging agents or
radiotherapy is influenced by the p53 status of tumors (94,177). It has been shown that transfection of
PC-3 and DU-145 with wt p53 restored the chemosensitivity and decreased their excessive growth
(97,104). Conversely, gene transfection and expression of mutant p53 proteins in cancer lines that
were originally p53-null confers increased resistance to apoptosis (97) and stimulates the transcription
of IGFR-I gene, in contrast to wild-type p53, which inhibits it (178). It has also been shown that a

79
mutation of the p53 gene, in hepatocellular carcinomas, markedly increases the production of IGF-II,
which has an antiapoptotic effect, and this could contribute to the selection of transformed
hepatocytes with an increased resistance to apoptosis (179). Thus, the inhibition of anti apoptotic mt-
p53 by GHRH antagonists observed in PC-3 and DU-145 tumors may offer a strategy to increase
chemosensitivity of advanced prostate cancers that respond poorly to chemotherapy and prevent
further progression.
The present work, together with the results of several previous studies in our laboratory, indicates
that GHRH antagonists could be effective for the treatment of cancers with wt-p53 as well as mt-p53
status. Tumor models that were significantly inhibited by GHRH antagonists in vivo include MDA-PCa-
2b and LNCaP prostate cancers, H460 and A549 lung carcinomas, CAKI-1 renal carcinomas and U-87MG
glioblastomas with wt-p53 status, as well as PC-3 and DU-145 prostate cancers, DMS-153 lung cancers,
MDA-MB-468 and MDA-MB-435 breast cancers, HT29 colorectal and Panc-1 pancreatic cancers that
express mt-p53 (67,84,110). GHRH antagonists could offer a distinct advantage for the treatment of
cancers with mt-p53 status, since the conventional anticancer drugs, including DNA cross-linking agents,
antimetabolites, and topo-isomerase I and II inhibitors, are less effective when mt-p53 is expressed (110).
Recent investigations demonstrated, that inhibition of p53 function diminishes the androgen receptor-
mediated signaling (180).
To shed more light on the downstream mechanisms of the p53 pathway in prostate cancers
treated with GHRH antagonist we investigated the expression of the p53 downstream effector p21
(p21WAF1/Cip1
). Treatment with GHRH and LHRH antagonists invariably suppressed the p21 protein
levels, regardless of whether the tumor models expressed wt- or mt-p53. This indicates that the
antagonists possibly influence tumoral p21 levels by mechanisms independent of p53. Thus in MDA-
PCa-2b model which contains wt-p53, an upregulation of wt-p53 levels after treatment with
antagonists was accompanied by suppression of p21, even though wt-p53 is a well-known positive
regulator of p21 expression. Normally, mt-p53 reduces the expression of p21 protein (95,181). The
p53 gene mutation and the nuclear accumulation of its mt-p53 protein product have been found to be
associated with a down-regulation of p21 (181). It was also reported that ectopic expression of various
mt-p53 proteins markedly reduced the expression of p21 and other p53-target genes, whereas
silencing of mt-p53 expression by specific siRNAs upregulated the expression of the p21 gene in
human cancer lines (95). Nevertheless, in our experiments with PC-3 and DU-145 tumors expressing
mt-p53, inhibition of mt-p53 levels by the GHRH antagonist was accompanied by decreased p21
levels. The possible mechanisms by which our antagonists could inhibit tumoral p21 levels in a p53-
independent manner are the inhibition of tumoral MAPK (pERK1/2) and pAkt levels, since pERK1/2
and pAkt are positive regulators of p21 (109,182,183) and GHRH antagonists inhibit pERK1/2 and
pAkt levels in prostatic and lung cancers (67,84,147,184).

80
The inhibition of anti-apoptotic p21 levels by antagonists of GHRH and LHRH represents a very
favorable molecular mode of action, suggesting that these antagonists could possibly counteract the p21-
upregulating effect of conventional chemotherapeutic agents and of radiotherapy, and act as chemotherapy
or radiotherapy sensitizers when used with these treatment methods. Similarly it cannot be excluded that
antagonists of GHRH and LHRH could exert some protective action against deleterious effects of radiation
and chemotherapy. In this respect, we have reported recently that GHRH antagonists in combination with
docetaxel produced a synergistic inhibition of human experimental lung and breast cancers (128,147).
Similar experiments should be carried out in the future with prostate cancer models in order to fully
elucidate the therapeutic potential of GHRH and LHRH antagonists in combination with conventional
chemotherapeutic agents such as docetaxel, paclitaxel, doxorubicin, or cisplatin. The decrease of p21
expression, in addition to the earlier described paracrine/autocrine growth factor blockade, could offer a
multimodal approach to a new cancer therapy.
Tumor inhibition produced by GHRH antagonists in vivo could be partially explained by a
repression of the defective p53 function in PC-3 and DU-145 and by the reduction in p21 protein
expression. Further work with these analogs might lead to the development of new therapeutic modalities for
patients with relapsed prostate cancer who no longer respond to conventional treatment.

81
6. Novel findings:
6.1. Experimental benign prostatic hyperplasia studies
We showed expression of target receptors LHRH-R and GHRH-R and found a single class of
high affinity binding sites for LHRH and GHRH in rat prostates
We localized LHRH-R and GHRH-R on luminal membrane and apical cytoplasm of
epithelial cells of rat prostates
Treatment with LHRH antagonist cetrorelix caused significant reduction of prostate weights
in experimental BPH in a dose-dependent manner
Our findings suggest that the reduction in prostate volume could be due to direct inhibitory
effects of cetrorelix exerted through prostatic LHRH receptors as well as transcriptional
suppression of proinflammatory cytokines and growth factors
We demonstrated that the GHRH antagonists JMR-132, MIA-313, and MIA-459 reduce
prostate weigths and cellular content in experimental BPH
Our data suggest that this reduction in prostate volume is caused by the direct inhibitory
effects of GHRH antagonists exerted through prostatic GHRH receptors as well as by
transcriptional suppression of enumerated growth factors and proinflammatory cytokines.
We also showed strong inhibition of prostatic IL-1β, NF-κβ, and COX-2 after treatment with
GHRH antagonists
The proapoptotic effects of GHRH antagonists also have been demonstrated.
We observed the involvement of the mitogenic, hedgehog, PI3/AKT, and phospholipase C
pathways and their downstream effectors after treatment of experimental BPH with GHRH
antagonists.
We demonstrated that a combination of GHRH antagonist with LHRH antagonist potentiates
reduction in prostate weight in experimental BPH.
Our data indicate that shrinkage of prostate is induced by direct inhibitory action of GHRH
and LHRH antagonists exerted through prostatic receptors.
We found strong suppression of PSA, STEAP, IL-1β, NF-κβ, and COX-2 after treatment with
combination of GHRH and LHRH antagonists.
82
Proapoptotic and antiproliferative effects of combination therapy were also demonstrated.
Our data imply that GHRH and LHRH may serve as a local growth factor in BPH
6.2. Human prostate cancer xenograft studies
Our work indicates that GHRH antagonist MZ-J-7-138 is effective for the treatment of
experimental prostatic cancers with wt-p53 (MDA-PCa-2b) as well as mt-p53 (PC-3 and DU-
145) status.
We showed that treatment with GHRH and LHRH antagonists invariably suppressed the p21
protein levels, regardless of whether the tumor models expressed wt- or mt-p53. This
indicates that the antagonists possibly influence tumoral p21 levels by mechanisms
independent of p53.
We also demonstrated that GHRH antagonist MZ-J-7-138 inhibits growth of androgen-
independent PC-3 prostate cancer in a dose-dependent manner.
The reduction of growth factors VEGF and IGF-2 by this GHRH antagonist was evident at
higher doses and after prolonged treatment.

83
7. References
1. Roehrborn CG. Male lower urinary tract symptoms (LUTS) and benign prostatic
hyperplasia (BPH). Med Clin North Am 2011;95(1):87-100.
2. Berry SJ, Coffey DS, Walsh PC, Ewing LL. The development of human benign prostatic
hyperplasia with age. J Urol 1984;132(3):474-479.
3. Ho CK, Habib FK. Estrogen and androgen signaling in the pathogenesis of BPH. Nat
Rev Urol 2011;8(1):29-41.
4. Nicholson TM, Ricke WA. Androgens and estrogens in benign prostatic hyperplasia:
Past, present and future. Differentiation 2011.
5. McNeal JE. The zonal anatomy of the prostate. Prostate 1981;2(1):35-49.
6. McNeal JE. Origin and evolution of benign prostatic enlargement. Invest Urol
1978;15(4):340-345.
7. Roehrborn CG. Benign prostatic hyperplasia: an overview. Rev Urol 2005;7 Suppl 9:S3-
S14.
8. Abrams P, Chapple C, Khoury S, Roehrborn C, de la Rosette J. Evaluation and treatment
of lower urinary tract symptoms in older men. J Urol 2009;181(4):1779-1787.
9. Chapple CR, Roehrborn CG. A shifted paradigm for the further understanding,
evaluation, and treatment of lower urinary tract symptoms in men: focus on the bladder.
Eur Urol 2006;49(4):651-658.
10. Armitage JN, Sibanda N, Cathcart PJ, Emberton M, van der Meulen JH. Mortality in
men admitted to hospital with acute urinary retention: database analysis. BMJ
2007;335(7631):1199-1202.
11. McNeal J. Pathology of benign prostatic hyperplasia. Insight into etiology. Urol Clin
North Am 1990;17(3):477-486.
12. Franks LM. Benign nodular hyperplasia of the prostate; a review. Ann R Coll Surg Engl
1953;14(2):92-106.
13. Shapiro E, Becich MJ, Hartanto V, Lepor H. The relative proportion of stromal and
epithelial hyperplasia is related to the development of symptomatic benign prostate
hyperplasia. J Urol 1992;147(5):1293-1297.
14. McNeal JE. Normal and pathologic anatomy of prostate. Urology 1981;17(Suppl 3):11-
16.
15. Coffey DS, Walsh PC. Clinical and experimental studies of benign prostatic hyperplasia.
Urol Clin North Am 1990;17(3):461-475.
16. Untergasser G, Madersbacher S, Berger P. Benign prostatic hyperplasia: age-related
tissue-remodeling. Exp Gerontol 2005;40(3):121-128.
17. Alonso-Magdalena P, Brossner C, Reiner A, Cheng G, Sugiyama N, Warner M,
Gustafsson JA. A role for epithelial-mesenchymal transition in the etiology of benign
prostatic hyperplasia. Proc Natl Acad Sci U S A 2009;106(8):2859-2863.
18. Lin VK, Wang SY, Vazquez DV, C CX, Zhang S, Tang L. Prostatic stromal cells derived
from benign prostatic hyperplasia specimens possess stem cell like property. Prostate
2007;67(12):1265-1276.
19. Berger AP, Kofler K, Bektic J, Rogatsch H, Steiner H, Bartsch G, Klocker H. Increased
growth factor production in a human prostatic stromal cell culture model caused by
hypoxia. Prostate 2003;57(1):57-65.
20. Kramer G, Mitteregger D, Marberger M. Is benign prostatic hyperplasia (BPH) an
immune inflammatory disease? Eur Urol 2007;51(5):1202-1216.
21. Lucia MS, Lambert JR. Growth Factors in Benign Prostatic Hyperplasia: Basic Science
Implications. Curr Urol Rep 2008;9(4):272-278.
22. Cunha GR, Ricke W, Thomson A, Marker PC, Risbridger G, Hayward SW, Wang YZ,
Donjacour AA, Kurita T. Hormonal, cellular, and molecular regulation of normal and
neoplastic prostatic development. J Steroid Biochem Mol Biol 2004;92(4):221-236.
23. McVary KT. BPH: epidemiology and comorbidities. Am J Manag Care 2006;12(5
Suppl):S122-128.

84
24. Zhang Z, Duan L, Du X, Ma H, Park I, Lee C, Zhang J, Shi J. The proliferative effect of
estradiol on human prostate stromal cells is mediated through activation of ERK. Prostate
2008;68(5):508-516.
25. Park, II, Zhang Q, Liu V, Kozlowski JM, Zhang J, Lee C. 17Beta-estradiol at low
concentrations acts through distinct pathways in normal versus benign prostatic
hyperplasia-derived prostate stromal cells. Endocrinology 2009;150(10):4594-4605.
26. Tsurusaki T, Aoki D, Kanetake H, Inoue S, Muramatsu M, Hishikawa Y, Koji T. Zone-
dependent expression of estrogen receptors alpha and beta in human benign prostatic
hyperplasia. J Clin Endocrinol Metab 2003;88(3):1333-1340.
27. Lau KM, LaSpina M, Long J, Ho SM. Expression of estrogen receptor (ER)-alpha and
ER-beta in normal and malignant prostatic epithelial cells: regulation by methylation and
involvement in growth regulation. Cancer Res 2000;60(12):3175-3182.
28. Zavadil J, Bottinger EP. TGF-beta and epithelial-to-mesenchymal transitions. Oncogene
2005;24(37):5764-5774.
29. Fibbi B, Penna G, Morelli A, Adorini L, Maggi M. Chronic inflammation in the
pathogenesis of benign prostatic hyperplasia. Int J Androl 2010;33(3):475-488.
30. Di Silverio F, Gentile V, De Matteis A, Mariotti G, Giuseppe V, Luigi PA, Sciarra A.
Distribution of inflammation, pre-malignant lesions, incidental carcinoma in
histologically confirmed benign prostatic hyperplasia: a retrospective analysis. Eur Urol
2003;43(2):164-175.
31. Nickel JC, Roehrborn CG, O'Leary M P, Bostwick DG, Somerville MC, Rittmaster RS.
Examination of the relationship between symptoms of prostatitis and histological
inflammation: baseline data from the REDUCE chemoprevention trial. J Urol
2007;178(3 Pt 1):896-900; discussion 900-891.
32. St Sauver JL, Jacobson DJ, Girman CJ, Lieber MM, McGree ME, Jacobsen SJ. Tracking
of longitudinal changes in measures of benign prostatic hyperplasia in a population based
cohort. J Urol 2006;175(3 Pt 1):1018-1022; discussion 1022.
33. Kessler OJ, Keisari Y, Servadio C, Abramovici A. Role of chronic inflammation in the
promotion of prostatic hyperplasia in rats. J Urol 1998;159(3):1049-1053.
34. Lee KL, Peehl DM. Molecular and cellular pathogenesis of benign prostatic hyperplasia.
J Urol 2004;172(5 Pt 1):1784-1791.
35. Kohnen PW, Drach GW. Patterns of inflammation in prostatic hyperplasia: a histologic
and bacteriologic study. J Urol 1979;121(6):755-760.
36. Theyer G, Kramer G, Assmann I, Sherwood E, Preinfalk W, Marberger M, Zechner O,
Steiner GE. Phenotypic characterization of infiltrating leukocytes in benign prostatic
hyperplasia. Lab Invest 1992;66(1):96-107.
37. Kramer G, Steiner GE, Handisurya A, Stix U, Haitel A, Knerer B, Gessl A, Lee C,
Marberger M. Increased expression of lymphocyte-derived cytokines in benign
hyperplastic prostate tissue, identification of the producing cell types, and effect of
differentially expressed cytokines on stromal cell proliferation. Prostate 2002;52(1):43-
58.
38. Djavan B, Eckersberger E, Espinosa G, Kramer G, Handisurya A, Lee C, Marberger M,
Lepor H, Steiner GE. Complex mechanisms in prostatic inflammatory response. Eur Urol
Suppl 2009(8):872-878.
39. Nickel JC, Roehrborn CG, O'Leary MP, Bostwick DG, Somerville MC, Rittmaster RS.
The relationship between prostate inflammation and lower urinary tract symptoms:
examination of baseline data from the REDUCE trial. Eur Urol 2008;54(6):1379-1384.
40. Steiner GE, Newman ME, Paikl D, Stix U, Memaran-Dagda N, Lee C, Marberger MJ.
Expression and function of pro-inflammatory interleukin IL-17 and IL-17 receptor in
normal, benign hyperplastic, and malignant prostate. Prostate 2003;56(3):171-182.
41. Handisurya A, Steiner GE, Stix U, Ecker RC, Pfaffeneder-Mantai S, Langer D, Kramer
G, Memaran-Dadgar N, Marberger M. Differential expression of interleukin-15, a pro-
inflammatory cytokine and T-cell growth factor, and its receptor in human prostate.
Prostate 2001;49(4):251-262.

85
42. Steiner GE, Stix U, Handisurya A, Willheim M, Haitel A, Reithmayr F, Paikl D, Ecker
RC, Hrachowitz K, Kramer G, Lee C, Marberger M. Cytokine expression pattern in
benign prostatic hyperplasia infiltrating T cells and impact of lymphocytic infiltration on
cytokine mRNA profile in prostatic tissue. Lab Invest 2003;83(8):1131-1146.
43. Culig Z, Hobisch A, Cronauer MV, Radmayr C, Hittmair A, Zhang J, Thurnher M,
Bartsch G, Klocker H. Regulation of prostatic growth and function by peptide growth
factors. Prostate 1996;28(6):392-405.
44. Hieble JP. Animal models for benign prostatic hyperplasia. Handb Exp Pharmacol
2011(202):69-79.
45. Love HD, Booton SE, Boone BE, Breyer JP, Koyama T, Revelo MP, Shappell SB, Smith
JR, Hayward SW. Androgen regulated genes in human prostate xenografts in mice:
relation to BPH and prostate cancer. PLoS One 2009;4(12):e8384.
46. Barclay WW, Woodruff RD, Hall MC, Cramer SD. A system for studying epithelial-
stromal interactions reveals distinct inductive abilities of stromal cells from benign
prostatic hyperplasia and prostate cancer. Endocrinology 2005;146(1):13-18.
47. Cunha GR, Lung B. The possible influence of temporal factors in androgenic
responsiveness of urogenital tissue recombinants from wild-type and androgen-
insensitive (Tfm) mice. J Exp Zool 1978;205(2):181-193.
48. Hayward SW, Dahiya R, Cunha GR, Bartek J, Deshpande N, Narayan P. Establishment
and characterization of an immortalized but non-transformed human prostate epithelial
cell line: BPH-1. In Vitro Cell Dev Biol Anim 1995;31(1):14-24.
49. Steiner MS, Couch RC, Raghow S, Stauffer D. The chimpanzee as a model of human
benign prostatic hyperplasia. J Urol 1999;162(4):1454-1461.
50. Walsh PC, Wilson JD. The induction of prostatic hypertrophy in the dog with
androstanediol. J Clin Invest 1976;57(4):1093-1097.
51. Maggi CA, Manzini S, Giuliani S, Meli A. Infravesical outflow obstruction in rats: a
comparison of two models. Gen Pharmacol 1989;20(3):345-349.
52. Roehrborn CG. BPH progression: concept and key learning from MTOPS, ALTESS,
COMBAT, and ALF-ONE. BJU Int 2008;101 Suppl 3:17-21.
53. Millar RP, Lu ZL, Pawson AJ, Flanagan CA, Morgan K, Maudsley SR. Gonadotropin-
releasing hormone receptors. Endocr Rev 2004;25(2):235-275.
54. Bajusz S, Csernus VJ, Janaky T, Bokser L, Fekete M, Schally AV. New antagonists of
LHRH. II. Inhibition and potentiation of LHRH by closely related analogues. Int J Pept
Protein Res 1988;32(6):425-435.
55. Gonzalez-Barcena D, Vadillo-Buenfil M, Gomez-Orta F, Fuentes Garcia M, Cardenas-
Cornejo I, Graef-Sanchez A, Comaru-Schally AM, Schally AV. Responses to the
antagonistic analog of LH-RH (SB-75, Cetrorelix) in patients with benign prostatic
hyperplasia and prostatic cancer. Prostate 1994;24(2):84-92.
56. Comaru-Schally AM, Brannan W, Schally AV, Colcolough M, Monga M. Efficacy and
safety of luteinizing hormone-releasing hormone antagonist cetrorelix in the treatment of
symptomatic benign prostatic hyperplasia. J Clin Endocrinol Metab 1998;83(11):3826-
3831.
57. Debruyne F, Gres AA, Arustamov DL. Placebo-controlled dose-ranging phase 2 study of
subcutaneously administered LHRH antagonist cetrorelix in patients with symptomatic
benign prostatic hyperplasia. Eur Urol 2008;54(1):170-177.
58. Debruyne F, Tzvetkov M, Altarac S, Geavlete PA. Dose-ranging study of the luteinizing
hormone-releasing hormone receptor antagonist cetrorelix pamoate in the treatment of
patients with symptomatic benign prostatic hyperplasia. Urology 2010;76(4):927-933.
59. Horvath JE, Toller GL, Schally AV, Bajo AM, Groot K. Effect of long-term treatment
with low doses of the LHRH antagonist Cetrorelix on pituitary receptors for LHRH and
gonadal axis in male and female rats. Proc Natl Acad Sci U S A 2004;101(14):4996-
5001.
60. Russo A, Castiglione F, Salonia A, Benigni F, Rigatti P, Montorsi F, Andersson KE,
Hedlund P. Effects of the gonadotropin-releasing hormone antagonist ganirelix on

86
normal micturition and prostaglandin e(2)-induced detrusor overactivity in conscious
female rats. Eur Urol 2011;59(5):868-874.
61. Engel JB, Schally AV. Drug Insight: clinical use of agonists and antagonists of
luteinizing-hormone-releasing hormone. Nat Clin Pract Endocrinol Metab
2007;3(2):157-167.
62. Schally AV. New approaches to the therapy of various tumors based on peptide
analogues. Horm Metab Res 2008;40(5):315-322.
63. Jungwirth A, Galvan G, Pinski J, Halmos G, Szepeshazi K, Cai RZ, Groot K, Schally
AV. Luteinizing hormone-releasing hormone antagonist Cetrorelix (SB-75) and
bombesin antagonist RC-3940-II inhibit the growth of androgen-independent PC-3
prostate cancer in nude mice. Prostate 1997;32(3):164-172.
64. Lamharzi N, Schally AV, Koppan M. Luteinizing hormone-releasing hormone (LH-RH)
antagonist Cetrorelix inhibits growth of DU-145 human androgen-independent prostate
carcinoma in nude mice and suppresses the levels and mRNA expression of IGF-II in
tumors. Regul Pept 1998;77(1-3):185-192.
65. Clementi M, Sanchez C, Benitez DA, Contreras HR, Huidobro C, Cabezas J, Acevedo C,
Castellon EA. Gonadotropin releasing hormone analogs induce apoptosis by extrinsic
pathway involving p53 phosphorylation in primary cell cultures of human prostatic
adenocarcinomas. Prostate 2009;69(10):1025-1033.
66. Siejka A, Schally AV, Block NL, Barabutis N. Mechanisms of inhibition of human
benign prostatic hyperplasia in vitro by the luteinizing hormone-releasing hormone
antagonist cetrorelix. BJU Int 2010;106(9):1382-1388.
67. Schally AV, Varga JL, Engel JB. Antagonists of growth-hormone-releasing hormone: an
emerging new therapy for cancer. Nat Clin Pract Endocrinol Metab 2008;4(1):33-43.
68. Westley BR, May FE. Insulin-like growth factors: the unrecognised oncogenes. Br J
Cancer 1995;72(5):1065-1066.
69. Havt A, Schally AV, Halmos G, Varga JL, Toller GL, Horvath JE, Szepeshazi K, Koster
F, Kovitz K, Groot K, Zarandi M, Kanashiro CA. The expression of the pituitary growth
hormone-releasing hormone receptor and its splice variants in normal and neoplastic
human tissues. Proc Natl Acad Sci U S A 2005;102(48):17424-17429.
70. Rekasi Z, Czompoly T, Schally AV, Halmos G. Isolation and sequencing of cDNAs for
splice variants of growth hormone-releasing hormone receptors from human cancers.
Proc Natl Acad Sci U S A 2000;97(19):10561-10566.
71. Kiaris H, Schally AV, Varga JL, Groot K, Armatis P. Growth hormone-releasing
hormone: an autocrine growth factor for small cell lung carcinoma. Proc Natl Acad Sci U
S A 1999;96(26):14894-14898.
72. Chopin LK, Herington AC. A potential autocrine pathway for growth hormone releasing
hormone (GHRH) and its receptor in human prostate cancer cell lines. Prostate
2001;49(2):116-121.
73. Letsch M, Schally AV, Busto R, Bajo AM, Varga JL. Growth hormone-releasing
hormone (GHRH) antagonists inhibit the proliferation of androgen-dependent and -
independent prostate cancers. Proc Natl Acad Sci U S A 2003;100(3):1250-1255.
74. Heinrich E, Schally AV, Buchholz S, Rick FG, Halmos G, Mile M, Groot K, Hohla F,
Zarandi M, Varga JL. Dose-dependent growth inhibition in vivo of PC-3 prostate cancer
with a reduction in tumoral growth factors after therapy with GHRH antagonist MZ-J-7-
138. Prostate 2008;68(16):1763-1772.
75. Barabutis N, Schally AV. Antioxidant activity of growth hormone-releasing hormone
antagonists in LNCaP human prostate cancer line. Proc Natl Acad Sci U S A
2008;105(51):20470-20475.
76. Siejka A, Schally AV, Block NL, Barabutis N. Antagonists of growth hormone-releasing
hormone inhibit the proliferation of human benign prostatic hyperplasia cells. Prostate
2010;70(10):1087-1093.
77. Schally AV, Comaru-Schally AM, Plonowski A, Nagy A, Halmos G, Rekasi Z. Peptide
analogs in the therapy of prostate cancer. Prostate 2000;45(2):158-166.

87
78. Loblaw DA, Mendelson DS, Talcott JA, Virgo KS, Somerfield MR, Ben-Josef E,
Middleton R, Porterfield H, Sharp SA, Smith TJ, Taplin ME, Vogelzang NJ, Wade JL,
Jr., Bennett CL, Scher HI. American Society of Clinical Oncology recommendations for
the initial hormonal management of androgen-sensitive metastatic, recurrent, or
progressive prostate cancer. J Clin Oncol 2004;22(14):2927-2941.
79. Tannock IF, de Wit R, Berry WR, Horti J, Pluzanska A, Chi KN, Oudard S, Theodore C,
James ND, Turesson I, Rosenthal MA, Eisenberger MA. Docetaxel plus prednisone or
mitoxantrone plus prednisone for advanced prostate cancer. N Engl J Med
2004;351(15):1502-1512.
80. Feldman BJ, Feldman D. The development of androgen-independent prostate cancer. Nat
Rev Cancer 2001;1(1):34-45.
81. Schally AV C-SA. Hypthalamic and other peptide hormones. In: Holland JF FEI, Bast
RC, Jr., editors, editor, 7th Edition ed. Hamilton, Ontario, : BC: Decker; 2006. 802-816
p.
82. Schally AV, Comaru-Schally AM, Nagy A, Kovacs M, Szepeshazi K, Plonowski A,
Varga JL, Halmos G. Hypothalamic hormones and cancer. Front Neuroendocrinol
2001;22(4):248-291.
83. Schally AV. Luteinizing hormone-releasing hormone analogs: their impact on the control
of tumorigenesis. Peptides 1999;20(10):1247-1262.
84. Schally AV, Varga JL. Antagonists of growth hormone-releasing hormone in oncology.
Comb Chem High Throughput Screen 2006;9(3):163-170.
85. Schally AV, Varga JL. Antagonistic Analogs of Growth Hormone-releasing Hormone:
New Potential Antitumor Agents. Trends Endocrinol Metab 1999;10(10):383-391.
86. Plonowski A, Schally AV, Varga JL, Rekasi Z, Hebert F, Halmos G, Groot K.
Potentiation of the inhibitory effect of growth hormone-releasing hormone antagonists on
PC-3 human prostate cancer by bombesin antagonists indicative of interference with both
IGF and EGF pathways. Prostate 2000;44(2):172-180.
87. Plonowski A, Schally AV, Letsch M, Krupa M, Hebert F, Busto R, Groot K, Varga JL.
Inhibition of proliferation of PC-3 human prostate cancer by antagonists of growth
hormone-releasing hormone: lack of correlation with the levels of serum IGF-I and
expression of tumoral IGF-II and vascular endothelial growth factor. Prostate
2002;52(3):173-182.
88. Stangelberger A, Schally AV, Varga JL, Hammann BD, Groot K, Halmos G, Cai RZ,
Zarandi M. Antagonists of growth hormone releasing hormone (GHRH) and of
bombesin/gastrin releasing peptide (BN/GRP) suppress the expression of VEGF, bFGF,
and receptors of the EGF/HER family in PC-3 and DU-145 human androgen-
independent prostate cancers. Prostate 2005;64(3):303-315.
89. Kiaris H, Schally AV, Busto R, Halmos G, Artavanis-Tsakonas S, Varga JL. Expression
of a splice variant of the receptor for GHRH in 3T3 fibroblasts activates cell proliferation
responses to GHRH analogs. Proc Natl Acad Sci U S A 2002;99(1):196-200.
90. Halmos G, Schally AV, Czompoly T, Krupa M, Varga JL, Rekasi Z. Expression of
growth hormone-releasing hormone and its receptor splice variants in human prostate
cancer. J Clin Endocrinol Metab 2002;87(10):4707-4714.
91. Lamharzi N, Schally AV, Koppan M, Groot K. Growth hormone-releasing hormone
antagonist MZ-5-156 inhibits growth of DU-145 human androgen-independent prostate
carcinoma in nude mice and suppresses the levels and mRNA expression of insulin-like
growth factor II in tumors. Proc Natl Acad Sci U S A 1998;95(15):8864-8868.
92. Jungwirth A, Schally AV, Pinski J, Halmos G, Groot K, Armatis P, Vadillo-Buenfil M.
Inhibition of in vivo proliferation of androgen-independent prostate cancers by an
antagonist of growth hormone-releasing hormone. Br J Cancer 1997;75(11):1585-1592.
93. Zarandi M, Varga JL, Schally AV, Horvath JE, Toller GL, Kovacs M, Letsch M, Groot
K, Armatis P, Halmos G. Lipopeptide antagonists of growth hormone-releasing hormone
with improved antitumor activities. Proc Natl Acad Sci U S A 2006;103(12):4610-4615.

88
94. Wallace-Brodeur RR, Lowe SW. Clinical implications of p53 mutations. Cell Mol Life
Sci 1999;55(1):64-75.
95. Vikhanskaya F, Lee MK, Mazzoletti M, Broggini M, Sabapathy K. Cancer-derived p53
mutants suppress p53-target gene expression--potential mechanism for gain of function
of mutant p53. Nucleic Acids Res 2007;35(6):2093-2104.
96. Smith ND, Rubenstein JN, Eggener SE, Kozlowski JM. The p53 tumor suppressor gene
and nuclear protein: basic science review and relevance in the management of bladder
cancer. J Urol 2003;169(4):1219-1228.
97. Pisters LL, Pettaway CA, Troncoso P, McDonnell TJ, Stephens LC, Wood CG, Do KA,
Brisbay SM, Wang X, Hossan EA, Evans RB, Soto C, Jacobson MG, Parker K, Merritt
JA, Steiner MS, Logothetis CJ. Evidence that transfer of functional p53 protein results in
increased apoptosis in prostate cancer. Clin Cancer Res 2004;10(8):2587-2593.
98. Navone NM, Rodriquez-Vargas MC, Benedict WF, Troncoso P, McDonnell TJ, Zhou
JH, Luthra R, Logothetis CJ. TabBO: a model reflecting common molecular features of
androgen-independent prostate cancer. Clin Cancer Res 2000;6(3):1190-1197.
99. Zellweger T, Ninck C, Bloch M, Mirlacher M, Koivisto PA, Helin HJ, Mihatsch MJ,
Gasser TC, Bubendorf L. Expression patterns of potential therapeutic targets in prostate
cancer. Int J Cancer 2005;113(4):619-628.
100. Bossi G, Lapi E, Strano S, Rinaldo C, Blandino G, Sacchi A. Mutant p53 gain of
function: reduction of tumor malignancy of human cancer cell lines through abrogation
of mutant p53 expression. Oncogene 2006;25(2):304-309.
101. Scian MJ, Stagliano KE, Ellis MA, Hassan S, Bowman M, Miles MF, Deb SP, Deb S.
Modulation of gene expression by tumor-derived p53 mutants. Cancer Res
2004;64(20):7447-7454.
102. Blagosklonny MV, Trostel S, Kayastha G, Demidenko ZN, Vassilev LT, Romanova LY,
Bates S, Fojo T. Depletion of mutant p53 and cytotoxicity of histone deacetylase
inhibitors. Cancer Res 2005;65(16):7386-7392.
103. Lee JT, Lehmann BD, Terrian DM, Chappell WH, Stivala F, Libra M, Martelli AM,
Steelman LS, McCubrey JA. Targeting prostate cancer based on signal transduction and
cell cycle pathways. Cell Cycle 2008;7(12):1745-1762.
104. Isaacs WB, Carter BS, Ewing CM. Wild-type p53 suppresses growth of human prostate
cancer cells containing mutant p53 alleles. Cancer Res 1991;51(17):4716-4720.
105. Li R, Hannon GJ, Beach D, Stillman B. Subcellular distribution of p21 and PCNA in
normal and repair-deficient cells following DNA damage. Curr Biol 1996;6(2):189-199.
106. Martinez LA, Yang J, Vazquez ES, Rodriguez-Vargas Mdel C, Olive M, Hsieh JT,
Logothetis CJ, Navone NM. p21 modulates threshold of apoptosis induced by DNA-
damage and growth factor withdrawal in prostate cancer cells. Carcinogenesis
2002;23(8):1289-1296.
107. Janicke RU, Sohn D, Essmann F, Schulze-Osthoff K. The multiple battles fought by anti-
apoptotic p21. Cell Cycle 2007;6(4):407-413.
108. Kim CG, Choi BH, Son SW, Yi SJ, Shin SY, Lee YH. Tamoxifen-induced activation of
p21Waf1/Cip1 gene transcription is mediated by Early Growth Response-1 protein
through the JNK and p38 MAP kinase/Elk-1 cascades in MDA-MB-361 breast
carcinoma cells. Cell Signal 2007;19(6):1290-1300.
109. Lin PY, Fosmire SP, Park SH, Park JY, Baksh S, Modiano JF, Weiss RH. Attenuation of
PTEN increases p21 stability and cytosolic localization in kidney cancer cells: a potential
mechanism of apoptosis resistance. Mol Cancer 2007;6:16.
110. O'Connor PM, Jackman J, Bae I, Myers TG, Fan S, Mutoh M, Scudiero DA, Monks A,
Sausville EA, Weinstein JN, Friend S, Fornace AJ, Jr., Kohn KW. Characterization of
the p53 tumor suppressor pathway in cell lines of the National Cancer Institute anticancer
drug screen and correlations with the growth-inhibitory potency of 123 anticancer agents.
Cancer Res 1997;57(19):4285-4300.
111. Rohlff C, Blagosklonny MV, Kyle E, Kesari A, Kim IY, Zelner DJ, Hakim F, Trepel J,
Bergan RC. Prostate cancer cell growth inhibition by tamoxifen is associated with

89
inhibition of protein kinase C and induction of p21(waf1/cip1). Prostate 1998;37(1):51-
59.
112. Levkau B, Koyama H, Raines EW, Clurman BE, Herren B, Orth K, Roberts JM, Ross R.
Cleavage of p21Cip1/Waf1 and p27Kip1 mediates apoptosis in endothelial cells through
activation of Cdk2: role of a caspase cascade. Mol Cell 1998;1(4):553-563.
113. Fizazi K, Martinez LA, Sikes CR, Johnston DA, Stephens LC, McDonnell TJ, Logothetis
CJ, Trapman J, Pisters LL, Ordonez NG, Troncoso P, Navone NM. The association of
p21((WAF-1/CIP1)) with progression to androgen-independent prostate cancer. Clin
Cancer Res 2002;8(3):775-781.
114. Aaltomaa S, Lipponen P, Eskelinen M, Ala-Opas M, Kosma VM. Prognostic value and
expression of p21(waf1/cip1) protein in prostate cancer. Prostate 1999;39(1):8-15.
115. Baretton GB, Klenk U, Diebold J, Schmeller N, Lohrs U. Proliferation- and apoptosis-
associated factors in advanced prostatic carcinomas before and after androgen
deprivation therapy: prognostic significance of p21/WAF1/CIP1 expression. Br J Cancer
1999;80(3-4):546-555.
116. Lacombe L, Maillette A, Meyer F, Veilleux C, Moore L, Fradet Y. Expression of p21
predicts PSA failure in locally advanced prostate cancer treated by prostatectomy. Int J
Cancer 2001;95(3):135-139.
117. Rick FG, Schally AV, Block NL, Nadji M, Szepeshazi K, Zarandi M, Vidaurre I, Perez
R, Halmos G, Szalontay L. Antagonists of growth hormone-releasing hormone (GHRH)
reduce prostate size in experimental benign prostatic hyperplasia. Proc Natl Acad Sci U S
A 2011;108(9):3755-3760.
118. Kanashiro CA, Schally AV, Groot K, Armatis P, Bernardino AL, Varga JL. Inhibition of
mutant p53 expression and growth of DMS-153 small cell lung carcinoma by antagonists
of growth hormone-releasing hormone and bombesin. Proc Natl Acad Sci U S A
2003;100(26):15836-15841.
119. Zarandi M, Horvath JE, Halmos G, Pinski J, Nagy A, Groot K, Rekasi Z, Schally AV.
Synthesis and biological activities of highly potent antagonists of growth hormone-
releasing hormone. Proc Natl Acad Sci U S A 1994;91(25):12298-12302.
120. Varga JL, Schally AV, Horvath JE, Kovacs M, Halmos G, Groot K, Toller GL, Rekasi Z,
Zarandi M. Increased activity of antagonists of growth hormone-releasing hormone
substituted at positions 8, 9, and 10. Proc Natl Acad Sci U S A 2004;101(6):1708-1713.
121. McConnell JD. Benign prostatic hyperplasia. Hormonal treatment. Urol Clin North Am
1995;22(2):387-400.
122. Wemyss-Holden SA, Hamdy FC, Hastie KJ. Steroid abuse in athletes, prostatic
enlargement and bladder outflow obstruction--is there a relationship? Br J Urol
1994;74(4):476-478.
123. Constantinou CE. Influence of hormone treatment on prostate growth and micturition
characteristics of the rat. Prostate 1996;29(1):30-35.
124. Liu HP, Chen GL, Liu P, Xu XP. Amlodipine alone or combined with terazosin
improves lower urinary tract disorder in rat models of benign prostatic hyperplasia or
detrusor instability: focus on detrusor overactivity. BJU Int 2009;104(11):1752-1757.
125. Pandita RK, Persson K, Hedlund P, Andersson KE. Testosterone-induced prostatic
growth in the rat causes bladder overactivity unrelated to detrusor hypertrophy. Prostate
1998;35(2):102-108.
126. Scolnik MD, Servadio C, Abramovici A. Comparative study of experimentally induced
benign and atypical hyperplasia in the ventral prostate of different rat strains. J Androl
1994;15(4):287-297.
127. Kojima Y, Sasaki S, Oda N, Koshimizu TA, Hayashi Y, Kiniwa M, Tsujimoto G, Kohri
K. Prostate growth inhibition by subtype-selective alpha(1)-adrenoceptor antagonist
naftopidil in benign prostatic hyperplasia. Prostate 2009;69(14):1521-1528.
128. Buchholz S, Schally AV, Engel JB, Hohla F, Heinrich E, Koester F, Varga JL, Halmos
G. Potentiation of mammary cancer inhibition by combination of antagonists of growth

90
hormone-releasing hormone with docetaxel. Proc Natl Acad Sci U S A
2007;104(6):1943-1946.
129. Rick FG, Schally AV, Block NL, Halmos G, Perez R, Fernandez JB, Vidaurre I,
Szalontay L. LHRH antagonist Cetrorelix reduces prostate size and gene expression of
proinflammatory cytokines and growth factors in a rat model of benign prostatic
hyperplasia. Prostate 2011;71(7):736-747.
130. Stangelberger A, Schally AV, Rick FG, Varga J, Baker B, Zarandi M, Halmos G.
Inhibitory effects of antagonists of growth hormone releasing hormone on experimental
prostate cancers are associated with upregulation of wild-type p53 and decrease in p21
and mutant p53 proteins. Prostate 2011.
131. Nemeth JA, Lee C. Prostatic ductal system in rats: regional variation in stromal
organization. Prostate 1996;28(2):124-128.
132. Rick FG, Szalontay L, Schally AV, Block NL, Nadji M, Szepeshazi K, Vidaurre I,
Kovacs M, Rekasi Z. Combining antagonist of GHRH with antagonist of LHRH greatly
augments BPH shrinkage. J Urol 2011.
133. Pfaffl MW. A new mathematical model for relative quantification in real-time RT-PCR.
Nucleic Acids Res 2001;29(9):e45.
134. Breier BH, Gallaher BW, Gluckman PD. Radioimmunoassay for insulin-like growth
factor-I: solutions to some potential problems and pitfalls. J Endocrinol 1991;128(3):347-
357.
135. Halmos G, Arencibia JM, Schally AV, Davis R, Bostwick DG. High incidence of
receptors for luteinizing hormone-releasing hormone (LHRH) and LHRH receptor gene
expression in human prostate cancers. J Urol 2000;163(2):623-629.
136. Plonowski A, Schally AV, Busto R, Krupa M, Varga JL, Halmos G. Expression of
growth hormone-releasing hormone (GHRH) and splice variants of GHRH receptors in
human experimental prostate cancers. Peptides 2002;23(6):1127-1133.
137. Emons G, Grundker C, Gunthert AR, Westphalen S, Kavanagh J, Verschraegen C.
GnRH antagonists in the treatment of gynecological and breast cancers. Endocr Relat
Cancer 2003;10(2):291-299.
138. Nickel JC, Downey J, Young I, Boag S. Asymptomatic inflammation and/or infection in
benign prostatic hyperplasia. BJU Int 1999;84(9):976-981.
139. Tagaya M, Oka M, Ueda M, Takagaki K, Tanaka M, Ohgi T, Yano J. Eviprostat
suppresses proinflammatory gene expression in the prostate of rats with partial bladder-
outlet obstruction: a genome-wide DNA microarray analysis. Cytokine 2009;47(3):185-
193.
140. Konig JE, Senge T, Allhoff EP, Konig W. Analysis of the inflammatory network in
benign prostate hyperplasia and prostate cancer. Prostate 2004;58(2):121-129.
141. Schulz S, Rocken C. Immunocytochemical localisation of plasma membrane GHRH
receptors in human tumours using a novel anti-peptide antibody. Eur J Cancer
2006;42(14):2390-2396.
142. Vykhovanets EV, Shukla S, MacLennan GT, Vykhovanets OV, Bodner DR, Gupta S. Il-
1 beta-induced post-transition effect of NF-kappaB provides time-dependent wave of
signals for initial phase of intrapostatic inflammation. Prostate 2009;69(6):633-643.
143. Barnes PJ, Karin M. Nuclear factor-kappaB: a pivotal transcription factor in chronic
inflammatory diseases. N Engl J Med 1997;336(15):1066-1071.
144. Morisset S, Patry C, Lora M, de Brum-Fernandes AJ. Regulation of cyclooxygenase-2
expression in bovine chondrocytes in culture by interleukin 1alpha, tumor necrosis
factor-alpha, glucocorticoids, and 17beta-estradiol. J Rheumatol 1998;25(6):1146-1153.
145. Smith WL, DeWitt DL, Garavito RM. Cyclooxygenases: structural, cellular, and
molecular biology. Annu Rev Biochem 2000;69:145-182.
146. Kirschenbaum A, Klausner AP, Lee R, Unger P, Yao S, Liu XH, Levine AC. Expression
of cyclooxygenase-1 and cyclooxygenase-2 in the human prostate. Urology
2000;56(4):671-676.

91
147. Hohla F, Schally AV, Szepeshazi K, Varga JL, Buchholz S, Koster F, Heinrich E,
Halmos G, Rick FG, Kannadka C, Datz C, Kanashiro CA. Synergistic inhibition of
growth of lung carcinomas by antagonists of growth hormone-releasing hormone in
combination with docetaxel. Proc Natl Acad Sci U S A 2006;103(39):14513-14518.
148. Tsujii M, DuBois RN. Alterations in cellular adhesion and apoptosis in epithelial cells
overexpressing prostaglandin endoperoxide synthase 2. Cell 1995;83(3):493-501.
149. Hohla F, Buchholz S, Schally AV, Seitz S, Rick FG, Szalontay L, Varga JL, Zarandi M,
Halmos G, Vidaurre I, Krishan A, Kurtoglu M, Chandna S, Aigner E, Datz C. GHRH
antagonist causes DNA damage leading to p21 mediated cell cycle arrest and apoptosis
in human colon cancer cells. Cell Cycle 2009;8(19):3149-3156.
150. Kanashiro CA, Schally AV, Zarandi M, Hammann BD, Varga JL. Suppression of growth
of H-69 small cell lung carcinoma by antagonists of growth hormone releasing hormone
and bombesin is associated with an inhibition of protein kinase C signaling. Int J Cancer
2004;112(4):570-576.
151. Hubert RS, Vivanco I, Chen E, Rastegar S, Leong K, Mitchell SC, Madraswala R, Zhou
Y, Kuo J, Raitano AB, Jakobovits A, Saffran DC, Afar DE. STEAP: a prostate-specific
cell-surface antigen highly expressed in human prostate tumors. Proc Natl Acad Sci U S
A 1999;96(25):14523-14528.
152. Azumi M, Kobayashi H, Aoki N, Sato K, Kimura S, Kakizaki H, Tateno M. Six-
transmembrane epithelial antigen of the prostate as an immunotherapeutic target for renal
cell and bladder cancer. J Urol 2010;183(5):2036-2044.
153. Stangelberger A, Schally AV, Zarandi M, Heinrich E, Groot K, Havt A, Kanashiro CA,
Varga JL, Halmos G. The combination of antagonists of LHRH with antagonists of
GHRH improves inhibition of androgen sensitive MDA-PCa-2b and LuCaP-35 prostate
cancers. Prostate 2007;67(12):1339-1353.
154. Stangelberger A, Schally AV, Djavan B. New treatment approaches for prostate cancer
based on peptide analogues. Eur Urol 2008;53(5):890-900.
155. Djakiew D. Dysregulated expression of growth factors and their receptors in the
development of prostate cancer. Prostate 2000;42(2):150-160.
156. Hellawell GO, Turner GD, Davies DR, Poulsom R, Brewster SF, Macaulay VM.
Expression of the type 1 insulin-like growth factor receptor is up-regulated in primary
prostate cancer and commonly persists in metastatic disease. Cancer Res
2002;62(10):2942-2950.
157. Culig Z, Hobisch A, Cronauer MV, Radmayr C, Trapman J, Hittmair A, Bartsch G,
Klocker H. Androgen receptor activation in prostatic tumor cell lines by insulin-like
growth factor-I, keratinocyte growth factor, and epidermal growth factor. Cancer Res
1994;54(20):5474-5478.
158. Hoosein NM, Logothetis CJ, Chung LW. Differential effects of peptide hormones
bombesin, vasoactive intestinal polypeptide and somatostatin analog RC-160 on the
invasive capacity of human prostatic carcinoma cells. J Urol 1993;149(5):1209-1213.
159. Mimeault M, Pommery N, Henichart JP. New advances on prostate carcinogenesis and
therapies: involvement of EGF-EGFR transduction system. Growth Factors
2003;21(1):1-14.
160. Culig Z, Hobisch A, Cronauer MV, Cato AC, Hittmair A, Radmayr C, Eberle J, Bartsch
G, Klocker H. Mutant androgen receptor detected in an advanced-stage prostatic
carcinoma is activated by adrenal androgens and progesterone. Mol Endocrinol
1993;7(12):1541-1550.
161. Stangelberger A, Schally AV, Varga JL, Zarandi M, Szepeshazi K, Armatis P, Halmos
G. Inhibitory effect of antagonists of bombesin and growth hormone-releasing hormone
on orthotopic and intraosseous growth and invasiveness of PC-3 human prostate cancer
in nude mice. Clin Cancer Res 2005;11(1):49-57.
162. Kvols LK, Woltering EA. Role of somatostatin analogs in the clinical management of
non-neuroendocrine solid tumors. Anticancer Drugs 2006;17(6):601-608.
92
163. Keller G, Schally AV, Groot K, Toller GL, Havt A, Koster F, Armatis P, Halmos G,
Zarandi M, Varga JL, Engel JB. Effective treatment of experimental human non-
Hodgkin's lymphomas with antagonists of growth hormone-releasing hormone. Proc Natl
Acad Sci U S A 2005;102(30):10628-10633.
164. Letsch M, Schally AV, Stangelberger A, Groot K, Varga JL. Antagonists of growth
hormone-releasing hormone (GH-RH) enhance tumour growth inhibition induced by
androgen deprivation in human MDA-Pca-2b prostate cancers. Eur J Cancer
2004;40(3):436-444.
165. Pinski J, Schally AV, Halmos G, Szepeshazi K. Effect of somatostatin analog RC-160
and bombesin/gastrin releasing peptide antagonist RC-3095 on growth of PC-3 human
prostate-cancer xenografts in nude mice. Int J Cancer 1993;55(6):963-967.
166. Gonzalez-Barcena D, Vadillo-Buenfil M, Cortez-Morales A, Fuentes-Garcia M,
Cardenas-Cornejo I, Comaru-Schally AM, Schally AV. Luteinizing hormone-releasing
hormone antagonist cetrorelix as primary single therapy in patients with advanced
prostatic cancer and paraplegia due to metastatic invasion of spinal cord. Urology
1995;45(2):275-281.
167. Gonzalez-Barcena D, Schally AV, Vadillo-Buenfil M, Cortez-Morales A, Hernandez
LV, Cardenas-Cornejo I, Comaru-Schally AM. Response of patients with advanced
prostatic cancer to administration of somatostatin analog RC-160 (vapreotide) at the time
of relapse. Prostate 2003;56(3):183-191.
168. McDonnell TJ, Navone NM, Troncoso P, Pisters LL, Conti C, von Eschenbach AC,
Brisbay S, Logothetis CJ. Expression of bcl-2 oncoprotein and p53 protein accumulation
in bone marrow metastases of androgen independent prostate cancer. J Urol
1997;157(2):569-574.
169. Navone NM, Troncoso P, Pisters LL, Goodrow TL, Palmer JL, Nichols WW, von
Eschenbach AC, Conti CJ. p53 protein accumulation and gene mutation in the
progression of human prostate carcinoma. J Natl Cancer Inst 1993;85(20):1657-1669.
170. Stapleton AM, Timme TL, Gousse AE, Li QF, Tobon AA, Kattan MW, Slawin KM,
Wheeler TM, Scardino PT, Thompson TC. Primary human prostate cancer cells
harboring p53 mutations are clonally expanded in metastases. Clin Cancer Res
1997;3(8):1389-1397.
171. Carroll AG, Voeller HJ, Sugars L, Gelmann EP. p53 oncogene mutations in three human
prostate cancer cell lines. Prostate 1993;23(2):123-134.
172. Leuschner C, Enright FM, Gawronska-Kozak B, Hansel W. Human prostate cancer cells
and xenografts are targeted and destroyed through luteinizing hormone releasing
hormone receptors. Prostate 2003;56(4):239-249.
173. Rekasi Z, Czompoly T, Schally AV, Boldizsar F, Varga JL, Zarandi M, Berki T, Horvath
RA, Nemeth P. Antagonist of growth hormone-releasing hormone induces apoptosis in
LNCaP human prostate cancer cells through a Ca2+-dependent pathway. Proc Natl Acad
Sci U S A 2005;102(9):3435-3440.
174. Greenblatt MS, Bennett WP, Hollstein M, Harris CC. Mutations in the p53 tumor
suppressor gene: clues to cancer etiology and molecular pathogenesis. Cancer Res
1994;54(18):4855-4878.
175. van Bokhoven A, Varella-Garcia M, Korch C, Johannes WU, Smith EE, Miller HL,
Nordeen SK, Miller GJ, Lucia MS. Molecular characterization of human prostate
carcinoma cell lines. Prostate 2003;57(3):205-225.
176. Navone NM, Olive M, Ozen M, Davis R, Troncoso P, Tu SM, Johnston D, Pollack A,
Pathak S, von Eschenbach AC, Logothetis CJ. Establishment of two human prostate
cancer cell lines derived from a single bone metastasis. Clin Cancer Res 1997;3(12 Pt
1):2493-2500.
177. Natsume T, Kobayashi M, Fujimoto S. Association of p53 gene mutations with
sensitivity to TZT-1027 in patients with clinical lung and renal carcinoma. Cancer
2001;92(2):386-394.

93
178. Werner H, Karnieli E, Rauscher FJ, LeRoith D. Wild-type and mutant p53 differentially
regulate transcription of the insulin-like growth factor I receptor gene. Proc Natl Acad
Sci U S A 1996;93(16):8318-8323.
179. Lee YI, Lee S, Das GC, Park US, Park SM. Activation of the insulin-like growth factor II
transcription by aflatoxin B1 induced p53 mutant 249 is caused by activation of
transcription complexes; implications for a gain-of-function during the formation of
hepatocellular carcinoma. Oncogene 2000;19(33):3717-3726.
180. Cronauer MV, Schulz WA, Burchardt T, Ackermann R, Burchardt M. Inhibition of p53
function diminishes androgen receptor-mediated signaling in prostate cancer cell lines.
Oncogene 2004;23(20):3541-3549.
181. Hu YX, Watanabe H, Ohtsubo K, Yamaguchi Y, Ha A, Motoo Y, Okai T, Sawabu N.
Infrequent expression of p21 is related to altered p53 protein in pancreatic carcinoma.
Clin Cancer Res 1998;4(5):1147-1152.
182. Tu Y, Wu W, Wu T, Cao Z, Wilkins R, Toh BH, Cooper ME, Chai Z. Antiproliferative
autoantigen CDA1 transcriptionally up-regulates p21(Waf1/Cip1) by activating p53 and
MEK/ERK1/2 MAPK pathways. J Biol Chem 2007;282(16):11722-11731.
183. Meng LH, Kohn KW, Pommier Y. Dose-response transition from cell cycle arrest to
apoptosis with selective degradation of Mdm2 and p21WAF1/CIP1 in response to the
novel anticancer agent, aminoflavone (NSC 686,288). Oncogene 2007;26(33):4806-
4816.
184. Stangelberger A, Schally AV, Varga JL, Zarandi M, Cai RZ, Baker B, Hammann BD,
Armatis P, Kanashiro CA. Inhibition of human androgen-independent PC-3 and DU-145
prostate cancers by antagonists of bombesin and growth hormone releasing hormone is
linked to PKC, MAPK and c-jun intracellular signalling. Eur J Cancer 2005;41(17):2735-
2744.

94
8. List of publications
Cumulative impact factor of publications related to the dissertation: articles: 23.456; abstracts: 2.365
Cumulative impact factor of all publications: articles: 69.256; abstracts: 117.95
Publications related to the dissertation
1. Peer-reviewed journal articles:
1. Rick FG, Schally AV, Block NL, Nadji M, Szepeshazi K, Zarandi M, Vidaurre I, Perez R,
Halmos G, Szalontay L. Antagonists of growth hormone-releasing hormone (GHRH) reduce
prostate size in experimental benign prostatic hyperplasia. Proc Natl Acad Sci USA. 2011 Mar
1;108(9):3755-60. [IF: 9.771] (2010)
2. Rick FG, Schally AV, Block NL, Halmos G, Perez R, Fernandez JB, Vidaurre I, Szalontay L.
LHRH antagonist Cetrorelix reduces prostate size and gene expression of proinflammatory
cytokines in a rat model of benign prostatic hyperplasia. Prostate. 2011 May 15;71(7):736-47.
[IF: 3.377] (2010)
3. Rick FG, Szalontay L, Schally AV, Block NL, Nadji M, Szepeshazi K, Vidaurre I, Zarandi M,
Kovacs M, Rekasi Z. Combining antagonist of GHRH with antagonist of LHRH greatly augments
BPH shrinkage. J Urol. Accepted for publication. [IF: 3.862] (2010)
4. Stangelberger A, Schally AV, Rick FG, Varga JL, Baker B, Zarandi M, Halmos G. Inhibitory
effects of antagonists of growth hormone releasing hormone on experimental prostate cancers are
associated with upregulation of wild-type p53 and decrease in p21 and mutant p53 proteins.
Prostate. 2011 July 27. doi: 10.1002/pros.21458. [Epub ahead of print] [IF: 3.377] (2010)
5. Heinrich E, Schally AV, Buchholz S, Rick FG, Halmos G Mile M, Groot K, Hohla F, Zarandi M,
Varga JL. Dose-dependent growth inhibition in vivo of PC-3 prostate cancer with a reduction in
tumoral growth factors after therapy with GHRH antagonist MZ-J-7-138. Prostate. 2008 Dec
1;68(16):1763-72. [IF: 3.069]
2. Citable abstracts:
1. Rick FG, Schally AV, Block NL, Szalontay L, Siejka A, Rincon R, Fensterle J, Engel J.
Reduction in prostate size after treatment with Cetrorelix in a rat model of bening prostatic
hyperplasia (BPH). Urology. 2009;74(4) S45. [IF: 2.365]
Further publications
1. Peer-reviewed journal articles:
1. Pozsgai E, Schally AV, Hocsak E, Zarandi M, Rick F, Bellyei S. The effect of a novel antagonist
of growth hormone releasing hormone on cell proliferation and on the key cell signaling pathways
in nine different breast cancer cell lines. Int J Oncol. 2011 Oct;39(4):1025-32.
[IF: 2.571] (2010)

95
2. Papadia A, Schally AV, Halmos G, Varga JL, Seitz S, Buchholz S, Rick FG, Zarandi M, Bellyei
S, Treszl A,. Lucci JA. Growth hormone releasing-hormone antagonist JMR-132 inhibits growth
of ES-2 clear cell human ovarian cancer. Horm Metab Res. 2011. Accepted for publication.
[IF: 2.414] (2010)
3. Kovacs M, Schally AV, Hohla F, Rick FG, Pozsgai E, Szalontay L,. Varga JL, Zarandi M. A
correlation of endocrine and anticancer effects of some antagonists of GHRH. Peptides. 2010
Oct;31(10):1839-46. [IF: 2.654]
4. Pozsgai E, Schally AV, Varga JL, Halmos G, Rick F, Bellyei S. The inhibitory effect of a novel
cytotoxic somatostatin analogue AN-162 on experimental glioblastoma. Horm Metab Res. 2010
Oct;42(11):781-6. [IF: 2.414]
5. Hohla F, Buchholz S, Schally AV, Krishan A, Rick FG, Szalontay L, Papadia A, Halmos G,
Koster F, Aigner E, Datz C, Seitz S. Targeted cytotoxic somatostatin analog AN-162 inhibits
growth of human colon carcinomas and increases sensitivity of doxorubicin resistant murine
leukemia cells. Cancer Lett. 2010 Aug 1;294(1):35-42. [IF: 4.864]
6. Kanashiro-Takeuchi RM, Tziomalos K, Takeuchi LM, Treuer AV, Lamirault G, Dulce R,
Hurtado M, Song Y, Block NL, Rick F, Klukovits A, Hu Q, Varga JL, Schally AV, Hare JM.
Cardioprotective effects of growth hormone-releasing hormone agonist after myocardial
infarction. Proc Natl Acad Sci USA. 2010 Feb 9;107(6):2604-9. [IF: 9.771]
7. Hohla F, Buchholz S, Schally AV, Seitz S, Rick FG, Szalontay L, Varga JL, Zarandi M, Halmos
G, Vidaurre I, Krishan A, Kurtoglu M, Chandna S, Aigner E, Datz C.GHRH antagonist causes
DNA damage leading to p21 mediated cell cycle arrest and apoptosis in human colon cancer cells.
Cell Cycle. 2009 Oct 1;8(19):3149-56. [IF: 4.087]
8. Buchholz S, Seitz S, Schally AV, Engel JB, Rick FG, Szalontay L, Hohla F, Krishan A, Papadia
A, Gaiser T, Ortmann O, Brockhoff G, Koster F. Triple negative breast cancers express receptors
for LHRH and their growth can be inhibited by the LHRH antagonist Cetrorelix. Int J Oncol.
2009 Oct;35(4):789-96. [IF: 2.447]
9. Treszl A, Schally AV, Seitz S, Szalontay L, Rick FG, Halmos G. Inhibition of Human Non-Small
Cell Lung Cancers with a Targeted Cytotoxic Somatostatin Analog, AN-162. Peptides. 2009
Sep;30(9):1643-50. [IF: 2.705]
10. Seitz S, Schally AV, Treszl A, Papadia A, Rick F, Szalontay L, Szepeshazi K, Ortmann O,
Halmos G, Buchholz S. Preclinical evaluation of properties of new targeted-cytotoxic
somatostatin analogue AN-162 [AEZS-124] and its effects on tumor growth inhibition.
Anticancer Drugs. 2009 Aug;20(7):553-8. [IF: 2.23]
11. Hohla F, Schally AV, Szepeshazi K, Varga JL, Buchholz S, Koster F, Heinrich E, Halmos G,
Rick FG, Kannadka C, Datz C, Kanashiro CA. Synergistic inhibition of growth of lung
carcinomas by antagonists of growthhormone-releasing hormone in combination with docetaxel.
Proc Natl Acad Sci USA. 2006 Sep 26;103(39):14513-8. [IF: 9.643]
2. Citable abstracts:
1. Kanashiro-Takeuchi RM, Takeuchi LM, Rick FG, Dulce RA, Treuer A, Paulino EC, Hatzistergos
KE, Gonzalez DR, Hu Q, Block NL, Schally AV, Hare JM. Growth hormone relasing hormone
(GHRH) receptor dependency for cardioprotective repair. American Heart Association Scientific
96
Sessions, November 12-16 2011, Orlando, FL. Abstract No. 2011-SS-A-13849-AHA. Published
in Circulation 2011. [IF: 14.429] (2010)
2. Kovacs M, Schally AV, Hohla F, Rick FG, Pozsgai E, Szalontay L, Varga J, Zarandi M. A
correlation of endocrine and anticancer effects of some antagonists of GHRH. Endocrine
Reviews, Supplement 1, June 2010, 31(3):S1293. [IF: 22.469]
3. Abdel Wahab M, Schally AV, Rick FG, Szalontay L, Mahmoud O, Shi Y-F, Zarandi M, Varga
JL. Antagonists of growth hormone releasing hormone (GHRH-A) given after radiation for
prostate cancer tumors enhance tumor response through gene regulation. International Journal of
Radiation Oncology Biology Physics. 2010 78(3):S649. [IF: 4.503]
4. Abdel-Wahab M, Schally AV, Rick FG, Szalontay L, Varga J, Shi Y, Zarandi M, Pollack A.
Antagonists of growth hormone releasing hormone potentiate radiation response in prostate
cancer. J Clin Oncol 2010;28(15). [IF: 18.97]
5. Papadia A, Schally AV, Seitz S, Buchhols S, Rick FG, Szalontay L, Bellyei S, Pozsgai E,
Halmos G, Block N, Lucci J. Inhibition of growth of HEC-1-A and HEC-1-B human endometrial
cancer by growth hormone releasing hormone antagonist JMR-132. Gynecologic Oncology
2010;116(3):596. [IF: 3.76]
6. Seitz S, Schally AV, Rick F, Weber F, Ortmann O, Buchholz S. Wirkung der kombinierten
Behandlung mit dem GHRH-Antagonisten JMR 132 und Docetaxel in triple negativen
Mammakarzinomen. Senologie - Zeitschrift für Mammadiagnostik und –therapie 2010;7:A166.
7. Kanashiro-Takeuchi RM, Tziomalos K, Takeuchi LM, Hurtado M, Song Y, Treuer A, Dulce R,
Block NL, Rick FG, Hu Q, Varga JL, Schally AV, Hare JM. Growth-Hormone-Releasing-
Hormone (GHRH) Agonist as a Potential Cardioprotective Agent in Rats with Post-Myocardial
Infarction (MI). Circulation 2009;120:S868. [IF: 14.816]
8. Abdel-Wahab M, Schally AV, Szalontay L, Rick FG, Varga JL, Y-F Shi, Zarandi M, A Pollack,
Duncan R. Radioprotection by Antagonists of Growth Hormone Releasing Hormone given before
Whole Body Radiation is dependent on the Radiation Dose. Int J Radiat Oncol Biol Phys
2009;75(3):S552-553. [IF: 4.592]
9. Abdel-Wahab M, Schally AV, Szalontay L, Zarandi M, Varga JL, Pollack A, Rick FG. The use
of antagonists of growth hormone releasing hormone (GHRH) radioprotect tumors in vivo.
Radiother Oncol 2009;90(suppl 3):S113. [IF: 4.343]
10. Abdel-Wahab M, Schally AV, Szalontay L, Rick FG , Varga JL, Zarandi M, Pollack A. Use of
antagonists of growth hormone releasing hormone for protection during whole body radiation.
Radiother Oncol 2009; 90(suppl 3):S107. [IF: 4.343]
11. Seitz S, Schally AV, Rick FG, Szalontay L, Ortmann O, Buchholz S. Effective treatment of triple
negative breast cancer with targeted cytotoxic somatostatin analogue AN-162 [AEZS-124].
Journal of Clinical Oncology 2009;27(15). [F: 17.793]
12. Seitz S, Schally AV, Papadia A, Rick FG, Szalontay L, Ortmann O, Engel J, Koster F, Buchholz
S. Combination of antagonists of growth hormone-releasing hormone with docetaxel as potential
therapy in breast cancer in a preclinical study. Breast 2009;18:S54. [IF: 2.087]
13. Papadia A, Schally AV, Seitz S, Buchholz S, Holha F, Szalontay L, Rick FG, Lucci J.
Experimental therapy of ES-2 human platinum-resistant ovarian cancer with growth hormone-

97
releasing hormone antagonist JMR-132 or with targeted cytotoxic analog of somatostatin AN-
162. Gynecologic Oncology 2009;112(2):S128-9. [IF: 3.733]
14. Seitz S, Schally AV, Rick F, Papadia A, Köster F, Engel J, Hönig A, Ortmann O, Buchholz S.
Präklinische Studie zu dem zytotoxischen Somatostatinanalog AN-162 [AEZS-124] in der
Therapie des rezeptornegativen Mammakarzinoms. Senologie - Zeitschrift für Mammadiagnostik
und –therapie 2009; 6:A113.
15. Seitz S, Rick F, Papadia A, Schally AV, Köster F, Engel J, Ortmann O, Buchholz S. Potente
Tumorinhibition des neuen GHRH Antagonisten JMR-132 im Östrogen Rezeptor negativen
Mammakarzinom. Senologie - Zeitschrift für Mammadiagnostik und –therapie 2008;5:A133.
16. Abdel-Wahab M, Schally AV, Szalontay L, Zarandi M, Varga JL, Pollack A, Rick FG.
Antagonists of growth hormone releasing hormone prostect tumors in vivo when given before
radiation. Indian J Radiat Res 2008;5(3-4):203.
17. Abdel-Wahab M, Schally AV, Szalontay L, Rick FG , Varga JL, Zarandi M, Pollack A.
Antagonists of growth hormone releasing hormone given before whole body radiation have
protectivce effects. Indian J Radiat Res 2008;5(3-4):203.
3. Further abstracts:
1. Abdel-Wahab M, Schally AV, Szalontay L, Rick FG, Varga JL, Y-F Shi, Zarandi M, Pollack A,
Duncan R. Dose-dependent Radioprotection by Antagonists of Growth Hormone Releasing
Hormone given before Whole Body Radiation is dependent on organ-specific upregulation of
target genes. American Radium Society 92nd Annual Meeting, May 1-5, 2010, Cancun, Mexico.
Also printed in Oncology. [IF: 2.112]

98
9. Acknowledgements
I am grateful to Professor Magdolna Kovacs, who has introduced me to academic research when I
was a medical student and has been a wonderful mentor over the years. Without her persistent
encouragement, support and helpful advices I would not have been able to accomplish what I have
achieved.
I would like to express the deepest appreciation to Dr. Andrew V. Schally, my chief and mentor, who
has supported me and my work and continually conveyed a spirit of adventure in regard to research.
This dissertation would not have been possible without his guidance and kind support.
Here I would like to express my appreciation to Dr. Norman L. Block for his support and guidance
in urologic research.
I wish to thank to Dr. Zoltan Rekasi, my mentor for his encouraging support and teaching.
I am also thankful to all my colleagues at the Department of Pathology, University of Miami, Miller
School of Medicine and Endocrine, Polypeptide and Cancer Institute, Veterans Affairs Medical
Center and South Florida Veterans Affairs Foundation for Research and Education, Miami, especially
to Dr. Luca Szalontay, Dr. Karoly Szepeshazi, Dr. Marta Zarandi, Dr. Roberto Perez, Dr.
Mehrdad Nadji, Dr. Ren-Zhi Cai, Dr. Jozsef L. Varga, Irving Vidaurre, Ricardo Rincon and
Benny Fernandez for their friendly support and helpful advices.
Last, but not least, I express my most sincere thank and eternal gratitude to my family for their love,
sacrifice and encouraging support.