effects of an information sharing system on employee ... files/17-094_a3234794-0c32-423b... ·...
TRANSCRIPT

Effects of an Information Sharing System on Employee Creativity, Engagement, and Performance
Shelley Xin Li Leventhal School of Accounting
University of Southern California, Los Angeles, CA 90089
Tatiana Sandino* Harvard Business School
Harvard University, Boston, MA 02163
December 31, 2017
Forthcoming in the Journal of Accounting Research
Abstract
Many service organizations rely on information sharing systems to boost employee creativity to meet customer needs. We conducted a field experiment in a retail chain, based on a registered report accepted by JAR, to test whether an information sharing system recording employees’ creative work affected the quality of creative work, job engagement, and financial performance. We found that, on average, this system did not have a significant effect on any outcomes. However, it significantly improved the quality of creative work in stores that had accessed the system more frequently and in stores with fewer same-company nearby stores. It also improved creative work and job engagement in stores in divergent markets, where customers needed more customization. We found weak evidence of better financial results where salespeople had lower creative talent before the system was introduced. Our findings shed light on those conditions in which information sharing systems affect employees’ creative work.
* Corresponding author’s contact information: Morgan Hall 367, Harvard Business School, Boston MA 02163 E-mail: [email protected]; Phone: (617) 495-0625 Accepted by Douglas Skinner. This paper is the final Registered Report resulting from the Registration-based Editorial Process (REP) implemented by JAR for its 2017 conference; details of the process are available here https://research.chicagobooth.edu/-/media/research/arc/docs/journal/rep_policies_jar.pdf?la=en&hash=B64B8F1D368D8300BC83898C7E5CFD0557E71312. The accepted proposal for this report is available here https://research.chicagobooth.edu/-/media/research/arc/docs/jar-annual-conference-papers/li-sandino-accepted-proposal.pdf?la=en&hash=2F0A8B7507E4A154CF431368467CA290AC92CFD4. For helpful comments, we thank two anonymous reviewers at the Journal of Accounting Research, Dennis Campbell, and participants at a brown bag seminar at Harvard Business School and at the 2017 JAR conference. We also thank Seth Bruder and Bob Freeman for technical help setting up the apps for the experiment, Mayuresh Kumar, Andrew Marder, and Kyle Thomas for research assistance, and the people at the mobile phone retail company who agreed to collaborate with us on this field experiment for supporting us with the development of this project. All errors are our own.
2
1. Introduction
Service and retail organizations often need to understand and satisfy customer needs on a timely
basis. To do so, they tend to allocate greater decision authority to frontline employees, who better
understand local customers than headquarters does (Baiman, Larcker, and Rajan [1995], Fladmoe-
Lindquist and Jacque [1995], Aghion and Tirole [1997], Dessein [2002], Campbell, Datar, and
Sandino [2009]). However, despite the perceived value in employees’ local creativity and the
formally granted permission to experiment, not all employees use discretion to generate creative
ideas (Campbell [2012]).
We examine the role that an information sharing system recording employees’ creative work
(hereafter ISSC) can play in ongoing local experimentation and, more specifically, in employees’
creative efforts. We report results from a natural field experiment that we developed based on a
registered report to test the effects of implementing an ISSC on the quality of creative work, job
engagement, and financial performance.1
In practice, it’s unclear whether an ISSC promotes experimentation and yields positive
performance outcomes. It might yield significant benefits by (a) providing employees with greater
access to information, thus enhancing their creative abilities through a more diverse pool of ideas
than their initial set, and/or (b) affecting their engagement by increasing accountability for the
quality of their creative work. Yet, an ISSC may impose costs if it unintentionally leads employees
to reduce experimentation and conform to a common norm. Employees might reduce
experimentation to minimize risk (if they fear that novel work would be judged negatively by
1 For our purposes, we assess the quality of creative work based on Hennessey and Amabile’s [2009] definition of what creative work should involve: “the development of a novel product, idea, or problem solution that is of value to the individual and/or the larger social group” (p. 572).

3
peers), if they free-ride on their peers by copying their creative work, or if they feel threatened that
their peers will free-ride on them (Arrow [1962]).
We partnered with a mobile phone retail company in India (hereinafter MPR) to develop a field
experiment testing the effects of implementing an ISSC. MPR operates 42 company-owned stores
in an emerging market where customization of the sales process is essential to compete with local
mom-and-pop shops. As with many other customer-focused retailers, idea generation based on the
local environment is essential at MPR’s stores. The salespeople create hand-made sales posters to
attract local customers’ attention and to explain promotions, which are updated by the retailer
and/or its suppliers weekly. Figure 1 presents examples of such posters.2
MPR collaborated with us by pilot-testing an ISSC (a Web app) showcasing the sales posters
developed by the salespeople at a subset of its stores. We randomly assigned stores to a treatment
group, where we introduced the ISSC, or a control group that had no ISSC. The ISSC website was
smart-phone accessible by store managers and salespeople working at treated stores; they could
both upload posters and browse other people’s posters.3 Although the salespeople had produced
such posters routinely prior to this experiment, the posters had never been shared across stores.
We measured our main outcomes of interest as follows. We measured creativity on two
dimensions: value (measured on a 1-5 scale capturing the poster’s ability to communicate the
products and deals offered) and novelty (measured on a 1-5 scale capturing the poster’s ability to
grab customer attention). We used the weekly attendance of a salesperson working for a particular
2 As Figure 1 shows, the quality of these posters in terms of their value (how useful they are at communicating the essence of the deals) and their novelty (how visually appealing they are) varies significantly across stores. 3 Exposure of the posters on the website was mandatory. Store managers and managers at the headquarters followed up with all the salespeople in the treatment stores during the monthly “uploading” period to make sure that every salesperson’s poster was in the system.

4
brand at a given store (measured as days per week) as a proxy for job engagement and weekly
sales at the store-brand level to measure financial performance.
The registered report process guided our execution and enhanced reliability in two ways. First, it
encouraged us to conduct a natural field experiment design, which provided us with significant
advantages. We were able to draw causal inferences, thanks to the random selection of our
treatment store-brands, and we could examine the effects of an ISSC in a natural context (Bandiera,
Barankay, and Rasul [2011], Floyd and List [2016]). Furthermore, because our study was a natural
field experiment, subjects were unaware that they were participating in a study. Thus, we avoided
self-selection and could discard “Hawthorne effect” alternative explanations. Second, before
executing our field experiment, we submitted a registered report proposal in which we committed
to conducting a specific set of analyses to test our main hypotheses and delve into the tradeoffs
underlying those hypotheses. Having made this commitment, we neither restated our hypotheses
nor conducted any unplanned analyses except for expanding the “Additional Analyses” in the
accepted proposal from analyzing financial outcomes to analyzing all of our three stated outcomes
of interest and conducting various robustness tests. Our hypotheses were articulated based on
theory instead of ex-post-facto rationalization of results and our analyses were based on a carefully
crafted research design (refined through multiple rounds of reviews) rather than on data mining.
Based on our power analyses, we are 80% confident that, on average, the ISSC did not change the
quality of creative work measures by 0.18 points or more, attendance by 0.23 days/week or more,
or sales by 13% or more; that is, the effects were not statistically significant at conventional levels.
However, our additional planned tests show that ISSC did have a positive and significant effect on
the quality of creative work (and to a limited extent, on sales and attendance) when it was more
5
frequently accessed. In the stores where the system was used most often, its effect was associated
with an increase in the value (novelty) of creative work of 0.40 (0.23) points.
As stated in the accepted proposal, we also explored three conditions that could have affected the
ISSC’s impact: the users’ natural exposure to others’ ideas, the ex ante creative talent of the
individuals, and the type of market served (mainstream vs. divergent). On the first condition, we
find that the ISSC was associated with greater quality of creative work (an increase of 0.38 points
in the value of creative work and 0.29 points in the novelty of creative work) in stores that had
fewer than the median number of same-company nearby stores. This suggests that the system
helped most where salespeople had generally less exposure to others’ creative work. Yet the
system was also associated with a 0.30 decrease in the novelty of creative work in stores near other
branches of the chain. This is consistent with salespeople at those stores feeling concern about
their peers’ free-riding. On the second condition (creative talent), we find that the system led to
better financial results (a 25% increase in sales) for store-brands with salespeople whose ex ante
creativity was below the median, suggesting that they may have had more to learn from others’
work. Finally, on the third condition (mainstream vs. divergent stores), we find that, at divergent
stores, the ISSC was associated with a 0.28-point increase in the value of creative work and a 0.24-
days increase in the weekly attendance of salespeople.4 This was consistent with the idea that
stores requiring greater customization benefit more from the system.
4 Campbell et al. (2009) describe divergent units as those operating in markets where the customers’ characteristics differ from the characteristics of the customers served by the average business unit of the organization. The study finds that organizations are more likely to delegate decision rights and provide results-based incentives to the local managers of divergent units, consistent with the idea that these local managers have a significantly better understanding of their units’ customers than the headquarters does. To operationalize this construct, we asked the manager to identify as “divergent stores” those where the salespeople had to customize the service more than usual due to distinctive customer needs (e.g., stores where customers spoke other languages, communities were distinctive in a way that distinguished them from those of the chain’s mainstream stores, and/or customers were significantly more demanding, typically in higher-income areas).

6
In summary, although the introduction of the ISSC at our site did not lead to significant
improvement in average outcomes, it was associated with improvement in the quality of creative
output when accessed frequently and/or where information was most needed (i.e., where the
salespeople were less exposed to others’ ideas or where they needed to tailor their efforts to specific
customers’ needs). Furthermore, the system was associated with better financial performance for
store-brands that initially had less-creative teams and with greater job engagement in divergent
markets demanding greater customization.
Our study contributes to three streams of literature. First, we contribute to the accounting literature
that examines the effects of management control systems on the quality of employees’ creative
work. This literature has largely focused on incentive pay; for instance, laboratory experiments
show that individual rewards for quantity of creative output work better than individual rewards
for creativity-weighted quantity of output (Kachelmeier, Reichert, and Williamson [2008],
Kachelmeier and Williamson [2010]). Chen, Williamson, and Zhou [2012] find that, when
rewarding workers for creativity, group-based tournament incentives better promote group
creativity than either individual-based tournament incentives or group-based piece-rate incentives.
Our study, however, focuses on a management control system—specifically, an ISSC—that gives
employees access to information that not only could affect their motivation to be creative, but
could also enhance the knowledge and skills needed for creativity. Our study finds that these
positive effects materialize only when users interact frequently with the system, have a limited
supply of ideas, and/or have a greater need for ideas to customize their creative work.
Second, this study adds to the accounting literature on the effect of increased access to information
on decision outcomes. Prior studies have found that the implementation of information sharing
7
systems is associated with better decision quality and financial performance (Banker, Chang, and
Kao [2002], Campbell, Erkens, and Loumioti [2014]). We hypothesize and find that ISSC can also
affect creativity and engagement (a) when users interact frequently with the system and/or (b)
when they have greater need to learn about and implement creative ideas.
Third, we contribute to the literature on new-knowledge-creation theory that studies how
information sharing systems affect brainstorming sessions. In two laboratory experiments, Dennis
and Valacich [1993] and Girotra, Terwisch, and Ulrich [2010] find that information sharing
systems can increase the number and quality of ideas generated as well as the participants’
satisfaction in group brainstorming sessions. To our knowledge, our study is the first to examine
whether an ISSC can enhance the creative work of individuals.
Beyond contributing to the academic literature, our study aims to shed light on a topic of great
interest to the business community, which increasingly seeks ways to leverage information
networks to increase employee interactions and exchanges of ideas.
The rest of this report is organized as follows. Section 2 presents our hypothesis development.
Section 3 describes our research method and setting. Section 4 describes our research design,
presents our analyses, and discusses our findings. Section 5 concludes.
2. Related Literature and Hypothesis Development5
Prior research on service organizations has found that many so-called empowered frontline
employees fail to use their discretion creatively to meet the needs of local customers (Campbell
5 Consistent with the registered report process, the theory and hypotheses did not change after the acceptance of our proposal.
8
[2012]). An emerging literature has identified management control tools that organizations can use
to motivate local experimentation, including long-term incentives, tolerance for early failures, and
the recruitment of employees who like to experiment with decisions (Manso [2011], Campbell
[2012]). However, to our knowledge, this literature has ignored ISSCs, an important control
mechanism used extensively to promote creativity.6
While prior studies have shown that information sharing systems can benefit organizations (e.g.,
Kulp [2002], Kulp, Lee, and Ofek [2004], Devaraj, Krajewski, and Wei [2007], Campbell, Erkens
and Loumioti [2014]), they have focused on improvements in coordination and decision making
rather than on improvements in creativity and local experimentation. Whether such systems can
improve creativity is unclear. On the one hand, sharing ideas enhances creativity (Nonaka [1994],
Nonaka and Krough [2009]). Research also suggests that encouraging individual creativity can
lead to greater task engagement and learning (Conti, Amabile, and Pollack [1995]). On the other
hand, sharing creative ideas can lead to a reduction of effort through free-riding and fewer new
ideas (Arrow [1962], Dyer and Nobeoka [2000]).
Our main objective is to examine whether an ISSC ultimately leads to better financial performance.
However, we first develop hypotheses on the intermediate outcomes that can affect financial
performance (i.e., quality of creative work and employee engagement).
2.1. Effect on the Quality of Creative Work
Customer-focused service organizations that require employees to apply discretion and creativity
usually can’t specify in advance all the tasks employees should do to engage and serve customers
6 According to a survey conducted by McKinsey Global Institute [2012, p. 12], approximately 70% of companies use information sharing systems (termed “social technologies” in their report), not only to improve collaboration and communication but also to “unleash creative forces among users.”

9
effectively (Banker et al. [1996]). Much of the information on which empowered employees make
decisions is idiosyncratic (Campbell, Erkens, and Loumioti [2014]). Effective employees rely on
tacit knowledge; that is, know-how which is difficult to transmit through explicit means and can
only be obtained through engaging in practical activities, interacting with mentors, and observing
experienced colleagues (Polanyi [1966], Tsoukas [2003]).
For two reasons, ISSCs have the potential to overcome some of the limitations of traditional
management control systems that rely on explicitly stated goals (e.g., monitoring and incentive
systems). First, ISSCs can expose employees to a broad and diverse pool of ideas from their peers,
helping them acquire tacit knowledge or useful skills. Organizational knowledge-creation theory
states that employees exposed to other people’s ideas are more likely to reflect on their own
practices and discover new ways to do their jobs (Nonaka [1994], Nonaka and Krough [2009]).
According to Nonaka and Krough [2009, p. 645], “by bringing together different biographies,
practitioners gain ‘fresh’ ideas, insights, and experiences that allow them to reflect on events and
situations.… Practitioners’ diverse tacit knowledge, that they particularly acquired in their diverse
social practices, is a source of creativity.” Consistent with this theory, Chen, Williamson, and Zhou
[2012] find that tournament rewards for creativity are more likely to result in creative solutions
when awarded to teams rather than to individuals. The organizational knowledge-creation
literature also suggests that the process by which ideas are shared in electronic ISSCs enhances
creativity more effectively than the process by which individuals usually share ideas face to face.
Electronic ISSCs enable individuals to work alone and share ideas at different times, preventing
the “production blocking” that can occur when individuals must produce ideas in meetings where
they need to take turns to speak up (Dennis and Valacich [1993], Girotra, Terwiesch, and Ulrich
[2010]).

10
Second, by exposing employees’ creative work to superiors and/or peers, ISSCs could motivate
high-quality creative work more effectively than monitoring or rewards could, given the difficulty
of explicitly measuring creativity. The most creative workers might feel motivated, knowing that
their work could impact others and be recognized within the organization; the least creative
workers might try to avoid exposing work they aren’t proud of.
But ISSCs could also backfire because individuals exposed to others’ creative work might
converge on doing work in similar ways, decreasing overall creativity. This might result from an
unconscious attempt by employees to identify and emulate common features of their peers’
creative work or from the employees’ decision to neither pursue nor present their most original
ideas for fear of being judged negatively (Diehl and Stroebe [1987]). Furthermore, the exchange
of creative ideas among a group of employees could lead to a type of free-riding (Alchian and
Demsetz [1972]), which could inhibit creativity if individuals copy others’ ideas without attending
to their distinctive circumstances or if they decrease their efforts to produce high-quality work for
fear of being copied.
The conflicting arguments described above suggest that introducing an ISSC could either increase
or decrease the quality of creative work.7 We therefore hypothesize:
Hypothesis 1a: The introduction of an information sharing system recording creative work
(ISSC) will lead to an increase in the quality of the employees’ creative work.
7 To achieve high creativity in any particular domain, an individual needs domain-relevant skills, creativity-relevant skills, and task motivation (Amabile [1988]). We could argue that an ISSC is likely to help the individual acquire better domain-relevant skills and to increase task motivation. However, the effect on creativity-relevant skills is unclear. Therefore, we might see an increase in the value of creative work due to greater domain-relevant skills (or task-relevant tacit knowledge) but a decrease in novelty due to free-riding, inability to acquire creativity-relevant skills, and convergence on a few ideas. When measuring the quality of creative work, we will distinguish between the value of the work (reflecting domain-relevant skills) and its novelty (reflecting creativity-relevant skills).

11
Hypothesis 1b: The introduction of an information sharing system recording creative work
(ISSC) will lead to a decrease in the quality of the employees’ creative work.
2.2. Effect on Employee Engagement
Prior research suggests that the three key antecedents of employee engagement (i.e., the investment
of an individual’s complete self into his/her work) are the individual’s sense that his/her work is
meaningful and valuable, the sense that he/she is capable of performing this work, and his/her
perceptions regarding organizational support (Kahn [1990], Rich, Lepine, and Crawford [2010]).
ISSCs have the potential to enhance engagement through all of these mechanisms. ISSCs can
increase a worker’s sense of value by increasing both the expected impact his/her work could have
on others and the worker’s potential to be recognized by superiors and peers. These systems also
have the potential to develop an individual’s abilities and his/her confidence in those abilities to
produce creative work. Furthermore, ISSCs can be seen as a means by which individuals receive
organizational support.
In addition to this, ISSCs typically stimulate greater participation in creative activities and a more
active and extensive search for information. Participation in information sharing may in turn
increase engagement, regardless of the quality of the individuals’ creative work.
However, ISSCs could also unintentionally increase fears of being singled out, evaluated, or
embarrassed in front of peers, leading to an overall loss of confidence (Diehl and Stroebe [1987],
Toubia [2006]). Fear of free-riding could also lead individuals to withdraw from investing in
producing high-quality creative work. These two unintended effects would most likely reduce
employee engagement. Given the unclear effect that ISSCs would have on engagement, we split
our second hypothesis as follows:

12
Hypothesis 2a: The introduction of an information sharing system recording creative work
(ISSC) will lead to an increase in employee engagement.
Hypothesis 2b: The introduction of an information sharing system recording creative work
(ISSC) will lead to a decrease in employee engagement.
2.3. Effect on Financial Performance
Customer-focused service organizations that unleash the engagement and creativity of their
employees should expect improved financial performance. Sales employees exposed to the
creative work of peers and more engaged with their own creative work can be expected to have
greater mastery of the brands and deals offered at their stores. Consequently, they should be better
able to communicate these offerings and relate them to customer needs, even if the quality of their
creative work may not improve significantly. Prior studies on employee engagement demonstrate
that highly engaged employees perform better, since they not only exert greater physical effort but
also focus their cognitive and emotional energies (Kahn [1990], Rich, Lepine, and Crawford
[2010]). These arguments suggest that the direction in which the implementation of an ISSC will
affect financial performance will depend on its effect on the quality of creative work and its effect
on employee engagement. Following the predictions above, we state our third hypothesis as
follows:
Hypothesis 3a: The introduction of an information sharing system recording creative work
(ISSC) will lead to an increase in financial performance.
Hypothesis 3b: The introduction of an information sharing system recording creative work
(ISSC) will lead to a decrease in financial performance.
13
3. Research Method and Setting
We test our hypotheses by running a field experiment in a mobile phone retail chain (MPR) in
India that operated 42 company-owned stores as of September 1, 2016. On that date, the
company introduced a pilot project to a random group of stores to test the effects of an ISSC.
The system consisted of a Web app that displayed sales posters generated by salespeople from
different stores in different markets. The managing director of the company performed the pilot
project as a natural field experiment, following our instructions.
MPR operates in a highly dynamic and locally idiosyncratic competitive environment. Its primary
competitors are small independent sellers of handsets and connection services who, through their
intimate local knowledge, can quickly respond to customer needs. Its second-most relevant set of
competitors are online retailers, who often offer lower prices. To compete, MPR (a) offers
attractive promotion deals that make customers feel they are getting more value for the prices
offered, (b) provides an extensive assortment of products and services to better match customer
needs, and (c) has trustworthy, high-quality service. MPR’s business strategy and commercial
success needs salespeople at the store level to effectively convey the value of products or services.
MPR stores are typically staffed by a manager, a cashier, and promoters representing various
brands (connection providers, insurance providers, credit providers, and handset manufacturers).
The managers and cashiers are employed directly by MPR, while the promoters are hired and paid
by the suppliers they represent. A promoter’s pay typically includes a salary component and/or a
sales commission component. MPR itself occasionally offers promoters incentives for strong sales
performance as well as the chance to become cashiers or store managers.8 None of the explicit
8 The performance-based incentive structure at this setting is typical for the retail industry.
14
incentives promoters receive, however, are related to the quality of the posters or any other creative
work they produce.
Both MPR and its suppliers offer attractive packages, including bundles of handsets and
connections, accessories, different credit options, and promotional rewards (hereinafter called
promotion deals). Promoters advertise these promotion deals by making their own sales posters
and displaying them in the stores.
The mobile phone retailing industry in India is competitive. Promotion deals are updated weekly.
Good sales posters clearly communicate the essence of the latest deals through a creative visual
design that grabs people’s attention and draws them into the store. Even after customers enter the
store, promoters often refer to the posters as they explain the offering and make their sales pitch.
(See Figure 1 for a sample of the posters designed by promoters.)
Designing these sales posters requires (a) a deep understanding of the local customer base (e.g.,
what deals and features would be most appreciated by the customers in a specific region and what
language is required to connect with them) and (b) a great deal of creativity (e.g., presenting the
important features of the deals in a clear and visually appealing way). MPR realized that motivating
promoters to generate more creative and eye-catching posters is a very important part of success
in this market. However, although brand promoters create sales posters as a part of their sales
effort, only a handful of them have consistently generated appealing ones. Many promoters either
exert little effort or lack the skills to come up with creative visual designs (Figure 1).
The company started up its ISSC to engage more promoters in poster-making and to increase the
overall quality and effectiveness of these posters.

15
This setting provides us with a valuable opportunity to test our hypotheses. First, it exemplifies a
typical setting in which ISSCs might add significant value: retail chains that differentiate on
customer service and rely on the empowerment and creativity of their frontline staff to deliver
customer value. Second, creative output in the natural work environment is generally difficult to
measure. Sales posters developed at the store level enable us to reasonably measure the quality of
creative work, identifying the two main aspects that the literature highlights regarding the quality
of creative work: value and novelty (Hennessey and Amabile [2009]). Furthermore, sales posters
are a natural part of the frontline salespeople’s work at this company and directly attract local foot
traffic and generate sales. Our findings are generalizable to any service organization settings in
which frontline employees’ participation in creative outputs is valuable and an important driver of
financial performance and where such employees have implicit or explicit incentives linked to
financial performance.
4. Research Design, Analyses, and Results
4.1. Description and Timeline
4.1.1. General Description of the Experiment
We planned our study as an eight-month field research experiment from May 1, 2016 to December
31, 2016. During the experiment, a need emerged to extend the experiment to January 31, 2017
due to an exogenous economic shock in India in November that significantly affected the retail
sector and, in particular, our research site. 9 Therefore our main analyses exclude data from
9 On November 8, 2016, the Indian government announced the demonetization of Rs. 500 and Rs. 1,000 currency notes. This caused chaos as ordinary citizens lined up to exchange their notes for Indian rupees and customer-facing businesses struggled to adapt to the change in currency. As a result, the monthly update of the information sharing system at our research site was delayed from early November to late November (which caused the December system update to be delayed as well). Given that the demonetization disrupted MPR’s normal business operations, especially in November, we extended the experimental period until the end of January 2017. This gave us enough time to reestablish normal operations and for the delayed system updates to play out their effects.

16
November 2016 but include data from January 2017. This maintains the same number of months
that we originally planned to include in the pre- and post-experimental periods according to our
registered report and minimizes the impact of the economic shock on our analyses.
The participants in this experiment were all the brand promoters at MPR. As of September 1, 2016,
36 of the 42 stores had at least one brand promoter. On average, these 36 stores had six brands
with promoters per store and six promoters per store. (MPR generally assigns a single promoter
for a given brand to each store. In less than 10% of the cases, it has two or more promoters of the
same brand in the same store.) We randomly assigned the 36 stores into two groups: treatment
group A (18 stores, 105 brands, and 106 promoters as of September 1, 2016) and control group B
(18 stores, 100 brands, and 104 promoters as of September 1, 2016).10
Our analyses test the effects of MPR’s ISSC at the treatment stores relative to the control group
on three outcomes at the store-brand level: the quality of creative work, job engagement, and
financial performance. We measure these outcomes using weekly data from archival sources from
MPR’s accounting and personnel databases and evaluations of the creative work by customers (as
explained below). We validate these measures using data from pre- and post-experimental surveys.
4.1.2 Timeline of the Field Experiment
Figure 2 shows the timeline of the field experiment, which we explain below.
Pre-intervention period. The first four months were the pre-intervention period. In June 2016
(month 2), we tested some of the data collection methods. (For details, see Online Appendix 4.) In
July 2016, the managing director sent out a memorandum to store managers and promoters under
10 In a few cases, store proximity could lead employees in the control stores to learn that an information sharing system was implemented in treated stores. We therefore bundled any stores close to each other. When randomizing the stores, we treated these bundles of stores as a unity to make sure that any bundles of stores fell (together) into the same treatment or control group.
17
both experimental conditions. The memorandum described the relevance of sales posters to the
brands’ sales, explained what a high-quality poster is, and let the salespeople know about company
resources they would use to prepare their posters. The director also asked store managers to
highlight the relevance of the sales posters to their staff. Sending the memorandum to both the
treatment and control groups (a) let the promoters and store managers know the importance of
sales posters and what good posters should look like and (b) held the information about the
importance of these posters constant across both experimental conditions. Online Appendix 1
shows the content of this memorandum (month 3 memorandum). We also conducted a pre-
experimental survey to measure the promoters’ engagement, their store managers’ assessment of
the quality of the creative posters, whether the promoters were motivated to produce creative work,
and the extent to which they had improved their skills to produce creative work over the prior
month. Whenever possible, we employed survey instruments validated by prior research to design
our questions. Online Appendix 2 presents the questions included in this survey. Finally, the
headquarters collected pictures of the posters displayed across all the stores for future customer
panel evaluations in month 3 (July 2016) and again in month 4 (August 2016), shortly before the
intervention.
Intervention. At the beginning of month 5 (September 2016), the managing director ran two
workshops on consecutive days (the first targeting control stores and the second treatment stores)
to highlight the relevance of creating posters and to introduce the treatment stores to the ISSC.11
She described what a high-quality poster is (emphasizing that posters should be useful and
11 The managing director believed that the ISSC had to be introduced and described in a workshop. Otherwise, it would be ignored. To avoid confounding the effect of the workshop with the effect of the ISSC, the authors of this paper asked the managing director to run workshops for both the control and treatment groups, differing only in the introduction of the ISSC.
18
attractive) and invited the promoters to work on posters for 30 minutes as they sat at tables
organized by store, which each had a stack of poster-making materials. The director asked each
store team to select its favorite poster and then asked the authors of the posters to explain how they
came up with their ideas. The workshops were identical, except that the workshop for the treatment
stores also included an introduction to and explanation of the ISSC.12 While the promoters and
store managers of the treatment stores were working on their posters, two facilitators helped them
access the ISSC Web app. To reinforce the messages communicated during the workshop, the
managing director sent a memorandum reminding all store teams of the relevance of producing
high-quality posters and reminding the staffs of treatment stores how to use the ISSC to upload
their posters into the system. Online Appendix 1 shows those two memoranda.
Post-intervention period. We collected data to evaluate the effects of the intervention during this
period. We gathered photos of the posters displayed across all the stores at two times: shortly after
the implementation of the ISSC (in week 1 of month 6; i.e., the beginning of October 2016) and
toward the end of the sample period (in week 4 of month 8; i.e., the end of December 2016).13 In
month 9 (January 2017), we also conducted a post-experimental survey that asked all of the store
managers to assess the promoters’ engagement, their motivation, and their ability to produce
posters. (See Appendix 2 for the post-experimental survey questions.) To capture qualitative
insights and users’ impressions of the system, we conducted 19 in-person interviews in January at
eight treatment stores, asking store managers and promoters to discuss their experience with the
12 One of the authors of the paper monitored the workshops in person to make sure that there were no technical difficulties launching the app and that the only difference between the groups was the explanation of how to use the ISSC. 13 This allowed us to test the effects of the ISSC on financial performance, engagement, and quality of creative work within one month of implementation, capturing initial reactions to it. Our tests include store-brands that had promoters before and after the intervention and take into account the effect of promoter turnover by including store-brand promoter tenure as a control variable.
19
ISSC. (See Online Appendix 3 for the interview questions.)
Day-to-day implementation of the information sharing system. The ISSC consisted of a Web app
where the promoters from the treatment group could continuously see the sales posters created by
other promoters and the store and brand for which each was made. On the back end, the app was
administered by the managing director, three other head office employees, the Web developer, and
the authors of this paper. The website enabled the promoters to observe all the posters created in
all stores in their mobile or desktop devices, to pick their favorite posters, and to search the posters
by brand, by store, or by favorites (see screenshots of this website in Figure 3). If, despite the
mandate, a promoter did not submit a poster, a blank space with an X and the words “No poster
was created” appeared above the name of the store-brand. The first set of pictures of sales posters
were taken and uploaded into the ISSC right after the system was introduced (September 2016).
From then on, store managers and promoters at the treatment stores were required to post their
pictures in the ISSC once a month (the first week of month 6, and the fourth week of months 7 and
8).14 The store managers and promoters of all the treated stores received an email following the
uploading and approval of the pictures every month to let them know the ISSC had been updated.
4.2. Data Collection and Measurement of the Main Variables of Interest
Table 1 Panel A provides descriptive statistics for our main variables of interest. We include
observations for which we have complete data to run our analyses: 4,818 store-brand-week
observations (including only those weeks when a promoter of the brand attended the store) and
544 store-brand-month observations when posters were collected for customer panel evaluations.
14 The original plan required the managers and promoters to upload new pictures on the first week of every month, but uploading was delayed in November and December due to the demonetization crisis.

20
4.2.1. Main Outcome Variables
We measure financial performance using store-brand sales data (largely attributed to the brand
promoters working at the store) from the company’s accounting system. Sales is defined as the
natural logarithm of the store-brand weekly sales.15 We exclude cases where the weekly sales for
the store-brand are less than or equal to zero. The average Sales at a store during our sample period
was 10.48 (about Rs.36,000, or US$ 540), but varied considerably from 0.69 to 14.52 (i.e., from
about Rs.2, or three US cents, to Rs.2 million or US$ 30,000).16
We asked a panel of customers to assess the quality of the sales posters, based on the photos of
683 unique posters collected during the pre- and post-intervention periods. Informed by the
creativity literature (e.g., Amabile [1988], Hennessey and Amabile [2009]), we obtained two
measures for the quality of creative work (adapted from Sethi, Smith, and Park [2001]) from the
customer panel, where we asked the customers to evaluate the value of the posters by assessing
their usefulness in communicating the products and deals offered and to evaluate the novelty of
the posters by assessing their visual attractiveness and ability to grab the attention of the
customers.17 The customer panel was convened after the experiment and included customers of the
two income groups that the company served (low and high). Each poster was evaluated by 8
customer panelists: 2 customers per income group × 2 income groups (low and high) × 2
dimensions (value and novelty). We created a software application to allow customers to
15 One of the 15 brands with in-store promoters provided credit services (Home Credit). Sales in this case are estimated as the sales amount of items purchased on credit. 16 We use an exchange rate of Rs. 66.5 (66.5 Indian rupees) for each US$ 1.00. 17 We focused on measuring the value and novelty of the creative output rather than the creativity of the person or the creative process, as prior literature has highlighted the complexities in—and lower reliability of—assessing person and process measures (Amabile 1988, p. 126)
21
consistently rate the posters in batches of 25. The batches were organized by brand and the
selection of posters for each batch was generated randomly, including posters collected throughout
the pre- and post- intervention periods. 18 This allowed us to hold constant the evaluating
circumstances and to make a fair comparison of the quality of creative posters drawn at different
times. We obtained ratings from 116 customers at five retail stores who agreed to evaluate up to
eight batches of posters each.
The customer panel measures include a value rating indicating how effective the poster is at
communicating the products or deals offered, using a not useful (1) – very useful (5) scale, and a
novelty rating indicating how much the poster’s visual design grabs the customer’s attention, using
a not attractive (1) – very attractive (5) scale. Online Appendix 4 explains in detail what the
customer panel did, presents the definitions that the customers read to rate the posters, and shows
the screenshots of the software application.
The intra-class correlation coefficient is 0.3917 for the four ratings received by each poster on the
value dimension and 0.3916 for the four ratings received by each poster on the novelty dimension
(both correlations are significantly different from zero, with a p-value<0.01). The four ratings that
each store-brand poster received for each dimension were averaged to obtain the main measures
used in our analyses, Value of creative work and Novelty of creative work.19 Examples of the
ratings are shown in Figure 1. As Table 1 Panel A shows, the average value rating for the posters
18 We decided to create batches per brand after noticing, during a pilot test, that some customers were sorting the posters based on brand preferences. 19 We also asked the promoters’ store managers to rate the posters in pre- and post-experimental surveys (see Online Appendix 2 for the questions). The store managers’ assessment was positively associated with the customers’ assessment of the quality of the promoters’ posters, estimated based on the average of the value and novelty ratings of the posters (correlation=10%, significant at a 10% level).

22
of a store-brand was 3.14 and the average novelty rating for a store-brand was 2.92.
Our main measure capturing job engagement is Attendance, a weekly measure of brand promoter
attendance.20 Table 1 Panel A reports that the promoters of a brand attended the store an average
of 5.33 days a week, with attendance ranging from 1 to 7 days a week. In addition, we constructed
measures of employee engagement through pre- and post-experimental surveys (see Online
Appendix 2). These measures are positively associated with Attendance, our proxy for engagement
(correlation=39.1%, significant at a 1% level).
4.2.2. Explanatory Variables
The main explanatory variables in our analyses are Info sharing (identifying treated stores) and
Post (identifying the period after the ISSC had been introduced). A similarly relevant variable is
Active access, the number of times the staff at each store accessed the system to upload or browse
posters during the post period. Table 1 Panel A shows that, although the average frequency of
access to the system was low, it ranged widely, from 4 to 122.
We also collected data from company records and surveys to construct control variables related to
store and promoter characteristics. Store characteristics include the number of promoters for each
brand at the store, store age and physical size, sales days (number of days in the week when the
store made sales), the number of nearby MPR stores, and the distance to MPR’s head office.
Promoter characteristics include tenure, gender, and pre-intervention measures for sales,
attendance, and quality of creative work. We define our variables in the Appendix. Table 1 Panel
20 We use average brand promoter attendance when a store has more than one promoter for a brand in a given week. Furthermore, we adjusted this measure to exclude cases when a new promoter did not last more than a week at MPR or when a promoter reported that s/he attended a store different from his/her home store for 2 or less days in a month. The latter situation happens because promoters occasionally visit other stores for a few hours for training purposes.

23
A shows significant variation across all these variables.
Table 1 Panel B compares the pre-intervention values of the main variables between the treatment
and control groups. There are no statistically significant differences in pre-intervention attendance,
value of creative work, and novelty of creative work between the two experimental conditions.
Despite the random assignment of treatment conditions, there were greater pre-intervention sales
for the treatment group and some differences in the pre-intervention covariate values between the
treatment and control groups. In our analyses, we control for all these covariates as well as for the
pre-intervention average values of the outcome variables.
Online Appendix 5 displays two correlation tables corresponding to the two samples. We used
these tables to assess the effect of MPR’s ISSC on weekly store-brand sales and store-brand
promoter attendance and on the quality of posters. These tables show insignificant correlations
between the main variables of interest (sales, attendance, and measures of the quality of creative
work) and the dummy variable for adopting the ISSC (Info sharing), but it does report (a) a general
increase in sales and attendance across both treatment and control stores after the ISSC was
introduced (Post) and (b) a significantly positive association between the salespeople’s access to
the ISSC and three of our four outcome measures (sales; value and novelty of creative work).21
4.3. Regression Analyses Testing Our Hypotheses
We test our hypotheses by estimating the following difference-in-differences regression model at
the store (i)–brand (j) level, using robust standard errors clustered by store:
21 In addition to the correlation tables, we match each poster to the average weekly sales data, ranging from two weeks before a given poster collection to two weeks before the next poster collection, and find that both the value and the novelty of creative work are positively and significantly correlated with financial performance.

24
Outcomeijt = β0 + β1 Info sharingi + β2 Info sharingi × Postit + β3 Postit
+ βn Controlsijt + Brand fixed effects + εijt (1)
where Outcomeijt is measured using (a) the natural logarithm of sales for brand j at store i in week
t, (b) the quality of the creative work displayed for each brand j at store i in month 3, 4, 6, or 8
(based on customer panel evaluations of the posters), or (c) promoter attendance for brand j at store
i in week t.22 The variable Info sharing is equal to 1 if the store is treated (i.e., is part of group A)
and 0 otherwise. Hypotheses 1 to 3 (predicting significant effects of the ISSC on the quality of the
creative work, job engagement, and financial performance) are tested by examining the direction
and significance of β2.
Controlsijt includes the store and brand promoter characteristics described in Table 1, as well as
brand fixed effects (since the brands have different types of products spanning different price
ranges). The Appendix defines the variables used in our analyses.
We first evaluate the average treatment effect of the ISSC on sales, the financial outcome (Table
2, Column 1). Then, we run similar regressions to evaluate the average treatment effect of the ISSC
on important intermediary outcomes; that is, the value and novelty of the creative work (Table 2,
Columns 2 and 3)23 and job engagement, measured as weekly promoter attendance (Table 2,
Column 4). Our results suggest that the introduction of the ISSC did not have a statistically
significant effect on any of the outcomes of interest. We conduct a series of tests to ensure the
results are robust to alternative specifications (for details see Online Appendix 6). Based on our
22 For stores with two or more promoters for a given brand (which make up less than 10% of the store-brands) in a given week, the attendance variables and promoter-level characteristics are an average value across the promoters of the same store-brand. 23 In a few cases (64 of the 544 observations in Table 2), more than one poster was created for a given store-brand-month. We treated data from different posters as different observations.

25
power analyses, we are 80% confident (1-β=0.8, using a 10% significance level, α=0.1) that, on
average, the mere introduction of the ISSC did not change our creative measures by 0.18 points or
more on a 1-5 point scale; the promoters’ attendance by 0.23 or more days per week; or sales by
13% or more.24 (See Online Appendix 7 for details on our power analyses.)
We conjecture that the lack of results may be due to any of three reasons: (a) the limited extent to
which salespeople accessed the ISSC,25 (b) the tradeoffs underlying the implementation of the
ISSC, which could have led the system to produce positive outcomes for some store-brands and
negative results for others, or (c) the possibility that the ISSC may not have had a sizable impact
on any stores during our sample period—due either to a real lack of impact or to the limited time
horizon of our experiment, which may have concealed system effects that could have arisen over
time. To test our first conjecture, in section 4.4.1, we examine whether salespeople that accessed
the system more often were significantly impacted by the introduction of the ISSC. To test our
second conjecture, in section 4.4.2, we examine factors that could have differentially increased or
decreased the benefits (or costs) associated with the ISSC across stores. Any results found in
sections 4.4.1 and 4.4.2 would challenge our third conjecture. We planned and committed to
running the following “Additional Analyses” using financial performance (sales) as the dependent
variable in our accepted registered report proposal. In this paper, we expand these same analyses
to include the other two outcomes of interest included in our planned hypotheses as additional
dependent variables: quality of creative work and job engagement.
24 These power analyses, prepared for our registered report proposal, also suggest that, with a probability of 90% (1-β=0.9), the ISSC did not change our creative measures by 0.21 points or more on a 1-5 point scale; the promoters’ attendance by 0.27 or more days per week; or sales by 15% or more. 25 This limited access, combined with the fact that the managing director drew significant attention to the relevance of creating high-quality posters across both treatment and control stores through the workshops and memoranda, may have diminished the power to distinguish a significant difference between the treatment and control groups.
26
4.4. Additional Analyses
4.4.1. Effect of the Information Sharing System Contingent on Active Access to the System
As seen in the descriptive statistics, the degree to which promoters at different stores accessed the
ISSC varied greatly.26 We examine whether the lack of impact of the ISSC could be related to
promoters who interacted with the system less frequently. Columns 2 and 3 of Table 3 show that
the introduction of the ISSC was associated with greater increases in the value of the creative work
and the novelty of the creative work when the store staff accessed the system more frequently. In
terms of economic significance, the ISSC was associated with an increase in the value (novelty)
of creative work of 0.40 (0.23) points on a 1-5 point scale for the store(s) that used the system most
often.27 These increases in creativity are similar to or larger than those resulting from providing
creativity-based incentives to individuals (e.g., Kachelmeier et al. [2008] find increases in
creativity ratings of 0.49 points on a 1-10 scale, following the implementation of such incentives).
Online Appendix 6 shows that the results in Table 3 are robust to several alternative specifications.
Overall, our results provide evidence that the ISSC had a positive effect on the quality of creative
output (and in some robustness tests, on the stores’ financial performance and job engagement)
when it was most frequently accessed.
We complement our analysis with qualitative insights on how often salespeople accessed the
system from the 19 interviews that we conducted in January at eight treatment stores. Although
26 To understand what factors could explain this variation, we ran a regression of Active access on all the control variables used in our main analyses. In untabulated results, we found that the access to the system was greater in stores that: were larger (in store size), were older, had more sales-days in the week, and were located closer to the head office. Also, our interviews revealed that the promoters’ different degrees of comfort with the system may have also contributed to the variation in the frequency with which they accessed the system. For example, when the promoters were asked whether they experienced any difficulty in using the system, some promoters responded “No, it’s easy to use”; some commented “It was difficult at the beginning but now it’s easy”; while a minority were frustrated by the system and said that they preferred to ask someone at the head office to upload their posters into the system. 27 We use data from Tables 1 and 5 to estimate the effect of the system—for the store(s) that used the system most often—on the value of creative work (0.0013 + 0.0033 × 122) and the novelty of creative work (-0.2178 + 0.0037 × 122).
27
the salespeople said the app was easy to use, about half of them cited reasons for not using it more
often: forgetting usernames, passwords, the link to the system, and so on. Furthermore, our
interviews suggested that several promoters only used the system as a mechanism to upload rather
than to actively browse posters; many asked the head office to upload posters on their behalf. Most
of them used the system only when they were required to upload their posters.
All of the store managers and promoters interviewed—even those who made limited use of the
ISSC—stated that the new focus on creating posters was very useful. They made remarks such as:
“There is a difference in a simple and a well-designed handmade poster. The customer will
definitely have a look at well-designed posters.” The salespeople who more actively used the
system suggested that they had changed the way they made posters. One interviewee stated: “We
take ideas from other posters now.” Another one said: “There is always this thought in my mind
that these posters are going to be uploaded in the system and it changes the way I make posters.”
Based on this feedback and results suggesting that some salespeople improved the quality of their
posters, MPR’s managing director decided to roll out the system to all of the stores, to promote
the system more aggressively, and to invest in creating a more engaging user experience.
4.4.2. Conditions Affecting the Effect of the Information Sharing System on Outcomes
Whether a company would be better off letting ideas naturally emerge and spread by word of
mouth, which MPR had previously done, or promoting idea transmission with an ISSC could
depend on store conditions. We explore three conditions that could lead to better or worse
outcomes associated with an ISSC: (a) the salespeople’s natural exposure to others’ ideas, (b) the
creative talent of the salespeople, and (c) the type of market served (mainstream vs. divergent).
28
a. Natural Exposure to Others’ Ideas. Alternative channels to learn about others’ creative work
will likely diminish the potential benefits of an ISSC. At MPR, promoters could potentially
learn about others’ posters by walking into nearby stores. To formally examine whether the
system’s effect was greater in stores isolated from other MPR stores, in Table 4 we split our
samples into stores with more nearby stores (above the median) and those with fewer nearby
stores, rerun our baseline regressions, and compare the treatment effects of the two subsamples.
Although the level of exposure to other stores did not affect the extent to which the system
affected sales and attendance, our findings suggest that the ISSC was associated with greater
value and novelty of creative work in the subsample of stores with fewer nearby stores than in
the subsample of stores with more nearby stores.28 In stores with fewer same-company nearby
stores, the ISSC was associated with a 0.38-point increase on the 1-5 point scale measuring the
value of creative work (usefulness) and a 0.29-point increase on the 1-5 point scale measuring
novelty of creative work (attractiveness). Interestingly, the system was also associated with a
0.30-point decrease in the novelty of creative work on the 1-5 point scale in stores with more
same-company nearby stores, where promoters may have been more aware that others could
free-ride on their work.
b. Creative Talent of the Salespeople. Individual creative talent could affect the effectiveness of
the ISSC. On the one hand, if only a few individuals at the stores have creative talent, it may
be suboptimal to impose an ISSC that would require all individuals to spend time producing
creative work rather than focus on selling. On the other hand, even if many individuals lack
creative talent, their effort to develop posters could lead to greater engagement with—and
28 The difference in the Info sharing x Post coefficients between the subsamples with more vs. fewer nearby stores is statistically significant (at the 5% level) when the dependent variable is Novelty of creative work (z-stat=2.34), but not when it is Value of creative work (z-stat=1.23).

29
understanding of—their work, producing greater benefits. Furthermore, exposing the work of
creative individuals to their peers could further motivate them to develop higher-quality sales
posters. To explore the effect of creative talent on the effectiveness of the ISSC, we compare
the treatment effects between stores with higher-quality ex ante creative output (above the
median) with those with lower-quality ex ante creative output, rerun our baseline regressions,
and compare the treatment effects between the two subsamples. Table 5 suggests that the effect
of the system on the outcomes of interest was generally statistically insignificant, regardless of
the ex ante creative talent of the salespeople. Yet, the effects were consistently positive for the
subsample of stores with lower ex ante creative talent. A comparison of the Info sharing x Post
coefficients across subsamples suggests that the effect of MPR’s ISSC on sales tended to be
more favorable in stores with lower rather than higher ex ante creative talent (difference in
coefficients=0.37, z-stat=2.02). In stores where the staff had lower ex ante creative talent, the
introduction of the system was associated with a 25% increase in sales.
c. Differences across Markets on the Need to Customize Service. Promoting experimentation and
the sharing of ideas across stores could produce greater benefits if the individuals need to adapt
their creative work to local conditions. However, for more homogeneous, mainstream stores
where local customization does not add much value, the benefits of being exposed to multiple
ideas could be more limited or even lead to confusion. We split the sample into stores that
operate in divergent versus mainstream markets, based on the characteristics of the customers
(Campbell et al. [2009]). We operationalized the construct of divergent stores by asking the
managing director to identify stores whose clientele has unique characteristics compared to the
customers served by the average MPR store. The director identified 13 such stores (e.g., with
customers who speak uncommon languages, have higher income and are more demanding than

30
in the mainstream stores, and/or have other unique characteristics such as being workers from
the same factories). Table 6 suggests that in divergent stores, the ISSC had a significantly
positive impact on the value of creative work (an increase of 0.28 points on a 1-5 point scale)
and on attendance (an increase of 0.24 days/week). This is consistent with the idea that stores
requiring greater customization could benefit more from the system.
The results in Tables 4-6 are generally robust to alternative specifications (for details, see Online
Appendix 6).
Overall, our findings suggest that the introduction of the ISSC is more likely to be associated with
improvements in creative output in stores with fewer nearby stores, where there is less chance to
be exposed to others’ ideas, and also in more divergent stores, where the need to customize to local
needs is higher. Our results also provide weak evidence that the ISSC will lead to better financial
results (i.e., higher sales) in stores where the salespeople had lower creative talent to begin with
and will lead to greater job engagement (i.e., greater attendance) in divergent stores.
5. Conclusion
Customer-focused businesses have increasingly adopted ISSCs to enable empowered employees
to share ideas or creative work with their peers. In principle, these systems should enhance
employee creativity (by exposing employees to a broad pool of stimulating ideas and holding them
accountable for their own creative work) and employee engagement (by increasing the perceived
impact of their work and by encouraging effort in information acquisition and understanding of
their work). This paper describes the details of a field experiment (based on a registered report) in
a retail chain to test the effects of introducing an ISSC on (a) the quality of creative work, (b) job

31
engagement, and (c) financial performance.29
We find that the ISSC implemented at our research site did not have a statistically significant effect
on any of these three outcomes for the treated stores. However, further analyses reveal that under
certain conditions, the system did have positive effects. The ISSC (a) was significantly associated
with an increase in the quality of creative work (and in some robustness tests, the stores’ financial
performance and attendance) when it was more frequently accessed; (b) was associated with
greater quality of creative work in stores with fewer nearby stores in the same chain, consistent
with the notion that this kind of system could pay off when employed by individuals that are not
naturally exposed to others’ work; (c) was associated with greater financial performance in stores
with lower ex ante creative talent, where individuals had relatively more to learn from others; and
(d) had a significantly positive impact on the value of creative work and the attendance of
salespeople working for stores in divergent markets, consistent with the idea that stores requiring
greater customization could benefit more from this kind of system.
While our results (and lack of results) are robust to alternative specifications, they should
nevertheless be interpreted with caution for two reasons. First, because the company implemented
the system following the protocol of a natural field experiment, it confronted some limitations that
could have reduced the power of the tests. To keep the initial conditions of treatment and control
firms constant, MPR’s managing director had to draw attention to the relevance of producing
creative work not only to treatment firms but also to control firms and it had to discourage
discussions about the system in weekly meetings that included all the store managers and in broad
29One interesting treatment that could be examined in future research would be to randomize the anonymity of the posters’ creators. This would enable testing the effects of the ISSC contingent on the visibility and social pressure of attaching the employees’ name to the exposed work. Unfortunately, the sample size in this study did not allow us to implement an anonymity condition.

32
communications that included all the promoters. Second, in our planned additional analyses, we
tested moderating conditions potentially affecting the effect of the ISSC on our outcomes of
interest. Given that these were naturally occurring (rather than randomly generated) conditions,
our ability to claim that those relations were causal is somewhat limited.
In addition, given that our study intended to isolate the effects of sharing information through a
system from any other effects, our implementation did not allow for a more comprehensive social
network project that might include (a) broad interactions and discussion among the salespeople
related to the creative work shared; (b) mutual ratings of the posters; and/or (c) bonuses or rewards
for the best posters. Future work could explore the effects of these features on ISSC use and on
creative work, job engagement, and financial performance.30
30 We appreciate the registered report process as it is especially supportive to projects like ours: field experiments in real organizations that could address important and relevant research questions but are costly and risky to implement. The discipline enforced by this review process helped us adhere to the original study design and enabled us to carry out this experiment in the face of unanticipated difficulties. We also appreciate the early feedback that we received before conducing our field experiment, which led to a higher-quality and more powerful study.

33
Appendix
Variable Definitions
Variable Names Definitions Dependent Variables Sales Natural logarithm of weekly sales for a given brand in a given store
Attendance Number of days an employee promoting a brand at the store reports to work during a given week (when the store is staffed with more than one brand promoter, this variable is defined as average days in the week when the brand promoters attended the store)
Value of Creative Work Average score given to the poster by the customer panel on how “useful” the poster is at communicating the products or deals offered using a not useful (1) – very useful (5) scale
Novelty of Creative Work Average score given to the poster by the customer panel on how “attractive” the visual design of the poster is (how much it grabs the customer’s attention) using a not attractive (1) – very attractive (5) scale
Treatment Indicators Info Sharing An indicator that equals one if the store is in the treatment group (i.e.,
Group A where an information sharing system is implemented)
Post An indicator that equals one if the time period is after the intervention (month 5, 6, 7, 8, or 9; or from September 1, 2016 to Jan 31, 2017)
Store Characteristics # of promoters for the brand at the store
Number of promoters for the brand at the store in the week
store physical size Store size in square feet
store age Store age in years sales days Number of days in the week when the store made sales # of nearby stores Number of MPR stores within a one-mile radius distance to head office Distance to the head office in miles Promoter Characteristics Tenure Number of months working at MPR Gender An indicator variable equal to one if the promoter is female
Pre-Intervention Sales (Attendance, Quality of Creative Work)
Average weekly sales (weekly attendance, quality of creative work) for a given store-brand during the pre-intervention period. Quality of creative work is measures as the average of Value of Creative Work and Novelty of Creative Work
34
References
AGHION, P., and J. TIROLE. ‘Formal and Real Authority in Organizations.’ The Journal of Political Economy 105 (1997): 1-29.
ALCHIAN, A. A., and H. DEMSETZ. ‘Production, Information Costs, and Economic Organization.’ American Economic Review (1972): 777–795.
AMABILE, T. ‘A Model of Creativity and Innovation in Organizations.’ Research in Organizational Behavior 10 (1988): 123-167.
ARROW, K. ‘Economic Welfare and the Allocation of Resources for Innovation. Nelson RR, (eds.) The Rate and Direction of Incentive Activity: Economic and Social Factors’ (1962)
BAIMAN, S.; D. F. LARCKER; and M. V. RAJAN. ‘Organizational Design for Business Units.’ Journal of Accounting Research 33 (1995): 205–229.
BANDIERA, O.; I. BARANKAY; and I. RASUL. ‘Field Experiments with Firms.’ Journal of Economic Perspectives 25 (2011): 63-82.
BANKER, R. D.; H. CHANG; and Y.-C. KAO. ‘Impact of Information Technology on Public Accounting Firm Productivity.’ Journal of Information Systems16 (2002): 209–222.
BANKER, R. D.; S. LEE; G. POTTER; and D. SRINIVASAN. ‘Contextual Analysis of Performance Impacts of Outcome Based Incentive Compensation.’ Academy of Management Journal 39 (1996): 920–948.
CAMPBELL, D. ‘Employee Selection as a Control System.’ Journal of Accounting Research 50 (2012): 931-966.
CAMPBELL, D.; S. DATAR; and T. SANDINO. ‘Organizational Design and Control across Multiple Markets: The Case of Franchising in the Convenience Store Industry.’ The Accounting Review 80 (2009): 1749-1779.
CAMPBELL, D. W.; D. H. ERKENS; and M. LOUMIOTI. ‘Exception Reports as a Source of Idiosyncratic Information,’ Working paper, 2014.
CHEN, C. X.; M. G. WILLIAMSON; and F. H. ZHOU. ‘Reward System Design and Group Creativity: An Experimental Investigation.’ The Accounting Review 87 (2012): 1885–1911.
CONTI, R.; AMABILE, T.; and S. POLLACK. ‘The Positive Impact of Creative Activity: Effects of Creative Task Engagement and Motivational Focus on College Students’ Learning.’ Personality and Social Psychology Bulletin 21 (1995): 1107-1116.

35
DENNIS, A. R., and J. S. VALACICH. ‘Computer Brainstorms: More Heads Are Better than One.’ Journal of Applied Psychology 78 (1993): 531–537.
DESSEIN, W. ‘Authority and Communication in Organizations.’ Review of Economic Studies 69 (2002): 811-838.
DEVARAJ, S.; L. KRAJEWSKI; and J.C. WEI. ‘Impact of eBusiness Technologies on Operational Performance: The Role of Production Information Integration in the Supply Chain.’ Journal of Operations Management 25 (2007): 1199–1216.
DIEHL, M., and W. STROEBE. ‘Productivity Loss in Brainstorming Groups.’ Journal of Personality and Social Psychology 53 (1987): 497–509.
DYER, J. H., and K NOBEOKA. ‘Creating and Managing a High-Performance Knowledge-Sharing Network: The Toyota Case.’ Strategic Management Journal 21 (2000): 345–367.
FLADMOE-LINDQUIST, K., and L. L. JACQUE. ‘Control Modes in International Service Operations: The Propensity to Franchise.’ Management Science 41 (1995): 1238–1249.
FLOYD, E., AND J. LIST. ‘Using Field Research in Accounting and Finance.’ Journal of Accounting Research (2016).
GIROTRA, K.; C. TERWIESCH; and K. T. ULRICH. ‘Idea Generation and the Quality of the Best Idea.’ Management Science 56 (2010): 591–605.
HENNESSY, B. A., AND T. M. AMABILE. ‘Creativity.’ Annual Review of Psychology 61 (2009): 569-598.
KACHELMEIER, S. J.; B. E. REICHERT; and M. G. WILLIAMSON. ‘Measuring and Motivating Quantity, Creativity, or Both.’ Journal of Accounting Research 46 (2008): 341–373
KACHELMEIER, S. J., and M. G. WILLIAMSON. ‘Attracting Creativity: The Initial and Aggregate Effects of Contract Selection on Creativity-Weighted Productivity.’ The Accounting Review 85 (2010): 1669–1691
KAHN, W. A. ‘Psychological Conditions of Personal Engagement and Disengagement at Work.’ Academy of Management Journal 33 (1990): 692–724.
KULP, S. ‘The Effect of Information Precision and Information Reliability on Manufacturer–Retailer Relationships.’ The Accounting Review 77(4) (2002): 653-677.
KULP, S.; H. LEE; and E. OFEK. ‘Manufacturer Benefits from Information Integration with Retail Customers.’ Management Science 50 (4) (2004)
MANSO, G. ‘Motivating Innovation.’ Journal of Finance 64 (2011): 1823-1860.

36
NONAKA, I. ‘A Dynamic Theory of Organizational Knowledge Creation.’ Organization Science 5 (1994): 14–37.
NONAKA, I., and G. VON KROUGH ‘Tacit Knowledge and Knowledge Conversion: Controversy and Advancement in Organizational Knowledge Creation Theory.’ Organization Science 3 (2009): 635–652.
POLANYI, M. The Tacit Dimension. London: Routledge and Kegan Paul, 1966.
RICH, B. L.; J. A. LEPINE; and E. R. CRAWFORD. ‘Job Engagement: Antecedents and Effects on Job Performance.’ Academy of Management Journal 53 (2010): 617–635.
SETHI, R.; D. C. SMITH; and C. W. PARK. ‘Cross-Functional Product Development Teams, Creativity, and the Innovativeness of New Consumer Products.’ Journal of Marketing Research 38 (2001): 73-85.
TOUBIA, O. ‘Idea Generation, Creativity, and Incentives.’ Marketing Science 25 (2006): 411–425.
TSOUKAS, H. ‘Do We Really Understand Tacit Knowledge?’ EASTERBY-SMITH, M., and M. LYLES, eds. The Blackwell Handbook of Organizational Learning and Knowledge Management. Oxford, UK: Blackwell, 2003, pp. 410–427.
ZHANG, X., and K. M. BARTOL. ‘Linking Empowering Leadership and Employee Creativity: The Influence of Psychological Empowerment, Intrinsic Motivation, and Creative Process Engagement.’ Academy of Management Journal 53 (2010): 107–128

37
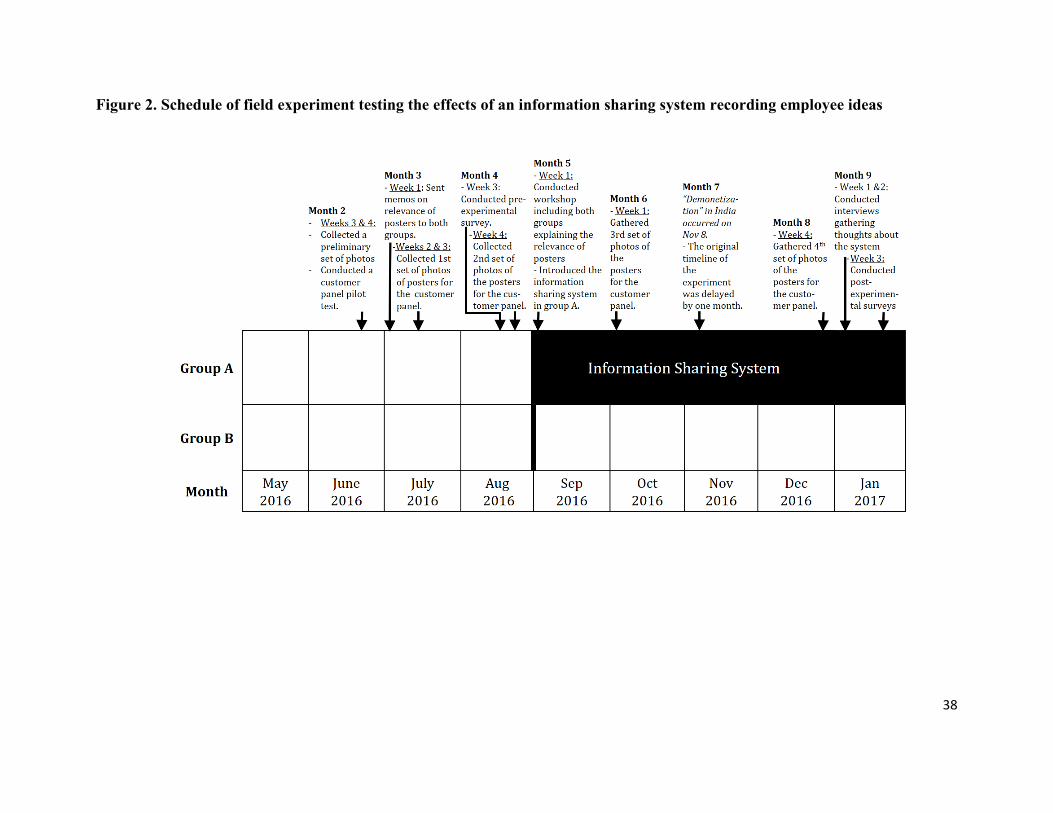
38
Figure 2. Schedule of field experiment testing the effects of an information sharing system recording employee ideas
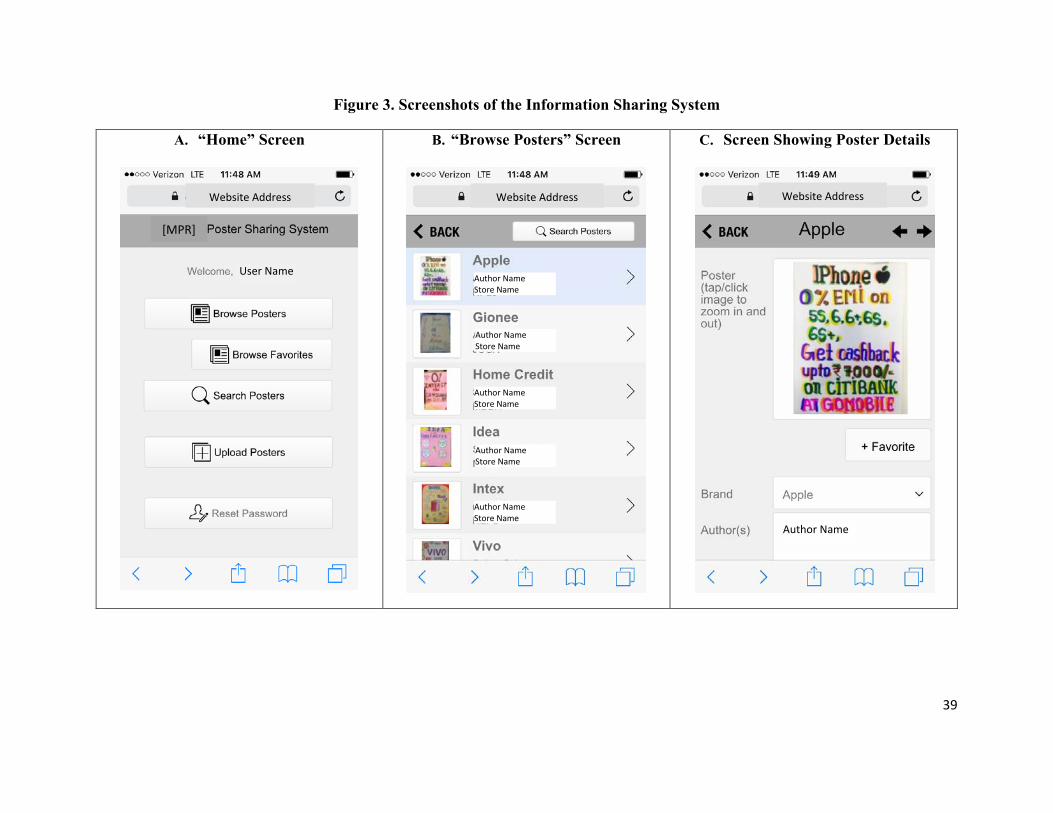
39
Figure 3. Screenshots of the Information Sharing System
A. “Home” Screen
B. “Browse Posters” Screen
C. Screen Showing Poster Details
[MPR]
Website Address Website Address Website Address
Author Name
Author Name Store Name
Author Name Store Name
Author Name Store Name
Author Name Store Name
Author Name Store Name
User Name

40
Table 1: Descriptive Statistics for the Main Variables of Interest
Panel A: Descriptive Statistics
N Mean Standard Deviation Minimum Maximum
Sales 4,818 10.48 1.75 0.69 14.52
Value of creative work
544 3.14 0.79 1.00
5.00
Novelty of creative work
544
2.92 0.75 1.00
5.00
Attendance
4,818
5.33 1.40 1.00
7.00
Info sharing
4,818
0.50 0.50 0.00
1.00
Post
4,818
0.56 0.50 0.00
1.00
Active access
2,414
42.31 31.04 4.00
122.00
# of promoters for the brand at the store
4,818
1.16 0.47 1.00
7.00
Store physical size
4,818
435.04 254.14 100.00
1,092.00
Store age
4,818
6.61 3.42 0.49
11.68
Sales days
4,818
6.98 0.22 3.00
7.00
# of nearby stores
4,818
3.02 2.22 0.00
6.00
Distance to head office
4,818
4.59 3.43 0.03
11.05
Tenure
4,818
13.38 15.82 0.50
113.50
Gender
4,818
0.12 0.32 0.00
1.00
Pre-intervention sales
4,818
10.37 1.43 6.84
13.73
Pre-intervention attendance
4,818
5.13 0.77 1.00
6.50
Pre-intervention value of creative work
544
3.07 0.62 1.25
5.00
Pre-intervention novelty of creative work
544
2.92 0.61 1.25
4.75
Note: The appendix provides detailed definitions of the variables.
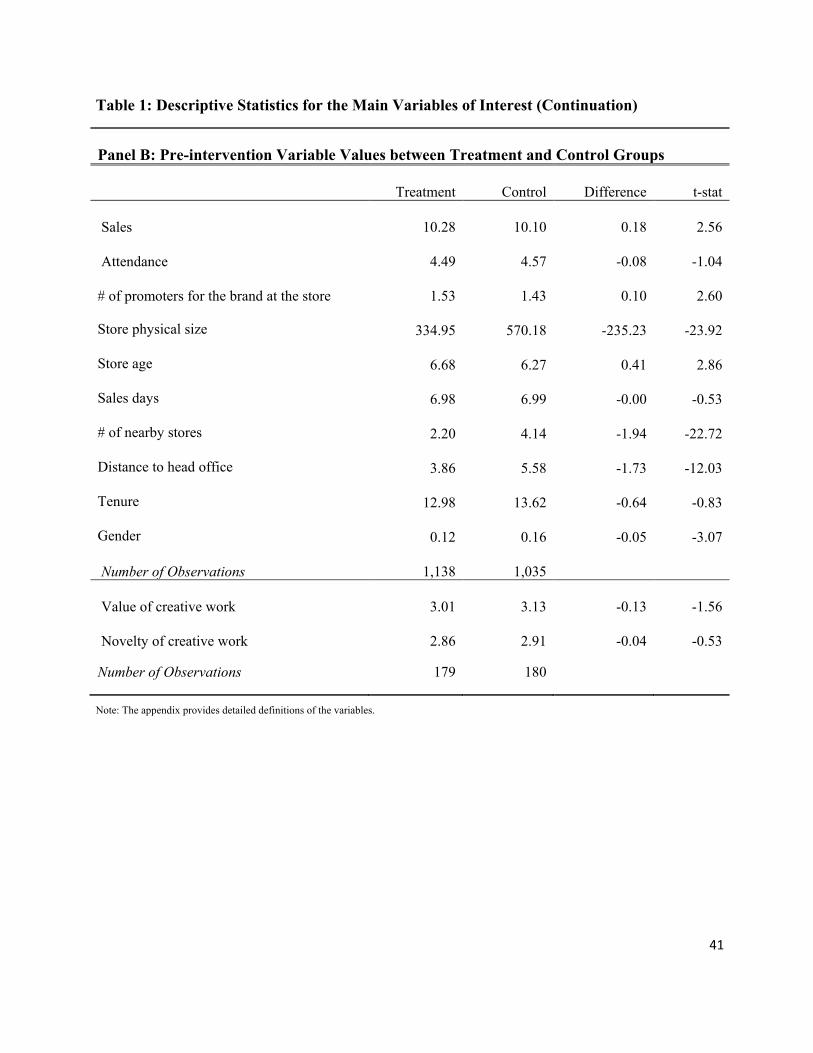
41
Table 1: Descriptive Statistics for the Main Variables of Interest (Continuation)
Panel B: Pre-intervention Variable Values between Treatment and Control Groups
Treatment Control Difference t-stat
Sales 10.28 10.10 0.18 2.56
Attendance 4.49 4.57 -0.08 -1.04
# of promoters for the brand at the store 1.53 1.43 0.10 2.60
Store physical size 334.95 570.18 -235.23 -23.92
Store age 6.68 6.27 0.41 2.86
Sales days 6.98 6.99 -0.00 -0.53
# of nearby stores 2.20 4.14 -1.94 -22.72
Distance to head office 3.86 5.58 -1.73 -12.03
Tenure 12.98 13.62 -0.64 -0.83
Gender 0.12 0.16 -0.05 -3.07
Number of Observations 1,138 1,035
Value of creative work 3.01 3.13 -0.13 -1.56
Novelty of creative work 2.86 2.91 -0.04 -0.53
Number of Observations 179 180
Note: The appendix provides detailed definitions of the variables.

42
Table 2: Average Effect of an Information Sharing System on Financial Performance, Quality of Creative Work, and Engagement
Quality of creative work Sales Value Novelty Attendance (1) (2) (3) (4) Info sharing 0.0666 -0.2200** 0.0018 -0.0120 (1.41) (-2.66) (0.02) (-0.12) Post 0.3236*** 0.0208 0.0291 0.3166*** (5.21) (0.31) (0.32) (7.70) Info sharing x Post 0.0248 0.1577 -0.0423 0.1278 (0.32) (1.53) (-0.36) (1.01) Store Characteristics # of promoters for the brand at the store 0.0702** -0.0835 -0.1278 -1.0501*** (2.04) (-0.98) (-1.61) (-13.95) Store physical size 0.0002*** -0.0002* 0.0002 0.0001 (4.06) (-1.70) (1.69) (0.89) Store age -0.0070 0.0222*** -0.0012 -0.0075 (-1.30) (3.28) (-0.15) (-0.79) Sales days 0.2354*** -0.4012** -0.1019 0.7935*** (4.93) (-2.68) (-0.79) (7.64) # of nearby stores -0.0155** -0.0083 -0.0067 -0.0147 (-2.23) (-0.57) (-0.46) (-1.01) Distance to head office 0.0004 -0.0387*** -0.0167* -0.0121 (0.05) (-3.88) (-1.80) (-1.09) Promoter Characteristics Tenure 0.0022 -0.0017 -0.0014 0.0047 (1.49) (-0.79) (-0.84) (1.59) Gender -0.1413** 0.1055 0.0055 0.1251 (-2.50) (1.14) (0.06) (1.35) Pre-intervention sales 0.7122*** - - - (17.06) Pre-intervention value of creative work - 0.4326*** - - (5.77) Pre-intervention novelty of creative work - - 0.4564*** - (10.28) Pre-intervention attendance - - - 0.3032*** (4.44) Brand fixed effects Yes Yes Yes Yes R2 (Pseudo R2) 0.8283 0.1979 0.2390 0.0415 Observations 4,818 544 544 4,818
Note: This table reports coefficient estimates from OLS regressions in Columns 1-3 and Tobit regressions (with an upper limit=7) in Column 4. R2s are reported for OLS regressions and Pseudo R2s for Tobit regressions. t-stats in parenthesis are based on robust standard errors clustered by store. *, **, *** denote significance at a 0.10, a 0.05 and a 0.01 level respectively. “Sales” refers to the natural logarithm of weekly sales for a given brand in a given store. “Value” refers to the score given to the poster by the customer panel on how effective the poster is at communicating the products or deals offered using a not useful (1) – very useful (5) scale. “Novelty” refers to the score given to the poster by the customer panel on how attractive the visual design of the poster is using a not attractive (1) – very attractive (5) scale. “Attendance” refers to the number of days the average promoter working for a brand at the store reported to work during a given week. “Info sharing” is an indicator for whether the store is in the treatment group (i.e., where an information sharing system is implemented). “Post” is an indicator for whether the time period is after the intervention (months September, October, December, and January). Month 7 (November) is excluded due to the demonetization in India. The appendix provides detailed definitions of the variables.
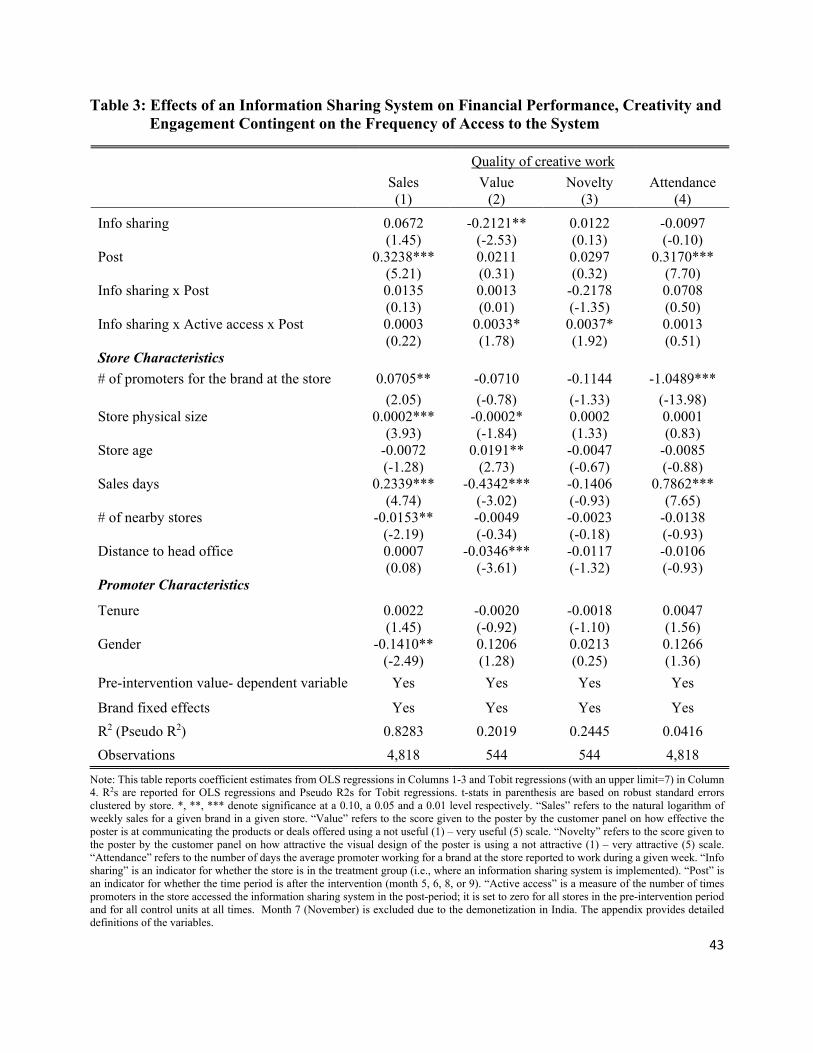
43
Table 3: Effects of an Information Sharing System on Financial Performance, Creativity and Engagement Contingent on the Frequency of Access to the System
Quality of creative work Sales Value Novelty Attendance (1) (2) (3) (4)
Info sharing 0.0672 -0.2121** 0.0122 -0.0097 (1.45) (-2.53) (0.13) (-0.10) Post 0.3238*** 0.0211 0.0297 0.3170*** (5.21) (0.31) (0.32) (7.70) Info sharing x Post 0.0135 0.0013 -0.2178 0.0708 (0.13) (0.01) (-1.35) (0.50) Info sharing x Active access x Post 0.0003 0.0033* 0.0037* 0.0013 (0.22) (1.78) (1.92) (0.51) Store Characteristics # of promoters for the brand at the store 0.0705** -0.0710 -0.1144 -1.0489*** (2.05) (-0.78) (-1.33) (-13.98) Store physical size 0.0002*** -0.0002* 0.0002 0.0001 (3.93) (-1.84) (1.33) (0.83) Store age -0.0072 0.0191** -0.0047 -0.0085 (-1.28) (2.73) (-0.67) (-0.88) Sales days 0.2339*** -0.4342*** -0.1406 0.7862*** (4.74) (-3.02) (-0.93) (7.65) # of nearby stores -0.0153** -0.0049 -0.0023 -0.0138 (-2.19) (-0.34) (-0.18) (-0.93) Distance to head office 0.0007 -0.0346*** -0.0117 -0.0106 (0.08) (-3.61) (-1.32) (-0.93) Promoter Characteristics
Tenure 0.0022 -0.0020 -0.0018 0.0047 (1.45) (-0.92) (-1.10) (1.56) Gender -0.1410** 0.1206 0.0213 0.1266 (-2.49) (1.28) (0.25) (1.36) Pre-intervention value- dependent variable Yes Yes Yes Yes
Brand fixed effects Yes Yes Yes Yes R2 (Pseudo R2) 0.8283 0.2019 0.2445 0.0416 Observations 4,818 544 544 4,818
Note: This table reports coefficient estimates from OLS regressions in Columns 1-3 and Tobit regressions (with an upper limit=7) in Column 4. R2s are reported for OLS regressions and Pseudo R2s for Tobit regressions. t-stats in parenthesis are based on robust standard errors clustered by store. *, **, *** denote significance at a 0.10, a 0.05 and a 0.01 level respectively. “Sales” refers to the natural logarithm of weekly sales for a given brand in a given store. “Value” refers to the score given to the poster by the customer panel on how effective the poster is at communicating the products or deals offered using a not useful (1) – very useful (5) scale. “Novelty” refers to the score given to the poster by the customer panel on how attractive the visual design of the poster is using a not attractive (1) – very attractive (5) scale. “Attendance” refers to the number of days the average promoter working for a brand at the store reported to work during a given week. “Info sharing” is an indicator for whether the store is in the treatment group (i.e., where an information sharing system is implemented). “Post” is an indicator for whether the time period is after the intervention (month 5, 6, 8, or 9). “Active access” is a measure of the number of times promoters in the store accessed the information sharing system in the post-period; it is set to zero for all stores in the pre-intervention period and for all control units at all times. Month 7 (November) is excluded due to the demonetization in India. The appendix provides detailed definitions of the variables.
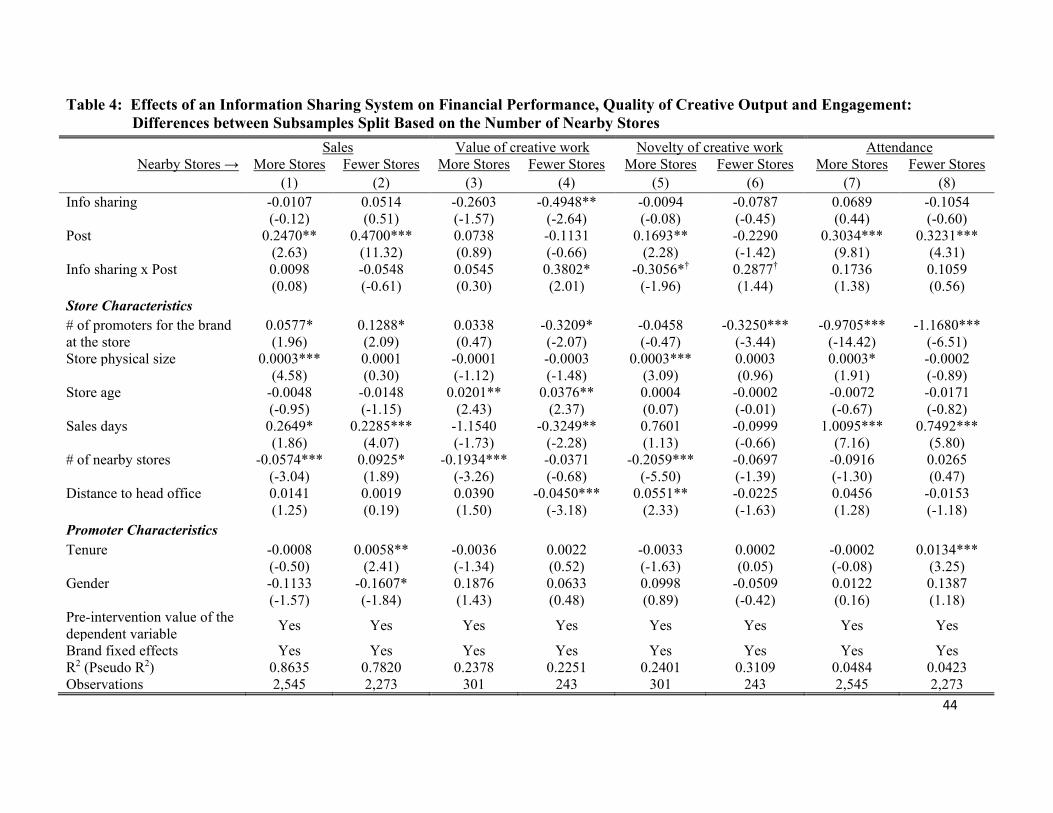
44
Table 4: Effects of an Information Sharing System on Financial Performance, Quality of Creative Output and Engagement: Differences between Subsamples Split Based on the Number of Nearby Stores
Sales Value of creative work Novelty of creative work Attendance Nearby Stores → More Stores Fewer Stores More Stores Fewer Stores More Stores Fewer Stores More Stores Fewer Stores
(1) (2) (3) (4) (5) (6) (7) (8) Info sharing -0.0107 0.0514 -0.2603 -0.4948** -0.0094 -0.0787 0.0689 -0.1054 (-0.12) (0.51) (-1.57) (-2.64) (-0.08) (-0.45) (0.44) (-0.60) Post 0.2470** 0.4700*** 0.0738 -0.1131 0.1693** -0.2290 0.3034*** 0.3231*** (2.63) (11.32) (0.89) (-0.66) (2.28) (-1.42) (9.81) (4.31) Info sharing x Post 0.0098 -0.0548 0.0545 0.3802* -0.3056*† 0.2877† 0.1736 0.1059 (0.08) (-0.61) (0.30) (2.01) (-1.96) (1.44) (1.38) (0.56) Store Characteristics # of promoters for the brand 0.0577* 0.1288* 0.0338 -0.3209* -0.0458 -0.3250*** -0.9705*** -1.1680*** at the store (1.96) (2.09) (0.47) (-2.07) (-0.47) (-3.44) (-14.42) (-6.51) Store physical size 0.0003*** 0.0001 -0.0001 -0.0003 0.0003*** 0.0003 0.0003* -0.0002 (4.58) (0.30) (-1.12) (-1.48) (3.09) (0.96) (1.91) (-0.89) Store age -0.0048 -0.0148 0.0201** 0.0376** 0.0004 -0.0002 -0.0072 -0.0171 (-0.95) (-1.15) (2.43) (2.37) (0.07) (-0.01) (-0.67) (-0.82) Sales days 0.2649* 0.2285*** -1.1540 -0.3249** 0.7601 -0.0999 1.0095*** 0.7492*** (1.86) (4.07) (-1.73) (-2.28) (1.13) (-0.66) (7.16) (5.80) # of nearby stores -0.0574*** 0.0925* -0.1934*** -0.0371 -0.2059*** -0.0697 -0.0916 0.0265 (-3.04) (1.89) (-3.26) (-0.68) (-5.50) (-1.39) (-1.30) (0.47) Distance to head office 0.0141 0.0019 0.0390 -0.0450*** 0.0551** -0.0225 0.0456 -0.0153 (1.25) (0.19) (1.50) (-3.18) (2.33) (-1.63) (1.28) (-1.18) Promoter Characteristics Tenure -0.0008 0.0058** -0.0036 0.0022 -0.0033 0.0002 -0.0002 0.0134*** (-0.50) (2.41) (-1.34) (0.52) (-1.63) (0.05) (-0.08) (3.25) Gender -0.1133 -0.1607* 0.1876 0.0633 0.0998 -0.0509 0.0122 0.1387 (-1.57) (-1.84) (1.43) (0.48) (0.89) (-0.42) (0.16) (1.18) Pre-intervention value of the dependent variable Yes Yes Yes Yes Yes Yes Yes Yes
Brand fixed effects Yes Yes Yes Yes Yes Yes Yes Yes R2 (Pseudo R2) 0.8635 0.7820 0.2378 0.2251 0.2401 0.3109 0.0484 0.0423 Observations 2,545 2,273 301 243 301 243 2,545 2,273

45
Note: This table reports coefficient estimates from OLS regressions in Columns 1-6 and Tobit regressions (with an upper limit=7) in Columns 7 and 8. R2s are reported for OLS regressions and Pseudo R2s for Tobit regressions. t-stats in parenthesis are based on robust standard errors clustered by store. *, **, *** denote significance at a 0.10, a 0.05 and a 0.01 level respectively, † denotes that the coefficients for Info sharing x Post are significantly different between the two subsamples at a 0.10 level. “Sales” refers to the natural logarithm of weekly sales for a given brand in a given store. “Value of creative work” refers to the score given to the poster by the customer panel on how effective the poster is at communicating the products or deals offered using a not useful (1) – very useful (5) scale. “Novelty of creative work” refers to the score given to the poster by the customer panel on how attractive the visual design of the poster is using a not attractive (1) – very attractive (5) scale. “Attendance” refers to the number of days the average promoter working for a brand at the store reported to work during a given week. “More (Fewer) Nearby Stores” refers to the subsample of stores with a number of nearby stores above (below or equal to) the median number of nearby stores in our sample. There are 15 (20) stores in the “More (Fewer) Nearby Stores” subsample. “Info sharing” is an indicator for whether the store is in the treatment group (i.e., where the information sharing system is implemented). “Post” is an indicator for whether the time period is after the intervention (on or after month 5). The appendix provides detailed definitions of the variables.

46
Table 5: Effects of an Information Sharing System on Financial Performance, Quality of Creative Output and Engagement: Differences between Subsamples Split Based on Ex-Ante Creative Talent at the Store
Sales Value Novelty Attendance Ex Ante Creative Talent → High Low High Low High Low High Low
(1) (2) (3) (4) (5) (6) (7) (8) Info sharing 0.1795** -0.1501 0.0081 -0.3602*** 0.1010 -0.1133 0.1416 0.0484 (2.15) (-1.55) (0.08) (-3.19) (1.04) (-0.83) (1.02) (0.34) Post 0.4032*** 0.1800* -0.3521** 0.3079*** -0.2066 0.2278** 0.3294*** 0.3272*** (4.05) (1.94) (-2.52) (2.85) (-1.24) (2.46) (4.71) (4.63) Info sharing x Post -0.1395† 0.2260† 0.1922 0.2271 -0.0905 0.1052 -0.1301 0.2539 (-1.35) (1.52) (0.97) (1.39) (-0.45) (0.74) (-1.00) (1.17) Store Characteristics # of promoters for the brand 0.0742 0.0483 -0.3453** 0.0236 -0.2980** -0.0308 -0.9533*** -1.0231*** at the store (1.22) (1.18) (-2.66) (0.36) (-2.77) (-0.44) (-6.81) (-8.51) Store physical size 0.0002** 0.0001 -0.0002 -0.0003 0.0001 0.0004 -0.0001 0.0001 (2.13) (1.09) (-1.47) (-1.65) (0.35) (1.62) (-0.67) (0.89) Store age -0.0170 -0.0012 -0.0074 0.0161* -0.0064 -0.0164 -0.0139 -0.0095 (-1.44) (-0.15) (-0.32) (1.78) (-0.32) (-1.42) (-0.78) (-0.92) Sales days 0.1278* 0.3250*** -0.4571** -0.0773 -0.1560 0.1682 0.7462*** 0.6411*** (1.96) (5.09) (-2.24) (-0.44) (-0.91) (0.61) (3.98) (3.50) # of nearby stores -0.0038 -0.0165 0.0504** -0.0384*** 0.0166 -0.0248 0.0098 0.0094 (-0.24) (-1.62) (2.29) (-2.87) (0.69) (-1.29) (0.46) (0.57) Distance to head office 0.0052 -0.0041 -0.0338 -0.0381** -0.0237 -0.0152 -0.0166 -0.0057 (0.61) (-0.44) (-1.46) (-2.64) (-1.41) (-1.62) (-1.31) (-0.36) Promoter Characteristics Tenure 0.0014 0.0016 -0.0066** 0.0028 -0.0056** 0.0019 -0.0014 0.0046 (0.44) (0.72) (-2.44) (1.07) (-2.27) (0.82) (-0.45) (1.39) Gender -0.0584 -0.2158*** 0.0975 0.0954 0.1383 -0.0290 0.1611* 0.0546 (-0.69) (-2.92) (0.77) (0.76) (0.87) (-0.30) (1.77) (0.56) Pre-intervention value of the dependent variable Yes Yes Yes Yes Yes Yes Yes Yes
Brand fixed effects Yes Yes Yes Yes Yes Yes Yes Yes R2 0.8276 0.8459 0.2744 0.2118 0.2322 0.1775 0.0433 0.0505 Observations 1,954 2,260 258 286 258 286 1,954 2,260
47
Note: This table reports This table reports coefficient estimates from OLS regressions in Columns 1-6 and Tobit regressions (with an upper limit=7) in Columns 7 and 8. R2s are reported for OLS regressions and Pseudo R2s for Tobit regressions. t-stats in parenthesis are based on robust standard errors clustered by store. *, **, *** denote significance at a 0.10, a 0.05 and a 0.01 level respectively, † denotes that the coefficients for Info sharing x Post are significantly different between the two subsamples at a 0.10 level. “Sales” refers to the natural logarithm of weekly sales for a given brand in a given store. “Value” refers to the score given to the poster by the customer panel on how effective the poster is at communicating the products or deals offered using a not useful (1) – very useful (5) scale. “Novelty” refers to the score given to the poster by the customer panel on how attractive the visual design of the poster is using a not attractive (1) – very attractive (5) scale. “Attendance” refers to the number of days the average promoter working for a brand at the store reported to work during a given week. “High (Low) Ex Ante Creative Talent” refers to the subsample of stores with average scores for quality of creative work above (below or equal to) the median score for quality of creative work in the sample during the pre-intervention period, where quality of creative work is measured based on the average of the “value” and “novelty” of creative work. There are 79 (97) store-brands in the “High (Low) Ex Ante Creative Talent” subsample (splitting roughly equally between the two experimental conditions). “Info sharing” is an indicator for whether the store is in the treatment group (i.e., where the information sharing system is implemented). “Post” is an indicator for whether the time period is after the intervention (on or after month 5). The appendix provides detailed definitions of the variables.

48
Table 6: Effects of an Information Sharing System on Financial Performance, Quality of Creative Output and Engagement: Differences between Subsamples Split Based on the Type of Market Where the Store is Located
Sales Value Novelty Attendance Type of Market → Mainstream Divergent Mainstream Divergent Mainstream Divergent Mainstream Divergent
(1) (2) (3) (4) (5) (6) (7) (8) Info sharing 0.0258 0.0801 -0.3636** -0.2788 -0.0005 -0.0807 -0.0497 -0.0029 (0.26) (1.16) (-2.55) (-1.51) (-0.00) (-0.58) (-0.28) (-0.02) Post 0.1972* 0.4188*** 0.1035 -0.0170 0.0304 0.0513 0.3276*** 0.2826*** (2.00) (6.10) (0.76) (-0.35) (0.22) (0.38) (3.97) (7.74) Info sharing x Post 0.1035 -0.0171 0.0453 0.2775* -0.1177 -0.0475 0.0471 0.2413** (0.73) (-0.21) (0.24) (2.13) (-0.57) (-0.29) (0.20) (2.50) Store Characteristics # of promoters for the brand 0.1028 0.0488 -0.0137 -0.2033* -0.0832 -0.1903** -1.1343*** -0.9847*** at the store (1.53) (1.02) (-0.14) (-1.99) (-0.55) (-2.88) (-9.19) (-10.22) Store physical size -0.0002 0.0002** -0.0008 -0.0001 -0.0003 0.0002* -0.0002 0.0001 (-0.72) (3.05) (-1.72) (-0.99) (-0.46) (2.00) (-0.30) (0.87) Store age -0.0178* -0.0065 0.0313* 0.0273 -0.0146 0.0269** -0.0114 -0.0322 (-2.00) (-0.50) (2.06) (1.67) (-0.72) (2.35) (-0.76) (-1.46) Sales days 0.2311*** 0.1056 -0.3696** -1.7106*** -0.1472 0.2125 0.8202*** 0.5153** (5.11) (0.79) (-2.55) (-3.31) (-0.85) (0.51) (7.30) (2.26) # of nearby stores -0.0183 -0.0055 -0.0240 0.0004 -0.0166 -0.0007 -0.0589** 0.0248 (-1.20) (-0.70) (-1.24) (0.02) (-0.58) (-0.04) (-2.51) (1.47) Distance to head office 0.0051 -0.0104 -0.0370** -0.0498* -0.0187 -0.0615*** -0.0223 0.0123 (0.55) (-0.66) (-2.51) (-1.85) (-1.26) (-4.06) (-1.31) (0.48) Promoter Characteristics Tenure 0.0005 0.0039 -0.0010 -0.0006 -0.0019 -0.0011 0.0086* 0.0063* (0.18) (1.67) (-0.23) (-0.21) (-0.61) (-0.47) (1.66) (1.70) Gender -0.1769** -0.0969 0.1646 -0.0369 0.0367 -0.0335 0.1561 0.0652 (-2.28) (-0.87) (1.25) (-0.27) (0.28) (-0.42) (1.32) (0.47) Pre-intervention value of the dependent variable Yes Yes Yes Yes Yes Yes Yes Yes
Brand fixed effects Yes Yes Yes Yes Yes Yes Yes Yes R2 0.8203 0.8167 0.1889 0.2342 0.2873 0.2079 0.0469 0.0414 Observations 2,156 2,662 241 303 241 303 2,156 2,662

49
Note: This table reports coefficient estimates from OLS regressions in Columns 1-6 and Tobit regressions (with an upper limit=7) in Columns 7 and 8. R2s are reported for OLS regressions and Pseudo R2s for Tobit regressions. t-stats in parenthesis are based on robust standard errors clustered by store. *, **, *** denote significance at a 0.10, a 0.05 and a 0.01 level respectively. “Sales” refers to the natural logarithm of weekly sales for a given brand in a given store. “Value” refers to the score given to the poster by the customer panel on how effective the poster is at communicating the products or deals offered using a not useful (1) – very useful (5) scale. “Novelty” refers to the score given to the poster by the customer panel on how attractive the visual design of the poster is using a not attractive (1) – very attractive (5) scale. “Attendance” refers to the number of days the average promoter working for a brand at the store reported to work during a given week. “Mainstream (Divergent) Markets” refers to the subsample of stores where the demographics of the customers served by the store are homogeneous (heterogeneous) based on the diversity of languages, conditions, and income levels in the area. There are 22 (13) stores in the “Mainstream (Divergent) Markets” subsample. “Info sharing” is an indicator for whether the store is in the treatment group (i.e., where the information sharing system is implemented). “Post” is an indicator for whether the time period is after the intervention (on or after month 5). The appendix provides detailed definitions of the variables.