effects of aerosolized jp-8 jet fuel exposure on the...
TRANSCRIPT

Effects of Aerosolized JP-8 Jet Fuel Exposure on the Immune System: Implications for Human Health
David T Harris, Ph.D.
Dept. Immunobiology
University of Arizona
Disclosure Information84th Annual AsMA Scientific Meeting
David T Harris, PhD
I have no financial relationships to disclose.
I will not discuss off-label use and/or investigational use in my presentation

Introduction: Petroleum products
Toxicity of kerosene-based petroleum distillates in animal and human beings. Hepatic, renal, pulmonary toxicity Neurological toxicity Genotoxicity Cancer clusters identified in military bases
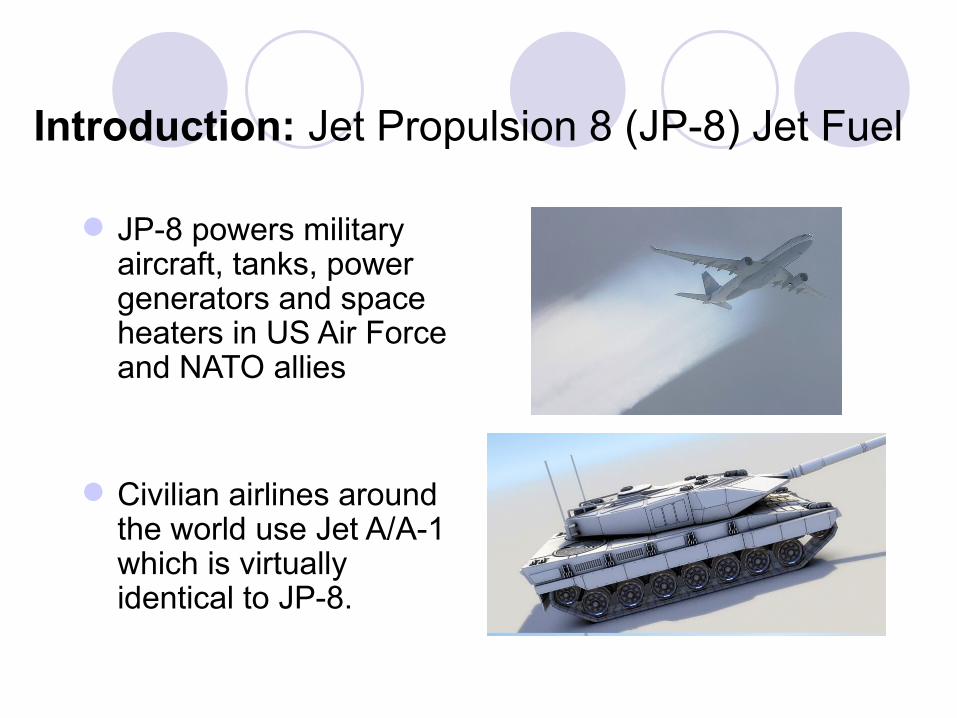
Introduction: Jet Propulsion 8 (JP-8) Jet Fuel
JP-8 powers military aircraft, tanks, power generators and space heaters in US Air Force and NATO allies
Civilian airlines around the world use Jet A/A-1 which is virtually identical to JP-8.
Introduction: JP-8 Toxicity
Jet propulsion fuel 8 (JP-8) has been recognized by the Department of Defense as the single largest chemical exposure for its personnel.
Route: dermal absorption, pulmonary inhalation, and orally.
Persistent damage to the pulmonary system, with some hepatic and renal dysfunction.
Persistent changes in brain stem/cerebellar systems, as well as in complex neurobehavioral performance capacity (reduced endurance, cognitive capacity, etc.).

JP-8 Immunotoxicity
There have generally been no absolute JP8 exposure standards.
The National Research Council recommends: JP-8 exposure be limited to 350mg/m3 over an 8-hr period Short-term exposure limit is 1800 mg/m3

JP-8 Immunotoxicity: Summary of past work
We found that low concentration, short-term exposure to JP-8 resulted in profound and significant alterations in immune function. T cell ↓ and B cell ↑ in immune organs. Depression of immune function Loss of natural killer cell function; lymphokine activated killer cell
activity, cytotoxic T lymphocyte capacity. Precursor cells for cytotoxic and helper T cells were affected Induced high levels of IL-10 and PGE2
Reference: Short –term exposure to JP-8 jet fuel results in longterm immunotoxicity; and, Immunotoxicological effects of JP-8 jet fuel exposure.
Harris DT et. al from Toxocology and industrial health 13 (1) and (5)

JP-8 Immunotoxicity: Summary of past work
We found treatment of mice with substance P was able to reverse/prevent many of the observed effects. Organ weights Cell recovery Immune function
It was possible to wait for 1 or 6 hours post-JP-8 exposure to administer substance P and reverse the effects seen in the immune system. Administration of substance P 1 or 6 hours prior to exposure had no effects.

Significance
If JP-8 exposure in humans results in similar alterations in immune function as seen in animals, it could have serious consequences for exposed USAF and civilian personnel.
Knowing the mechanisms of action of both JP-8, it may be possible to prevent or ameliorate the detrimental effects on the immune system.
The results should have significant implications for the health, well being and medical treatment of JP-8 exposed individuals.

Project Goals
To elucidate the potential mechanisms of action of inhaled JP-8 on the immune system
To elucidate the potential protective mechanisms of substance P (SP) to reduce or reverse JP8 toxicity.

Specific aims: to elucidate potential Mechanisms of JP-8-Mediated Immunotoxicity
Determine if the immunotoxicity of JP-8 is due to direct or indirect effect compare in vitro and in vivo immunotoxicity exposures
Determine if the immunotoxiicity of JP-8 is due to the type of exposure conditions compare the “old” aerosol exposure apparatus vs. the “new” total JP-8 (vapor
+ aerosol) apparatus
Determine if the immunotoxicity is due to jet fuel hydrocarbon compositions (JP8 vs. S8 exposures)
Determine if the immunotoxicity is due to loss of substance P protective mechanisms of Substance P administration
Perform microarray analyses to determine the potential molecular mechanism of JP-8 immunotoxicity.

Experimental design: human vs. animal exposures
To study the immunotoxicity induced by JP-8 exposure, comparable low-medium dosage exposures observed in human subjects were used in animals.

Experimental design: In vitro vs. in vivo exposures
To analyze JP-8 immunotoxicity both in vitro and in vivo, comparable exposure dosages and immune assays were used.
In vitro 50mg/m3 eq (0.1μg/ml) and 100mg/m3 eq (0.2 μg/ml) in mice
is ≈ the same as in vivo 1000 mg/m3 and 2500 mg/m3 (low to moderate) doses in mice in old exposure system
is ≈ equivalent to low to medium human exposures.
Reference: Improved method for in vitro assessment of dermal toxicity for volatile organic chemicals Toxicology Letters 135 (2002) 125–135

IN VITRO IMMUNOTOXICITY

JP-8 in vitro immunotoxicity experimental design
2 JP-8 doses: JP-8 50 mg/m3 eq or 100mg/m3 eq 3 time points studied: day 1, day 4, and day 7 3 immune organs and tissues analyzed: spleen, thymus,
and bone marrow Immune assays
Cell recovery, viability, immune cell phenotype changes (FACS) Proliferation, apoptosis, bone marrow CFU Cytokine secretion

JP-8 in vitro immunotoxicity: Rationale
These studies could help us determine whether the effects of JP-8 on the immune system are mediated by direct action on immune cells, or whether the effects are mediated indirectly through non-immune cells (such as via inflammatory reactions of lung cells or dermal fibroblasts).

Spleen cell numbers after in vitro JP-8 exposure
Spleen cell recovery ratio after in vitro JP8 exposure at 100mg/m3 eq
Day 1 Day 4 Day 7
Cel
l re
cove
ry n
um
be
rs (
X1
04)
0
50
100
150
200Air JP8 Air + ConA JP8+ConA
*
*
* *

Thymocyte recovery after in vitro JP-8 exposure
Thymus cell recovery ratio after in vitro JP8 exposure at 100mg/m3 eq
Day 1 Day 4 Day 7
Ce
ll re
cove
ry n
um
be
rs (
X1
04)
0
20
40
60
80
100
120
140
160Air JP8
**

Bone marrow recovery after in vitro JP-8 exposure
Bone marrow cell recovery after in vitro JP8 exposure at 100mg/m3 eq
Day 1 Day 4 Day 7
Ce
ll re
cove
ry n
um
bers
(X
10
4)
0
20
40
60
80
100
120
140
160
180Air JP8
*
*

Spleen cell viability after in vitro JP-8 exposure
Spleen cell viability after in vitro JP8 exposure at 100mg/m3 eq
Day 1 Day 4 Day 7
Via
bili
ty (
%)
0
20
40
60
80
100Air JP8 Air + ConA JP8+ConA
*
*
*

Thymocyte and bone marrow viability after in vitro JP-8 exposure
Thymocytes viability after in vitro JP8 exposure at 100mg/m3 eq
Day 1 Day 4 Day 7
Via
bilit
y (%
)
0
10
20
30
40
50
60
70Air JP8
Bone marrow cells viability after in vitro JP8 exposure at 100mg/m3 eq
Day 1 Day 4 Day 7
Viability (%)
86
88
90
92
94
96
98
100Air JP8

Spleen cell MTT proliferation assay after in vitro JP-8 exposure
Spleen proliferation after in vitro JP8 exposure at 50 and 100mg/m3 eq
50mg/m3 100mg/m3
Ra
tio
0.0
0.2
0.4
0.6
0.8
1.0
1.2Control Day 1 Day 4 Day 7
**
*
**
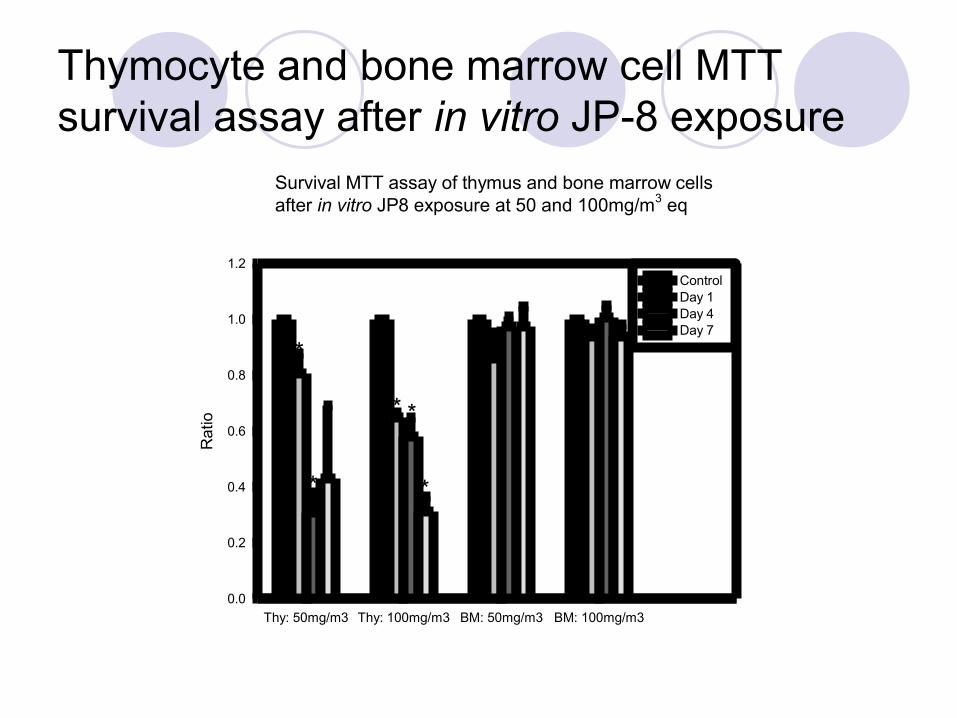
Thymocyte and bone marrow cell MTT survival assay after in vitro JP-8 exposure
Survival MTT assay of thymus and bone marrow cells after in vitro JP8 exposure at 50 and 100mg/m3 eq
Thy: 50mg/m3 Thy: 100mg/m3 BM: 50mg/m3 BM: 100mg/m3
Ra
tio
0.0
0.2
0.4
0.6
0.8
1.0
1.2Control Day 1 Day 4 Day 7
*
*
**
*

Thymocyte and bone marrow MTT survival assay after in vitro JP-8 exposure
Bone marrow MTT survival assay after in vitro JP8 exposure at 50 amd 100mg/m3 eq
50mg/m3 100mg/m3R
atio
0.0
0.2
0.4
0.6
0.8
1.0
1.2
Control Day 1 Day 4 Day 7
* *
*
Thymus MTT survival assay after in vitro JP8 exposure at 50 and 100mg/m3 eq
50mg/m3 100mg/m3
Rat
io
0.0
0.2
0.4
0.6
0.8
1.0
1.2
Control Day 1 Day 4 Day 7
***
***

Bone marrow CFU assay after in vitro JP-8 exposure
Bone marrow cells CFU assay
Day 1 Day 4 Day 7
Ra
tio
0.0
0.2
0.4
0.6
0.8
1.0
1.2Air JP8
0.9
0.9

MTT survival assay demonstrates bone marrow cells are more resistant than spleen and thymus cells to JP-8
MTT assay after JP8 50mg/m3 eq in vitro exposure
Day0 Day1 Day4 Day7
Rat
io
0.0
0.2
0.4
0.6
0.8
1.0
1.2
Bone marrowSpleenThymus
* **
*
MTT assay after JP8 100mg/m3 eq in vitro exposure
Day0 Day1 Day4 Day7
Rat
io
0.2
0.4
0.6
0.8
1.0
1.2
Bone marrowSpleenThymus
*
** *
*

Bone marrow cells are more resistant to JP8 exposure
Bone marrow cells CFU assay
Day 1 Day 4 Day 7
CF
U r
atio
0.0
0.2
0.4
0.6
0.8
1.0
1.2Air JP8
0.9
0.9
Cell viability ratio after JP8 100mg/m3 eq in vitro exposure
Day0 Day1 Day4 Day7
Rat
io
0.3
0.4
0.5
0.6
0.7
0.8
0.9
1.0
1.1
Bone marrowSpleenThymus
*
*
**

Apoptosis in different spleen cell subsets after in vitro JP-8 exposure
Spleen apoptosis ratio after in vitro JP8 exposure at 50mg/m3 eq
CD4+ CD8+ CD11b+ CD45R+
Ra
tio
0
20
40
60
80
100
120Control at day 1JP8 at day 1 Control at day 4JP8 at day 4
Day 7 had too many cell death, so it’s not included

Apoptosis in different bone marrow cell subsets after in vitro JP-8 exposure
Bone marrow apoptosis ratio after in vitro JP8 exposure at 50mg/m3 eq
CD4+ CD8+ CD11b+ CD45R+
Ra
tio
0
20
40
60
80
100Control at day 1JP8 at day 1 Control at day 4JP8 at day 4
*
Day 7 had too many cell death, so it’s not included

In vitro Cytokine Release Assay
Intracellular cytokine staining: cells were stimulated for 2 days as above and then were fixed and permeabilized. Cytokine secretion were measured by 3-color FACS analysis.
We used intracellular cytokine staining instead of anti-CD3 mAb-coated plates ELISA assay because cytokine production by each sub-population (such as CD3+, CD4+ or CD8+ cells in an immune organ) can be measured by flow cytometry.

IL-4 cytokine secretion from CD4+ spleen cells after in vitro JP-8 exposure
IL-4 secretion from spleen CD4+ cells after in vitro JP8 exposure
50mg/m3 100mg/m3
Rati
o
0.0
0.2
0.4
0.6
0.8
1.0
1.2
1.4
Control Day 1Day 4
*
*

IL-10 cytokine secretion from spleen CD8+ cells after in vitro JP-8 exposure
IL-10 secretion from Spleen CD8+ cells after in vitro JP8 exposure
50mg/m3 100mg/m3
Ra
tio
0.0
0.2
0.4
0.6
0.8
1.0
1.2Control Day1Day 4
***

Summary: In vitro JP-8 immunotoxicity
In vitro exposure to JP-8 jet fuel caused Decreased immune cell recovery, spleenocytes viability
and proliferation.Decreased cytokine secretion in different cell subsets.
Spleen and thymus cells were highly susceptible, while bone marrow cells were relatively resistant to the effects.

IN VIVO IMMUNOTOXICITY

In Vivo JP-8 immunotoxicity
Dosage: comparable to in vitro experiments Exposure system: old aerosol exposure system 3 time points studied: day 1, day 4, day 7 (comparable to
in vitro experiments) 4 immune organs and tissues analyzed: spleen, thymus,
bone marrow, and blood cells Immune assays (comparable to in vitro experiments):
Cell recovery, viability, Immune cell phenotype changes Proliferation, apoptosis, CFU Cytokines secretion

Immune cell recovery and cell viability after in vivo JP-8 exposure
Cell recovery ratio after in vivo JP8 exposure
Spleen Thymus
Rat
io
0.0
0.2
0.4
0.6
0.8
1.0
1.2
1.4
1.6
1.8
2.0ControlDay1 Day4 Day7
*
*
**
Cell viability after in vivo JP8 exposure
Spleen Thymus
Ratio
0.70
0.75
0.80
0.85
0.90
0.95
1.00
1.05ControlDay1 Day4 Day7
**

In vivo exposure elucidate immune reaction process to JP8 exposure
After JP-8 exposure, blood lymphocytes rapidly increased, then mice became leukopenic.
At this time, bone marrow cells started to increase possibly to make up for the loss of lymphocytes in the blood. Finally, cells in the spleen and thymus decreased.

Thymocyte apoptosis in different thymocytes subsets after in vivo JP-8 exposure
Thymus apoptosis ratio after in vivo JP8 exposure
CD4+ CD8+ CD11b+ CD45R+
Rat
io
0
20
40
60
80ControlDay 1 Day 4Day 7
* *
**

IL-10 cytokine secretion from spleen CD8+ cells after in vivo JP-8 exposure
IL-10 secretion by spleen CD8+ cells after In vivo JP8 exposure
IL-10
Rati
o
0.0
0.2
0.4
0.6
0.8
1.0
1.2ControlDay 1 Day 4Day 7
* *

Summary:JP-8 1000mg/m3 in vivo immunotoxicity
Published data: adversely affected the immune systemDecreased immune organ weightsDecreased cell viability and cell recoveryDecreased NK cell, CTL and Th cell funtion
Findings in this part Increased thymocytes apoptosis
JP-8 jet fuel exposure induced the secretion of IL-10 from spleen CD8+ T cells.
Reference: Short –term exposure to JP-8 jet fuel results in longterm immunotoxicity; and, Immunotoxicological effects of JP-8 jet fuel exposure. Harris DT et. al from Toxocology and industrial health 13 (1) and (5)

The Effect of Exposure Conditions on JP-8
Immunotoxicity

Effects of exposure conditions: comparison of old vs. new exposure apparatus
Old exposure apparatus Measures aerosol jet fuel only. Determines jet fuel concentration by GC and a seven-stage
cascade impactor during and after the exposure.
New exposure apparatus: Utilizes a different Nebulizer Real-time in-line monitoring system (Total hydrocarbon (THC)
analysis system) of vapor and aerosol jet fuel Tests the exposure concentrations both in aerosol and vapor by
gas chromatography.

Effects of exposure conditions: aerosol vs vapor form of Jet fuel
Old methodology did not account for vapor levels of JP-8 jet fuel because the technology did not exist to measure both aerosol and vapor levels simultaneously.
Old methodology underestimated the TOTAL JP-8 levels by a factor of 8.1. In other words, the old 1000 mg/m3 exposure was actually 8,100 mg/m3 of total JP-8 jet fuel, when both aerosol and vapor levels were included. Conversely, the new 1000 mg/m3 JP-8 exposure is really 123.5 mg/m3 of aerosolized JP-8.

Effects of exposure conditions: comparison of old vs. new exposure apparatus
Dosage Old exposure system: 1000 and 2500 mg/m3
New exposure system: 1000, 2000, 4000, 8000 mg/m3
Time: 1h/day exposure for 7 days, assay at day 8 Assays
Histopathology (Liver, lung, kidney, immune organs and bone marrow) Hematology (blood work) Body weights and Immune organ weights Immune cell recovery Immune cell phenotypes Cell viability assays Immune cell function by intracellular cytokines test

Histopathology: JP-8 old exposure system
Liver, Lung, Cervical Lymph Nodes, Salivary Glands, Spleen and Thymus had no gross lesions/changes at either day 1, 4 or 7 of jet fuel exposure.
Kidney in all mice were normal except for slight lesions observed only at day 4 of exposure.

Histopathology: JP8 new exposure system
Liver, Lung, Cervical Lymph Nodes, Salivary Glands, Spleen and Thymus had no gross lesions/changes at day 7 of either JP8 jet fuel exposure.
Bone marrow histopathology was completely normal for either JP8 exposure.
There was indication of type II pneumocyte hyperplasia at the 8000 mg/m3 dose.

Hematology: JP-8 old exposure system
Day 1: Monocytosis; Leukocytosis, Lymphocytosis, Eosinophilia in some mice; Polycythemia; high MCHC
Day 4: Monocytosis & Lymphocytosis; Eosinophilia; high MCHC; Polycythemia
Day 7: Neutrophilia; Polycythemia; high MCHC; Platelet number normal but low MPV

Hematology: JP-8 new exposure system
Some indication of mild polycythemia in some mice due to JP8 exposure at all doses.
No significant effects on platelets, leukocytes or granulocytes.

Effect of JP-8 exposure on body and immune organ weights
“Old” Exposure System “New” Exposure System
Body Spleen Thymus
Per
cent
of C
ontr
ol
0
10
20
30
40
50
60
70
80
90
100 10002500
**
**
A
Body Spleen Thymus
Per
cen
t of C
ont
rol
0
10
20
30
40
50
60
70
80
90
100 1000200040008000
*
**
**
* * * *
*
*
B

Effects of JP-8 Exposure on Spleen Cell Phenotype
Left panel- data from published paper “Protection from JP-8 jet fuel induced immunotoxicity by administration of aerosolized substance P” by Harris DT et. al on Toxicology and industrial Health; 13 (5)
Spleen subsets after JP8 exposure by using new exposure system
CD3 CD3CD4 CD3CD8 CD11b CD45R
Rat
io
0.0
0.5
1.0
1.5
2.0
2.51000 2000 4000 8000
*
*
**
*
**
Spleen subsets after JP8 exposure by using old exposure system
CD4 CD8 CD11b CD45R
Rat
io
0.0
0.5
1.0
1.5
2.0
2.51000 2500
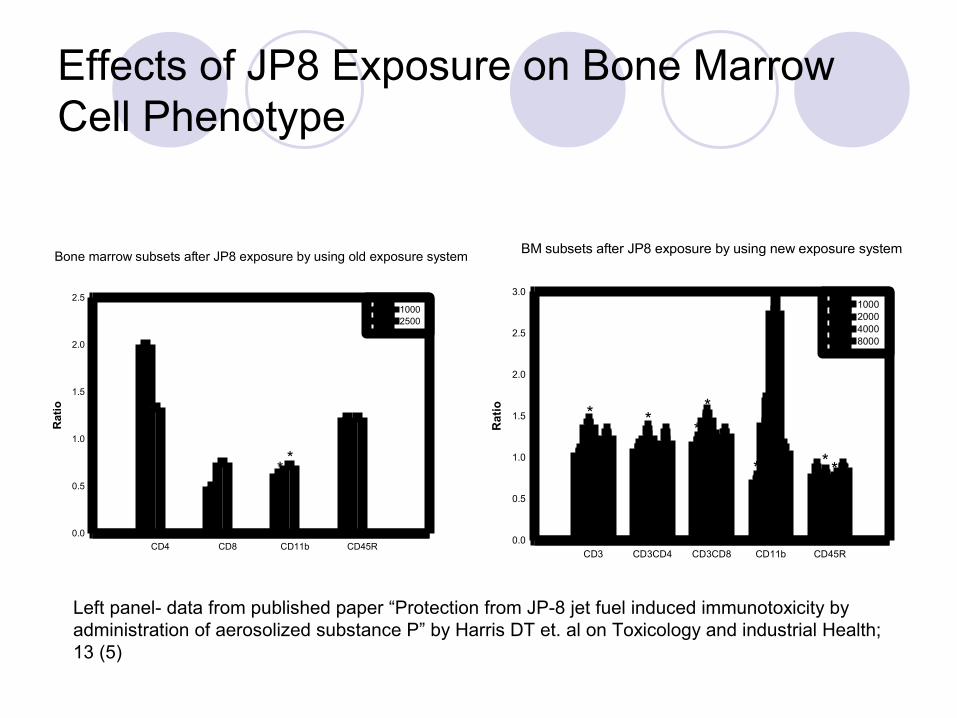
Effects of JP8 Exposure on Bone Marrow Cell Phenotype
BM subsets after JP8 exposure by using new exposure system
CD3 CD3CD4 CD3CD8 CD11b CD45R
Rat
io
0.0
0.5
1.0
1.5
2.0
2.5
3.01000 2000 4000 8000
* *
* *
*
**
* *
Bone marrow subsets after JP8 exposure by using old exposure system
CD4 CD8 CD11b CD45R
Rati
o
0.0
0.5
1.0
1.5
2.0
2.51000 2500
**
Left panel- data from published paper “Protection from JP-8 jet fuel induced immunotoxicity by administration of aerosolized substance P” by Harris DT et. al on Toxicology and industrial Health; 13 (5)

Effects of JP-8 Exposure on Peripheral Blood Cell Phenotype
Blood subsets after JP8 exposure by using old exposure system
CD3 CD11b CD45R
Rat
io
0.0
0.5
1.0
1.5
2.0
2.51000 2500
* *
*
Left panel- data from published paper “Protection from JP-8 jet fuel induced immunotoxicity by administration of aerosolized substance P” by Harris DT et. al on Toxicology and industrial Health; 13 (5)
Blood subsets after JP8 exposure by using new exposure system
CD3 CD3CD4 CD3CD8 CD11b CD45R
Rat
io
0
1
2
3
41000 2000 4000 8000
** * *

Effects of JP-8 Exposure on Thymus Subsets
Thymus subsets after JP8 exposure
CD4-CD8+ CD4+CD8+ CD4-CD8- CD4+CD8-
Rat
io
0
1
2
3
4
5
61000 2000 4000 8000
** *
Thymus subsets after JP8 exposure by using old exposure system
CD4-CD8+ CD4+CD8+ CD4-CD8- CD4+CD8-
Rat
io
0
1
2
3
4
5
61000 2500
* *
Left panel- data from published paper “Protection from JP-8 jet fuel induced immunotoxicity by administration of aerosolized substance P” by Harris DT et. al on Toxicology and industrial Health; 13 (5)

Effects of JP-8 Exposure on Immune Cell Phenotype using the “Old” Exposure System
1000 mg/m3, 1h/d, 7dDecreased Thymic DP cellsDecreased Blood T cellsIncreased Bone Marrow hematopoiesis
2500 mg/m3, 1h/d, 7dDecreased Thymic DP cellsDecreased Blood T cellsIncreased Bone Marrow hematopoiesis
data from published paper “Protection from JP-8 jet fuel induced immunotoxicity by administration of aerosolized substance P” by Harris DT et. al on Toxicology and industrial Health; 13 (5)

Effects of JP8 Exposure on Immune Cell Phenotype using the “New” Exposure System
1000 mg/m3, 1h/d, 7d
Decreased Bone Marrow B cells
2000 mg/m3, 1h/d, 7d
Decreased Blood inflammatory cells
4000 mg/m3, 1h/d, 7d
Increased Bone Marrow hematopoiesis
8000 mg/m3, 1h/d, 7d
Decreased Blood T cells

Effect of JP-8 Exposure on Immune Cell Recovery
“Old” Exposure System “New” Exposure System
Bone marrow Spleen Thymus Blood
Per
cent
of C
ontr
ol
0
20
40
60
80
100
120
14010002500
*
**
**
*
*
A
Bone marrow Spleen Thymus Blood
Pe
rce
nt o
f Co
ntro
l
0
50
100
150
2001000200040008000
**
*
* ** *
*
B

Effect of JP-8 Exposure on Immune Function
“Old” Exposure System “New” Exposure System
Proliferation assay
0 1000 2500
Per
cent
of C
ont
rol
010
2030
40
5060
7080
90100
*
*
A
- ConA 4000 + ConA 8000 + ConA
Per
cent
of
IFN
-γ+
cells
0
10
20
30
40
50AirJP8
**
B

Summary: Effects of New Exposure Apparatus
A total exposure to 1000 mg/m3 jet fuel with the “new” apparatus represents an exposure concentration of approximately 125 mg/m3 aerosolized JP8 with the “old” exposure apparatus. However, the exposure parameters also differ slightly from previous work.
The differences between the two exposure systems in terms of changes in immune responses could be the result of the much lower aerosolized JP-8 dosage under the exposure conditions with the new system
Thus, effects on the immune system may be tied directly to total aerosol JP8 concentration, regardless of total JP8 concentration during exposure.

Discussion: Aerosol vs. Vapor Exposure
Our experiments demonstrated it’s probably the aerosol, not the vapor form of jet fuel had the major immunotoxicity in pulmonary inhalation route.
USAF collaborating biomedical engineering labs had developed models for JP8 droplets and vapor deposition in the upper airway. The aerosol form (not the vapor form) of JP-8 can travel deeply into the lung and then being absorbed by the tissue, which is very similar to the dermal absorbance of JP-8
Reference: computational Thermodynamics Analysis of Vaporizing Fuel Droplets in the Human Upper Airways. Zhang z. and Kleinstreuer C, JSME International Journal Series B Vol. 46 (2003) pp.563-571
THE EFFECT OF JET FUEL HYDROCARBON COMPOSITION ON IMMUNOTOXICITY

Comparison of JP8 vs. S8 jet fuels
JP-881% aliphatic alkanes, primarily in the C8-
C17 range18% polycyclic aromatic hydrocarbons
S-8: Fischer-Tropsch JP-8solely synthetic aliphatic alkanes
eliminates the 18% polycyclic aromatic hydrocarbon in JP-8 jet fuel.
S8 was synthesized as an attempt to determine whether aliphatic alkanes or the polycyclic aromatic component was responsible for the observed toxicological effects observed in various physiological systems.

S8 Jet Fuel Toxicity
Collaborating labs have demonstrated potential significant differences in the pulmonary response to S-8 versus JP-8 jet fuels at a 400 mg/m3 dose (both aerosol and vapor).
We wanted to determine if the effects on the immune system would be different between JP-8 and S-8 exposures.
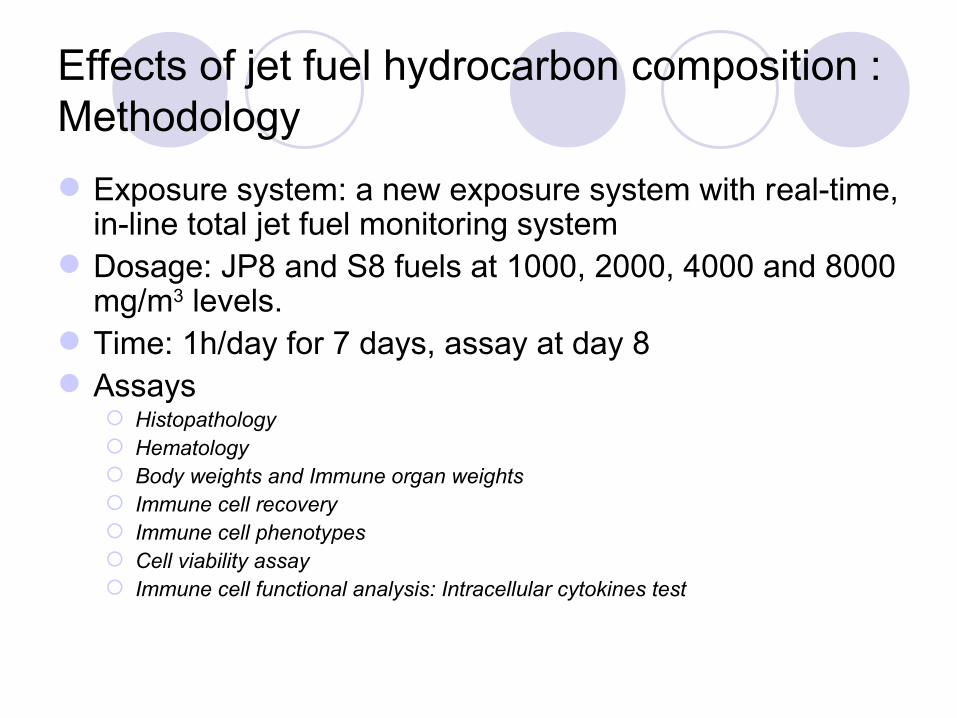
Exposure system: a new exposure system with real-time, in-line total jet fuel monitoring system
Dosage: JP8 and S8 fuels at 1000, 2000, 4000 and 8000 mg/m3 levels.
Time: 1h/day for 7 days, assay at day 8 Assays
Histopathology Hematology Body weights and Immune organ weights Immune cell recovery Immune cell phenotypes Cell viability assay Immune cell functional analysis: Intracellular cytokines test
Effects of jet fuel hydrocarbon composition : Methodology

Effect of Jet Fuel Composition on Body and Immune Organ Weights
JP-8 Jet Fuel S8 Jet Fuel
Body Spleen Thymus
Per
cent
of C
ont
rol
0
10
20
30
40
50
60
70
80
90
100 1000200040008000
*
**
**
* * * *
*
*
B
Body Spleen Thymus
Per
cent
of C
ontr
ol
0
10
20
30
40
50
60
70
80
90
1001000200040008000
*
** *
**
* * *
*
*
*
* *
C
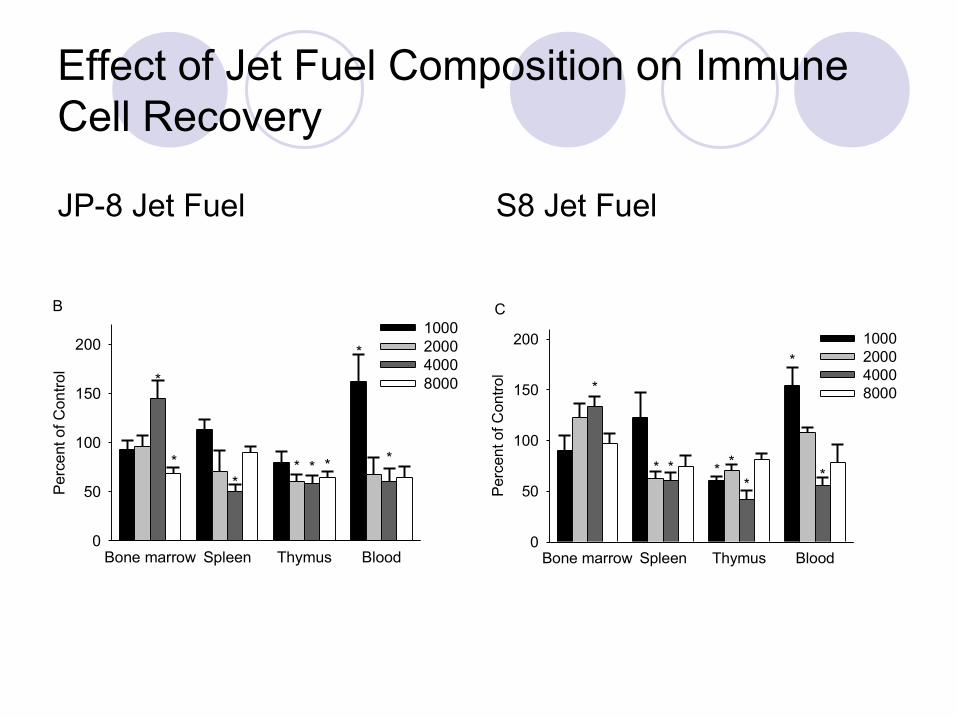
Effect of Jet Fuel Composition on Immune Cell Recovery
JP-8 Jet Fuel S8 Jet Fuel
Bone marrow Spleen Thymus Blood
Pe
rce
nt o
f Con
tro
l
0
50
100
150
2001000200040008000
**
*
* ** *
*
B
Bone marrow Spleen Thymus Blood
Per
cen
t of C
ontr
ol
0
50
100
150
200 1000200040008000
*
*
** *
** *
*
*
C

Effect of Jet Fuel Composition on Spleen cell subsets
Spleen CD3+ population
1000 2000 4000 8000
Rat
io
0.0
0.5
1.0
1.5
2.0
2.5Air S8 JP8
*
Spleen CD3+CD8+ population
1000 2000 4000 8000
Rat
io
0.0
0.5
1.0
1.5
2.0
2.5Air S8 JP8
*

Effect of Jet Fuel Composition on Spleen cell subsets
Spleen CD3+CD4+ population
1000 2000 4000 8000
Rat
io
0.0
0.5
1.0
1.5
2.0
2.5Air S8 JP8
Spleen CD11b+ population
1000 2000 4000 8000
Rat
io
0.0
0.5
1.0
1.5
2.0
2.5Air S8 JP8
* *

Effect of Jet Fuel Composition on Spleen cell subsets
Spleen CD45R+ population
1000 2000 4000 8000
Ra
tio
0.0
0.5
1.0
1.5
2.0
2.5Air S8 JP8
* *

Effect of Jet Fuel Composition on Bone Marrow Subsets
Bone marrow CD3+ population
1000 2000 4000 8000
Rat
io
0.0
0.5
1.0
1.5
2.0
2.5Air S8 JP8
*
*
Bone marrow CD3+CD8+ population
1000 2000 4000 8000
Rat
io
0.0
0.5
1.0
1.5
2.0
2.5Air S8 JP8
*
**

Effect of Jet Fuel Composition on Bone Marrow Subsets
Bone marrow CD3+CD4+ population
1000 2000 4000 8000
Rat
io
0.0
0.5
1.0
1.5
2.0
2.5Air S8 JP8
*
*
*
Bone marrow 11b+ population
1000 2000 4000 8000
Rat
io
0.0
0.5
1.0
1.5
2.0
2.5Air S8 JP8
*
*
*

Effect of Jet Fuel Composition on Bone Marrow Subsets
Bone marrow 45R+ population
1000 2000 4000 8000
Ra
tio
0.0
0.5
1.0
1.5
2.0
2.5Air S8 JP8
* ** * *

Effect of Jet Fuel Composition on Peripheral Blood Subsets
Blood CD3+ population
1000 2000 4000 8000
Rat
io
0.0
0.5
1.0
1.5
2.0
2.5Air S8 JP8
*
Blood CD3+CD8+ population
1000 2000 4000 8000
Rat
io
0
1
2
3
4Air S8 JP8
* *

Effect of Jet Fuel Composition on Peripheral Blood Subsets
Blood CD3+CD4+ population
1000 2000 4000 8000
Rat
io
0
1
2
3
4Air S8 JP8
* **
Blood CD11b+ population
1000 2000 4000 8000
Rat
io
0
1
2
3
4Air S8 JP8
*

Effect of Jet Fuel Composition on Peripheral Blood Subsets
Blood CD45R+ population
1000 2000 4000 8000
Rat
io
0.0
0.5
1.0
1.5
2.0
2.5Air S8 JP8

Effect of Jet Fuel Composition on Thymus subsets
Thymus subsets after JP8 exposure
CD3 CD3CD4 CD3CD8
Rat
io
0
1
2
3
41000 2000 4000 8000
*
Thymus subsets after S8 exposure
CD3 CD3CD4 CD3CD8
Rat
io
0
1
2
3
41000 2000 4000 8000

Effect of Jet Fuel Composition on Thymus subsets
Thymus subsets after S8 exposure
CD4-CD8+ CD4+CD8- CD4-CD8- CD4+CD8+
Rat
io
0
1
2
3
4
5
61000 2000 4000 8000
*
*
*
*
*
*
Thymus subsets after JP8 exposure
CD4-CD8+ CD4+CD8- CD4-CD8- CD4+CD8+
Rat
io
0
1
2
3
4
5
61000 2000 4000 8000
** *

Effects of JP-8 Exposure on Thymus subsets
Thymus CD4+CD8+ population
1000 2000 4000 8000
Ratio
0.6
0.7
0.8
0.9
1.0
1.1Air S8 JP8
**
** *
*

Thymic sub-populations were affected by jet fuel exposure
CD4CD8 double-positive thymocytes significantly decreased. Double-positive cells are known to be prone to apoptosis during T-cell development and give rise to all mature peripheral blood T cells.
All CD4CD8 single positive and double-negative population in thymus increased after jet fuel exposure, probably due to the loss of double-positive populations

Effect of JP-8 Composition on Immune Function
- ConA 4000 + ConA 8000 + ConA
Per
cent
of I
FN
-
cells
0
10
20
30
40
50AirJP8 S8
**
B
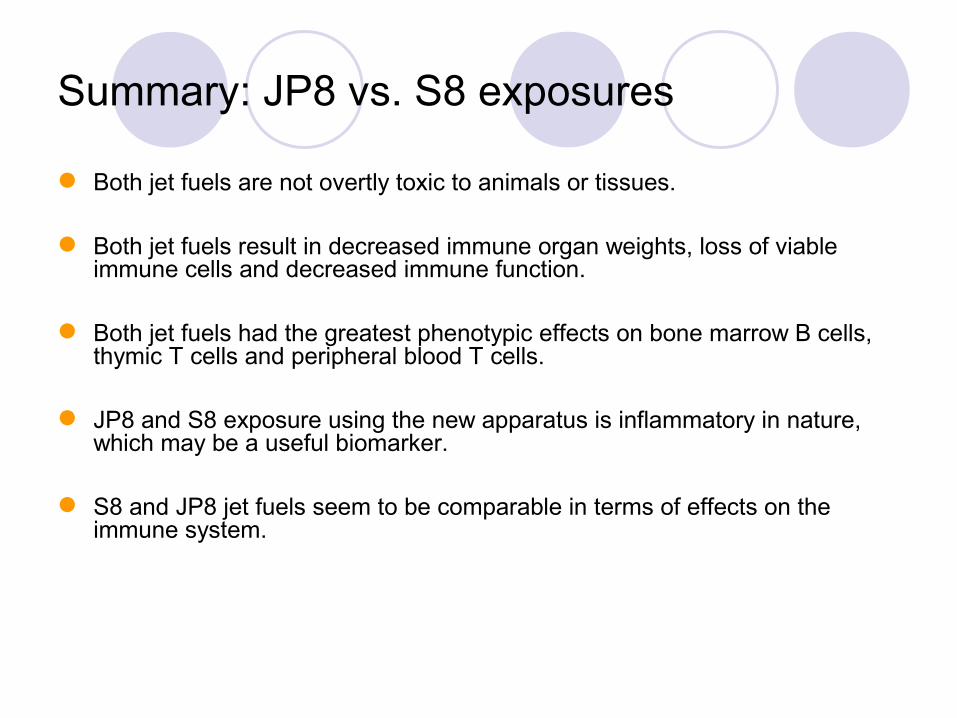
Summary: JP8 vs. S8 exposures
Both jet fuels are not overtly toxic to animals or tissues.
Both jet fuels result in decreased immune organ weights, loss of viable immune cells and decreased immune function.
Both jet fuels had the greatest phenotypic effects on bone marrow B cells, thymic T cells and peripheral blood T cells.
JP8 and S8 exposure using the new apparatus is inflammatory in nature, which may be a useful biomarker.
S8 and JP8 jet fuels seem to be comparable in terms of effects on the immune system.

Discussion: JP8 vs. S8 exposures
Studies from USAF collaborating biomedical engineering labs had quantitated the absorption and partitioning of hydrocarbon components of JP-8 Jet fuel. They also found concentrations of the aliphatic chemicals found in the skin correlated well with carbon number.
Studies from collaborating lung function labs discovered S8 was more toxic to dermis of the lung; labs studying dermal toxicity also demonstrated S8 retained in the skin longer than JP-8.
This indicated that S8 might have been generated into more aerosol form than JP-8 in respiratory exposure, as well as sustained longer in the dermal expsure.
Therefore USAF has stopped the trial demonstrations of S8 as alternative fuel based on the research results from collaboration of labs in different fields.
Reference: novel characterization of the aerosol and gas-phase composition of aerosolized jet fuel. Raphael T. Tremblay, Sheppard A. Martin, Jeffrey W. Fisher. Inhalation Toxicology. April 2010, Vol. 22, No. 5 : Pages 394-401

PART V: EFFECTS OF SUBSTANCE P (SP) ON JP-8 IMMUNOTOXICITY

Background: Protective mechanisms of SP administration
Substance P (SP): an 11 aa neuropeptide, found in nerves as well as in the alveolar epithelium. Role is to maintain integrity of these tissues.
Can modulate immune system as its receptors are found on lymph nodes, T cells, B cells, MΦ, and mast cells.
Previous data showed that treatment of mice with the substance P -15 minutes before to +6 hours after JP-8 exposure using old system was able to reverse/prevent many of the observed effects (using pM range SP concentrations). But not at other time points.
Methods: Protective mechanisms of SP administration
Ascertain if substance P mediates its protective effects locally in the lung or peripherally after JP8 exposure.
JP-8 exposure via aerosol route followed by substance P treatment 15min after exposure
Assay: pathology, hematology, organ weights, cell recovery ratio, viability, proliferation, apoptosis, cytokine production.
Two possible protective mechanisms: Directly in the lung: aerosol route Indirectly in peripheral

Pathology: Protective mechanisms of SP administration from old exposure system
Similar to JP-8 exposure alone

Hematology: Protective mechanisms of SP administration in old exposure system
Day 1: Monocytosis; Leukocytosis, Lymphocytosis, Eosinophilia in some mice; Polycythemia; high MCHC; SP mostly reversed these effects
Day 4: Monocytosis & Lymphocytosis; Eosinophilia; high MCHC; Polycythemia; SP reversed some of the effects
Day 7: Neutrophilia; Polycythemia; high MCHC; Platelet number normal but low MPV; SP reversed some of the effects

Body and immune organ weight after JP8 and Substance P treatment
Effects of substance P treatment on body and immune organ weight
Body Spleen Thymus
Ra
tio
0.0
0.2
0.4
0.6
0.8
1.0
1.2
1.4Air Air+SP S8 S8+SP JP8 JP8+SP * * *
*** *
***
Effect of substance P treatment on body and immune organ weight
Body Spleen Thymus
Rat
io
0.0
0.2
0.4
0.6
0.8
1.0
1.2
1.4
1.6
1.8
2.0S8SP vs S8 JP8SP vs JP8
*
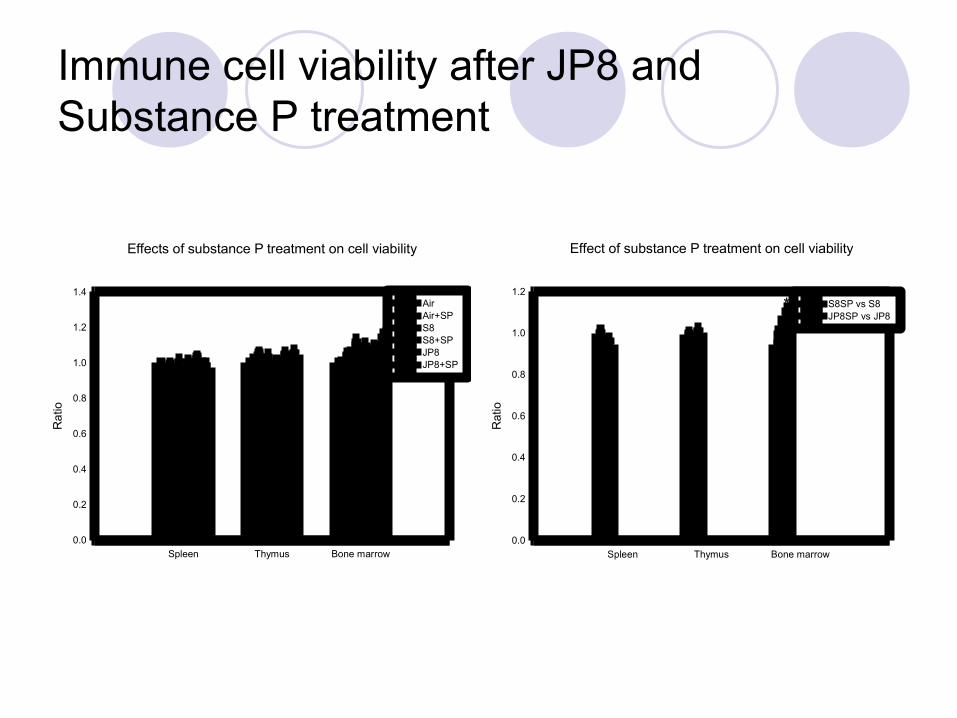
Immune cell viability after JP8 and Substance P treatment
Effect of substance P treatment on cell viability
Spleen Thymus Bone marrow
Rat
io
0.0
0.2
0.4
0.6
0.8
1.0
1.2S8SP vs S8 JP8SP vs JP8
*
*
Effects of substance P treatment on cell viability
Spleen Thymus Bone marrow
Ra
tio
0.0
0.2
0.4
0.6
0.8
1.0
1.2
1.4Air Air+SP S8 S8+SP JP8 JP8+SP
*

Immune cell recovery after JP8 and Substance P treatment
Effects of substance P treatment on immune cell recovery
Spleen Thymus Bone marrow Blood
Rat
io
0.0
0.5
1.0
1.5
2.0
2.5
3.0Air Air+SP S8 S8+SP JP8 JP8+SP
*
****
*
*
Effect of substance P treatment on immune cell recovery
Spleen Thymus Bone marrow Blood
Rat
io
0.0
0.5
1.0
1.5
2.0
2.5S8SP vs S8 JP8SP vs JP8 *
*
*
* *

Spleen cell apoptosis after JP8 exposure and Substance P treatment
Apoptosis ratio of spleen CD4+ cells
Day 1 Day 4
Ra
tio
0
2
4
6
8
10
12
14Air Air+SP JP8 JP8+SP
Apoptosis ratio of spleen CD8+ cells
Day 1 Day 4
Ra
tio
0
10
20
30
40
50
60Air Air+SP JP8 JP8+SP
Apoptosis ratio of spleen CD11b+ cells
Day 1 Day 4
Rat
io
0
2
4
6
8
10
12
14
16
18Air Air+SP JP8 JP8+SP
*
Apoptosis ratio of spleen CD11b+ cells
Day 1 Day 4
Ra
tio
0
2
4
6
8
10
12
14
16
18Air Air+SP JP8 JP8+SP
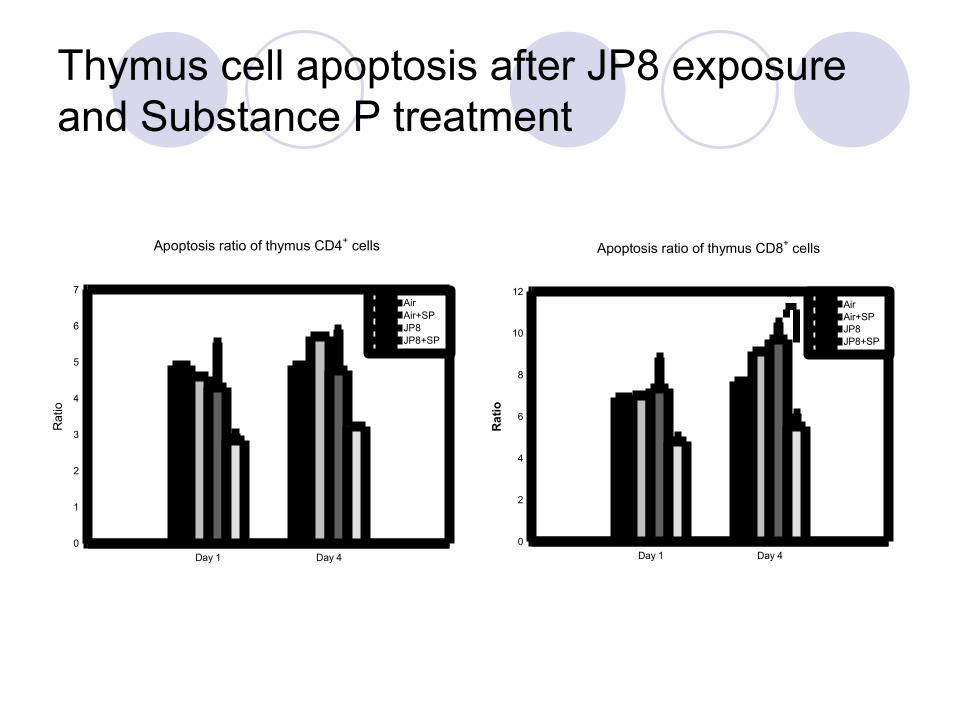
Apoptosis ratio of thymus CD4+ cells
Day 1 Day 4
Rat
io
0
1
2
3
4
5
6
7Air Air+SP JP8 JP8+SP
Thymus cell apoptosis after JP8 exposure and Substance P treatment
Apoptosis ratio of thymus CD8+ cells
Day 1 Day 4
Ra
tio
0
2
4
6
8
10
12Air Air+SP JP8 JP8+SP
*
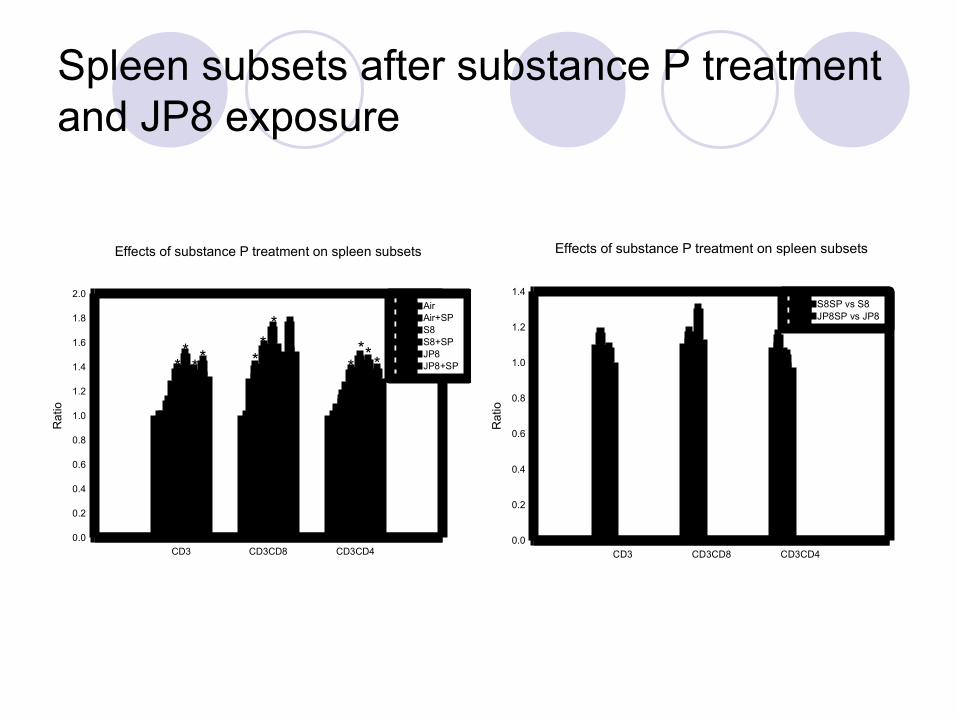
Spleen subsets after substance P treatment and JP8 exposure
Effects of substance P treatment on spleen subsets
CD3 CD3CD8 CD3CD4
Rat
io
0.0
0.2
0.4
0.6
0.8
1.0
1.2
1.4
1.6
1.8
2.0Air Air+SP S8 S8+SP JP8 JP8+SP *
*** *
**
*
****
Effects of substance P treatment on spleen subsets
CD3 CD3CD8 CD3CD4
Rat
io
0.0
0.2
0.4
0.6
0.8
1.0
1.2
1.4S8SP vs S8 JP8SP vs JP8
*

Spleen subsets after substance P treatment and JP8 exposure
Effects of substance P treatment on spleen subsets
CD45R CD11b
Rat
io
0.0
0.2
0.4
0.6
0.8
1.0
1.2
1.4
1.6Air Air+SP S8 S8+SP JP8 JP8+SP
* * * *
Effects of substance P treatment on spleen subsets
CD45R CD11b
Rat
io
0.0
0.2
0.4
0.6
0.8
1.0
1.2S8SP vs S8 JP8SP vs JP8
*
*

Thymus subsets after substance P treatment and JP8 exposure
Effects of substance P treatment on thymus subsets
CD3 CD3CD8 CD3CD4
Rat
io
0.0
0.2
0.4
0.6
0.8
1.0
1.2
1.4
1.6
1.8Air Air+SP S8 S8+SP JP8 JP8+SP *
**
* **
*
Effects of substance P treatment on thymus subsets
CD3 CD3CD8 CD3CD4
Rat
io
0.0
0.2
0.4
0.6
0.8
1.0
1.2S8SP vs S8 JP8SP vs JP8
**
*
*
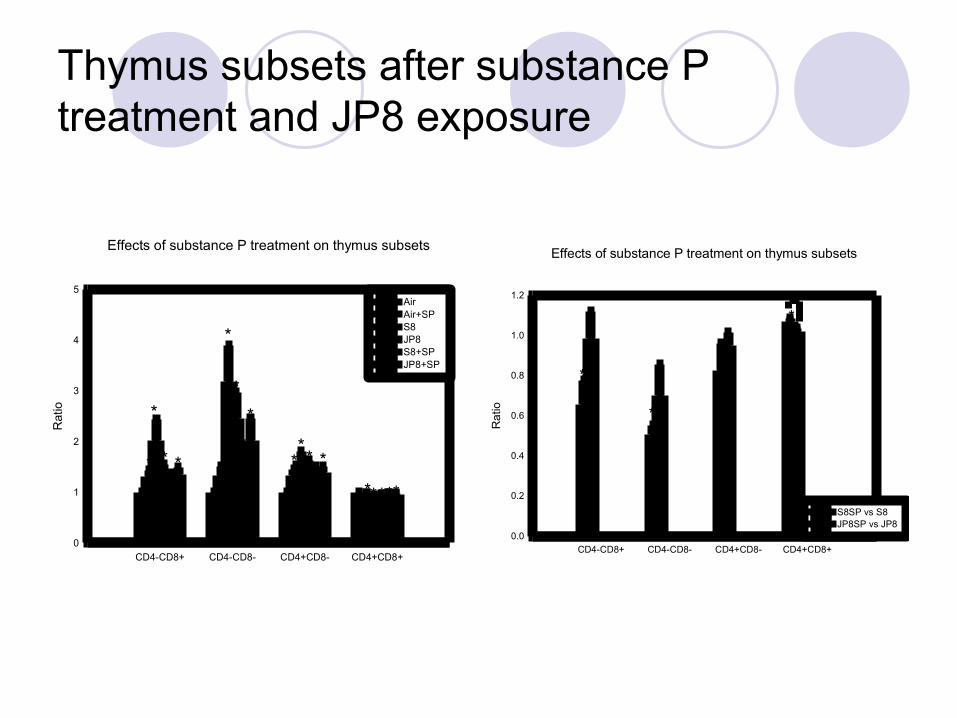
Thymus subsets after substance P treatment and JP8 exposure
Effects of substance P treatment on thymus subsets
CD4-CD8+ CD4-CD8- CD4+CD8- CD4+CD8+
Rat
io
0
1
2
3
4
5Air Air+SP S8 JP8 S8+SP JP8+SP
*
*
* *
****
*
*
*
*
*
* **
*
Effects of substance P treatment on thymus subsets
CD4-CD8+ CD4-CD8- CD4+CD8- CD4+CD8+
Ra
tio
0.0
0.2
0.4
0.6
0.8
1.0
1.2
S8SP vs S8 JP8SP vs JP8
*
*
**
*

Bone marrow subsets after substance P treatment and JP8 exposure
Effects of substance P treatment on bone marrow subsets
CD3 CD3CD8 CD3CD4
Rat
io
0.0
0.5
1.0
1.5
2.0
2.5
3.0Air Air+SP S8 S8+SP JP8 JP8+SP
*
*
*
**
*
Effects of substance P treatment on bone marrow subsets
CD3 CD3CD8 CD3CD4
Rat
io
0.0
0.2
0.4
0.6
0.8
1.0
1.2
1.4
1.6S8SP vs S8 JP8SP vs JP8
* * *
*
*

Bone marrow subsets after substance P treatment and JP8 exposure
Effects of substance P treatment on bone marrow subsets
CD45R CD11b
Rat
io
0.0
0.2
0.4
0.6
0.8
1.0
1.2
1.4Air Air+SP S8 S8+SP JP8 JP8+SP * * * * * *
* *
Effects of substance P treatment on bone marrow subsets
CD45R CD11b
Rat
io
0.0
0.2
0.4
0.6
0.8
1.0
1.2
1.4S8SP vs S8 JP8SP vs JP8
*

Blood subsets after substance P treatment and JP8 exposure
Effects of substance P treatment on blood subsets
CD3 CD3CD8 CD3CD4
Rat
io
0.0
0.2
0.4
0.6
0.8
1.0
1.2
1.4
1.6
1.8Air Air+SP S8 S8+SP JP8 JP8+SP
Effects of substance P treatment on blood subsets
CD3 CD3CD8 CD3CD4
Rat
io
0.0
0.2
0.4
0.6
0.8
1.0
1.2
1.4
1.6S8SP vs S8 JP8SP vs JP8
*

Blood subsets after substance P treatment and JP8 exposure
Effects of substance P treatment on blood subsets
CD45R CD11b
Rat
io
0.0
0.2
0.4
0.6
0.8
1.0
1.2
1.4
1.6
1.8Air Air+SP S8 S8+SP JP8 JP8+SP
* *
*
Effects of substance P treatment on blood subsets
CD45R CD11b
Rat
io
0.0
0.2
0.4
0.6
0.8
1.0
1.2
1.4S8SP vs S8 JP8SP vs JP8
*

Cytokine production after JP8 exposure and Substance P treatment
Cytokine production in spleen CD8+ cells after JP8 exposure and substance P treatment
IFN IL-10 IL-4
Rat
io
0.0
0.5
1.0
1.5
2.0
2.5
3.0Air Air+SP JP8 JP8+SP
* *
*
Cytokine production in spleen CD11b+ cells after JP8 exposure and substance P treatment
IFN IL-10 IL-4
Rat
io
0.0
0.2
0.4
0.6
0.8
1.0
1.2
1.4
1.6Air Air+SP JP8 JP8+SP
*

Summary: Protective mechanisms of SP
Substance P works as prophylaxis for JP-8 jet fuel-induced immunotoxicity
Increased thymocytes recovery and thymocytes double positive cells
Decreased cell apoptosis Rescued cytokine production

MOLECULAR ANALYSES BY MICROARRAYS

Microarrays were used to elucidate the mechanism of JP8 immunotoxicity because:
All other approaches could not completely explain JP-8-mediated immunotoxicity. It’s not only a direct effect based on in vitro exposure It’s not only because immunosuppressive cytokines are
secreted because block of IL-10 and Prostaglandin E2 (PGE2) could only rescue 50% of immune function after JP8 exposure
It’s not only because of the jet fuel composition: aliphatic or non-aliphatic fuel
It’s not only because of the substance P diminishment

Approach 1: microarray analysis after 1hr JP-8 exposure
1000mg/m3 exposure for 1hr by old exposure system mice showed immunotoxicity Spleen weight ↓ to 80%; thymus weight ↓ to 33% Splenic cell number ↓ to 75%; thymic cell number ↓ to 47%; bone marrow cell
number ↓ to 88%; peripheral blood cell number ↑ to 140%
Test gene expression differences at time point of 0.5, 1, 2, and 6hr after an 1-hr 1000mg/m3 JP-8 exposure.

Approach 1: microarray analysis after 1hr JP-8 exposure
0.5h 1h 2h 6h
>5 fold 1 4 86 136
3-5 fold 9 30 403 653
2-3 fold 62 85 1527 2166
0500
1000150020002500
Spleenocytes genes up-regulated at different time-point after in vivo JP8 1hr
exposure
0.5h 1h 2h 6h
>5 fold 52 11 0 446
3-5 fold 29 9 917 994
2-3 fold 114 41 2515 2370
0500
1000150020002500
Spleenocytes genes down-regulated at different time-point after in vivo JP8 1hr
exposure
More genes were down-regulated than up-regulated after JP-8 exposure

Spleenocytes gene regulation after 1hr exposure: apoptotic and ribosomal protein genes were up-regulated at 1hr-timepoint
Common Name
Gene Description Up-regulated folds
Anxa11 ANNEXIN A11 (ANNEXIN XI) (CALCYCLIN-ASSOCIATED ANNEXIN 50) (CAP-50)
3-5 folds
Casp8ap2 CASPASE 8 ASSOCIATED PROTEIN 2 2-3 folds
Cd14 MONOCYTE DIFFERENTIATION ANTIGEN CD14 PRECURSOR
5 folds
Rpl29 60S RIBOSOMAL PROTEIN L29 3-5 folds
Rps24 40S RIBOSOMAL PROTEIN S24 3-5 folds
Rpl18 60S RIBOSOMAL PROTEIN L18 2-3 folds
Rps16 40S RIBOSOMAL PROTEIN S16 2-3 folds
Rpl18A 60S RIBOSOMAL PROTEIN L18A 2-3 folds

Approach 1: microarray analysis after 1hr JP-8 exposure
>5 fold 3-5 fold 2-3 fold
0.5h 1 2 28
1h 66 55 271
050
100150200250300
Bone marrow genes up-regulated at different time-point after in vivo JP8 1hr
exposure
>5 fold 3-5 fold 2-3 fold
0.5h 6 109 128
1h 50 52 221
050
100150200250300
Bone marrow genes down-regulated at different time-point after in vivo JP8 1hr
exposure
More genes were down-regulated than up-regulated after JP-8 exposure

Bone marrow gene regulation after 1hr exposure
Bcl2 (B cell leukemia 2)
Bcl 11b
K-ras2
Cyclin-dependent kinase 2-interacting protein
Multidrug resistance protein 2; P-glycoprotein

Summary of approach 1
In vivo exposure to JP-8 caused change of gene expression profile within less than 0.5 hours in spleen and bone marrow.
In spleen, there were far more genes down-regulated than up-regulated
In spleen, genes up-regulated were ribosomal protein and some apoptotic genes
Though BM were more resistant than spleen to Jet fuel exposure based on cell immunotoxicity assay, its gene expression level were changed comparable to BM after exposure.

Approach 2: microarray analysis after JP-8 and S8 exposure for 7 days
4000mg/ml exposure for 7 days with1hr/day has been used constantly in this project
Microanalysis will test Mid-term exposure effects Aliphatic hydrocarbon’s effects: JP8 vs S8

Gene expression changed in a similar pattern by both JP8 and S8 treatmentUp-regulated genes in both treatments
JP8 S8 Gene name Gene Title
4.70 6.47 Azin1 antizyme inhibitor 1; Oazin4.92 3.85 Zfpn1a1 zinc finger protein, subfamily 1A, 1 (Ikaros), Znfn1a15.50 3.79 Itk IL2-inducible T-cell kinase5.51 5.11 Mapk14 mitogen activated protein kinase 146.29 4.98 Pdcd6ip programmed cell death 6 interacting protein
Down-regulated genes in both treatments
JP8 fold S8 fold Gene name Gene Title
14.3 17.5 Cxcl2 chemokine (C-X-C motif) ligand 2; MIP-2, MIP-2a12.6 15.2 Hspa1b heat shock protein 1B11.1 22.0 Hspa1a heat shock protein 1A10.1 33.3 Ptgs2 prostaglandin-endoperoxide synthase 25.3 14.4 Nfil3 nuclear factor, interleukin 3, regulated5.2 7.3 Irs2 insulin receptor substrate 24.9 8.7 Osm oncostatin M4.9 6.8 Il1b interleukin 1 beta4.7 9.5 Nr4a1 nuclear receptor subfamily 4, group A, member 14.4 5.5 Ets2 E26 avian leukemia oncogene 2, 3' domain4.2 17.3 Plk2 polo-like kinase 2 (Drosophila)4.1 11.5 Ifrd1 Interferon-related developmental regulator 14.0 7.7 Ccl3 chemokine (C-C motif) ligand 3

Gene expression changed in a similar pattern by both JP8 and S8 treatment
No genes were found when gene expression decreased over 4 fold by JP8 treatment but increased by S8 treatment; vice versa
No genes were found when gene expression increased over 4 fold by JP8 treatment but decreased by S8 treatment
No genes were found when gene expression increased over 4 folds by JP8 treatment but increased less than 4 folds by S8 treatment

Project Summary and Discussion
Aerosolized JP-8 exposure causes damage to and leads to inflammation in the lungs →
Inflammation recruits PMNs, neutrocytes, and monocytes into lungs→
Cytokines are released, apoptosis occurs, monocytes are activated→
Monocytes migrate back to lymph nodes and spleen→ They secrete suppressive cytokines, induce non-specific
regulatory T cells, and favor Th2-type immune responses

JP-8 exposure induces immediate PGE2 release. Mice wereexposed to a single 1 h, 1000 mg/m3 concentration of aerosolized JP-8 jetfuel as described in materials and methods. At the indicated times postexposure,the animals were sacrificed and serum PGE2 levels determinedby ELISA as described. Data are presented as the mean SD of four micefor each time-point. Each measurement was a significant difference fromT 0 h at P 0.05.

JP-8 exposure induces persistent PGE2 release. Mice were exposed to a single 1 h/day, 1000 mg/m3 concentration of aerosolized JP-8 jet fuel as described in materials and methods. At the indicated times postexposure (24 h after the last day of exposure) the animals were sacrificed and serum PGE2 levels were determined by ELISA as described. Data are presented as the mean SD of six mice for each time-point. Each measurement was with a significant difference from controls measured at day 0 at P 0.05. The individual values for each day were: 200 125; 5350 1300; 5560 1900; 8100 2000; 15 100 1500; 10150 500; 8200 400.

JP-8 exposure induces the immediate release of IL-10 and lossof immune proliferative capacity. Mice were exposed to a single 1 h,1000 mg/m3 concentration of aerosolized JP-8 jet fuel as described inmaterials and methods. At 24 h after the indicated times post-exposure theanimals were sacrificed. Immune function (by proliferation, circles) andserum IL-10 levels (by ELISA, triangles) were determined as described.Data are presented as the mean SD of four mice for each time-point.Each measurement was with a significant difference from controlsmeasured at 0 h at P 0.05.

JP-8 exposure induces long-term IL-10 release. Mice were P 0.05.exposed to a single 1 h/day, 1000 mg/m3 concentration of aerosolized JP-8jet fuel as described in materials and methods. At the indicated times postexposurethe animals were sacrificed and serum IL-10 levels were determinedby ELISA. Data are presented as the mean SD for the indicatednumber of mice for each time-point. Each measure was with a significantdifference from controls at day 0 at P 0.05.

Correlation of PGE2 release with loss of immune proliferativecapacity after JP-8 exposure. Mice were exposed to a single 1 h/day,1000 mg/m3 concentration of aerosolized JP-8 jet fuel as described in materialsand methods. At the indicated times post-exposure the animals weresacrificed. Immune function (proliferation, diamonds) and serum PGE2levels (triangles) were determined. Data are presented as the means for sixmice for each time-point. SDs did not exceed 10% for any measure. Allmeasures were with a significant difference from controls at day 0 at P<0.05

Reversal of the immunotoxicity induced by JP-8 exposure byinhibition of PGE2 release. Mice were exposed to a single 1 h/day,1000 mg/m3 concentration of aerosolized JP-8 jet fuel for seven days asdescribed in materials and methods. At 24 h post-exposure the animalswere sacrificed. Immune organ cellularity and weights were determined.Serum PGE2 levels and immune function (i.e., proliferation) were alsomeasured. As indicated, some animals received injections of the Cox2inhibitor immediately after JP-8 exposure. Data are presented as the meansfor the indicated number of mice for each condition. (*) indicates a significantdifference from controls (i.e., day 0, air exposure) at P 0.05.

JP-8 and Real World Consequences

Cancer

Effects of JP-8 jet fuel Exposure in an Experimental Lung Metastasis Model.
C57Bl6 mice were injected intravenously with 0.5 × 10⁶ syngeneic B16 melanoma tumor cells. Mice were either exposed to air only (Sham group) or to 1000 mg/m3 JP-8 jet fuel for 1 h/day over the course of the 17-day experiment. Mice were exposed to JP-8 either 24 h before the start of the jet fuel exposure (B16 + JP8 group) or were first exposed to JP-8 for 1 week followed by tumor injection (JP8 > B16 group). The Sham group has an average of 49 tumor colonies per two lungs counted (N = 16). Data are expressedas fold increase in the number of tumor foci for both lungs. N represents the total number of animals examined in five independent experiments for simultaneous JP8 exposure and three independentexperiments for the JP8 first exposure group.

Effects of JP-8 jet fuel exposure in an experimental solid tumor model.
C57Bl6 mice were injected subcutaneously with 0.25 × 10⁶ syngeneic B16 melanoma tumor cells. Mice were either exposed to air only (Sham group) or to 1000 mg/m3 JP-8 jet fuel for 1 h/day over the course of the experiment. Mice were exposed to JP-8 at the time of the tumor injection. Data are expressed as tumor volume in panel A (top), whereas data are expressed as the percent of mice still alive in panel B (bottom). A total of six mice were analyzed in the air-exposed group, whereas eight mice were analyzed in the JP8-exposed group. Mice were followed until death or until tumor burden exceeded 20% of body weight.

Viral Infections

Effects of JP-8 jet fuel exposure and influenza infection on immune organ weights.
C57Bl/6 mice were either exposed to air only or to 1000 mg/m3 JP-8 jet fuel for 1 h/day for 7 days. Mice were then infected intra-nasally with influenza virus and followed for up to 2 weeks post-infection. At the end of 2 weeks, all surviving mice were killed and immune organ wet weights determined (spleen and thymus). Data are expressed as the mean percent of control (air exposure and no infection). The SD for each group was less than 10% of the mean. A total number of 7, 8, and 11 animals were examined for the air, flu, and JP8 + Flu group, respectively. (*) indicates significant difference from control at P < 0.05. Control spleen wet weights were 0.230 g, whereas control thymus wet weights were 0.050 g.

Effects of JP-8 jet fuel exposure and influenza infection on immune cell numbers.
C57Bl/6 mice were either exposed to air only or to 1000 mg/m3 JP-8 jet fuel for 1 h/day for 7 days. Mice were then infected intra-nasally with influenza virus and followed for up to 2 weeks post-infection. At the end of 2 weeks, all surviving mice were killed and viable immune organ cell numbers determined (spleen, thymus, and lymph nodes). Data are expressed as the mean percent of control (air exposure and no infection). The SD for each group was less than 10% of the mean. A total number of 7, 8, and 11 animals were examined for the air, flu, and JP8+Flu group, respectively. (*) indicates significant difference from control at P < 0.05. Control spleen cell numbers were 60 × 106, control thymus cell numbers were 91 × 106, and control lymph nodes cell numbers were 6 × 10⁶.

FACS Analysis of Splenic Immune Cells after JP-8 Jet Fuel Exposure and Flu infection.
C57Bl/6 mice were either exposed to air only or to 1000 mg/m3 JP-8 jet fuel for 1 h/day for7 days. Mice were then infected intra-nasally with influenza virus and followed for up to 2 weeks post-infection. At the end of 2 weeks, all surviving mice were killed and flow cytometric analyses performedon splenic immune cells. Data are expressed as the mean percent positive cells for the indicated phenotypic markers. The SD for each group was less than 10% of the mean. A total number of 7, 8, and 11 animals were examined for the air, flu, and JP8 + Flu group, respectively. (*) indicates significant difference from control at P < 0.05.

FACS Analysis of Lymph Node Cells after JP-8 Jet Fuel Exposure and Flu Infection.
C57Bl/6 mice were either exposed to air only or to 1000 mg/m3 JP-8 jet fuel for 1 h/day for 7 days. Mice were then infected intra-nasally with influenza virus and followed for up to 2 weeks post-infection. At the end of 2 weeks, all surviving mice were killed and flow cytometric analyses performed on immune cells isolated from the lymph nodes. Data are expressed as the mean percent positive cells for the indicated phenotypic markers. The SD for each group was less than 10% of the mean. A total number of 7, 8, and 11 animals were examined for the air, flu, and JP8 + Flu group, respectively. (*) indicates significant difference from control at P < 0.05.

Functional Analysis of Splenic Cells after JP-8 Exposure and Influenza Infection.
C57Bl/6 mice were either exposed to air only or to 1000 mg/m3 JP-8 jet fuel for 1 h/day for 7 days. Mice were then infected intra-nasally with influenza virus and followed for up to 2 weeks post-infection. At the end of 2 weeks, all surviving mice were killed, splenic immune cells were isolated, and proliferation assays were performed. Data are expressed as the mean stimulation index in response to stimulation with mitogen. The SD for each group was less than 10% of the mean. A total number of 7, 8, and 11 animals were examined for the air, flu, and JP8 + Flu group, respectively. (*) indicates significant difference from control at P < 0.05.

Overall survival of mice exposed to JP-8 jet fuel and infected with influenza virus.
C57Bl/6 mice were either exposed to air only or to 1000 mg/m3 JP-8 jet fuel for 1 h/day for 7 days. Mice were then infected intra-nasally with influenza virus and followed for up to 2 weeks post-infection. At the end of 2 weeks, all surviving mice were noted. A total number of 7, 12, and 21 animals were followed for the air, flu, and JP8 + Flu group, respectively. (*) indicates significant difference from control at P < 0.05.

Pregnancy

Analysis of newborn immune function after in-utero jet fuel exposure.
Pregnant mice were exposed to JP-8 jet fuel. At 6 to 8-weeks post-birth, the animals were killed and assessed for immune function. Individual pups were grouped by their respective mothers. Data are presented as the stimulation index of the individual pups versus the stimulation index of the respective mother (regardless of when during the pregnancy that the exposure occurred). In panel A, the responses of the air-exposed control animals are shown, whereas in panel B the responses of the jet fuel–exposed mice are presented. The overall means (for all pups of a given mother; left to right) were 49, 39, and 79, respectively for the air-exposed groups; whereas it was 36, 34, 42, and 47, respectively for the JP-8-exposed groups.

Effects of JP-8 Exposure on Litter Size
Group Exposure PeriodAverage litter size Number of pregnancies analyzedSham N/A 8.25 5JP-8 Days 7–21 *5.4 8JP-8 Days 15–21 7.1 8JP-8 Overall *6.25 16
Timed-pregnant C57Bl/6 mice were exposed to 1000 mg/m3 of JP-8 jet fuel for 1 h/day during various times of the pregnancy, as indicated. Days 7–21 exposures were considered to be first trimester exposures, whereas days 15–21 exposures were considered to be third trimester exposures. At parturition, viable pups were counted and average litter sizes are shown. Overall indicates all litters derived from JP-8 exposed pregnant mice regardless of when the exposure occurred. *Indicates significant from Sham at P < 0.05.

Overall Summary
Low concentration, short term JP-8 exposure decreases immune cell numbers and function, while increasing the secretion of immunosuppressive cytokines.
Aerosolized JP-8 appears to be more immunotoxic than vapor JP-8.
The S8 jet fuel seems to be as immunotoxic as both JP-8 and JP-8+100.

Overall Summary
JP-8 exposure increases tumor metastasis and death rates in an animal model.
JP-8 exposure increases the severity of viral infections (i.e., deaths) by decreasing immune function.
In utero JP-8 exposuresDecreases offspring immune functionDecreases litter sizesDecreases numbers of male pupsEpigenetic effects?