effects of a gis course on three …oaktrust.library.tamu.edu/bitstream/handle/1969.1/etd...effects...
TRANSCRIPT

EFFECTS OF A GIS COURSE
ON THREE COMPONENTS OF SPATIAL LITERACY
A Dissertation
by
MINSUNG KIM
Submitted to the Office of Graduate Studies of Texas A&M University
in partial fulfillment of the requirements for the degree of
DOCTOR OF PHILOSOPHY
December 2011
Major Subject: Geography
EFFECTS OF A GIS COURSE
ON THREE COMPONENTS OF SPATIAL LITERACY
A Dissertation
by
MINSUNG KIM
Submitted to the Office of Graduate Studies of Texas A&M University
in partial fulfillment of the requirements for the degree of
DOCTOR OF PHILOSOPHY
Approved by:
Co-Chairs of Committee, Robert Bednarz Sarah Bednarz Committee Members, Andrew Klein Lynn Burlbaw Head of Department, Vatche Tchakerian
December 2011
Major Subject: Geography

iii
ABSTRACT
Effects of a GIS Course on Three Components of Spatial Literacy. (December 2011)
Minsung Kim, B.A., Seoul National University;
M.A., Seoul National University
Co-Chairs of Advisory Committee: Dr. Robert Bednarz Dr. Sarah Bednarz
This research investigated whether completing an introductory GIS course affects
college students’ spatial literacy as defined by spatial habits of mind, spatial concepts
and thinking skills, and critical spatial thinking. This study employed three tests (spatial
habits of mind inventory, spatial concepts and skills test, critical spatial thinking oral
test) to measure students’ performance on these three elements. Furthermore, this
research investigated the relationship among the components. Pre- and post-tests were
conducted at the beginning and the end of the 2010 fall semester, and Texas A&M
undergraduate students participated in the research. The following four research
questions were examined.
The first research question investigated whether GIS learning improves spatial
habits of mind (n = 168). Five sub-dimensions of spatial habits of mind (pattern
recognition, spatial description, visualization, spatial concept use, and spatial tool use)
were identified. Overall, GIS students’ spatial habits of mind were enhanced. However,
variations existed when considering students’ performance by dimension.

iv
The second research question explored whether GIS learning affects students’
understanding and use of spatial concepts and thinking skills (n = 171). This research
found that the GIS course was beneficial in improving students’ spatial cognition.
Students increased their understanding of key spatial concepts and applied conceptual
understanding into wider contexts with advanced spatial thinking skills.
The third research question examined the effects of a GIS course through
interviews on the three sub-dimensions of critical spatial thinking: data reliability, spatial
reasoning, and problem-solving validity (n = 32). The quantitative analyses indicated
that participants developed their ability regarding these three sub-dimensions of critical
spatial thinking. In particular, their ability to assess data reliability and problem-solving
validity improved, an effect not likely to be enhanced by other coursework. Findings
from qualitative thematic analysis confirmed these quantitative outcomes.
The final research question probed the relationships among the three components
of spatial literacy. Pearson’s correlation coefficient, a 3D space (termed “score space” in
this study), a test for independence, and an exploratory factor analysis suggested that the
three components are positively correlated. However, more research is necessary to
confirm the results reported in this study.

v
DEDICATION
To my parents

vi
ACKNOWLEDGEMENTS
I would like to thank my committee co-chairs, Dr. Robert Bednarz and Dr. Sarah
Bednarz, and my committee members, Dr. Andrew Klein and Dr. Lynn Burlbaw, for
their guidance and support throughout the course of this research. Their expertise and
help were crucial in completing my dissertation study.
I want to express my special appreciation to my committee co-chairs. Dr. Robert
Bednarz provided insight into my research whenever I encountered difficulties. I cannot
imagine the completion of my dissertation study without his help. Dr. Sarah Bednarz
always raised stimulating questions that thoughtfully guided my research. I cannot thank
her enough.
The support from Dr. Wendy Patzewitsch, Dr. Michael Ewers, and Dr. Joyce
Juntune was crucial in my study. They generously allowed me to conduct research in
their classes. Thanks also to my friends and colleagues and the department faculty and
staff for making my time at Texas A&M University a great experience. Sandra, Injeong,
and Kelly were in the same geography education research group as me, so we shared a
lot of pleasant experiences together. Wansang, Daehyun, Souyeon, Beeyoung, Hoonjong,
and Jaeyung are friends who made my life at TAMU enjoyable. Jeongmok provided
critical support in finalizing my study.
I also appreciate the Department of Geography, KAGES (Korean-American
Association for Geospatial and Environmental Sciences), and the Ambassador of the
Republic of Korea that provided funding for my research.

vii
Last but not least, I would like to express my sincere gratitude to my parents and
sister. They always encouraged me to complete my research, and their caring attitudes
were fundamental sources of my energy and confidence to complete this long journey.

viii
TABLE OF CONTENTS
Page
ABSTRACT .............................................................................................................. iii
DEDICATION .......................................................................................................... v
ACKNOWLEDGEMENTS ...................................................................................... vi
TABLE OF CONTENTS .......................................................................................... viii
LIST OF FIGURES ................................................................................................... xi
LIST OF TABLES .................................................................................................... xii
CHAPTER
I INTRODUCTION ......................................................................................... 1
Context of Research Problem ................................................................... 1 Spatial Literacy ........................................................................... 3 Spatial Habits of Mind ................................................................ 3 Spatial Concepts and Thinking Skills ......................................... 4 Critical Spatial Thinking ............................................................. 5 GIS and GIS Learning ................................................................. 6 GIS in Education ......................................................................... 8 Research Objectives and Questions .......................................................... 10 Research Methods ..................................................................................... 12 Study Significance ..................................................................................... 14 Intellectual Merit ......................................................................... 14 Broader Impacts .......................................................................... 15 Study Assumptions .................................................................................... 16 Study Limitations ...................................................................................... 16
II REVIEW OF LITERATURE ........................................................................ 18
Spatial Literacy ......................................................................................... 18 Spatial Habits of Mind .............................................................................. 21 Habits of Mind ............................................................................ 22 Sub-dimensions of Spatial Habits of Mind ................................. 26 Spatial Concepts and Thinking Skills ....................................................... 35 Spatial Concepts .......................................................................... 35 Spatial Thinking Skills ................................................................ 39

ix
CHAPTER Page
Critical Spatial Thinking ........................................................................... 39 Critical Thinking in Education .................................................... 42 Characteristics of Critical Spatial Thinking ................................ 44 Expert-Novice Differences .......................................................... 47 Factors Affecting Individual Differences in Spatial Literacy ................... 50 GIS Learning and Spatial Literacy ............................................................ 56 GIS Learning and Spatial Habits of Mind ................................... 56 GIS Learning and Spatial Concepts and Thinking Skills ............ 59 GIS Learning and Critical Spatial Thinking ............................... 64 Trends in GIS Education Research ........................................................... 67 Relationships among Dispositional, Cognitive, and Critical Aspects of
Learning .................................................................................................... 70 Summary ................................................................................................... 74
III RESEARCH METHODOLOGY ................................................................. 77
Experiment 1: Spatial Habits of Mind Inventory (SHMI) ........................ 78 Reliability of the Inventory ......................................................... 78 Validity of the Inventory ............................................................. 79 Participants .................................................................................. 80 Test Administration ..................................................................... 82 Scoring and Analysis ................................................................... 83 Experiment 2: Spatial Concepts and Skills Test (SCST) .......................... 85 Reliability of the Spatial Concepts and Skills Test ..................... 86 Validity of the Spatial Concepts and Skills Test ......................... 86 Test Descriptions ......................................................................... 87 Participants .................................................................................. 90 Test Administration ..................................................................... 90 Scoring and Analysis ................................................................... 90 Experiment 3: Critical Spatial Thinking Oral Test (CSTOT) ................... 91 Test Descriptions ......................................................................... 92 Participants .................................................................................. 93 Interview Procedures ................................................................... 93 Assessment .................................................................................. 99 Reliability Study .......................................................................... 101 Relationships among the Three Components of Spatial Literacy ............. 102
IV FINDINGS AND ANALYSIS ..................................................................... 105
Experiment 1: Spatial Habits of Mind Inventory (SHMI) ........................ 105 Reliability of the Inventory ......................................................... 106 Validity of the Inventory ............................................................. 109

x
CHAPTER Page
Score Comparison by Group ....................................................... 111 Score Comparison by Gender and Academic Major ................... 114 Experiment 2: Spatial Concepts and Skills Test (SCST) .......................... 120 Reliability and Validity ............................................................... 120 Score Comparison by Group ....................................................... 120 Score Comparison by Gender and Academic Major ................... 124 Experiment 3: Critical Spatial Thinking Oral Test (CSTOT) ................... 130 Inter-rater Reliability ................................................................... 130 Quantitative Analysis of the CSTOT by Dimension ................... 131
Qualitative Evidence Regarding the Improvement of Critical Spatial Thinking .......................................................................... 136
Relationships among the Three Components of Spatial Literacy 146
V DISCUSSION AND CONCLUSIONS ......................................................... 153
Research Question 1a ................................................................................ 154 Research Question 1b ................................................................................ 159 Educational Implications: Spatial Habits of Mind ...................... 164 Research Question 2a ................................................................................ 165 Research Question 2b ................................................................................ 167 Educational Implications: Spatial Concepts and Skills ............... 171 Research Question 3a ................................................................................ 173 Research Question 3b ................................................................................ 176 Educational Implications: Critical Spatial Thinking ................... 179 Research Question 4 .................................................................................. 180 Summary and Conclusions ........................................................................ 184 Recommendations for Future Research .................................................... 188 REFERENCES .......................................................................................................... 191
APPENDIX A ........................................................................................................... 235
APPENDIX B ........................................................................................................... 239
APPENDIX C ........................................................................................................... 270
APPENDIX D ........................................................................................................... 274
VITA ......................................................................................................................... 285
xi
LIST OF FIGURES
FIGURE Page
1 Three components of spatial literacy and test instruments ........................ 12 2 Research design .......................................................................................... 77 3 Score differences among groups in pre-test ............................................... 126 4 Score differences among groups in post-test .............................................. 127 5 Scatter plots of relationships ...................................................................... 147 6 3D scatter plot of the three scores with drop line (score space). ................ 149
7 2D scatter plot of two scores (spatial habits of mind and spatial concepts) 149
8 2D scatter plot of two scores (spatial habits of mind and critical spatial
thinking) ..................................................................................................... 150
9 2D scatter plot of two scores (spatial concepts and critical spatial
thinking) .................................................................................................... 150
10 Positive loop concerning SHM (Spatial Habits of Mind) in GIS learning . 157
11 Spatial literacy composed of the three components ................................... 183
12 Spatial literacy with the three components as one part of its constituent... 183
xii
LIST OF TABLES
TABLE Page 1 The Golledge group’s framework for spatial concepts .............................. 37 2 Taxonomies of spatial thinking skills ......................................................... 40 3 The connection between spatial thinking skills and GIS ........................... 60
4 Participating groups (Experiment 1) .......................................................... 81
5 Point values for positive and negative items .............................................. 83
6 Effect size criteria ....................................................................................... 85
7 Types of problems in the SCST ................................................................. 88
8 Participating groups (Experiment 3) .......................................................... 93
9 Eight octants on which a set of a participant’s scores can be positioned ... 103
10 Cronbach’s alpha of the inventory ............................................................. 106
11 Factor loading for each test item ................................................................ 107
12 A comparison of total pre- and post-test scores by group .......................... 111
13 ANOVA for pre-test scores by group ........................................................ 112
14 ANCOVA for the SHMI as a function of group, using the pre-test scores
as a covariate .............................................................................................. 113
15 Adjusted and unadjusted group post-test means and variability for the
SHMI using the pre-test scores as a covariate ............................................ 113

xiii
TABLE Page
16 A comparison of pre- and post-test scores of each sub-dimension by
group ........................................................................................................... 114
17 A comparison of male and female scores by test ....................................... 115
18 A comparison of male and female scores by test of each sub-
dimension .................................................................................................. 115
19 A comparison of pre- and post-test scores by gender ................................ 116
20 A comparison of pre- and post-test scores by gender of each sub-
dimension ................................................................................................... 117
21 ANOVA for pre-test scores by major ........................................................ 119
22 A comparison of pre- and post-test scores by group .................................. 121
23 ANOVA for pre-test scores by group ........................................................ 121
24 Adjusted and unadjusted group post-test means and variability for the
SCST, using the pre-test scores as a covariate ........................................... 122
25 ANCOVA for the SCST as a function of group, using the pre-test scores
as a covariate .............................................................................................. 122
26 Average scores of each item by group ....................................................... 125
27 A comparison of male and female scores by test ....................................... 128
28 A comparison of pre- and post-test scores by gender ................................ 128
29 ANOVA for pre-test scores by major ........................................................ 129
30 Krippendorff’s alpha for the three dimensions of critical spatial thinking 131

xiv
TABLE Page
31 A comparison of pre- and post-test scores regarding data reliability by
group ........................................................................................................... 132
32 ANOVA of post-test scores regarding data reliability by group ................ 133
33 A comparison of pre- and post-test scores regarding spatial reasoning by
group ........................................................................................................... 133
34 ANCOVA for the spatial reasoning as a function of group, using the
pre-test scores as a covariate ...................................................................... 134
35 A comparison of pre- and post-test scores regarding problem-solving
validity by group ........................................................................................ 135
36 ANOVA of post-test scores regarding problem-solving validity by group 135
37 Correlations among the three components of spatial literacy .................... 147
38 Frequencies of participant positions ........................................................... 151
1
CHAPTER I
INTRODUCTION
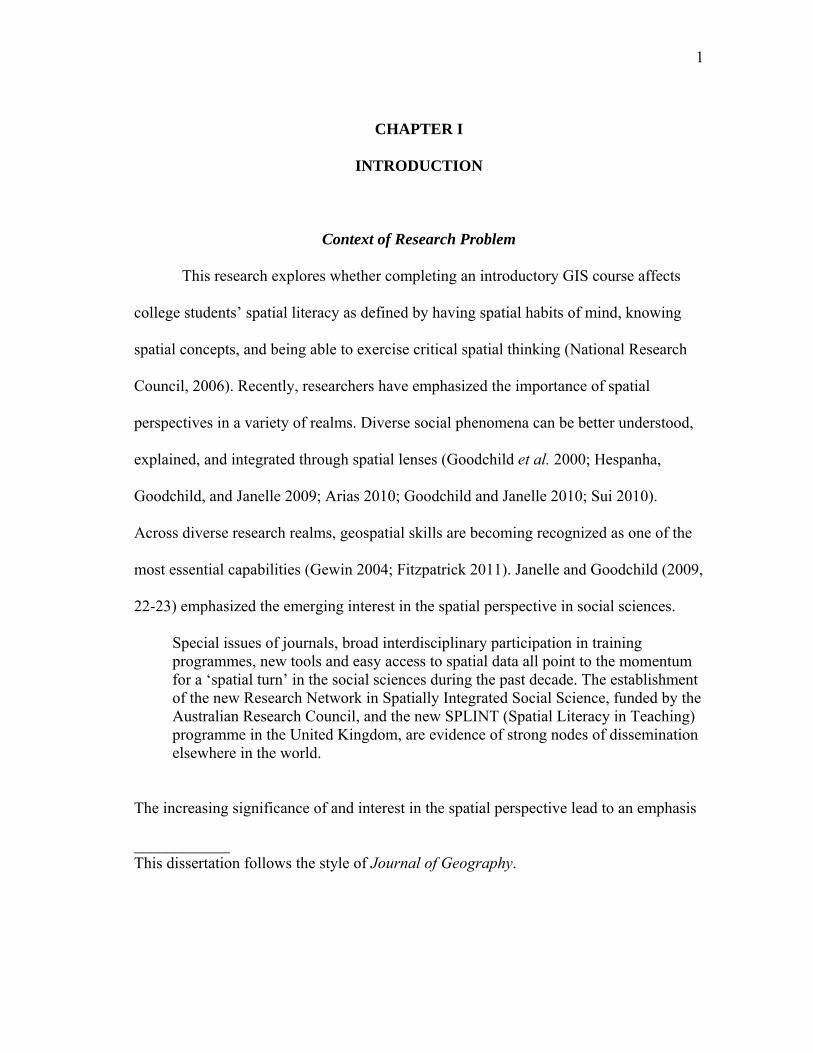
Context of Research Problem
This research explores whether completing an introductory GIS course affects
college students’ spatial literacy as defined by having spatial habits of mind, knowing
spatial concepts, and being able to exercise critical spatial thinking (National Research
Council, 2006). Recently, researchers have emphasized the importance of spatial
perspectives in a variety of realms. Diverse social phenomena can be better understood,
explained, and integrated through spatial lenses (Goodchild et al. 2000; Hespanha,
Goodchild, and Janelle 2009; Arias 2010; Goodchild and Janelle 2010; Sui 2010).
Across diverse research realms, geospatial skills are becoming recognized as one of the
most essential capabilities (Gewin 2004; Fitzpatrick 2011). Janelle and Goodchild (2009,
22-23) emphasized the emerging interest in the spatial perspective in social sciences.
Special issues of journals, broad interdisciplinary participation in training programmes, new tools and easy access to spatial data all point to the momentum for a ‘spatial turn’ in the social sciences during the past decade. The establishment of the new Research Network in Spatially Integrated Social Science, funded by the Australian Research Council, and the new SPLINT (Spatial Literacy in Teaching) programme in the United Kingdom, are evidence of strong nodes of dissemination elsewhere in the world.
The increasing significance of and interest in the spatial perspective lead to an emphasis
____________ This dissertation follows the style of Journal of Geography.

2
on spatial literacy (Janelle and Goodchild 2009). The demand for spatially literate
citizens is growing as the role of geography and spatial perspectives in higher education,
government, and private sectors increases (Gatrell 2001; Chalkley 2006).
However, spatial thinking has not received adequate attention in education
(Mathewson 1999; Kastens et al. 2009; National Science Board 2010). Subsequently, the
lack of test instruments to measure spatial literacy has been a long-running problem
(Linn, Kerski, and Wither 2005; Milson et al. 2005; National Research Council 2006;
Lee and Bednarz 2009). Moreover, despite arguments that spatial literacy can be
improved through instruction or practice (Huttenlocher, Levine, and Vevea 1998; Piburn
et al. 2002; Wright et al. 2008; Titus and Horsman 2009; Newcombe 2010), it is not
certain what learning experiences or tools can be used effectively to improve spatial
literacy (National Research Council 2006).
American students’ spatial illiteracy has been identified as a serious problem
(Self and Golledge 1994; Patterson, Reeve, and Page 2003). Aware of this problem,
educators are increasing their efforts to develop strategies to foster students’ spatial
literacy. Using GIS in education has been identified as a potential method to enhance
students’ spatial literacy (West 1999; Tsou and Yanow 2010). Researchers have reported
the benefits of GIS in students’ spatial learning (Summerby-Murray 2001; Hall-Wallace
and McAuliffe 2002; Drennon 2005; Lee and Bednarz 2009). However, the role of GIS
in improving students’ spatial thinking needs more empirically based research
(Rutherford 2002; Baker and Bednarz 2003; Kerski 2003; Tate, Jarvis, and Moore 2005;
Qiu 2006). A brief description of main concepts employed in this study follows.

3
Spatial Literacy
Several researchers have tried to conceptualize the meaning and components of
spatial literacy. Researchers have used different terms to discuss aspects of spatial
literacy, such as spatial ability (Linn and Petersen 1985; Golledge and Stimson 1997),
spatial thinking (Ishikawa and Kastens 2005; Gersmehl and Gersmehl 2006; Kastens and
Ishikawa 2006; Newcombe 2010), geospatial thinking (Marsh, Golledge, and Battersby
2007; Golledge, Marsh, and Battersby 2008a, 2008b), and spatial intelligence (Gardner
1993; Lloyd 2003). However, researchers have not agreed on the definition of these
terms (Caplan, MacPherson, and Tobin 1985; Linn and Petersen 1985; Voyer, Voyer,
and Bryden 1995; Lloyd 2003; Black 2005; Schultz, Kerski, and Patterson 2008; Yang
and Chen 2010). These conceptualizations are sometimes used interchangeably or
differently to denote different views. This study adopts the term spatial literacy which
lies at the heart of spatial thinking and includes the components of spatial habits of mind,
spatial concepts, spatial thinking skills, and critical spatial thinking (National Research
Council 2006). Spatial literacy in this research is understood as the broadest concept,
encompassing various conceptualizations regarding spatial literacy mentioned
previously. The next three sections discuss the three components that comprise spatial
literacy in this study.
Spatial Habits of Mind
The first component of spatial literacy in this study is spatial habits of mind. This
element is associated with disposition. Spatial habits of mind go beyond cognitive
4
aspects of learning. Researchers have defined habits of mind from diverse perspectives,
such as broad composite skills (Costa 2008; Costa and Kallick 2008; Charbonneau et al.
2009; Saleh and Khine 2009), particular processes of thinking (Cuoco, Goldenberg, and
Mark 1996; Harel 2007), and habituated, automatic inclination (Goldenberg 1996;
Verplanken and Aarts 1999; Leikin 2007). Synthesizing these definitions, habits of mind
can be understood as internalized thinking processes inclined towards a particular
perspective. Therefore, spatial habits of mind are defined as internalized thinking
processes inclined towards spatial perspectives. This study identifies sub-dimensions of
the spatial habits of mind as 1) pattern recognition, 2) spatial description, 3)
visualization, 4) spatial concept use, and 5) spatial tool use, modifying the general habits
of mind model developed by Cuoco, Goldenberg, and Mark (1996).
Spatial Concepts and Thinking Skills
A spatially literate student is expected to employ spatial concepts and thinking
skills in an informed way. Therefore, the second component of spatial literacy is related
to cognition. Spatial concepts are the building blocks for enhanced spatial thinking
(National Research Council 2006; Huynh 2009). Researchers have argued that students’
understanding of spatial concepts develops (Piaget and Inhelder 1967; Catling 1978),
and that a hierarchy of spatial concepts depending on complexity exists (Marsh,
Golledge, and Battersby 2007; Golledge, Marsh, and Battersby 2008a, 2008b). In
addition, students need to employ spatial thinking skills in an informed manner. To be
spatially literate, students must have knowledge of not only key spatial concepts
5
including definitions and connotations of those concepts, but should also have skills to
apply spatial concepts to a wide range of contexts. Spatial concepts play a foundational
role and represent the base for spatial thinking skills. However, spatial concepts cannot
be used appropriately without spatial thinking skills. Concepts and thinking skills work
closely together (Glaser 1984; Goldenberg 1996), so this study discusses them as one
component of spatial literacy. Scholars have provided lists of essential spatial concepts
(Marsh, Golledge, and Battersby 2007; Golledge, Marsh, and Battersby 2008a, 2008b)
and spatial thinking skills (Self and Golledge 1994; Golledge and Stimson 1997;
Golledge 2002; Bednarz 2004; Ishikawa and Kastens 2005; Gersmehl and Gersmehl
2006, 2007). These suggestions guide conceptualizations of the second component of
spatial literacy. Spatial concepts and thinking skills are discussed in more detail in
Chapter II.
Critical Spatial Thinking
The third component of spatial literacy, critical spatial thinking, emphasizes
students’ critical and deep thinking processes regarding spatial problems. From a broad
educational perspective, critical thinking has been a topic of continual interest and
controversy for educators (Kennedy, Fisher, and Ennis 1991; Taube 1997; Albert and
Albert 2002). Critical thinking is of vital importance to every curriculum (Case 2005).
Whatever educational philosophy one maintains, to make students think critically is the
ultimate goal for educators (Sternberg and Baron 1985). Norris (1985, 40) argued that
“critical thinking is not just another educational option. Rather, it is an indispensable part
6
of education, because being able to think critically is a necessary condition for being
educated.” This study focuses on the spatial aspects of critical thinking. The National
Research Council (2006) states that a critical spatial thinker is expected to: 1) assess the
quality of spatial data, such as accuracy and reliability based on their source; 2) use a
spatial rationale as a way of thinking to construct, articulate, and defend a line of
reasoning in solving problems and answering questions; and 3) evaluate the validity of
arguments or explanations based on spatial information.
As described in the previous three sections, spatial habits of mind, spatial
concepts and skills, and critical spatial thinking are essential components of spatial
literacy in this study. The following sections discuss the definition of GIS learning and
connect it to the three components of spatial literacy.
GIS and GIS Learning
There has been ongoing debate over how to define the ‘S’ in GIS (Kemp,
Goodchild, and Dodson 1992; Wright, Goodchild, and Proctor 1997). At first, GIS
denoted a computer application, so the “S” was defined as “Systems” (Goodchild 2004).
However, as time progressed, more researchers began to interpret GIS as “Geographic
Information Science” (Goodchild 1992; Rhind 1992; Abler 1993; Dobson 1993;
Goodchild 2004). In addition, some scholars interpret the “S” as “Service,” emphasizing
open access to spatial information by the public, which became possible due to the
development of the Internet (Gűnther and Műller 1999). Geographic Information Service
is sometimes referred to as the wikification of GIS (Sui 2008) or volunteered geographic

7
information (Goodchild 2007). Other researchers use the “S” to signify “Studies,”
focusing on the social impacts of GIS (Jiang and Yao 2010). However, these various
interpretations can be thought of as part of the conceptualization of GIS as a science
(Jankowski, Tsou, and Wright 2007).
Wright, Gooldchild, and Proctor (1997, 354) indicated that GIS can be
understood as “three positions along a continuum” from GIS as “tool” to “toolmaking”
to “science,” the boundaries of which are “fuzzy.” According to Wright, Gooldchild, and
Proctor, “GIS as tool” means that GIS exists as a separable tool from a research problem,
while in order for GIS to be deemed as a “science,” researchers in this conceptualization
should have their own research topics that can be studied and tested, and finally they
should formulate theory. “GIS as toolmaking” falls somewhere in the middle between
these two positions (Wright, Goodchild, and Proctor 1997). NCGIA (National Center for
Geographic Information and Analysis) suggested specific topics that should be
considered in light of the science of GIS, such as ontology and cognition, computation,
societal issues and time (Mark 2003). The meaning of GIS in this study is not confined
to GIS as a tool, but encompasses the conceptualization of GIS as a science.
GIS learning in this study is defined as students learning what GIS is, how to
apply GIS functions to solve spatial problems, and when and why to use GIS to deal
with spatial issues. GIS learning in the present study specifically indicates the successful
completion of a GIS course at the undergraduate level. Successful completion means that
students have a good grasp of the course content specified in the learning objectives for
the GIS course. Of course, the completion of one undergraduate course does not mean
8
the mastery of content of GIS as a science. However, because the GIS course in this
study incorporated various topics related to GIS as a science, successfully learning those
topics indicates that students are likely to have perspectives and knowledge regarding
GIS as a science. Furthermore, it means that students’ perceptions of GIS are not limited
to the understanding of GIS as a tool.
GIS in Education
Researchers have asserted that GIS can be beneficial to spatial learning because
there is a close relationship between spatial thinking and GIS (Albert and Golledge
1999). Kidman and Palmer (2006, 290) contended that an “obvious link” exists between
GIS functionality and spatial thinking skills. Patterson (2007) argued that GIS can play a
significant role in unifying various themes that concern spatial trends and elements. GIS
can play a critical role for enhancing students’ spatial literacy (National Research
Council 2006). The three components of spatial literacy have been educational goals of
GIS learning in prior studies.
To investigate how GIS learning is related to students’ dispositional aspects in
learning, such as self-efficacy (Baker and White 2003; Songer 2010), attitude (West
2003), motivation (Jenner 2006; Milson and Curtis 2009), and affinity (Huynh 2009),
several tests have been developed. However, there have been few studies that explicitly
explore spatial habits of mind in geography, even though habits of mind have been
discussed as significant learning goals in other disciplines, for example, in mathematics
(Cuoco, Goldenberg, and Mark 1996; Goldenberg 1996; Charbonneau et al. 2009),

9
science (Steinkuehler and Duncan 2008; Saleh and Khine 2009), history (Lillich 1999),
and arts (Winner et al. 2006). Little discussion has occurred as to what constitutes spatial
habits of mind and how they can be developed and assessed.
Many studies pertaining to GIS in education have focused on whether GIS
learning can enhance spatial concept understanding and spatial thinking skills. Studies
investigating these effects have reported positive findings (Hall-Wallace and McAuliffe
2002; Drennon 2005; Carlson 2007; Lee and Bednarz 2009). However, other researchers
did not find that GIS influences students’ learning positively (Albert and Golledge 1999;
Abbott 2001); these researchers did not provide evidence that GIS learning had any
significant effect on students’ spatial thinking skills. Thus, whether GIS enhances
students’ informed use of spatial concepts and skills needs more empirically based
research (Rutherford 2002; Baker and Bednarz 2003; Kerski 2003; Tate, Jarvis, and
Moore 2005; Lee and Bednarz 2009; Songer 2010).
Scholars have indicated that GIS learning can facilitate students’ critical spatial
thinking (Patterson, Reeve, and Page 2003; Wigglesworth 2003; Liu and Zhu 2008).
Recently, more emphasis has been given to the development of critical spatial thinking
through GIS (Duke and Kerski 2010; Gould 2010). In spite of this trend, sufficient
studies that develop a test and probe critical thinking processes have not been conducted.
Since critical thinking has become a buzzword in education (Ford and Profetto-McGrath
1994), many researchers have used the term ‘critical’ broadly and differently in many
contexts without consensus. The question regarding the relationship between GIS

10
learning and critical spatial thinking requires further research (Hall-Wallace and
McAuliffe 2002).
Research Objectives and Questions
It is widely argued that GIS can be beneficial for enhancing spatial literacy (West
1999; Gatrell 2001; Tsou and Yanow 2010). However, researchers use different terms
for spatial literacy. Also, being spatially literate indicates meeting different criteria for
different researchers. Scholars have pointed to the lack of empirical study regarding the
pedagogical role of GIS (Lee and Bednarz 2009; Songer 2010). In this respect, this study
investigates whether taking a GIS course enhances students’ spatial literacy, defined as
spatial habits of mind, spatial concepts and thinking skills, and critical spatial thinking.
This notion of spatial literacy encompasses various definitions of spatial thinking, so it
may synthesize and widen our perspectives concerning the relationship between GIS and
spatial literacy. In addition, this study examines the effects of a GIS course by analyzing
the varying effects of gender and academic major. Finally, this research explores the
interrelationships among the three components of spatial literacy.
To address the study objectives, the following research questions were
formulated. The first three questions address each respective component of spatial
literacy while the final question investigates the relationship among the three
components.
1. Will GIS learning affect students’ spatial habits of mind?
11
a. Will the completion of a GIS course, a geography course, or a non-
geography-related course have the same effects on college students’
spatial habits of mind?
b. Will the effects of a GIS course on spatial literacy be the same for
males and females? Is there a correlation between spatial habits of mind
and participants’ academic majors?
2. Will GIS learning affect students’ spatial concepts and thinking skills?
a. Will the completion of a GIS course, a geography course, or a non-
geography-related course have the same effects on college students’
understanding and use of spatial concepts and thinking skills?
b. Will the effects of a GIS course on spatial literacy be the same for
males and females? Is there a correlation between the use and
understanding of spatial concepts and thinking skills and participants’
academic majors?
3. Will GIS learning affect students’ critical spatial thinking?
a. Will the completion of a GIS course, a geography course, or a non-
geography-related course have the same effects on college students’
critical spatial thinking?
b. What qualitative differences in critical spatial thinking will be found in
college students who completed a GIS course by comparing pre- and
post-interview responses?
12
4. Are the three components of spatial literacy interrelated? If so, what is the
nature of the relationship(s) between them?
Research Methods
The lack of test instruments has been a long-running problem in spatial thinking
research (Linn, Kerski, and Wither 2005; Milson et al. 2005; National Research Council
2006; Lee and Bednarz 2009). This study identified three elements of spatial literacy, but
few test instruments exist that measure these components. Therefore, the following tests
were developed: 1) a spatial habits of mind inventory (SHMI, APPENDIX A); 2) a
spatial concepts and skills test (SCST, APPENDIX B); and 3) a critical spatial thinking
oral test (CSTOT, APPENDIX C). During the test development, standard measures of
validity and reliability, such as indexes of factor analysis and Cronbach’s alpha, were
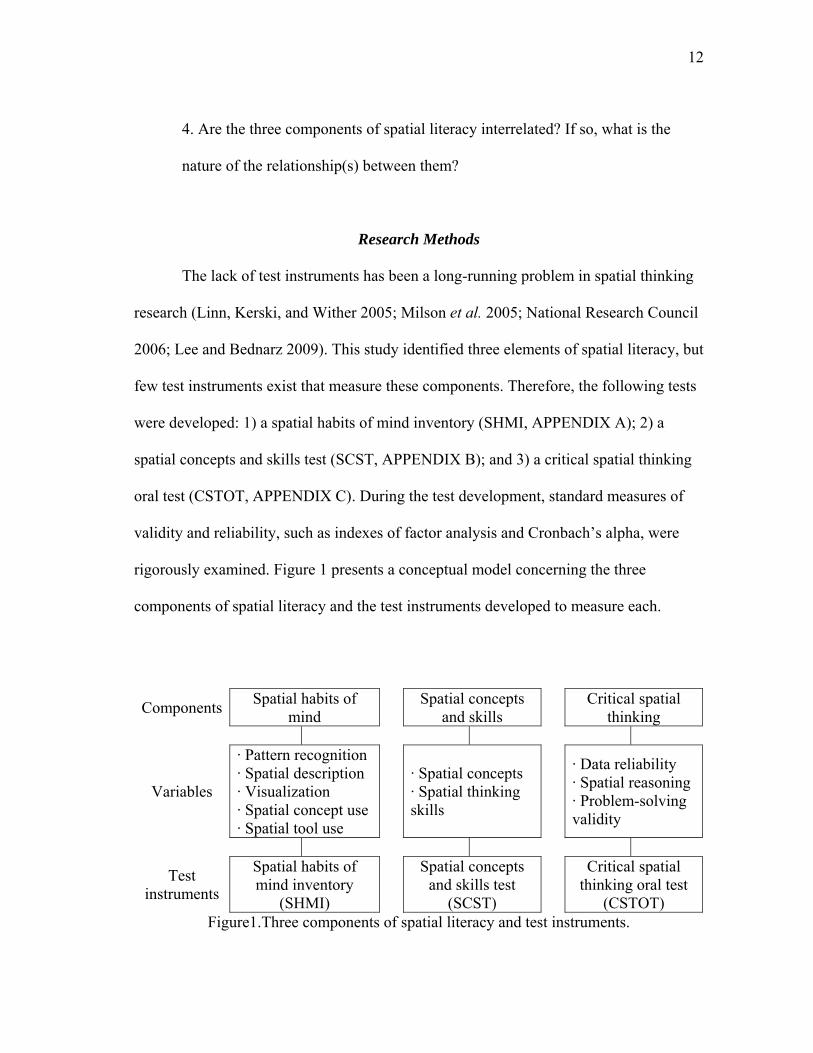
rigorously examined. Figure 1 presents a conceptual model concerning the three
components of spatial literacy and the test instruments developed to measure each.
Components Spatial habits of
mind Spatial concepts
and skills Critical spatial
thinking
Variables
· Pattern recognition · Spatial description · Visualization · Spatial concept use · Spatial tool use
· Spatial concepts · Spatial thinking skills
· Data reliability · Spatial reasoning · Problem-solving validity
Test instruments
Spatial habits of mind inventory
(SHMI)
Spatial concepts and skills test
(SCST)
Critical spatial thinking oral test
(CSTOT) Figure1.Three components of spatial literacy and test instruments.

13
The SHMI was created to measure the first component of spatial literacy. The
inventory is a Likert-scale survey instrument containing 28 items measuring five sub-
dimensions of spatial habits. The five sub-dimensions are pattern recognition, spatial
description, visualization, spatial concept use, and spatial tool use. A total of 168
undergraduate students at Texas A&M University participated in both pre- and post-tests
conducted in the 2010 fall semester.
The SCST was employed to investigate the second component of spatial literacy.
The Association of American Geographers (2005) developed a spatial skills test to
measure spatial thinking skills. This test fits well with the scope of the second
component, so it was adopted with minor modifications such as wording. One
performance task that required students to complete a contour map was added. In
addition, four questions that specifically asked about spatial concepts were added to the
spatial skills test because it did not include test items that directly asked the meaning of
specific key spatial concepts. The SCST contains 21 questions, one performance task
and 20 multiple-choice questions. In total, 171 undergraduate students at Texas A&M
University took part in both pre- and post-tests administered during the 2010 fall
semester.
The CSTOT was devised to investigate critical spatial thinking. This test is an
interview-type oral assessment and incorporated three questions from the SCST. The
interview probed students’ problem-solving processes and critical approach to spatial
thinking , using a “think-aloud” protocol to attain a deeper understanding than can be
achieved through a standardized paper-and-pencil test (Keeley and Browne 1986; Norris

14
1988). A total of 32 undergraduate students at Texas A&M University finished both pre-
and post-interview sessions.
In summary, three tests were developed as a part of this study to investigate the
effects of a GIS course on spatial literacy. These tests were employed as pre- and post-
tests in the beginning and the end of the fall semester, 2010. Undergraduate students at
Texas A&M University participated in the research.
Study Significance
Intellectual Merit
First, this study provides a useful theoretical investigation of the three
components of spatial literacy. Even though the National Research Council (2006)
suggested three essential elements of spatial literacy, those elements have not been
analyzed in depth. This research will provide a foundation for advancing research
associated with spatial literacy. Secondly, this study is expected to provide
methodological insight regarding test development. More specifically, the tests in this
study were developed using standard measures of reliability and validity. A reliability
estimate such as Cronbach’s alpha was calculated and reported. This is a recommended
practice in test development procedures that only a few spatial tests have considered
(Lee and Bednarz 2009). Furthermore, rigorous statistical methods such as confirmatory
factor analysis were used to test validity. Confirmatory factor analysis is considered a
better technique than exploratory factor analysis to investigate a model construct based
on theory (Brown 2006). The lack of research employing confirmatory factor analysis

15
has been a weakness of existing spatial thinking research (Hegarty and Waller 2005).
Finally, this study presents empirical data to evaluate the pedagogical role and value of
GIS. Because this study extends and synthesizes the benefits of GIS to spatial literacy,
that is, the heart of spatial thinking (National Research Council 2006), this research has
advantages over prior research. Until now, little research associated with GIS in
education has systematically synthesized three aspects of spatial literacy.
Broader Impacts
This study provides measurement tools that can be applied in a variety of
research fields that are concerned with spatial literacy, such as math education, science
education, and cognitive psychology. Considering that the lack of measurement
instruments has been a serious problem, the tests developed in this study can be adopted
by practitioners to collect and accumulate data. For example, a math educator could
investigate his/her students’ spatial habits of mind using the inventory developed in this
study. The teacher could further explore whether his/her intervention affects students’
spatial habits. A cognitive psychologist could investigate how participants critically
approach a dataset or problems using the test items in the critical spatial thinking oral
test. These findings will facilitate academic development of multiple disciplines whose
practitioners are interested in spatial perspectives. Each test in this study can be
administered separately or they can be used together with other tests, depending on the
researchers’ interest. In addition, this study may support efforts to extend the potential of
GIS into various educational areas. In accordance with the rationale that spatial literacy

16
can support learning in various disciplines, educators have been trying to infuse the
potential of GIS into diverse education sectors, such as general education in
undergraduate courses (Tate, Jarvis, and Moore 2005; Hespanha, Goodchild, and Janelle
2009; Sinton 2009; Tsou and Yanow 2010). To convince educators to see GIS as a tool
that can be used in a wide range of fields, it is necessary to demonstrate where and how
GIS can be beneficial. The findings from the synthesized framework in this study can be
an appealing source to persuade stakeholders.
Study Assumptions
This study assumes that:
1. Individual differences and changes in the three components of spatial literacy
can be measured.
2. The test instruments developed for this study are reliable and valid.
3. The participants provide answers to test questions to the best of their ability.
4. The participants interact in the interviews accurately describing their thinking
processes.
5. The participants in the GIS course accomplished the learning objectives of the
course.
Study Limitations
1. The participants in the experimental group were not randomly selected. Hence,
research findings may not be generalized to all students.

17
2. The participants were awarded course credit when participating in this study.
However, students may not have thought that the tests were relevant to them, so
possibly did not do their best to score as high as they can.
18
CHAPTER II
REVIEW OF LITERATURE
This study explores whether completing a GIS course enhances students’ spatial
literacy, which is composed of three elements: 1) spatial habits of mind, 2) spatial
concepts and thinking skills, and 3) critical spatial thinking. This chapter reviews
literature to provide background and context for the research question. This literature
review discusses three components of spatial literacy and connects them to GIS learning.
More specifically, the first section discusses the definition of spatial literacy to support
the adoption of the definition of spatial literacy suggested by the National Research
Council (2006). The second part describes the three components of spatial literacy in
more detail. The third section explores prior research regarding the effects of GIS
learning on these elements of spatial literacy. This section connects the three
components to GIS learning. The fourth part presents current trends of GIS education
research. The final section reviews studies concerning the relationship among the three
components of spatial literacy.
Spatial Literacy
Numerous researchers have tried to conceptualize the meaning and components
of spatial literacy. Scholars have used different terms to denote spatial literacy and its
sub-dimensions including spatial ability (Linn and Petersen 1985; Golledge and Stimson
1997), spatial thinking (Ishikawa and Kastens 2005; Gersmehl and Gersmehl 2006;
19
Kastens and Ishikawa 2006; Newcombe 2010), geospatial thinking (Marsh, Golledge,
and Battersby 2007; Golledge, Marsh, and Battersby 2008a, 2008b), and spatial
intelligence (Gardner 1993; Lloyd 2003). However, researchers have not agreed on the
definition of these terms (Caplan, MacPherson, and Tobin 1985; Linn and Petersen
1985; Voyer, Voyer, and Bryden 1995; Lloyd 2003; Black 2005; Schultz, Kerski, and
Patterson 2008; Yang and Chen 2010). Instead, they have often been used
interchangeably, but sometimes to indicate different concepts.
Longley et al. (2005) indicated persons of high spatial literacy as “spatially
aware professionals.” Focusing on spatial capabilities associated with GIS, Longley et
al. (2005, 24) maintained that:
The people of GIS will have various skills, depending on the roles they perform. Almost all will have the basic knowledge needed to work with geographic data – knowledge of such topics as data sources, scale and accuracy, and software products – and will also have a network of acquaintances in the GIS community.
As this definition reveals, Longley et al. paid particular attention to the cognitive
aspects of spatial literacy such as spatial knowledge. In a similar manner, Goodchild
(2006, 1) defined spatial literacy as:
An ability to capture and communicate knowledge in the form of a map, understand and recognize the world as viewed from above, recognize and interpret patterns, know that geography is more than just a list of places on the earth’s surface, see the value of geography as a basis for organizing and discovering information, and comprehend such basic concepts as scale and spatial resolution…a set of abilities related to working and reasoning in a spatial world and to making a picture truly worth a thousand words.

20
Further, Goodchild argued that spatial literacy should be the “fourth R,” that is, an
essential ability which future citizens should employ frequently in their everyday life,
along with reading, writing, and arithmetic.
Miller, Keller, and Yore (2005, 243-244) provided a definition of geographic
information literacy, and this conceptualization widens the scope of spatial literacy
because it includes a dispositional aspect.
Geographic information literacy is defined as the possession of concepts, abilities, and habits of mind (emotional dispositions) that allow an individual to understand and use geographic information properly and to participate more fully in the public debate about geography-related issues.
The National Research Council (2006) expanded the realm of spatial literacy one
step further by incorporating critical aspects of spatial thinking. The National Research
Council defined the characteristics of spatially literate students as having: 1) spatial
habits of mind, 2) spatial concepts and thinking skills, and 3) critical spatial thinking. A
spatially literate student habitually adopts spatial perspectives in his/her everyday life
(Cuoco, Goldenberg, and Mark 1996). Furthermore, the student has a developed
understanding of spatial concepts and skills (Gersmehl 2005; Golledge, Marsh, and
Battersby 2008a). Domain specific knowledge and skills are essential ingredients for
productive learning and work (Glaser 1984; Goldenberg 1996). Finally, the student
considers spatial information with healthy skepticism (Milson and Alibrandi 2008),
meaning the spatial thinker critically evaluates his/her spatial thinking and recognizes
that there are alternatives.

21
This study adopts the National Research Council’s definition because it
encompasses cognitive, dispositional, and critical aspects of spatial literacy, which are
crucial to appropriately evaluate expertise in a domain. Expertise cannot be properly
defined by examining only cognition. According to previous studies (Ackerman et al.
2001; Ackerman 2003; Ackerman and Wolman 2007; Beier, Campbell, and Crook
2010), expertise was more accurately predicted by considering not only cognition, but
also non-cognitive traits such as affective and conative aspects. Affective aspects belong
to disposition, and conative aspects that connote active efforts of learners could be
related to critical thinking which is active thinking processes evaluating one’s thinking.
Therefore, the definition of spatial literacy in this study, which considers dispositional
and critical aspects as well as cognitive factors, will provide one of the most cogent
discussions regarding components of spatial literacy and the effects of GIS learning on
them. The next section discusses the three components in more detail.
Spatial Habits of Mind
The first component of spatial literacy in this study evaluates its dispositional
aspects. A spatially literate student is expected to employ spatial thinking habitually.
This section first discusses habits of mind in general, and then moves to a more specific
investigation regarding spatial habits of mind.
22
Habits of Mind
Researchers have defined habits of mind in a variety of ways. Conceptualizations
about habits of mind can be categorized into three types: 1) broad composite skills, 2)
particular ways of thinking, and 3) habituated (automatic) inclination.
Some researchers emphasized that habits of mind encompass a wide range of
components that are associated with learning. For example, Costa (2008, 17) defined a
habit of mind as “a composite of many skills, attitudes, cues, past experiences, and
proclivities.” A habit of mind is the broadest learning outcome (Costa and Kallick 2008).
Costa (2008) suggested sixteen broad constituents of habits of mind: persisting;
managing impulsivity; listening with understanding and empathy; thinking flexibly;
thinking about thinking (metacognition); striving for accuracy; questioning and posing
problems; applying past knowledge to new situations; thinking and communicating with
clarity and precision; gathering data through all senses; creating, imagining, innovating;
responding with wonderment and awe; taking responsible risks; finding humor; thinking
interdependently; and remaining open to continuous learning. Similarly, Saleh and
Khine (2009) understood habits of mind as including diverse aspects of learning, such as
a construction of knowledge and enquiry skills. Charbonneau et al. (2009) considered
creativity, work ethic, thinking interdependently, critical thinking, lifelong learning, and
curiosity as key components of habits of mind. These authors hinted that the concept of
habits of mind can be very broad.
These conceptualizations have encouraged researchers to develop concrete
guidelines and educational models to enhance students’ habits of mind. Some

23
researchers suggested instructional strategies to incorporate habits of mind into
instruction (e.g., Boyes and Watts 2009; Charbonneau et al. 2009). Colcott, Russel, and
Skouteris (2009) reported that when students were guided to train their habits of mind,
their higher-order thinking skills were enhanced. These researchers developed a
“Toolbox” in which various thinking strategies were contained in the form of cards.
Students consulted with the box when they needed to solve a problem. By using the
thinking cards in the box, students had opportunities to make their thinking visible and to
think about what kind of methods can be incorporated to solve problems. That is,
students came to develop habits to “think.” In this way, habits of mind as composite
skills inspired educators to develop instructional models to help students form habits to
think.
Some scholars have stressed particular ways of thinking processes in habits of
mind. Harel (2007) suggested two types of mental acts that are essential in knowledge
construction: the way of understanding and the way of thinking. The way of
understanding is related to the products or outcomes of a mental act. On the other hand,
the way of thinking refers to characteristics or specific features of a mental act. The way
of thinking can be deemed as habits of mind if one habitually employs a particular way
of thinking. Even the same problem can be solved through different ways of thinking,
for example, spatial or linguistic strategies. Similar to Harel’s view, Cuoco, Goldenberg,
and Mark (1996, 375-376) regarded ways of thinking as habits of mind, in which
thinking processes are emphasized.
Much more important than specific mathematical results are the habits of mind used by the people who create those results… The goal is not to train large
24
numbers of high school students to be university mathematicians. Rather, it is to help high school students learn and adopt some of the ways that mathematicians think about problems.
Specifically, Cuoco, Goldenberg, and Mark suggested two types of habits of mind:
general habits of mind that can be applied across domains and mathematical habits of
mind that specifically focus on mathematics.
This notion of habits of mind has been the framework to conduct the National
Science Foundation-funded CME (Center for Mathematics Education) project (Cuoco
2007). Led by Cuoco, the CME project team has developed educational models to foster
students’ mathematical habits of mind. The team demonstrated the effects of their
models through class implementation. Furthermore, the team conducted a wide range of
workshops to refine and disseminate their ideas. In particular, the Cuoco group has
focused on developing students’ mathematical thinking habits such as finding patterns
and creating representations (Cuoco, Goldenberg, and Mark 2010). In the same manner,
Mark et al. (2010) argued that students should learn ways of thinking, not a final result
which can be outdated in the future. Mark et al. exemplified how students can promote
their mathematical habits of mind using examples, such as comparing prices and finding
multiplication patterns. These studies emphasize that students must learn effective
thinking paths to solve problems. Spatial thinking is also a particular way of thinking
that can help students effectively solve problems.
A third group of researchers emphasized characteristics of automatic inclination
in habits of mind. For instance, Goldenberg (1996, 14) noted habitual and automatic
characteristics of habits of mind.

25
By “habits of mind,” we mean ways of thinking that one acquires so well, makes so natural, and incorporates so fully into one’s repertoire, that they become mental habits – not only can one draw upon them easily, one is likely to do so.
Similarly, Leikin (2007) postulated that habits of mind are related to one’s “inclination
and ability to choose effective patterns of intellectual behavior.” Habits of mind play a
powerful role, particularly when one faces a problem unfamiliar to him/her. A person
who has habitually engaged him/herself in choosing effective intellectual behavior is
likely to solve unfamiliar problems reasonably and intelligently (Leikin 2007; Boyes and
Watts 2009).
The third group has shown that an effective intellectual habit, that is, an effective
automatic cognitive orientation, makes people focus on useful cues without being
distracted by less efficient information. Aarts, Verplanken, and van Knippenberg (1997)
reported that when one has formed a habit, the person tends to pay little attention to
irrelevant information. To be specific, when participants were required to select a travel
mode from options such as car use, walking, and bike use, if they already had
established a habit to use a specific travel mode, they were less distracted by other
additional information in making a decision. Moreover, the selection was made more
quickly. Verplanken and Aarts (1999) interpreted that the faster selection was possible
because participants had easy access to memory. These studies show that automatic
elicitation of specific behavior or thinking is an important characteristic of habits.
As this brief review indicates, researchers have defined habits of mind from
diverse perspectives. Synthesizing the conceptualizations above, this study defines habits
of mind as internalized thinking processes directed towards a particular perspective. For
26
example, a spatial thinker is expected to employ a spatial perspective, which is a
particular way of thinking. Furthermore, a spatial thinker incorporates spatial
perspectives frequently or automatically because habits are internalized thinking
processes. Since there has been no research that explicitly defines spatial habits of mind
and their sub-components, this study may shed light on the discussion concerning spatial
habits of mind.
Sub-dimensions of Spatial Habits of Mind
Spatial habits of mind emphasize spatial perspectives. The proposed
conceptualization of spatial habits of mind can be understood as internalized thinking
process that uses spatial ways of thinking, such as the appreciation of spatial concepts
and reasoning and representing and expressing ideas through spatial forms (e.g.,
visualization) (National Research Council 2006). More specifically, this study identified
sub-dimensions of spatial habits of mind as: 1) pattern recognition, 2) spatial description,
3) visualization, 4) spatial concept use, and 5) spatial tool use. Students with spatial
habits of mind have internalized inclinations to adopt these thinking processes. Because
few studies have explicitly discussed spatial habits of mind, the general habits of mind
identified by Cuoco, Goldenberg, and Mark (1996) – pattern sniffering, experimenting,
describing, tinkering, inventing, visualizing, conjecturing, and guessing – were reduced
to pattern recognizing, spatial describing, and visualizing because they fit well with
spatial perspectives. Furthermore, spatial concept use and spatial tool use were added to
the list because prior studies indicated these are important components of spatial
27
thinking. A detailed description and justification of these five selected sub-dimensions
follow.
Pattern Recognition
A pattern recognizer tries to identify spatial patterns in wide ranging situations.
Researchers have indicated that pattern recognition is a significant spatial thinking skill.
For example, Piburn et al. (2002) postulated that detecting patterns is an important
spatial ability. In a geology course, students developed their spatial ability by enhancing
their skills to recognize patterns, such as fault lines in rocks. DeMers and Vincent (2007,
277) argued that one of the most significant outcomes in a successful geography
education is for students to “recognize, describe, and finally, to predict spatial patterns.”
DeMers and Vincent recommended introducing pattern recognition activities into the
classroom. Following this recommendation, students can be guided to foster their spatial
habits to recognize patterns in their everyday life, such as the distribution of cars in a
parking lot, the pattern of roads, or the distribution of population. For these reasons,
pattern recognition was included as one of the sub-dimensions of spatial habits of mind.
Levels of pattern recognition differ according to expertise. Chase and Simon
(1973) found that an expert in chess could reconstruct diverse chess boards because
he/she recognized and chunked patterns into a meaningful whole. Lesgold et al. (1988)
found that expert radiologists were adept at recognizing and clustering observed medical
data into a coherent pattern. Similarly, experienced electronic technicians (Egan and
Schwartz 1979), architects (Akin 1980), and stereoscopic analysts (Kastens and
28
Ishikawa 2006) also showed an impressive ability to recognize patterns. Describing and
explaining patterns is one of the essential jobs of geographers (Weeden 1997) and
geologists (Piburn et al. 2002). For these reasons, pattern recognition was included as
one of the sub-dimensions of spatial habits of mind.
Spatial Description
A spatial describer uses spatial vocabulary proficiently. In various disciplines,
educators have emphasized the importance of vocabulary. After analyzing science
textbooks, Yager (1983) reported that the textbooks contained too many academic terms,
hindering students’ learning. This awareness shows educators’ interest in a vocabulary
for effective learning. Students feel difficulty understanding academic terms because
they are abstract and cognitively demanding (Cummins 1981). Therefore, researchers
have tried to enhance students’ understanding of vocabulary (Walqui 2006; Swanson
2010). For instance, Gibbons (2002) found that well-designed group work provided
students with opportunities to use academic language. Gibbons described a classroom in
which ELI students studied language and academic content simultaneously. Teachers
helped students’ acquisition of academic vocabulary by scaffolding their learning in
group activities. As a result, the students understood the contexts of academic
vocabulary and came to use it more frequently. The use of vocabulary is a manifestation
of students’ understanding of content. For example, if a student understands a
mathematical theory or logic, he/she should be able to articulate it using mathematical
language (Cuoco, Goldenberg, and Mark 2010; Mark et al. 2010).

29
Spatial vocabulary is not an exception. Newcombe (2010) argued that the use of
spatial vocabulary is a prerequisite of spatial literacy. Geoscientists who employ spatial
thinking in their professional research have a more advanced spatial lexicon than that of
novices, and further, they use spatial vocabulary frequently (Kastens and Ishikawa
2006). Bednarz and Bednarz (2008) found that a lack of spatial vocabulary hindered
effective learning and expression of spatial thinking. Gregg and Sekeres (2006) argued
that an appropriate level of understanding of vocabulary is essential for effective
learning; to enhance students’ learning in geography, students should use spatial or
geographic vocabulary effectively. To foster spatial literacy, students’ use of spatial
vocabulary must be understood and encouraged (Marsh, Golledge, and Battersby 2007;
Golledge, Marsh, and Battersby 2008a, 2008b), because the informed use of vocabulary
plays a fundamental role in forming knowledge (Salsbury 2006). Moreover, Audet and
Abegg (1996) stressed the importance of spatial vocabulary in GIS problem solving.
According to Audet and Abegg, novice problem solvers did not have a good grasp of
vocabulary such as corner, subdivision, and residential, and this lack of understanding
hindered their effective problem-solving. Therefore, a spatially literate student is
expected to understand and use spatial terms.
Visualization
Visualization is an effort to understand through the aid of graphical
representations (Blaser, Sester, and Egenhofer 2000). If information or data are
conveyed verbally, a visualizer attempts to enhance his/her comprehension by

30
converting the information into visual representations such as graphs or diagrams. A
visualizer knows the benefit and power of graphic representations, and thus frequently
employs visualization strategies for imparting knowledge to other people as well as
enhancing his/her own understanding. In fact, using visualization as a cognitive strategy
is a natural tendency of human beings (Rieber 1995).
Researchers agree that visualization is an effective educational strategy (Larkin
and Simon 1987; Libarkin and Brick 2002). For instance, Brandt et al. (2001) reported
that students’ learning improved when visualization methods were incorporated. In their
study, a treatment group studied the content using visualization tools such as diagrams of
experimental designs and chemical reactions, while a control group learned the same
content without visualization. Post-test scores indicated that the treatment group
improved significantly more than the control group. In another study, Bauer and
Johnson-Laird (1993) presented problems to participants in two forms: verbal and visual
(diagram). These researchers found that the participants in the visual group produced
much more valid conclusions, and they were able to process information faster than the
verbal group. According to a meta-analysis conducted by Baker and Dwyer (2000),
visualized instruction produced positive effects on students’ learning.
Scientists have employed visualization as an important learning and research tool
(Gordin and Pea 1995; Edelson and Gordin 1998; Libarkin and Brick 2002; Goodchild
and Janelle 2004). Therefore, numerous significant scientific discoveries in physics,
geoscience, and engineering were made through visualization strategies (Shepard 1978;
Shepard 1988; MacEachren and Ganter 1990; Newcombe 2010). John Snow’s

31
visualization of the cholera epidemic in London is a well-known example. By visually
displaying locations of deaths and water pumps, Snow could identify the relationship
between these two factors (Rieber 1995). James Watson and Francis Crick discovered a
three-dimensional structure of DNA through imaginative visualization (National
Research Council 2006). Farady understood the connectedness of electric currents and
magnetic force by visually displaying them (Nersessian 1992). Almost every discipline
associated with spatial thinking utilizes visual representations, such as maps, as a
method to organize information since visualization enables researchers to recognize
critical patterns in data or problems (Kastens and Ishikawa 2006). Thus, this study
includes visualization as one dimension of spatial habits of mind.
Spatial Concept Use
A spatial concept user habitually employs spatial concepts to understand and
perform various tasks. Spatial concepts such as distance and pattern form the basis of the
spatial point of view (Nystuen 1963), and spatial experts employ spatial concepts to
understand their surroundings (Kastens and Ishikawa 2006). Students’ concept use has
been a significant research topic in education. It is important to investigate students’
concept use because it is the base for students to understand the world. Furthermore,
when inappropriate concept use is exercised, students form misconceptions.
In many disciplines, students’ concept use has been studied. For example, in
science, Vosniadou and Brewer (1992) showed that children’s understanding of the
Earth depends on their concept understanding established through everyday experience
32
and learning. Initially, children have concepts of “disc earth” or “rectangular earth”
which assume the flat surface. Children maintain these models because of their
experience in everyday life; they live on the flat surface. However, after children learn
the scientific model of the “sphere” earth, they begin to formulate misconceptions such
as “flattened sphere” or “hollow sphere,” synthesizing their initial models with the
scientific model. This investigation is important because children’s conceptual models
are a window for them to understand phenomena or problems. Student’s use and
development of concept have been reported in other topics including the day/night cycle
(Vosniadou and Brewer 1994) and force (Ioannides and Vosniadou 2002).
In biology, Inagaki and Hatano (2002) found that students’ understanding of
bodily phenomena, such as blood circulation and respiration, develops from vitalistic to
mechanical causality. In mathematics, Gelman (1994) discussed how children
understand the concept of numbers. Students’ initial understanding of “number” is based
on natural numbers having the following characteristics: 1) natural numbers are counting
numbers, 2) natural numbers are discrete (i.e., no other number between two numbers),
and 3) longer natural numbers (i.e., more digits) are bigger. However, these rules do not
apply to rational numbers, therefore, the lack of understanding of rational numbers can
hinder students’ learning (Vamvakoussi and Vosniadou 2004).
Geography educators have stressed the importance of spatial concepts.
Researchers found that children had difficulty correctly identifying symbols on
classroom maps because they lacked an understanding of Euclidean concepts (Liben and
Downs 1986; Liben and Yekel 1996; Liben and Myers 2006). Downs and Liben (1990)

33
reported that first and second graders could not successfully complete overhead-view
and direction-view tasks because they did not understand spatial concepts concerning
projective space. Even college students could not complete map projection and
coordinate systems tasks, due to their insufficient understanding of spatial concepts
(Downs and Liben 1991). Therefore, development of geographic expertise should be
discussed in relation to spatial concept understanding (Downs, Liben, and Daggs 1988;
Downs and Liben 1991). In this way, prior research regarding concept use in diverse
disciplines suggests that students’ appropriate concept use is an essential factor for
effective learning and problem-solving. For these reasons, spatial concept use was
identified as one of the sub-dimensions of spatial habits of mind.
Spatial Tool Use
Spatial tools such as maps, Google Earth, or GIS can support spatial thinking
(National Research Council 2006). Researchers have argued that using spatial
representations such as maps can promote the development of spatial cognition (Uttal
2000; Davies and Uttal 2006). In a study by Uttal and Wellman (1989), one group
learned a spatial layout of a playhouse using a map, while the other group used
flashcards. After both groups mastered the layout, they were asked to navigate the
playhouse and predict information related to each room. Children in the map group were
able to navigate and predict the contents of unentered rooms better than children who
used flashcards. Uttal and Wellman argued that the exposure to maps helped children
understand space in a survey-like way and contributed to the development of spatial

34
cognition. Similarly, Uttal, Fisher, and Taylor (2006) found that children’s
understanding of spatial information was limited when they learned it from verbal
description. The nature of children’s information was serial when learned through verbal
description, failing to integrate the information into a coherent picture. However, when
children learned the information through maps, they effectively integrated the spatial
information.
Spatial thinkers enjoy using spatial tools such as GIS to solve problems (National
Research Council 2006), and these habits are likely to further the enhancement of spatial
literacy. The National Research Council (2006) exemplified how a spatial thinker
synthesizes a wide range of information to make a reasonable decision with the aid of
GIS. The spatial thinker could combine information of access to safe water, female
literacy rate, and population per doctor using GIS functionality.
Education can play a critical role in spatial tool use because students increase
their use of spatial tools when given explicit spatial education (Bednarz and Bednarz
2008). The National Geography Standards (1994) encourage the use of spatial tools. The
Standards were written with GIS in mind because of its expected role in enhancing
students’ spatial learning (Geography Education Standards Project 1994). Furthermore,
more emphasis is given to geospatial technologies in the revised version of the National
Geography Standards (Stoltman et al. 2008). Hence, spatial tool use was included as one
sub-dimension of spatial habits of mind.
35
Spatial Concepts and Thinking Skills
The second component of spatial literacy is associated with cognition. A spatially
literate student is expected to use spatial concepts and thinking skills in an informed
way. This section discusses prior studies which suggest essential spatial concepts and
thinking skills.
Spatial Concepts
To be spatially literate, students require an understanding of fundamental spatial
concepts. Spatial concepts form the building blocks of enhanced spatial thinking
(National Research Council 2006; Huynh 2009). Researchers have discussed the
development of an understanding of spatial concepts. For example, Piaget and Inhelder
(1967) suggested a three step progression in which children’s spatial thinking develops
from topological space to projective and finally Euclidean space. Topological
information is concerned with relations, such as proximity, separation, order, and
enclosure. Egocentrism is thought to be a critical factor in topological space, that is,
students understand space in terms of their own actions and perspectives. When students
can conceptualize projective space, they begin to understand that a particular perspective
or points of view exist. Therefore, students who conceptualize projective space are able
to grasp the fact that a straight line, a triangle, or parallel lines are invariant, even if their
perspective changes. Finally, when individuals master Euclidean space, the metric
properties of a system of axes or coordinates are understood. Hence, spatial concepts

36
such as angles and distance which measure spatial relations metrically are understood at
this stage.
Catling (1978) discussed students’ development of spatial concepts in relation to
the geography curriculum. Catling attempted to sequence spatial concepts from the
topological stage through to the Euclidean stage, arguing that the organizational
concepts in geography are spatial location, spatial distribution, and spatial relations.
Catling postulated that these spatial concepts should be taught in a spiral manner,
considering students’ progression of understanding of them.
Janelle and Goodchild (in press) also provided foundational concepts in spatial
thinking. These spatial concepts should be mastered to be spatially literate: location,
distance, neighborhood and region, network, overlay, scale, spatial heterogeneity, spatial
dependence, and objects and fields.
Golledge and his associates (Marsh, Golledge, and Battersby 2007; Golledge,
Marsh, and Battersby 2008a, 2008b) proposed essential concepts in spatial thinking
(Table 1). In a sequence of studies, Golledge (1991, 1992, 1995, 2002) explored the
hierarchy of spatial knowledge through spatial primitives. Golledge suggested “identity,”
“location,” “magnitude,” and “time” as spatial primitives on which derivative and
higher-order concepts can be built. Spatial primitives help us recognize and characterize
spatial occurrences. To be specific, it is essential to sense or perceive an occurrence, that
is, to “identify” an occurrence to understand a spatial event. Without knowing that
something is happening, it is impossible to analyze a spatial event further. Identifying is
the process of providing an occurrence with a “name” or a “label” (Golledge 1995). In

37
addition, the occurrence should take place in a specific “location” and at a specific
“time.” Moreover, the “magnitude” of the occurrence, such as how big or how many, is
essential in characterizing the phenomenon. In this manner, spatial primitives play a
fundamental role in understanding the properties of a spatial occurrence. Furthermore,
Golledge postulated that higher level concepts can be developed from these four
primitives, forming a conceptual hierarchy. For example, the interval between two
locations can be defined as distance. Magnitude can determine relative size or quantity,
and this can be linked to the concept of area or region (Golledge 1995). The spatial
primitives are crucial in systematically grasping of spatial concepts. Nevertheless, scant
attention has been paid to spatial primitives and their definitions (Golledge 2002).
Table 1.The Golledge group’s framework for spatial concepts. Concept level
I Primitive
II Simple
III Difficult
IV Complicated
V Complex
Identity location Magnitude Space-time
Arrangement Class/group Direction Distribution Edge Order/sequence Proximity Relative distance Shape
Adjacency Angle Area Center Change Cluster Grid Growth Isolated Lined Polygon Reference frame Spread
Buffer Connectivity Corridor Gradient Profile Representation Scale Surface
Active space Central place Distortion Enclave Grate circle Interpolation Projection Social area Subjective space
Source: Golledge, Marsh, and Battersby (2008a, 294).

38
Building on an awareness of this problem, Marsh, Golledge, and Battersby
(2007) tried to justify Golledge’s framework for spatial concepts by examining whether
differences exist in spatial concept understanding across grades from middle school to
college. Marsh, Golledge, and Battersby presented participants with diagrams composed
of point, line, and polygon. Then, these researchers asked the participants to generate
and select spatial terms that appropriately describe the spatial relationship in the
diagrams. According to Marsh, Golledge, and Battersby, older students exhibited more
advanced spatial concept understanding because they generated and selected appropriate
spatial terms significantly more. Battersby, Golledge, and Marsh (2006) were also
interested in how students’ understanding of spatial concepts progresses according to
grade/age levels. Battersby, Golledge, and Marsh recruited participants from middle
school, high school, and university and then investigated whether their understanding of
map overlay, which is a fundamental spatial concept, develops as students become older.
The participants were given two maps showing crops and soil types and were asked to
find a place in which specific kinds of crops and soil types intersect. In addition, other
problems in the same study tested students’ understanding regarding overlay operators
such as AND, OR, and NOT. According to the results, older students performed better
on all these tasks. These findings suggest that there is a hierarchy in the understanding
and use of spatial concepts.
In summary, researchers have argued that understanding of spatial concepts is
crucial for spatial thinking. Prior studies indicated that there are different levels of
complexity in spatial concepts, and further, students’ understanding differs according to
39
age or grade levels. Thus, it is expected that advanced spatial thinkers have enhanced
comprehension of spatial concepts.
Spatial Thinking Skills
Based on their understanding of spatial concepts, spatially literate students can
solve problems using spatial thinking skills. Knowledge of spatial concepts is a
prerequisite of spatial literacy, but without spatial thinking skills, spatial concepts cannot
be applied in proper contexts.
Several scholars listed essential spatial thinking skills and suggested taxonomies
of spatial thinking skills (Self and Golledge 1994; Golledge and Stimson 1997; Golledge
2002; Bednarz 2004; Gersmehl 2005; Ishikawa and Kastens 2005; Gersmehl and
Gersmehl 2006, 2007). Table 2 presents five lists of spatial thinking skills selected from
prior studies. These taxonomies served as guidelines to develop a test to measure spatial
thinking skills in this study.
Critical Spatial Thinking
The third component of spatial literacy is critical spatial thinking. Critical spatial
thinking emphasizes students’ critical and deep thinking processes concerning spatial
problems. This section first investigates the importance and status of critical thinking in
education from a wide range of perspectives. Then, more specifically, the meaning of
critical spatial thinking is discussed followed by an investigation of expert-novice
differences that are important manifestations of critical spatial thinking.

40
Table 2.Taxonomies of spatial thinking skills. Golledge and Stimson 1997 1) the ability to think geometrically, 2) the ability to image complex spatial relations such
as three-dimensional molecular structures or complex helices, 3) the ability to recognize spatial patterns of phenomena at a variety of different scales, 4) the ability to perceive three-dimensional structures in two dimensions and the related ability to expand two-dimensional representations into three-dimensional structures, 5) the ability to interpret macro spatial relations such as star patterns or world distributions of climates or vegetation and soils, 6) the ability to give and comprehend directional and distance estimates as required in navigation and path integration activities used in wayfinding, 7) the ability to understand network structures, 8) the ability to perform transformations of space and time, 9) the ability to uncover spatial associations within and between regions or clusters, 10) the ability to image spatial arrangements form verbal reports or writing, 11) the ability to image and organize spatial material hierarchically, 12) the ability to orient oneself with respect to local, relational, or global frames of reference, 13) the ability to perform rotation or other transformational tasks, 14) the ability to recreate accurately a representation of scenes viewed from different perspectives or points of view, and 15) the ability to compare, overlay, or decompose distributions, patterns, and arrangements of phenomena at different scales, densities, and dispersions.
Golledge 2002 Comprehending 1) scale transformations, 2) transformation of perceptions, representations and images, 3) superordinate and subordinate relations and frames of reference, 4) problems of spatial alignment, 5) distance effects, 6) spatial associations, 7) orientation and direction, 8) spatial classification, 9) clustering and dispersion, 10) spatial change and spatial spread (spatial diffusion), 11) non-spatial and spatial hierarchy, 12) densities and density decay, 13) spatial shapes and patterns, 14) locations and places, 15) overlay and dissolve (spatial aggregation and disaggregation), 16) integration of geographic features represented as points, networks, and regions, 17) spatial closure (interpolation), 18) proximity and adjacency, and 19) spatial forms (e.g. city spatial structures; relating traverses or cross-sections to three-dimensional block diagrams or images).
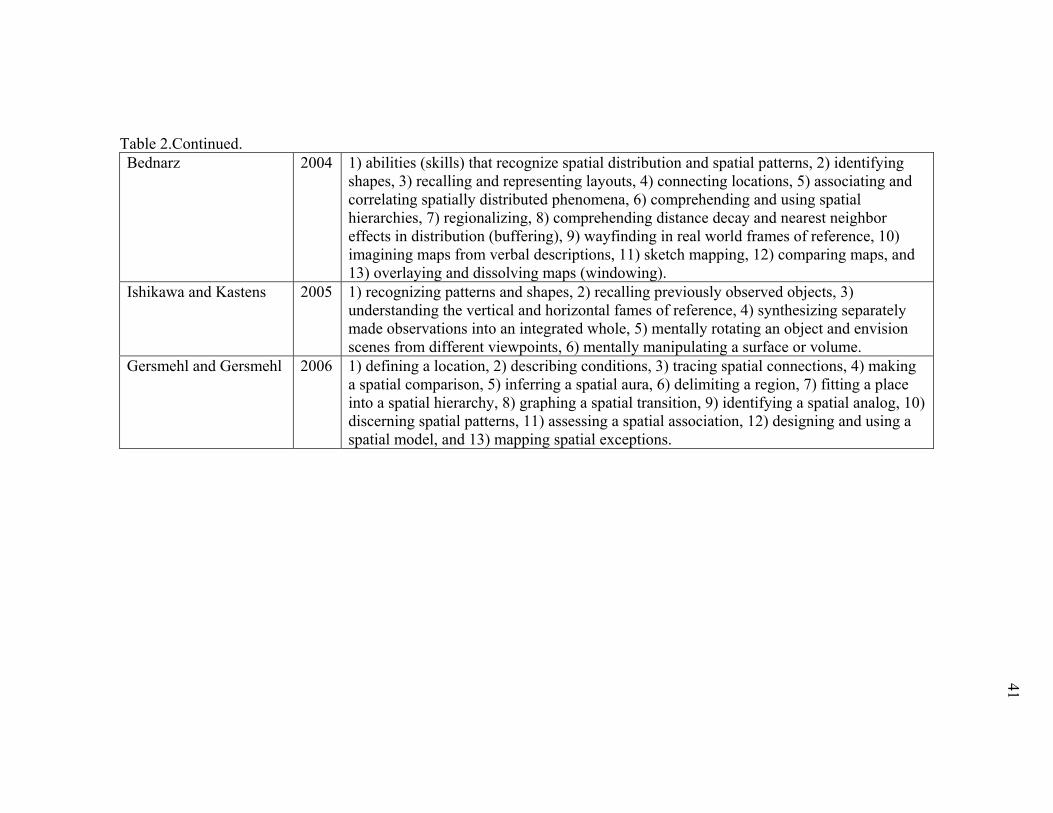
41
Table 2.Continued. Bednarz 2004 1) abilities (skills) that recognize spatial distribution and spatial patterns, 2) identifying
shapes, 3) recalling and representing layouts, 4) connecting locations, 5) associating and correlating spatially distributed phenomena, 6) comprehending and using spatial hierarchies, 7) regionalizing, 8) comprehending distance decay and nearest neighbor effects in distribution (buffering), 9) wayfinding in real world frames of reference, 10) imagining maps from verbal descriptions, 11) sketch mapping, 12) comparing maps, and 13) overlaying and dissolving maps (windowing).
Ishikawa and Kastens 2005 1) recognizing patterns and shapes, 2) recalling previously observed objects, 3) understanding the vertical and horizontal fames of reference, 4) synthesizing separately made observations into an integrated whole, 5) mentally rotating an object and envision scenes from different viewpoints, 6) mentally manipulating a surface or volume.
Gersmehl and Gersmehl 2006 1) defining a location, 2) describing conditions, 3) tracing spatial connections, 4) making a spatial comparison, 5) inferring a spatial aura, 6) delimiting a region, 7) fitting a place into a spatial hierarchy, 8) graphing a spatial transition, 9) identifying a spatial analog, 10) discerning spatial patterns, 11) assessing a spatial association, 12) designing and using a spatial model, and 13) mapping spatial exceptions.

42
Critical Thinking in Education
Educators have emphasized the importance of critical thinking from a wide range
of perspectives (Kennedy, Fisher, and Ennis 1991; Taube 1997; Pithers and Soden 2000;
Albert and Albert 2002). However, the general consensus among educators, politicians,
and businessmen is that it is important to teach students to think critically (Gould 2010).
Fostering critical thinking is one of the most significant learning outcomes for every
curriculum (Case 2005; Tsui 2008; Tapscott 2009), and the ultimate goal for educators is
to make students think critically (Sternberg and Baron 1985). The development of
critical thinking should become an indispensable goal of education, not simply an option
that can be selected, depending on a policy maker’s philosophy or discretion (Norris
1985). That is, fostering critical thinking is one of the most crucial aims of education
(Pithers and Soden 2000).
Today, society is changing dramatically, and therefore, people should process a
wide range of information and judge the reliability and validity of the information. Since
students cannot learn everything that will be necessary in their future life, they should
become lifelong learners. Critical thinking can play an important role in becoming a
sensible lifelong learner (Elder 2004). Students themselves were aware of the necessity
of critical thinking and reported that critical thinking skills developed in university
coursework were as important as course content (Lauer 2005). Empirical evidence has
shown that when activities including higher-order thinking such as analysis, synthesis,
and evaluation of information were emphasized, students felt that the university
43
contributed to their academic development and job preparation (Beachboard and
Beachboard 2010).
Researchers in various disciplines, such as nursing (Colucciello 1997; Shin et al.
2006), business (Henninger and Hurlbert 1996; Braun 2004), accounting (Kimmel 1995;
Wolcott et al. 2002), leadership education (Burbach, Matkin, and Fritz 2004), and
science education (Bailin 2002), have tried to incorporate critical thinking components
in their education programs. These researchers believe that critical thinking is an
essential skill in their fields, thus, it must be fostered through education. To illustrate a
few examples, Braun (2004) indicated that critical thinking skills are crucial for the
business curriculum because decision-making is a very common practice businessmen
should exercise. Braun described possible approaches for critical thinking education, that
is, problem-based learning, course-content-embedded learning, and various elements
underlying other pedagogies (such as critical theory, critical reflection, and critical
systems thinking). However, Braun did not provide empirical data to support these
recommendations. Kimmel (1995) suggested a framework to combine critical thinking
components with accounting curricula. The framework included affective, cognitive, and
behavioral domains, and Kimmel showed how the three dimensions can be incorporated
into the current accounting curricula. However, the framework needs to be justified
through empirical research. Bailin (2002) presented examples of how to employ critical
thinking into science education. The examples included designing an insect habitat,
creating an experiment to test a hypothesis, exploring causation between smoking and
strokes, and discussing whether nuclear power is a desirable energy source. These

44
examples fit well with the science curriculum, but Bailin did not empirically examine the
educational effects of these examples. In sum, prior studies emphasized critical thinking
and suggested various strategies to incorporate it into curricula, but more empirical
research is clearly required. There is a paucity of research regarding effective pedagogy
to enhance critical thinking (Tsui 2002; Braun 2004).
When teaching critical thinking to students, careful approaches must be exercised
because there are more ways to fail than succeed in instructing how to think critically
(Sternberg 1987). Since critical thinking has become a buzzword in education (Ford and
Profetto-McGrath 1994; Stapleton 2011), many researchers have used the term ‘critical’
broadly and differently in many contexts (Rudd, Baker, and Hoover 2000; Brunt 2005).
Thus, educators should cautiously specify sub-dimensions of critical thinking and then
promote and evaluate them. This study attempts to identify components of critical spatial
thinking, and further, explores how to develop it. In this respect, the following section
investigates the characteristics of critical spatial thinking in more detail.
Characteristics of Critical Spatial Thinking
Critical spatial thinking is a form of critical thinking that emphasizes its spatial
aspects. A critical approach to spatial reasoning is closely associated with higher-order
thinking (Tsui 2002; Milson and Alibrandi 2008; Tsui 2008) and problem-solving
(Pithers and Soden 2000). To be a critical thinker, students should be encouraged to
“analyze, critique, judge, compare and contrast, evaluate, and assess” (Sternberg 2003,
5). Recently, scholars have increased their interest in critical spatial thinking, but

45
empirical research has been scant. Many of previous studies conceptually discussed
components or characteristics of critical spatial thinking without conducting empirical
investigation. However, these discussions can provide insight into how to define critical
spatial thinking.
The National Research Council (2006) suggested the characteristics of a critical
spatial thinker as: 1) assessing the quality of spatial data such as accuracy and reliability
based on their source; 2) using a spatial rationale as a way of thinking to construct,
articulate, and defend a line of reasoning in solving problems and answering questions;
and 3) evaluating the validity of arguments or explanations based on spatial information.
A critical spatial thinker considers spatial information with healthy skepticism,
evaluating his/her spatial thinking.
Milson and Alibrandi (2008) discussed critical map literacy. These researchers
contended that critical map literacy is a geographic counterpart to critical literacy, media
literacy, and primary source literacy. According to Milson and Alibrandi (2008, 120):
Critical map literacy is one such higher-order thinking skill. To illustrate, we draw an important distinction between map reading and critical map literacy. Basic map reading skills involve making sense of features such as map symbols, orientation, and scale. It requires understanding of how abstract elements on the page or screen are designed to represent features in the real world. Critical map literacy involves possessing the knowledge and skills that enable analysis and evaluation of the map. Thus, critical map literacy goes beyond map reading just as comprehension of a passage of text involves more than deciphering words.
In this way, critical map literacy emphasizes a deeper understanding of spatial thinking
than simple map reading. Milson and Alibrandi argued that a person with critical map
literacy employs a critical lens in evaluating geographic representation in terms of

46
accuracy, point of view, values, and power relationships. Moreover, a critical spatial
thinker needs to know how data are represented on maps and to have the ability to assess
the reliability and validity of data in spatial representations.
Bednarz, Acheson, and Bednarz (2006) emphasized the importance of critical
awareness regarding maps. As future citizens, students must foster critical spatial
thinking skills to interpret information, thus teaching these skills is crucial in education.
An increase in levels of carto-literacy must include explicit instruction about how to interrogate a map – to consider the conditions under which it was produced, whether it may portray a particular point of view, and what, if any, messages it conveys about power and perspective. We believe it is essential for students to develop a critical awareness and skepticism about maps as well as other graphics and images (Bednarz, Acheson, and Bednarz 2006, 404).
Goodchild and Janelle (2010) also stressed the significance of critical spatial
thinking, and pointed to the failure of the American education system to develop this
capability. Goodchild and Janelle (2010, 9) said:
We use the term critical in the sense of reflective, skeptical, or analytic, implying that the successful application of spatial perspectives can never be rote, but must always involve the mind of the researcher in an active questioning and examination of assumptions, techniques, and data if it is to meet the rigorous standards of good scholarship.
Students have not had appropriate education in critical spatial thinking skills, essential to
deal with spatial information and solve complex spatial problems (Goodchild and Janelle
2010). These are skills students require to critically evaluate spatial information in an
increasingly visual world (Bednarz, Acheson, and Bednarz 2006; Lund and Sinton 2007;
Sinton and Bednarz 2007).

47
In summary, critical spatial thinking emphasizes actively and deeply evaluating
data and information. Critical spatial thinkers do not passively accept information and
seek to consider multiple perspectives. The studies described above mostly unfold their
arguments through theoretical discussions without providing empirical evidence.
However, they at least provide insight into the conceptualization about critical spatial
thinking. At the same time, this situation indicates that it is necessary to conduct
empirical studies to test these conceptualizations. Therefore, this study identifies sub-
dimensions of critical spatial thinking based on prior suggestions and empirically
examines what role GIS can do to promote critical spatial thinking.
Expert-Novice Differences
Experts approach problems critically, focusing on their deep structure (Hmelo-
Silver and Nagarajan 2002; Lajoie 2003). A qualitative difference exists in the
representation of problems by experts and novices (Chi, Glaser, and Rees 1982; Hegarty
and Kozhenvnikov 1999; Kozhevnikov, Hegarty, and Mayer 2002; Ericsson 2003;
Stylianou and Silver 2004). Therefore, an expert-novice framework is useful in
investigating the development of expertise (Downs and Liben 1991; Ericsson and Smith
1991; National Research Council 2000; Huynh 2009). More specifically, Chi, Feltovich,
and Glaser (1981) reported that experts and novices sorted physics problems using
different categories because they grasped the problems differently. Experts employed
abstract physics principles to understand a problem, but novices were distracted by
superficial features, such as wording in a problem.

48
For experts, surface structures do not seem to be the basis for categorization. There is neither a similarity in the key words used in the problem statements nor in the visual appearance of diagrams for the problems. No similarity is apparent in the equations used for the problems grouped together by the majority of the experts. The similarity underlying the experts’ categorization can only be detected by a physicist. It appears that the experts classify according to the major physics principles (or fundamental laws) governing the solution of each problem (Chi, Glaser, and Rees 1982, 42).
A similar finding was reported by Audet and Abegg (1996). These researchers recruited
participants from three levels of expertise: high school students, teachers, and GIS
experts. Then, Audet and Abegg asked the participants to complete spatial tasks such as
preparing maps to show property ownership in a town. GIS was used as a tool to perform
these tasks. The researchers found that novices mostly focused on surface features of the
problems, while GIS experts understood “deep structures” of the problems. Only experts
grasped the relationship between data table and visual representation and used logical
querier to solve problems.
When the same problem-solving strategy is selected among various methods,
experts and novices use it differently. Kozhenvnikov, Hegarty, and Mayer (2002)
divided participants into two types based on cognitive style: verbalizers and visualizers.
This categorization denotes “individual preferences for attending to and processing
visual versus verbal information” (Jonassen and Grabowski 1993, 191). However,
Kozhenvnikov, Hegarty, and Mayer found that even in the same visualizer group,
students’ use of diagrams was different. When the participants were asked to solve a
problem regarding the motion of an object with graphs, students with high spatial ability
interpreted the graphs schematically, that is, these students understood the spatial

49
relationship the graph indicates. In contrast, novice visualizers only focused on the
superficial features of the graph, understanding it as pictures without grasping the
meaning of the graph. Sylianou and Silver (2004, 379-380) found differences in the use
of visual representation when experts and novice solve math problems.
We find that the most salient difference was not that experts used visual representations more frequently (although they did), but the richness of their use of visual representations. Experts were able to recognize meaningful patterns in the diagrams they constructed and to determine the utility of a diagram in solving a problem. Experts seemed to also have a rich structure of schemata associated with possible operations they could make on visual representations that guided them to making actual use of diagrams they constructed.
Anderson and Leinhardt (2002) explored how experts and novices use and
understand spatial representation differently. They investigated how these two groups
understand the shortest path between two points on a map produced through the
Mercator projection. The shortest distance in the Mercator projection is not shown as a
straight line. The researchers assessed whether participants correctly drew the shortest
path on maps. Anderson and Leinhardt found that geography professors performed the
tasks successfully and fast, but novices including undergraduate students and pre-service
teachers did not. Experts used a wide range of knowledge regarding spatial
representation, and furthermore, they knew how to extend it into different contexts.
In general, this research [studies regarding the different use of representations by experts and novices] has concluded that experts use representations as a tool to reason about real-life objects and events, whereas novices tend to reason within the representation itself and have more difficulty in moving back and forth between the representation and the real-world objects represented (Anderson and Leinhardt 2002, 284-285).

50
Expert-novice differences often cannot be revealed by simply explaining a final
result. Even when both experts and novices solved a problem correctly and reached the
same conclusion, their level of understanding and problem-solving processes can differ.
Lee and Bednarz (2005) reported that the same map can be produced through different
mapping strategies. Lee (2005) identified different mapping types and found that
students changed their mapping methods after exposure to a GIS course. Many GIS
students switched their map-drawing strategy from a regional method to a hierarchical
method that is indicative of higher-order thinking. Similarly, Hmelo-Silver and
Nagarajan (2002) reported that expert and novice medical groups arrived at similar
endpoints, but used different thinking processes. The experts incorporated a wider range
of knowledge and problem-solving strategies than the novice group. Therefore, to
explore students’ critical spatial thinking, thinking processes as well as end-points
should be investigated. This study adopted an interview strategy to examine students’
thinking processes in solving problems.
Factors Affecting Individual Differences in Spatial Literacy
Individual differences in spatial literacy have been studied mostly in relation to
spatial ability. Researchers have argued that spatial ability can be improved with
education, but some researchers found no noticeable improvement through training. The
situation becomes more complicated when considering gender and aptitude based on
academic major.

51
First, researchers tried to demonstrate that spatial ability can be developed
through guided instruction or training (e.g., Lord 1987; Ben-Chaim, Lappan, and
Houang 1988; Subrahmanyam and Greenfield 1994; Kali and Orion 1996; Saccuzzo et
al. 1996; Kali, Orion, and Mazor 1997; Orion, Ben-Chaim, and Kali 1997; Bosco,
Longoni, and Vecchi 2004; Wright et al. 2008; Titus and Horsman 2009). For example,
Titus and Horsman (2009) developed instructional materials for students to practice
spatial visualization skills. Only an experimental group used the developed materials
during one semester, and when students received this additional training, their scores in
tests that require visualization skills were significantly higher than those of a control
group who was not exposed to the materials. Based on this finding, Titus and Horsman
argued that differences in spatial ability among individuals are not “static,” meaning
improvement can be achieved through training. Wright et al. (2008) reported that
practices in spatial tests improved participants’ performance. The participants attended
daily practice sessions in which they practiced mental rotation or mental paper-folding
tasks. The sessions lasted about 15-20 minutes and took place over 21 consecutive days.
After completing the sessions, the participants’ post-test scores improved substantially.
The improvement was evident with new test items the participants did not encounter
during the practice. This finding suggests that the participants learned spatial reasoning
processes and that they were not simply familiar with specific test stimuli. These studies
demonstrated that spatial ability or skills can be improved through training or
instruction.

52
However, contrary to these findings, others reported that no improvement was
evident after spatial practice or education (Mendicino 1958; Ferrini-Mundy 1987). For
instance, Ferrini-Mundy (1987) developed six spatial-training modules involving spatial
visualization and orientation tasks and then implemented the modules to an experimental
group. However, after the intervention, there was no difference in spatial test scores
between the experimental and control groups. The main reason of this inconsistency may
be due to various training programs and/or different tests. Furthermore, most studies
used psychometric spatial tests that measured spatial reasoning on table-top scales, not
measuring spatial abilities on larger scales, such as wayfinding and spatial decision
making on geographic scales. Therefore, whether or not spatial ability can be developed
via training needs further research.
Gender is an important factor affecting spatial ability or behavior. However,
research findings regarding gender difference in spatial ability have been inconsistent
(Self et al. 1992; Self and Golledge 1994; Voyer, Voyer, and Bryden 1995; Lloyd 2003).
Many researchers found that males perform better on spatial ability tests (Battista 1990;
Masters and Sanders 1993; Collins and Kimura 1997; Nordvik and Amponsah 1998;
Colom, Quiroga, and Juan-Espinosa 1999; Halpern and LaMay 2000; Weiss et al. 2003),
however, other studies showed only small or no gender differences (Caplan,
MacPherson, and Tobin 1985; Kitchin 1996; McArthur 1996). Some researchers
indicated that different dimensions favor one or the other gender. More specifically,
males are better at tasks involving mental rotation while females perform better than
males on spatial memory tests (Kail, Carter, and Pellegrino 1979; Linn and Petersen

53
1985; Goldstein, Haldane, and Mitchell 1990; Silverman and Eals 1992; Montello et al.
1999; Ishikawa and Kastens 2005; Voyer et al. 2007). Montello et al. (1999)
administered a large number of psychometric and geographic tests to investigate gender
differences in spatial ability. These researchers contended that it is not appropriate to
state that one gender is generally superior to the other in spatial ability. According to
Montello et al., females outperformed males in a spatial memory test, and this finding is
consistent with prior studies. They also found that males did better on tests that measure
newly acquired knowledge of places from direct experience. Voyer et al. (2007) reported
better performance of females on spatial memory tests through a meta-analysis. Ishikawa
and Kastens (2005) discovered that on average males did better on mental rotation tests,
but they cautioned there are variations within each gender.
The effect of gender on the magnitude of improvement in spatial thinking skills
also has been variable in the literature. Some studies found that females improved more,
resulting in the reduction or elimination of the initial gender differences in spatial ability
test scores (Lord 1987; Saccuzzo et al. 1996; Hsi, Linn, and Bell 1997; Tzuriel and
Egozi 2010; Yang and Chen 2010). To be specific, Saccuzzo et al. (1996) administered
pre- and post-tests to measure spatial ability and found that men generally performed
better than women. However, women improved at significantly higher rates than men.
Tzuriel and Egozi (2010) reported that when students participated in a program to
improve skills for representation and transformation of visuospatial information, the
initial gender difference disappeared. However, others reported contrasting results. For
example, Rafi (2008) found that male participants who took part in a spatial

54
visualization training improved more than their female counterparts who were in the
same program. In addition, there are other findings indicating comparable improvement
in both genders (Smith and Schroeder 1981; Ben-Chaim, Lappan, and Houang 1988;
Clements et al. 1997). These studies reported that both genders benefitted from training,
but the rate of improvement was not different. In this case, initial gender differences do
not disappear.
In GIS learning, Vincent (2004) found no gender differences in spatial ability
tests after taking a GIS course. Qiu (2006) also reported that gender was not a factor that
made a difference in the performance of spatial ability tests. However, Lee (2005)
reported that males outperformed females before and after a GIS course. Nonetheless,
both genders benefited comparably from taking a GIS course because the magnitude of
improvement was not different for both genders. In contrast, Clark, Monk, and Yool
(2007) provided data in which females received higher grades in a GIS course. Even
though grades do not necessarily correlate with spatial ability, because the grades were
determined based on mid-term exam, final exam, and lab exercises in a GIS course,
which are likely to be related to spatial thinking (Lee 2005), the finding at least suggests
that males are not always superior to females in a spatial field. Thus, the literature does
not provide a conclusive direction regarding the magnitude of improvement by gender.
Therefore, it is necessary to conduct more empirical studies concerning how GIS
learning influences each gender in the development of spatial thinking skills (Self et al.
1992; Lee 2005; Qiu 2006).

55
Academic majors are also expected to play a role in spatial ability. Researchers
noted that academic performance is related to spatial performance in art, architecture,
and engineering (Smith 1964; Poole and Stanley 1972; Hsi, Linn, and Bell 1997);
mathematics (Bishop 1979, 1980; Mitchelmore 1980; Clements et al. 1997; Presmeg
2008); and science (Siemankowski and MacKnight 1971; Smith and Schroeder 1981;
Pallrand and Seeber 1984; Barke 1993; Lord and Rupert 1995; Orion, Ben-Chaim, and
Kali 1997). These studies indicate that spatial abilities are closely associated with
performance in their respective discipline. For example, Orion, Ben-Chaim, and Kali
(1997) considered students’ spatial-visualization ability as an important indicator of the
successful completion of a geology course. Hsi, Linn, and Bell (1997) found that spatial
reasoning was strongly related to students’ performance in an engineering course. In
contrast to these studies, Quaiser-Pohl and Lehmann (2002) did not find differences in
spatial ability depending on academic majors. Quaiser-Pohl and Lehmann recruited
students from various majors including arts, humanities and social sciences, sports,
psychology, and computational visualistics. These students took mental rotation tests,
and the result indicated that no differences existed in total mean scores depending on
majors.
Little research has been conducted if and how academic major plays a role in
GIS learning. The few exceptions include Vincent (2004) and Lee (2005). Specifically,
Vincent found no differences in spatial ability between majors. Lee reported that
differences were found in the scores of a spatial ability test among majors, but all
students benefited similarly from taking a GIS course.

56
In summary, research investigating the effects of training on spatial thinking has
been inconsistent. Furthermore, the influences of gender and academic majors
complicate the situation. Therefore, more research is required to examine how these
variables work in educational settings.
GIS Learning and Spatial Literacy
Researchers have argued that GIS can play a supporting role in enhancing spatial
literacy (National Research Council 2006). Albert and Golledge (1999) found that GIS
and spatial thinking can be connected in a productive manner. GIS activities such as
classifying spatial data, finding patterns, and analyzing spatial information are directly
related to spatial concepts and thinking skills (Lee 2005). An “obvious link” between
GIS functionality and spatial thinking skills was identified by Kidman and Palmer (2006,
290). Patterson (2007) postulated that GIS can unify various themes that are related to
spatial trends and elements. The following sections discuss how GIS learning can
contribute to the three components of spatial literacy.
GIS Learning and Spatial Habits of Mind
Few studies have investigated whether GIS learning improves students’ spatial
habits of mind. However, a few researchers have examined how GIS learning influences
students’ other dispositional aspects, such as self-efficacy, attitude, motivation, and
affinity. These studies are reviewed in the following discussion.
57
Some researchers explored how GIS learning affects self-efficacy. For instance,
Baker and White (2003) developed a test to measure self-efficacy toward science and
technology and investigated the effects of GIS learning on these traits. As a result, the
researchers found that GIS learning improved students’ self-efficacy in science. This
research deserves attention because it incorporated the concept of self-efficacy into GIS
education research. Songer (2010) compared the effects of a web-based GIS course with
traditional paper-pencil instruction and reported improved self-efficacy for the GIS
students. The self-efficacy measured in Songer’s study was more closely related to
spatial thinking than that of Baker and White because it emphasized map skills, such as
using maps to pose geographic inquiry and comparing maps to answer geographic
questions.
West (2003) connected the effects of GIS instruction to students’ attitudes. More
specifically, West compared participants’ attitudes before and after exposure to GIS-
associated activities, such as mapping a town’s land use. West found that the use of GIS
positively affected students’ perception of usefulness of computers and their perceived
ability to control computers. However, as the result indicates, students’ attitudinal
improvement was mostly related to computer-related aspects, not spatial-related traits.
Some scholars noted that the introduction of GIS into class enhanced students’
motivation in learning. For example, Milson and Curtis (2009) involved students in site
selection analyses using GIS. In this study, the students were asked to determine
candidate cities for a new business. They had to perform spatial analyses for site
selection and defend their decision. After observing students’ activities, Milson and

58
Curtis reported that students were enthusiastic about learning with GIS because GIS
activities provided them with authentic and discretionary learning opportunities. Aladağ
(2010) compared how GIS-based lesson materials and traditional learning methods (i.e.,
paper maps) affect students’ motivation differently. After teaching the same content
regarding population issues in Turkey with these two methods, Aladağ found that GIS-
based learning was more effective in increasing students’ motivation.
Finally, Huynh (2009) showed that affinity is related to the level of spatial
expertise. The researcher divided participants into three groups (novice, intermediate,
and expert) based on a geospatial test. Then, Huynh examined whether computer,
geography, and mathematics affinities are related to the level of expertise. According to
the result, the expert group scored higher than the other groups in the mathematics
affinity. This finding suggests that affinity is one factor associated with spatial expertise.
In sum, various dispositional aspects have been studied in relation to GIS
learning, and these studies mostly found positive effects of GIS learning on these traits.
However, few studies have explored spatial habits of mind in geography, even though
habits of mind have been found to be important in learning in other disciplines, such as
in mathematics (Cuoco, Goldenberg, and Mark 1996; Goldenberg 1996; Charbonneau et
al. 2009), science (Steinkuehler and Duncan 2008; Saleh and Khine 2009), history
(Lillich 1999), and arts (Winner et al. 2006). Educators from these disciplines have tried
to conceptualize what habits of mind are, what components underlie habits of mind, and
how to improve habits of mind. In the discipline of geography, however, little discussion
on what constitutes spatial habits of mind and how they can be developed and assessed
59
has occurred. To address this problem, this study identifies sub-dimensions of spatial
habits of mind and develops a test to measure those habits. Using the test, the effects of
GIS learning on spatial habits of mind are investigated.
GIS Learning and Spatial Concepts and Thinking Skills
Many studies pertaining to GIS in education have focused on whether GIS
learning enhances spatial concept understanding and spatial thinking skills. Researchers
have conducted studies with elementary, secondary, and higher education students.
These studies have provided evidence supporting the positive effects of GIS on students’
spatial literacy.
Researchers investigated whether GIS can be used effectively with elementary
students. Considering the cognitive level of elementary students, some researchers were
skeptical about the introduction of GIS into this level (Milson et al. 2005). However,
there are studies suggesting the benefits of GIS with this population. For example,
Keiper (1999) developed simplified GIS activities for fifth grade students and
demonstrated their usefulness. In Keiper’s study, students first were engaged in activities
to make them familiar with GIS interface and then worked on a project to select a
suitable site for a new park. Keiper discovered that when students participated in these
GIS-based activities, they developed essential geographic skills identified in the National
Geography Curriculum (Geography Education Standards Project 1994). Shin (2006) also
developed GIS instructional modules for elementary students and demonstrated that the
incorporation of GIS into a fourth grade class facilitated the development of students’

60
geographic content knowledge and map skills. Shin found that the technical aspects of
GIS were not a problem for both teachers and students. These studies suggest that GIS
can be used effectively with elementary students if the levels of activities are carefully
considered.
Table 3.The connection between spatial thinking skills and GIS.
Spatial Relations Processes Used in Cognitive Mapping and GIS
· Abilities (skills) that recognize spatial distribution and spatial patterns · Identifying shapes · Recalling and representing layouts · Connecting locations · Associating and correlating spatially distributed phenomena · Comprehending and using spatial hierarchies · Regionalizing · Comprehending distance decay and nearest neighbor effects in distribution (buffering) ·Wayfinding in real world frames of reference · Imagining maps from verbal descriptions · Sketch mapping · Comparing maps · Overlaying and dissolving maps (windowing)
· Constructing gradients and surfaces · Layering · Regionalizing · Decomposing · Aggregating · Correlating · Evaluating regularity or randomness · Associating · Assessing similarity · Forming hierarchies · Assessing proximity (requires knowing location) · Measuring distance · Measuring directions · Defining shapes · Defining patterns · Determining cluster · Determining dispersion
Source: Bednarz (2004,193).
Other scholars supported the potential of GIS as a pedagogical tool in secondary
education (Tinker 1992; Ramirez 1996; West 1999; Alibrandi 2002; Kerski 2003;

61
Milson et al. 2005; Alibrandi and Sarnoff 2006; National Research Council 2006;
Milson and Earle 2007; Hammond and Bodzin 2009). Bednarz (2004) illustrated how
spatial thinking skills can be connected to GIS (Table 3). This study provided a rationale
of how GIS can contribute to spatial learning. Other studies provided empirical evidence
regarding the benefits of GIS on students’ spatial thinking. For example, Wiegand
(2003) demonstrated that students improved their cartographic and geographic
understanding through GIS learning. Two groups of students (14-15 and 16-17 age
groups) studied variations in quality of life in Brazil. Wiegand analyzed students’
conversation while they made maps using GIS and found that students talked much
about cartographic strategies for quality maps and geographic concepts. Students were
not overwhelmed by the technical aspects of GIS. This research supports the assertion
that GIS can be a useful educational tool to foster spatial literacy, not falling into a pitfall
of “buttonology” (Marsh, Golledge, and Battersby 2007). Marsh, Golledge, and
Battersby warned that GIS could make students passively follow technical steps if
educators do not consider students’ level of spatial thinking. According to Patterson,
Reeve, and Page (2003), GIS and GPS training conducted through a partnership between
a local high school and university enhanced high school students’ geographic
understanding significantly. After the high school students were engaged in class
instruction (six hours) and hands-on experience using GIS and GPS (five hours), their
test scores on a geography exam exceeded those of university students who had not used
GIS and GPS. The exam tested fundamental spatial concepts and skills, including
absolute and relative location, physical features on earth, grid system to locate features,

62
drawing conclusions grounded on maps, using thematic maps, making generalizations
about human activities based on maps, and interpreting aerial photos and charts. This
finding demonstrates that geospatial technologies are beneficial in developing students’
spatial concepts and skills. Kolvoord (2008) described several successful projects in
which high school students used GIS to tackle local issues, such as sorting out the local
transportation network and exploring the local watershed. These students participated in
the “Geospatial Semester,” which is a cooperative program between a university and
local school districts. By participating in the GIS projects, students realized how real
world phenomena can be connected to GIS-based learning, with visualizing and
interpreting spatial patterns. Liu and Zhu (2008) noted that GIS is useful for spatial
thinking because it provides interactive learning environments. Liu and Zhu developed a
GIS-based educational module, World Explorer, focusing on geographic inquiry skills,
data organization, user interface, and multiple resource linkages. These researchers
showed that this interactive GIS module can enhance students’ spatial concepts and
thinking skills by enabling them to actively inquire about geographic topics and to
organize multiple spatial data. In summary, these previous studies demonstrate that GIS
has the potential as an instructional tool to develop students’ spatial thinking.
Considering the complexity of GIS software (especially desktop GIS), higher
education is the most appropriate level to infuse with a wide range of analytical power
and function of GIS. To be specific, Summerby-Murray (2001) applied GIS analyses to
the management of the heritage landscapes. In a one-semester course, students first
collected and arranged data, mapped and analyzed the data using GIS, and finally
63
recommended policies to enhance landscape management. During these processes,
students interpreted spatial patterns in maps and realized that landscape is socially
constructed, that is, elite landscape dominates and lower income classes are
underrepresented. Students’ learning was facilitated through inquiry-based learning in
which they formulated hypotheses and found answers based on spatial thinking.
Drennon (2005) showed how GIS can play an important role in solving a spatial
problem. GIS was used to analyze the effects of adding a new school district to a city.
Drennon’s study employed a real world scenario and demonstrated that GIS can be a
beneficial tool to promote students’ problem-solving skills. Students worked
collaboratively to predict the outcomes of various scenarios of placing a new geographic
boundary, and during this process, they needed to apply spatial-analytic skills to
interpret spatial patterns and interactions of spatial factors. Songer (2010) found that
using GIS in a geography course played an important role in improving students’
geographic knowledge concerning wide ranging topics (e.g., economic geography,
ethnicity and migration). The study by Lee and Bednarz (2009) represents a few
exceptions in which researchers developed a standardized spatial test including the
dimension of spatial relation, which had not been measured in psychometric tests. Using
a spatial test, Lee and Bednarz demonstrated that GIS learning enhanced students’
spatial thinking abilities, and GIS students’ spatial-skills test scores improved
significantly more than those who did not complete a GIS course.
Prior studies described above demonstrate that GIS is a beneficial tool for
enhancing spatial concept understanding and fostering spatial thinking skills. However,
64
not all researchers agree that GIS learning makes a significant difference in students’
spatial thinking (Albert and Golledge 1999; Abbott 2001). These researchers did not find
positive outcomes of GIS intervention. Thus, the question of whether GIS learning
promotes students’ informed use of spatial concepts and thinking skills requires more
empirically based research (Rutherford 2002; Baker and Bednarz 2003; Kerski 2003;
Tate, Jarvis, and Moore 2005; Qiu 2006). In particular, reliable and valid tests need to be
developed and employed to assess the effects of GIS on spatial thinking skills (Lee
2005; Milson et al. 2005; Lee and Bednarz 2009). For these reasons, the current study
develops a test measuring spatial concepts and thinking skills to examine the role of GIS
on spatial literacy. During test development, the reliability and validity of the test were
rigorously investigated.
GIS Learning and Critical Spatial Thinking
Researchers have indicated that GIS learning can develop students’ critical
spatial thinking (Patterson, Reeve, and Page 2003; Wigglesworth 2003; Liu and Zhu
2008). Recently, the emphasis on the relationship between GIS learning and critical
spatial thinking has grown (Duke and Kerski 2010; Gould 2010).
Some scholars noted that GIS can be a powerful tool to make students think
critically. Sinton and Bednarz (2007) supported this assertion. They discussed how GIS
can be used to enhance critical spatial thinking, using the strategies of categorizing and
interpreting, analyzing and evaluating, and making inferences. Tsou and Yanow (2010)
emphasized that GIS can be a useful method for general education because of the role it

65
can play in enhancing critical thinking and problem-solving skills. Sinton and Schultz
(2009, 69) argued that GIS can support the development of critical spatial thinking.
Geographic information systems (GIS) and mapping tools can be very effective in helping students develop critical-thinking and problem-solving skills. These technologies can also help students visualize data, evaluate hard-to-discern patterns, improve quantitative reasoning skills, and reach deeper level of learning, especially that which is related to spatial thinking and reasoning.
Furthermore, some researchers empirically demonstrated the potential of GIS as
an educational tool. For example, Liu et al. (2010) demonstrated that problem-based
learning with GIS enhanced students’ higher-order thinking, such as analytical and
evaluation skills. However, students who learned the same content without using GIS
only improved their recall of the information, which is a lower-order thinking skill. This
finding suggests that GIS provided students with opportunities to engage themselves in
higher-order critical thinking. Milson and Curtis (2009) reported that learning with GIS
was an effective way to foster students’ critical spatial thinking. These researchers asked
students to select a new business and find suitable places for the business using GIS.
Students had to determine criteria for decision-making, find data to support the criteria,
and defend their thinking processes. Students also had to justify their criteria, examine
available data to support their thinking, and critically evaluate whether there could be
additional data that could make their decision stronger. These activities with GIS
supported the development of critical spatial thinking. In the study by Summerby-
Murray (2001), students needed to map a heritage landscape using GIS. Due to the lack
of accuracies in the database, students had to identify whether the existing data matched
with the real landscape through fieldwork and needed to cross-check multiple sources to
66
confirm the reliability of the data when producing maps. In this process, students learned
how data play an important role in conducting sound research. Furthermore, they learned
scientific research procedures and evaluated limitations of their project. That is, these
students had opportunities to critically reflect on their problem-solving.
After receiving GIS instructions, students wrote in their self-reflected journal that
they believed their critical thinking skills had enhanced substantially (Read 2010).
Bryant (2010) investigated the benefits of a collaborative inquiry model for in-service
GIS education. According to Bryant, the model was helpful because it was developed
emphasizing the role of GIS in fostering critical thinking and applied problem-solving.
In summary, prior studies have indicated that GIS can play a role in developing
critical spatial thinking. When GIS was incorporated, students evaluated their thinking
processes, considered whether their data logically supported their argument or
explanation, and examined if there could be other ways to make their thinking stronger.
However, in spite of increasing interest in the potential of GIS for developing critical
spatial thinking, insufficient numbers of empirical studies have been conducted to
investigate the relationship between GIS learning and critical spatial thinking. Most
studies were suggestive or anecdotal, or were not based on empirical investigation.
Except for the study by Liu et al. (2010) described above, most studies were not
explicitly aimed at testing critical thinking with an established framework. However,
even Liu et al.’ research examined general critical thinking, not explicitly investigating
critical spatial thinking. Therefore, the issue of whether or not GIS learning can
contribute to enhancing critical spatial thinking requires further research (Hall-Wallace

67
and McAuliffe 2002). To address this problem, the current study defines characteristics
of critical spatial thinkers following the suggestion by the National Research Council
(2006) and empirically examines whether GIS learning enhances critical spatial thinking.
Trends in GIS Education Research
As the previous discussion indicated, many studies have added how
incorporating GIS affects students’ learning. This section discusses current trends and
uses of GIS in education.
First, GIS is no longer confined to geography education (Kawabata et al. 2010).
Geography educators have introduced GIS into teaching of natural hazards (Mitchell,
Borden, and Schmidtlein 2008), health issues (Rees and Silberman 2010), geosciences
(Hall-Wallace and McAuliffe 2002), social sciences (Peterson 2000; Hespanha,
Goodchild, and Janelle 2009), business (Shepherd 2009), and ecology (Willett and
Sanderson 2000; Jensen 2002). These researchers reported their experiences of
developing GIS education models and showed the effectiveness of the models in
students’ learning. In 1995, Sui (1995) contended that GIS education is one of the most
noticeable trends in geography education. Since then, GIS has become an important
factor in broadening the role of geography and spatial thinking. GIS can play a crucial
role in integrating a wide range of research fields. Oberle, Joseph, and May (2010)
reported how a GST (Geospatial Technologies)-based institute led by geographers
succeeded in integrating various research interests and enhancing graduate education.
The Carver Graduate Institute conducted workshops, a series of colloquiums, and

68
collaborative projects that focused on GST, especially GIS. Faculty members took
advantage of these learning opportunities and then mentored their graduate students with
the experience and knowledge acquired through the training. These activities facilitated
multidisciplinary research because the participating faculty members and students
recognized that GIS can integrate diverse topics and provide useful methodologies.
Geographers and the use of GIS played a central role in this project, and subsequently,
the value of geography was recognized and promoted in the university. In the fierce
competition among disciplines, GIS can provide opportunities for geography education
to secure its place in the curriculum. Therefore, research regarding the role GIS can do in
education is a research topic that deserves attention.
Second, research concerning the role of GIS in education requires more empirical
investigation. Downs (1994) claimed that geography education research, including GIS
education, needs more empirical data. The same call was posed by Baker and Bednarz
(2003) and Tate, Jarvis, and Moore (2005). In the late 1990s, researchers responded
these calls by conducting empirical research on the effects of GIS on students’ learning
(Huynh 2009). Since then, a wide range of empirical research has been conducted.
However, even today, researchers still point to the necessity of research concerning the
pedagogical role of GIS and feel the need to conduct empirical research to address this
issue (Lee and Bednarz 2009; Songer 2010; Nielsen, Oberle, and Sugumaran 2011).
However, recent research expands its interest into wider components related to spatial
literacy because most of previous research has focused on the cognitive aspect of GIS
learning. Among the three components of spatial literacy identified in this study, spatial

69
habits of mind and critical spatial thinking have received fewer attentions by researchers.
Therefore, further and wider empirical exploration regarding the pedagogical role of GIS
in various learning aspects should be performed. This research responds to this need.
Third, more researchers have begun to stress the development of critical spatial
thinking through GIS learning. As described in the previous section, scholars have
emphasized the power of GIS in fostering critical spatial thinking (Summerby-Murray
2001; Milson and Curtis 2009; Liu et al. 2010). The importance of developing critical
thinking is recognized by educators across disciplines (Case 2005; Gould 2010). Hence,
the emphasis on the critical thinking aspects of spatial literacy would support current
efforts to widen the role of geography or GIS into other areas or curricula (Tate, Jarvis,
and Moore 2005; Hespanha, Goodchild, and Janelle 2009; Sinton 2009; Tsou and
Yanow 2010). However, the lack of research explicitly showing the role of GIS in
promoting critical spatial thinking is a barrier in these efforts. When the benefits of GIS
in developing critical spatial thinking are demonstrated, it will be easier to persuade
stakeholders in education programs to incorporate GIS into their curricula. This study
can assist these efforts.
In summary, GIS in education has expanded its role into diverse topics and areas.
However, further empirical research concerning the pedagogical role of GIS in various
learning aspects using rigorous methodologies is necessary. This study attempts to
address these issues.

70
Relationships among Dispositional, Cognitive, and Critical Aspects of Learning
This study investigates dispositional, cognitive, and critical aspects of spatial
literacy. The relationships of these three components are of interest because their
relationships would show a big picture of how components of spatial literacy interact.
Depending on whether or not they are related, different educational strategies need to be
considered. The following explores previous studies discussing whether disposition,
cognition, and critical thinking are related.
First, some researchers explored relationships between disposition and cognition
in learning. More specifically, several researchers investigated the relationship between
affects and achievement in school. Rennie and Punch (1991, 193) defined affects as “the
complex of students’ attitudes and interests toward a school subject.” Bloom (1976)
reported that subject-related affects explained the achievement in that subject. Rennie
and Punch (1991) paid more specific attention to science-related affects and found a
positive relationship between affects and achievement in science. However, other
researchers who conducted a meta-analysis found no evidence of high associations
between disposition and performance in science (Fleming and Malone 1983; Wilson
1983). Therefore, research about the relationship between affects and cognitive
achievement has produced inconsistent results.
Researchers further investigated the relationship between other aspects of
disposition and cognition. For example, Greene et al. (2004) reported that self-efficacy,
meaningful strategy use, and achievements in English class are closely interrelated. This
finding suggests that a dispositional aspect such as self-efficacy plays an important role
71
in cognitive achievement. Preckel, Holling, and Vock (2006) reported positive
relationships between underachievement and various dispositional elements. These
authors administered surveys to measure several dispositions such as NFC (Need for
Cognition), achievement motivation, and conscientiousness. The NFC denotes one’s
“tendency to seek, engage in, and enjoy effortful cognitive activity” (Preckel, Holling,
and Vock 2006, 402); an example item includes “I really enjoy reading complicated
stories in novels.” Achievement motivation is defined as “striving to be competent in
effortful activities” (Schunk 2008, 465). The conscientiousness variable was measured
using items such as “I am not a person who acts according to a plan.” The participants’
achievement was determined based on general intellectual abilities and scholastic
achievement. After measuring these dispositional components, Preckel, Holling, and
Vock examined the relationship between these dispositional measures and
underachievement and found underachievers had lower levels of NFC, achievement
motivation, and conscientiousness. In GIS education research, Baker (2002) indicated
that GIS-based learning improved students’ science self-efficacy and attitudes toward
technology, and further facilitated the development of science process capabilities,
especially data analysis skills. However, Baker did not explicitly demonstrate the direct
relationship between self-efficacy and science process capabilities. In sum, prior studies
have suggested that dispositional and cognitive aspects of learning are likely to be
related, but some researchers did not find meaningful relationships. Moreover, few
studies explicitly investigated how spatial habits of mind and spatial concepts and skills
are interrelated.

72
Second, knowledge or cognitive ability can be related to critical thinking. One
cannot think critically without knowledge about the topic (Norris 1985; Ennis 1987).
Studies of expertise have reported that experts’ superior understanding and
representation of problems and advanced problem-solving result from their deep
knowledge and advanced thinking skills in their domains of expertise (Ericsson 2003).
For example, with the aid of deep domain knowledge, experts evaluate fundamental
structures of physics problems (Chi, Glaser, and Rees 1982) and critically interpret X
rays (Lesgold et al. 1988). Given the relationship between cognition and critical
thinking, people who possess critical thinking skills are expected to perform well on a
cognitive test. According to Williams et al. (2006), people with high critical thinking
skills scored high on a standardized test for dentists, that is, the National Board Dental
Hygiene Examination (NBDHE). More specifically, Williams et al. investigated if the
scores of California Critical Thinking Skills Test (CCTST) and the NBDHE are related.
These researchers found that CCTST performance was an accurate predictor of students'
performance on the NBDHE. That is, a critical thinking test and a knowledge-based
cognitive test were related. Contrary to these findings, Glaser (1985) indicated that a
student with a high score on a general mental ability test may score low on a critical
thinking test. In sum, prior studies suggested positive correlations between cognitive
ability and critical thinking, but there were studies that did not agree with this assertion
(Glaser 1985). Furthermore, research that empirically examines the relationships among
spatial knowledge, skills, and critical spatial thinking is lacking.

73
Finally, scholars have been interested in the relationship between critical thinking
and disposition. Some researchers believe that when discussing critical thinking skills,
critical thinking dispositions must be considered together (Perkins, Jay, and Tishman
1993; Facione and Facione 1996; Halpern 1999; Facione 2000). Empirical research has
indicated that relationships exist between critical thinking skills and critical thinking
dispositions. For example, Colucciello (1997) found a significant relationship between
these two traits. The participants in Colucciello’s study completed the CCTST and the
California Critical Thinking Disposition Inventory (CCTDI). The scores of these two
tests were positively correlated. Similar findings were reported in other studies (e.g.,
Giancarlo and Facione 1994). However, different researchers such as Albert and Albert
(2002) found no association with the same tests. Thus, the relationship between these
two aspects is unclear. Moreover, the dispositional aspects considered in prior studies
are mostly concerned with students’ critical thinking disposition, in other words, whether
or not one is disposed to think critically. This notion is narrower than the concept of
spatial habits of mind. Spatial habits of mind are one’s broader habits to employ spatial
perspectives. Therefore, further research is necessary to understand the relationship
between spatial habits of mind and critical thinking.
In conclusion, previous studies have provided evidence demonstrating positive
relationships among dispositional, cognitive, and critical aspects of learning. However,
other studies did not find evidence supporting the positive relationships. The lack of
empirical research regarding the relationship among components of spatial literacy is

74
even more serious. Virtually no study exists to examine the three components of spatial
literacy in this study simultaneously. This study attempts to address this missing point.
Summary
This chapter provided the background and context for the research question. The
three components of spatial literacy were identified and then discussed in relation to GIS
learning. Moreover, the current trends of GIS education research were investigated, and
finally, how the three elements of spatial literacy could be related was explored.
Since no consensus on the definition of spatial literacy exists (Caplan,
MacPherson, and Tobin 1985; Linn and Petersen 1985; Voyer, Voyer, and Bryden 1995;
Lloyd 2003; Black 2005; Schultz, Kerski, and Patterson 2008; Yang and Chen 2010),
this study adopts the definition of the National Research Council (2006), which includes
crucial aspects of learning, that is, dispositional, cognitive, and critical elements. The
first component is spatial habits of mind and was defined as internalized thinking
processes with spatial perspectives. Habits of mind have been found to be important in
learning in other disciplines, such as in mathematics (Cuoco, Goldenberg, and Mark
1996; Goldenberg 1996; Charbonneau et al. 2009), science (Steinkuehler and Duncan
2008; Saleh and Khine 2009), history (Lillich 1999), and arts (Winner et al. 2006).
However, few studies have explored spatial habits of mind in geography. The nature of
the second component (spatial concepts and thinking skills) was addressed by referring
to the discussion of the hierarchy of spatial concepts (Marsh, Golledge, and Battersby
2007; Golledge, Marsh, and Battersby 2008a, 2008b) and spatial thinking skills

75
(Golledge and Stimson 1997; Golledge 2002; Bednarz 2004; Gersmehl and Gersmehl
2006). Previous studies have measured spatial ability mostly from psychometric
perspectives, but researchers need to pay attention to spatial traits including spatial
relations that go beyond skills working on the table-top scale (Lee and Bednarz 2009).
The third component (critical spatial thinking) focuses on the spatial aspects of critical
reasoning. Critical spatial thinking emphasizes students’ critical and deep reasoning
processes required to solve spatial problems. Recently, scholars have increased their
interest in critical spatial thinking, but research that explicitly establishes a framework
for critical spatial thinking has been scant.
These three components of spatial literacy have been studied in relation to GIS
learning. Several researchers examined how GIS learning influences students’
dispositional aspects, such as self-efficacy (Baker and White 2003; Songer 2010),
attitudes (West 2003), motivation (Milson and Curtis 2009; Aladağ 2010), and affinity
(Huynh 2009). However, virtually no study examined how GIS learning affects spatial
habits of mind. Second, GIS learning has been found to be beneficial for enhancing
spatial concept understanding and developing spatial thinking skills (Hall-Wallace and
McAuliffe 2002; Drennon 2005; Carlson 2007; Lee and Bednarz 2009). Nonetheless,
there is the lack of empirical studies that measure students’ improvement of spatial
thinking using a reliable and valid standardized spatial test (Lee and Bednarz 2009).
Finally, researchers are increasing their interest in the potential of GIS learning on
improving critical spatial thinking (Summerby-Murray 2001; Milson and Curtis 2009;

76
Liu et al. 2010). However, few studies explicitly defined sub-dimensions of critical
spatial thinking and examined the effects of GIS learning on them.
In conclusion, there are missing points in the literature regarding specific
conceptualizations of the three components of spatial literacy. Therefore, these three
elements have not been systematically explored in relation to GIS learning. To address
these problems, this study identifies sub-dimensions of the three components of spatial
literacy and empirically investigates how completing a GIS course affects those three
components. Furthermore, the relationships among the three elements are explored.
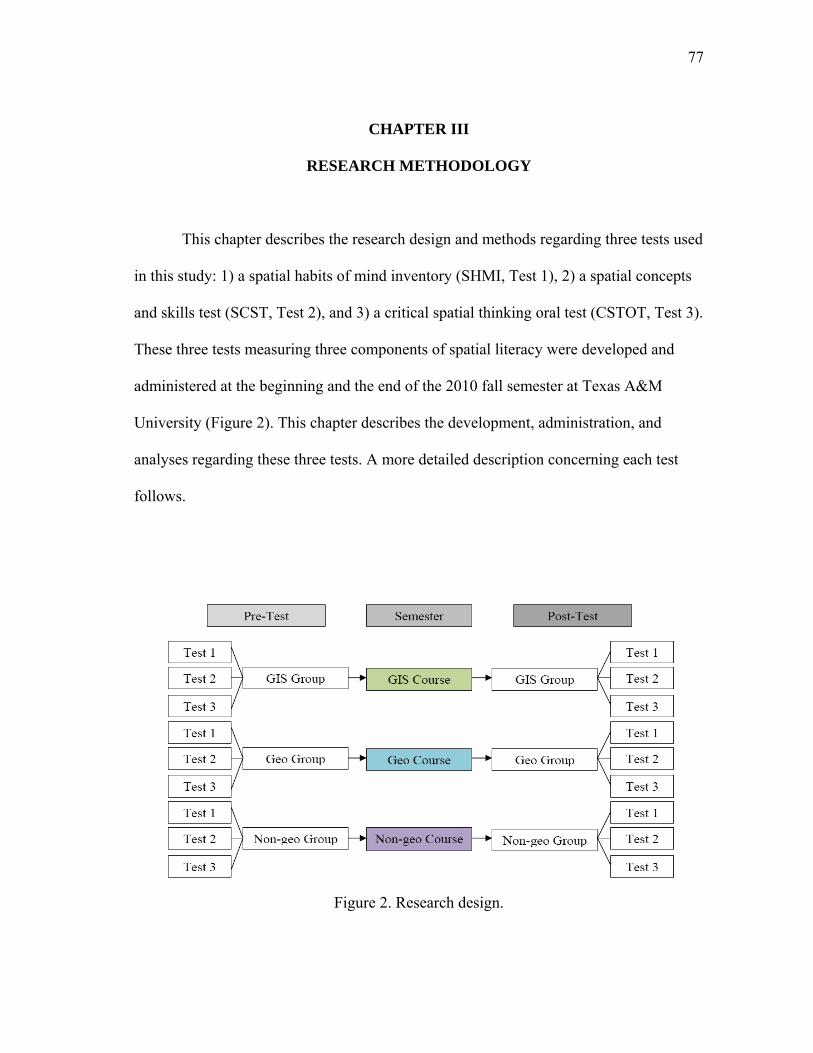
77
CHAPTER III
RESEARCH METHODOLOGY
This chapter describes the research design and methods regarding three tests used
in this study: 1) a spatial habits of mind inventory (SHMI, Test 1), 2) a spatial concepts
and skills test (SCST, Test 2), and 3) a critical spatial thinking oral test (CSTOT, Test 3).
These three tests measuring three components of spatial literacy were developed and
administered at the beginning and the end of the 2010 fall semester at Texas A&M
University (Figure 2). This chapter describes the development, administration, and
analyses regarding these three tests. A more detailed description concerning each test
follows.
Figure 2. Research design.

78
Experiment 1: Spatial Habits of Mind Inventory (SHMI)
An inventory was developed to examine whether the completion of a GIS course
affects students’ spatial habits of mind (the first component of spatial literacy). This
study identified five sub-dimensions of spatial habits of mind based on prior research
regarding habits of mind (Cuoco, Goldenberg, and Mark 1996). The five sub-dimensions
included pattern recognition, spatial description, visualization, spatial concept use, and
spatial tool use. The spatial habit of mind inventory (SHMI) is a test instrument that
assesses these five sub-dimensions by means of a Likert-scale survey composed of 28
items (APPENDIX A). Some items were adapted from the test instrument developed for
the project of Advancing Geospatial Skills in Science and Social Science (Bednarz and
Bednarz 2009). Demographic information such as gender, major, and prior GIS course
taking experiences was gathered on the first page of the SHMI. This section first
describes how the reliability and the validity of the SHMI were evaluated during test
development. Then, the participants of the experiment and test administration procedures
are discussed. Finally, how students’ performance was scored (the scoring rubric) and
analyzed is explained.
Reliability of the Inventory
When developing the SHMI, the reliability of the instrument was evaluated.
Reliability refers to how well a test measures something “consistently” (Oosterhof 1994;
Crocker and Algina 2008; Huck 2008). The reliability of the SHMI was tested using an
internal consistency estimate, Cronbach’s alpha (Crocker and Algina 2008). Internal

79
consistent reliability assesses the extent to which each test item measures a same thing
(Huck 2008). SPSS was used in computing Cronbach’s alpha.
Validity of the Inventory
The validity of the SHMI was also evaluated. Validity is concerned with whether
a test measures what it is supposed to measure “accurately” (Oosterhof 1994; Crocker
and Algina 2008; Huck 2008). This study evaluated construct validity and content
validity.
Construct validity refers to the degree to which an instrument assesses a
theoretical construct of a test (Huck 2008). Construct validity in this study was explored
using confirmatory factor analysis. Confirmatory factor analysis enables researchers to
confirm a model that was developed based on research or theory. This analysis can be
utilized to confirm whether a suggested theory-based model is adequately supported by
collected data (Bollen 1989; Brown 2006). Mplus was used in performing the
confirmatory factor analysis.
Content validity assesses whether a developed test collectively covers what it
intends to cover (Huck 2008). Content validity was investigated through reviews of the
inventory by undergraduate students and spatial thinking experts. Twenty-three
undergraduate students reviewed a draft inventory and provided their opinions regarding
wording and content. Similar procedures were performed with two graduate students in
the Department of Geography at Texas A&M University. In addition, two other graduate
students whose major research interest lies in spatial thinking reviewed the inventory,
80
and discussions were conducted to determine whether each item appropriately measures
spatial habits of mind. All the comments from these procedures were incorporated in the
SHMI. Finally, four professors in the dissertation committee provided comments about
the inventory and revisions were made.
Participants
In order to investigate whether completing a GIS course affects students’ spatial
habits of mind, participants were recruited at the beginning and the end of the 2010 fall
semester from students enrolled in Principles of GIS, Economic Geography, Child
Development for Educators, and Creative Problem Solving. In total, 168 students
finished both pre- and post-tests (Table 4).
Participants were grouped into three types: 1) an experimental group (GIS group)
– students taking an introductory GIS course (Principles of GIS). This group was
exposed to various spatial concepts and spatial analyses using GIS; 2) a control group 1
(Geography group) – students taking a geography course (Economic Geography). This
group learned geography-related content, but not GIS; and 3) a control group 2 (Non-
geography-related group, Education group) – students taking a non-geography course
(two education courses taught by the same professor: Child Development for Educators
and Creative Problem Solving). This group was not exposed to GIS or geography-related
content. Students who had taken a GIS course were excluded from the analyses. When
students are mentioned as GIS students in this study, it denotes those students enrolled in

81
the GIS course. In the same manner, geography and education students denote those
enrolled in the geography and education courses discussed above.
Table 4. Participating groups (Experiment 1). Group (n = 168) Group description Experimental group (n = 41) Students who completed a GIS course. Control Groups
Geography (n = 43) Students who completed an Economic Geography course.
Education (n = 84) Students who completed an Education course.
Principles of GIS consists of two lectures and one lab per week. The lectures
introduce fundamental principles and concepts related to spatial science and GIS. The
lab sessions give students hands-on experience using GIS software covering various
aspects of GIS functionality, such as database development and management, map
projection, spatial analysis, and cartographic visualization. The educational settings of
the GIS course in this study represent one of the most typical environments found across
the US universities. For example, the textbook in this course, GIS Fundamentals
authored by Bolstad (2008), is one of the most widely selected textbooks in the US GIS
courses (Vincent 2010; Jo et al. in press). In addition, the course content, the
components of the course (combination of lectures and labs), and the course grading
scheme (exams worth 50 percent and lab assignments worth 50 percent) are also typical
of GIS courses offered in US higher education settings (Jo et al. in press).

82
Economic Geography introduces foundational concepts in economic geography,
including the location of economic activities, the distribution of agriculture,
manufacturing, tertiary activities and transportation, and the economic growth of areas.
The course was lecture-based.
Two education courses taught by the same professor, Child Development for
Educators and Creative Problem Solving, are lecture-based education courses. Child
Development for Educators discusses research about and theory of child development,
such as the Piagetian theory, intelligence and individual difference in cognition, gender
and development, emotional and moral development, etc. Creative Problem Solving
investigates the historical background and application of the framework and tools of
creative problem solving processes.
Because students were not randomly recruited, a quasi-experimental method
(Shadish, Cook, and Campbell 2002) was employed to investigate the effects of taking a
GIS course (independent variable) on scores of spatial habits of mind (dependent
variable).
Test Administration
After recruiting participants from the three groups described above, students
were provided with the inventory individually and given as much time as they needed to
complete the test. APPENDIX A shows test items used in this study. Pre- and post-tests
were composed of the same questions. In order to minimize memorization effects, the
order of item presentation in pre- and post-tests was randomly mixed. After the pre-test,

83
no feedback was provided to participants. Extra credit was awarded to all when they
completed both pre- and post-tests.
Scoring and Analysis
After students completed both pre- and post-tests, their scores were recorded and
analyzed. More specifically, the items were scored following the rule in Table 5. If a
statement was worded positively, 1 point was given to “strongly disagree” and 5 points
to “strongly agree.” If a statement was worded negatively, the scoring was reversed, with
“strongly agree” given 1 point and “strongly disagree” awarded 5 points. There were 28
items in the inventory, thus, the highest possible score was 140.
Table 5. Point values for positive and negative items. Positive items Negative items Strongly agree 5 1 Agree 4 2 Undecided 3 3 Disagree 2 4 Strongly disagree 1 5
To investigate the effects of the GIS course on spatial habits of mind, the average
score of each participating group was analyzed using analysis of variance (ANOVA),
analysis of covariance (ANCOVA), and independent and paired sample t-tests. The
alpha level of .05 was applied to determine whether statistically significant differences
exist among groups. Once a statistically significant difference was detected, post hoc

84
comparisons (Tukey or Bonferroni methods) were conducted to identify where the
difference originated.
In addition, effect size estimates were calculated to investigate the magnitude of
differences in group means or variability. An effect size estimate is “a statistic
quantifying the extent to which sample statistics diverge from the null hypothesis”
(Thompson 2006, 187). Effect size measures are useful because they are not influenced
by sample size and provide information regarding the magnitude of differences
(Thompson 2002; Olejnik and Algina 2003). The degree of effect size provides a
criterion to judge practical significance of an intervention. Recently, many academic
journals explicitly require that effect size should be reported whenever quantitative
analyses are performed (Schmidt 1996; Wilkinson and Task Force on Statistical
Inference 1999; Thompson 2006). This study reports Cohen’s d and eta-squared
statistics. Cohen’s d is calculated as the difference in means between two groups divided
by the pooled standard deviation of the two groups. Eta-squared is the ratio between
SOSbetween and SOStotal (SOS: Sum of Squares). In general, Cohen’s d is used to compare
mean differences. Eta-squared estimate is employed when an omnibus F test is
conducted (Thompson 2006; Huck 2008; Howell 2010). Whether a computed effect size
is large enough to denote practical significance should be determined depending on the
context of research (Leech, Barrett, and Morgan 2008). In other words, the practical
significance of a study should be based on reported effect size values in related research
(Thompson 2006; Howell 2010). However, the report of effect size has not been a
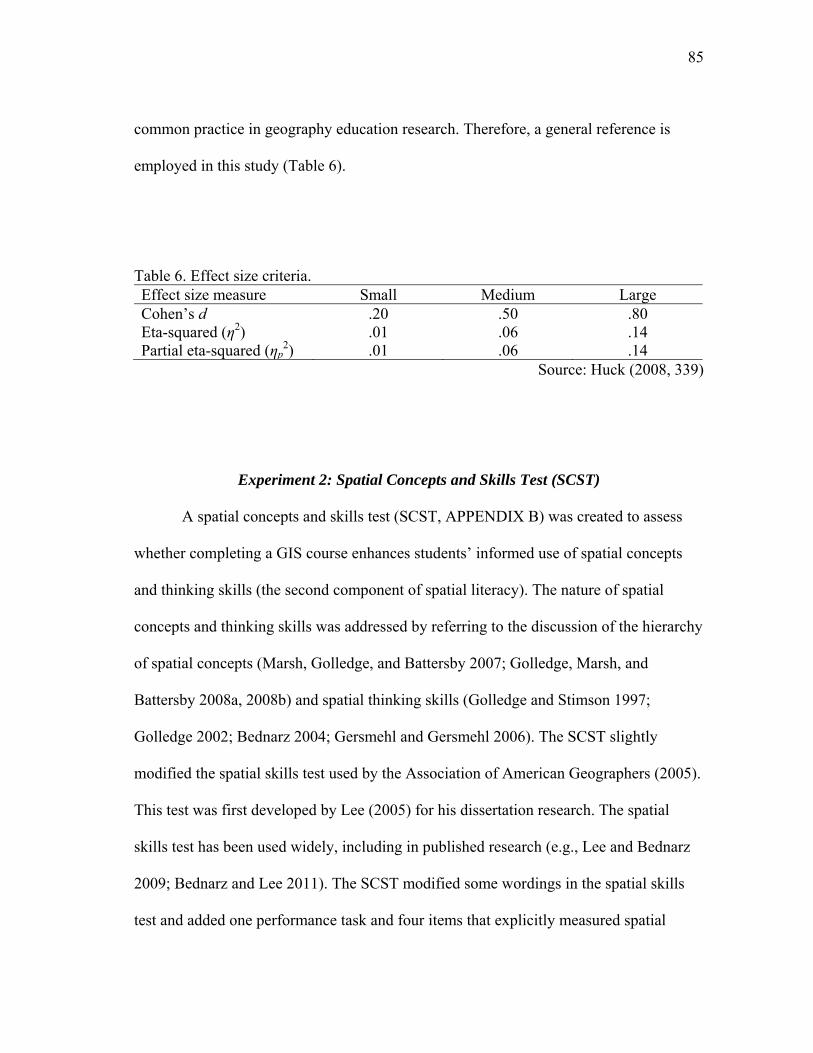
85
common practice in geography education research. Therefore, a general reference is
employed in this study (Table 6).
Table 6. Effect size criteria. Effect size measure Small Medium Large Cohen’s d .20 .50 .80 Eta-squared (η2) .01 .06 .14 Partial eta-squared (ηp
2) .01 .06 .14 Source: Huck (2008, 339)
Experiment 2: Spatial Concepts and Skills Test (SCST)
A spatial concepts and skills test (SCST, APPENDIX B) was created to assess
whether completing a GIS course enhances students’ informed use of spatial concepts
and thinking skills (the second component of spatial literacy). The nature of spatial
concepts and thinking skills was addressed by referring to the discussion of the hierarchy
of spatial concepts (Marsh, Golledge, and Battersby 2007; Golledge, Marsh, and
Battersby 2008a, 2008b) and spatial thinking skills (Golledge and Stimson 1997;
Golledge 2002; Bednarz 2004; Gersmehl and Gersmehl 2006). The SCST slightly
modified the spatial skills test used by the Association of American Geographers (2005).
This test was first developed by Lee (2005) for his dissertation research. The spatial
skills test has been used widely, including in published research (e.g., Lee and Bednarz
2009; Bednarz and Lee 2011). The SCST modified some wordings in the spatial skills
test and added one performance task and four items that explicitly measured spatial

86
concepts. This section first reports how the reliability and the validity of the SCST were
tested. Then, the items in the SCST are described in more detail. Next, the participants
and test administration are described. Finally, scoring and analysis of students’
performance are reported.
Reliability of the Spatial Concepts and Skills Test
This study evaluated the reliability of the SCST to confirm whether the test
consistently measures students’ spatial concept understanding and thinking skills.
Similar to the SHMI, the reliability of the SCST was explored by computing Cronbach’s
alpha. As for both pre- and post-test data, Cronbach’s reliability estimates were
calculated using SPSS.
Validity of the Spatial Concepts and Skills Test
The content validity of the SCST was evaluated. To establish content validity,
experts in spatial thinking reviewed the test. First, two graduate students who study
spatial thinking reviewed the test and provided comments. Then, an expert panel
composed of three geography professors and one graduate student examined the SCST
and verified it. Finally, the dissertation committee of this study assessed the validity of
the test and their comments were incorporated.
87
Test Descriptions
The SCST is a test instrument that measures spatial ability regarding spatial
relations (Lee 2005). The SCST was composed of 21 items, containing one performance
task and 20 multiple choice problems. The SCST included 11 types of test items: 1)
understanding and applying spatial concepts; 2) overlaying and dissolving maps; 3)
selecting the best location using spatial information; 4) constructing a contour map from
elevation data points; 5) associating and correlating spatially distributed phenomena; 6)
orienting to a real-world frame of reference; 7) creating a 3D profile from a map; 8)
imagining a scene from different perspectives or points of view; 9) representing real-
world features using appropriate spatial data types; 10) creating a graph from mapped
data; and 11) identifying the graph that shows an appropriate correlation of mapped data.
A more specific description of the types is presented in Table 7. Since many of the SCST
problems were adapted from the spatial skills test (Association of American
Geographers 2005), Table 7 is similar to the item specification found in Lee and Bednarz
(2009).

88
Table 7. Types of problems in the SCST.
Type Type descriptions and related spatial thinking components Related item(s)
1
Type #1 questions tested whether the participants understand spatial concepts. The question required the participants to select the most appropriate or least likely spatial concepts for given figures or data. This type of question is necessary because knowledge of key spatial concepts is the building block for enhanced spatial thinking (National Research Council 2006; Golledge, Marsh, and Battersby 2008a). The selected concepts were those argued by researchers as important in spatial thinking: diffusion (Gersmehl and Gersmehl 2006), interpolation (Golledge 2002; Golledge, Marsh, and Battersby 2008a), buffer (Golledge, Marsh, and Battersby 2008a), and scale (Golledge, Marsh, and Battersby 2008a).
1, 3, 5, 19
2 Type #2 questions asked participants to visually identify and overlay different map layers to select an appropriate layer. The map overlay function is a “fundamental GIS operation which requires spatial cognitive abilities to mentally visualize and manipulate spatial objects” (Albert and Golledge 1999).
8, 9, 10, 11
3
Type #3 questions required the participants to find the best location for a flood management facility using spatial information such as land use, elevation, and distance from an electric line. This question type evaluates similar abilities as Type #2, but applies the logic to real-world situations, in contrast to the abstract characteristics of Type #2 problems. The underlying rationale of Type #2 and #3 is the Boolean logic (Lee and Bednarz 2009). Types #2 and #3 are based on the skills of “overlying and dissolving maps” (Golledge and Stimson 1997; Golledge 2002; Bednarz 2004).
18
4
Type #4 questions required participants to complete a contour map using elevation data and a pre-determined contour interval. Students needed to “interpolate” un-sampled points. This type corresponds to the ability of “associating and estimating spatially distributed phenomena” (Golledge and Stimson 1997; Bednarz 2004), “discerning spatial patterns” (Gersmehl and Gersmehl 2006), and “comprehending spatial closure” (Golledge 2002).
4
5
Type #5 questions asked participants to judge spatial correlations between and among sets of maps. Students are frequently involved in cognitive processes of finding spatial relationships among several information sets. This type evaluates “recognizing spatial patterns,” “associating and correlating spatially distributed phenomena” (Golledge and Stimson 1997; Golledge 2002; Bednarz 2004), and “assessing a spatial association” (Gersmehl and Gersmehl 2006).
16
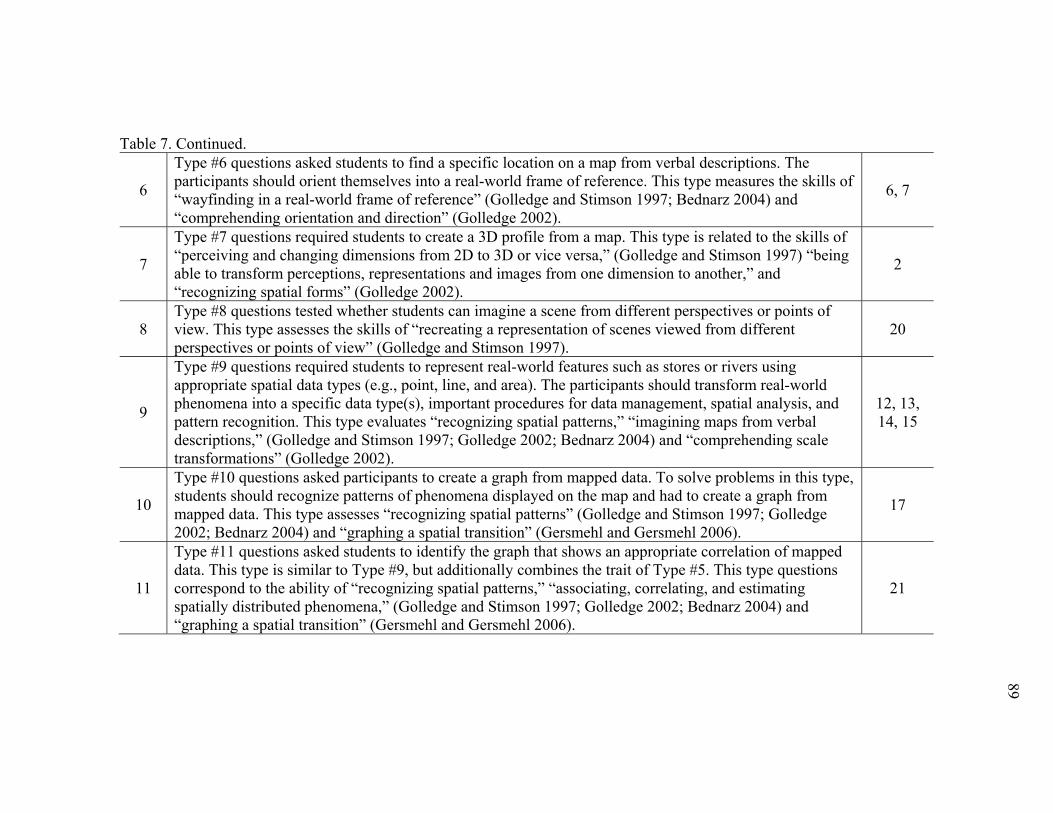
89
Table 7. Continued.
6
Type #6 questions asked students to find a specific location on a map from verbal descriptions. The participants should orient themselves into a real-world frame of reference. This type measures the skills of “wayfinding in a real-world frame of reference” (Golledge and Stimson 1997; Bednarz 2004) and “comprehending orientation and direction” (Golledge 2002).
6, 7
7
Type #7 questions required students to create a 3D profile from a map. This type is related to the skills of “perceiving and changing dimensions from 2D to 3D or vice versa,” (Golledge and Stimson 1997) “being able to transform perceptions, representations and images from one dimension to another,” and “recognizing spatial forms” (Golledge 2002).
2
8 Type #8 questions tested whether students can imagine a scene from different perspectives or points of view. This type assesses the skills of “recreating a representation of scenes viewed from different perspectives or points of view” (Golledge and Stimson 1997).
20
9
Type #9 questions required students to represent real-world features such as stores or rivers using appropriate spatial data types (e.g., point, line, and area). The participants should transform real-world phenomena into a specific data type(s), important procedures for data management, spatial analysis, and pattern recognition. This type evaluates “recognizing spatial patterns,” “imagining maps from verbal descriptions,” (Golledge and Stimson 1997; Golledge 2002; Bednarz 2004) and “comprehending scale transformations” (Golledge 2002).
12, 13, 14, 15
10
Type #10 questions asked participants to create a graph from mapped data. To solve problems in this type, students should recognize patterns of phenomena displayed on the map and had to create a graph from mapped data. This type assesses “recognizing spatial patterns” (Golledge and Stimson 1997; Golledge 2002; Bednarz 2004) and “graphing a spatial transition” (Gersmehl and Gersmehl 2006).
17
11
Type #11 questions asked students to identify the graph that shows an appropriate correlation of mapped data. This type is similar to Type #9, but additionally combines the trait of Type #5. This type questions correspond to the ability of “recognizing spatial patterns,” “associating, correlating, and estimating spatially distributed phenomena,” (Golledge and Stimson 1997; Golledge 2002; Bednarz 2004) and “graphing a spatial transition” (Gersmehl and Gersmehl 2006).
21
90
Participants
To examine how taking a GIS course affects students’ use and understanding of
spatial concepts and thinking skills, participants were recruited from the same student
pool as in the first experiment. As previously described, three groups took part in this
research. A total of 171 students completed both pre- and pot-tests.
Test Administration
The three groups finished pre- and post-tests at the beginning and end of the
2010 fall semester. Students were given as much time as needed to complete the SCST.
On average, it took 20 minutes for students to complete the test. After the pre-test, no
feedback was given to the participants. Participants received extra credit of the course
they attended if they completed both pre- and post-tests, regardless of improvement from
the pre-test to post-test or demonstrated knowledge. The pre- and post-tests consisted of
slightly different test items measuring the same trait.
Scoring and Analysis
Participants’ performance was evaluated based on the total number of problems
they answered correctly. Each correct answer is worth 1 point, therefore, the possible
highest score is 21. As with Test 1, group scores were compared using ANOVA,
ANCOVA, and independent and paired sample t-tests. When statistically significant
differences existed, post hoc contrasts (Tukey or Bonferroni methods) were used to find
a specific point of the difference. Effect size estimates were also computed.
91
Experiment 3: Critical Spatial Thinking Oral Test (CSTOT)
A critical spatial thinking test was developed to examine whether students’
approach to spatial thinking (the third component of spatial literacy) changed after
completing a GIS course. Critical thinking often cannot be adequately measured using a
standardized multiple-choice test (Keeley and Browne 1986; Norris 1988, 1989; Beier,
Campbell, and Crook 2010). Hence, the CSTOT consisted of an interview-type oral test.
The test employed a “think aloud method” that enables researchers to investigate
participants’ underlying thinking and reasoning processes (Wade 1990; Audet and
Abegg 1996). To explore different approaches used by experts and novices, interview
methods have been employed frequently.
Studies on expertise look at what experts know and what strategies they use, highlighting features that distinguish expert from novice behavior, especially qualitative differences that are not otherwise obvious (Stylianou and Silver 2004, 357).
This section begins with test descriptions concerning the CSTOT. This part
reports the rationale for and procedures of the development of the CSTOT. Then,
participants are depicted. The following section introduces interview procedures.
Because the CSTOT is a semi-structured interview, this section describes specific
interview questions employed in the CSTOT. After all the interviews were completed,
they were evaluated both quantitatively and qualitatively. Hence, following the interview
procedures, how the interviews were analyzed is discussed. Finally, the reliability study
describing the procedures for establishing inter-rater reliability is reported.
92
Test Descriptions
The CSTOT employed three problems from the SCST to investigate students’
thinking processes more deeply (APPENDIX C). Selecting a few items from a multiple-
choice test is a good strategy to probe test takers’ critical thinking (Norris 1988). The
CSTOT was created as a semi-structured interview test. In other words, the interviewer
had questions in mind, but interviews unfolded flexibly, depending on participants’
responses. The rationale for the composition of the CSTOT was the characteristics of a
critical spatial thinker suggested by the National Research Council (2006). A critical
spatial thinker 1) assesses the quality of spatial data in terms of accuracy and reliability
based on the data source; 2) uses a spatial rationale as a way of thinking to construct,
articulate, and defend a line of reasoning in solving problems and answering questions;
and 3) evaluates the validity of arguments or explanations based on spatial information.
In other words, a critical spatial thinker considers:
1) Data reliability (e.g., depending on data sources or data collection procedures,
the accuracy or reliability of the data can be differentiated);
2) Spatial reasoning (e.g., appropriate problem-solving strategies need to be
incorporated according to problem contexts), and
3) Problem-solving validity (e.g., results of problem-solving can be different or
compromised depending on adopted data or methods).
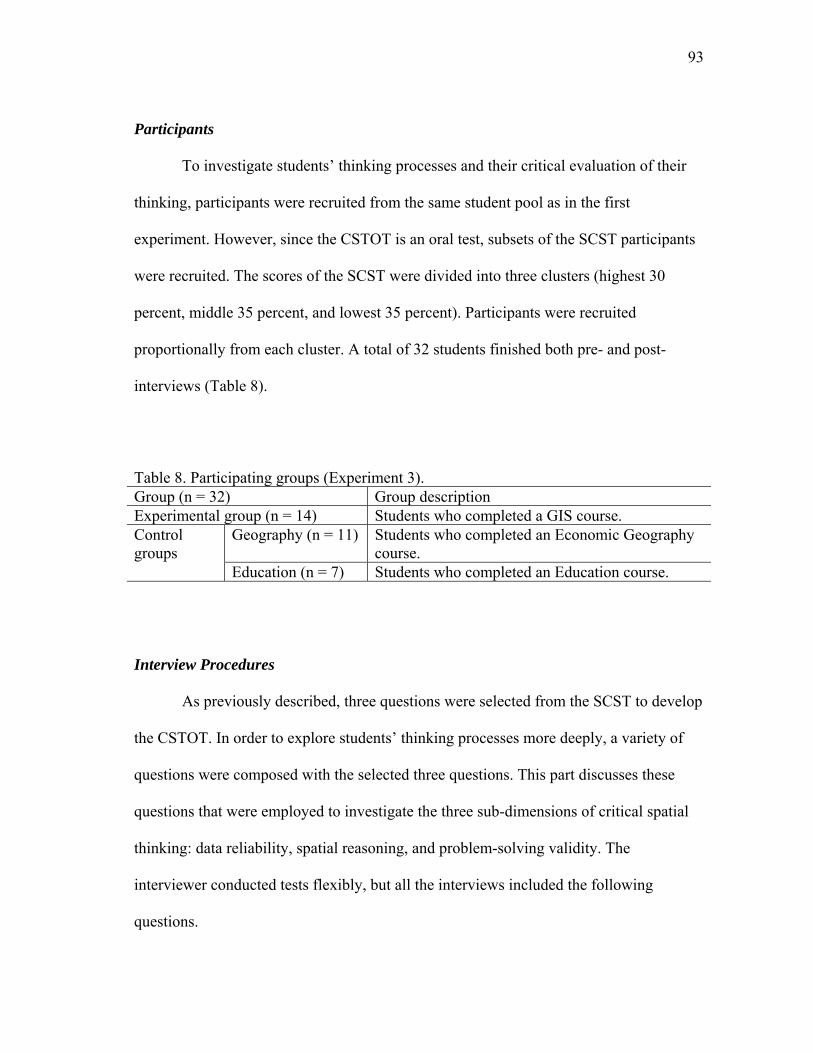
93
Participants
To investigate students’ thinking processes and their critical evaluation of their
thinking, participants were recruited from the same student pool as in the first
experiment. However, since the CSTOT is an oral test, subsets of the SCST participants
were recruited. The scores of the SCST were divided into three clusters (highest 30
percent, middle 35 percent, and lowest 35 percent). Participants were recruited
proportionally from each cluster. A total of 32 students finished both pre- and post-
interviews (Table 8).
Table 8. Participating groups (Experiment 3). Group (n = 32) Group description Experimental group (n = 14) Students who completed a GIS course. Control groups
Geography (n = 11) Students who completed an Economic Geography course.
Education (n = 7) Students who completed an Education course.
Interview Procedures
As previously described, three questions were selected from the SCST to develop
the CSTOT. In order to explore students’ thinking processes more deeply, a variety of
questions were composed with the selected three questions. This part discusses these
questions that were employed to investigate the three sub-dimensions of critical spatial
thinking: data reliability, spatial reasoning, and problem-solving validity. The
interviewer conducted tests flexibly, but all the interviews included the following
questions.
94
Critical Question 1
Critical Question 1 tested whether students can complete a contour map using an
elevation dataset, employing the concept of spatial interpolation. The following
questions were used in the interviews.
1) Data reliability: Where do you think the data on the map were collected? Who
do you think collects this kind of data? Do you think the data are accurate or reliable?
What kinds of methods can be used to collect data? If you need to use this kind of
elevation data for your class project or other purpose, you can collect data from various
sources, such as books, documents, online, and so on. In this case, what would be your
criterion to judge that this dataset is reliable or credible? Can you think of any reliable or
credible data sources?
These questions aimed to explore whether students could consider the reliability
of data in a problem. For example, data reliability can be established by triangulation.
That is, if the accuracy of a dataset is confirmed by several sources, the dataset can be
considered to be reliable. In addition, students could conceptually state reliable data
sources, such as government agencies, university-providing data, peer-reviewed journal,
etc. Students could also list specific data sources, such as USGS (U.S. Geological
Survey) for elevation data. Considering that many data on the Internet are not reliable, a
critical thinker should judge the credibility of data sources (Halpern 1999; Schrock
2007; Markwell and Brooks 2008; Kissling 2011). In addition, if students describe how
data were collected from a perspective of reliable data collection procedures, those
95
descriptions could be another indication of their critical spatial thinking regarding data
reliability.
2) Spatial reasoning: What reasoning processes did you use when solving this
problem? Can you describe your thinking processes? What kind of underlying logic was
the basis of your problem-solving?
These questions probed whether students have logical thinking processes
concerning spatial interpolation. When students are required to draw a contour line of
20, given the data points of 17 and 23, they should make an educated guess using these
two points.
3) Problem-solving validity: Do you think your problem-solving was valid?
What sort of method can make your problem-solving more accurate? That is, do you
have any ideas to improve your contour line drawing? Can you imagine a situation in
which the constructed map would not accurately show the real topography? Do you have
any ideas regarding the relationship between contour interval and map accuracy?
These questions investigated whether students recognize issues related to the
validity of their problem-solving. For example, even though spatial interpolation is a
reasonable technique to estimate data values of un-sampled locations, the result can be
distorted if there is a dramatic change in relief at a specific point. More data points
would enhance the accuracy of a contour map. Moreover, the problem uses a unit of 10
as an interval, but changing the interval can produce a different map. Generally
speaking, the smaller the interval, the more accurate a map would be. However, the

96
selection of a contour interval should consider various factors, such as purposes of a
map, relief of a region depicted, etc. Students were expected to consider these issues.
Critical Question 2
Critical Question 2 required students to synthesize spatial information to select a
suitable location for a flood management facility. The interviews incorporated the
following questions.
1) Data reliability: Similar questions were asked for data sources and their
reliability as in Critical Question 1. However, students could answer differently for
methods of data collection or data sources because in Critical Question 2, other data such
as land use and distance from an electric line were used.
2) Spatial reasoning: Similar questions as in Critical Question 1 were employed
to analyze spatial reasoning processes. Students’ answers, however, should be focused
on how spatial information can be effectively combined to make a reasonable decision
using strategies such as spatial map overlay. Furthermore, students could suggest more
effective methods of data presentation or problem-solving. For example, the three maps
in the problem could be combined into one map using geospatial technologies such as
GIS.
3) Problem-solving validity: Similar questions as in Critical Question 1 were
incorporated. Questions included the following. Do you believe your problem-solving
method was valid? To what extent do you think the map in the problem accurately
represents real-world situations? Can you imagine a situation in which the data or maps

97
were distorted? In addition, the interviewer encouraged students to contemplate whether
the conditions in the problem are sufficient to make a reasonable decision (e.g., do other
conditions need to be considered? if you are asked to conduct this project, do you have
any other important factors to consider?), or whether the criteria are reasonable (e.g., are
the criteria such as 60 feet from an electric line justifiable?).
Critical Question 2 presented three maps for problem-solving. Even if data used
for the maps are exact, map production processes, including data classification, can
produce distortions. For example, the “land use” map classifies the land into four types,
but land use types in the real-world can be more complex. Moreover, students need to
consider why the three conditions in the problem (land use, elevation, and distance from
an existing electric line) are important for selecting a location of a flood management
facility. Students could justify how and why these three criteria are important, and
further could suggest other factors that would be significant for spatial decision-making.
These questions asked students to critically evaluate the problem conditions and
contexts.
Critical Question 3
Critical Question 3 asked participants to recognize spatial patterns and then
to create a graph from mapped data. Interviews were based on the following questions.
1) Data reliability: Similar interviews were conducted in terms of data sources
and their reliability as for Critical Questions 1 and 2. However, students might state

98
different strategies for data collection procedures or data sources because different types
of data were used.
2) Spatial reasoning: Interview questions for this dimension were comparable to
those in Critical Questions 1 and 2. However, Critical Question 3 investigated whether
participants properly interpreted the map patterns and whether they could create a graph
from mapped data. Thus, students had to recognize that the phenomena displayed on the
two maps were inversely related, and then be able to draw a graph of that negative
correlation. Students might elaborate on their problem-solving using the titles of the two
maps, that is, education level and income (e.g., the more the less educated people reside
in a county, the less the income level would be; thus, the two phenomena are inversely
correlated).
3) Problem-solving validity: To investigate students’ thinking about their
problem-solving validity, the following questions were posed to students. Do you think
your problem-solving method was valid? Do the maps in the problem accurately
represent real world situations? Can you imagine a situation where real world
phenomena are not accurately represented by these maps? By choosing one graph
regarding the relationship between the two phenomena displayed on the maps, you are
selecting one type of relationship; can you find any problem or distortion that might
happen? The maps in the problem were produced using one type of data class. A map
maker could select different types of data classes, for example, a type having different
numbers of classes, different intervals, etc. If you select a different one, what results do
you expect? If you see this map, there are basic area units. As you see here, one unit is

99
represented by one color, meaning one unit is represented by one value; can you find any
problem or distortion that might occur when you represent the real world this way? What
do you think about the relationship between the area of basic units and map pattern or
any other things?
When students select one graph to represent the relationship between the two
phenomena, there is an issue of generalization. In fact, the patterns displayed on the two
maps do not perfectly follow one relationship. That is, for some the real pattern is
opposite. Furthermore, choosing a specific type of data class (i.e., a specific number of
classes, a specific interval) can influence map patterns. Depending on data classes
adopted, even the same data can represent the world differently. Furthermore, in
aggregating data, variation within groups is lost because each unit is averaged. This issue
is related to Modifiable Areal Unit Problem (MAUP). MAUP points out that when
spatial data are aggregated, the same dataset can produce different statistical results
(Holt, Steel, and Tranmer 1996; Dark and Bram 2007). In an extreme case, the same
dataset can produce both a positive and negative correlations, depending on a selected
areal unit. Hence, MAUP is a critical issue in spatial analyses. Moreover, changing the
area of basic units can change map patterns. Student should critically evaluate resulting
changes when the size of basic units becomes smaller or bigger.
Assessment
After all the interviews were completed using the questions described above,
those interviews were transcribed. Then, assessments were performed both quantitatively
100
and qualitatively. The following describes how the quantitative and qualitative
assessments were conducted.
Quantitative Assessment
A rubric was developed to provide criteria for quantitative assessment
(APPENDIX D). The rubric guided the evaluation of students’ interviews regarding the
three aspects of critical spatial thinking, that is, data reliability, spatial reasoning, and
problem-solving validity. For each sub-dimension, students’ performance was assigned
to one of four categories: excellent (3 points), good (2), acceptable (1), and insufficient
(0). However, biased graders can decrease the stability of objective grading. Therefore,
this study investigated inter-rater reliability. The procedures the current study established
inter-rater reliability are described in the following section (Reliability Study). Based on
the assessment, quantitative analyses were conducted to examine whether differences
exist in improvement among the groups, using ANOVA, ANCOVA, and paired sample
t-tests. When a statistical difference existed, post hoc comparisons were conducted.
Qualitative Assessment
Participants’ development of critical spatial thinking was also investigated
qualitatively analyzing transcriptions, along with the quantitative assessment described
above. Thematic analysis was conducted to find meaningful themes in the improvement
of students’ thinking processes. Thematic analysis is “a method for identifying,
analyzing, and reporting patterns (themes) within data” (Braun and Clarke 2006, 79).

101
After thorough investigation of the transcriptions, several themes were identified and the
legitimacy of the themes was supported by describing students’ interview excerpts.
Reliability Study
Even though students’ interviews were assessed using an established rubric, the
assessment can be biased if it is done by only one grader. Therefore, two other graders
were recruited and inter-rater reliability was investigated.
Two graduate students in the Department of Geography at Texas A&M
University were invited as graders, and they participated in a training session. In the
training session, three graders (the researcher of this study and two invited graders)
discussed the interview questions thoroughly and practiced grading. The training session
lasted for one hour.
After the training session, the graders assessed 20 interviews independently,
which were randomly selected from the total number of transcripts (64 interviews). In
reliability studies, selecting sub-samples for computing inter-rater reliability estimate is
not uncommon, due to substantial time required to grade the interviews (Steinkuehler
and Duncan 2008; Thoemmes and Kim 2011). During the assessment, confidentiality
was assured by not revealing interviewees’ personal information.
Inter-rater reliability was calculated using Krippendorff’s alpha. Krippendorff’s
alpha is one of the most generalized measures for inter-rater reliability, because it can be
used for any scales of measurement, any number of graders, and any datasets with or
without missing data (Krippendorff 2004a, 2004b; Hayes and Krippendorff 2007).

102
Because Krippendorff’s alpha considers chance agreements, this coefficient is
conservative (Lombard, Snyder-Duch, and Bracken 2002). To compute the alpha, the
SPSS macro developed by Hayes and Krippendorff (2007) was used.
Relationships among the Three Components of Spatial Literacy
From the three experiments described above, scores of spatial habits of mind,
spatial concepts and skills, and critical spatial thinking were obtained. Using pre- and
post-test scores, Pearson’s correlation coefficients between the scores were computed,
and those relationships were plotted as a matrix of graphs (see the figure on page 147 in
Chapter IV).
Pearson’s correlation coefficient examines the relationship between two
variables, therefore, it cannot investigates the association of three variables
simultaneously. The current study measured three aspects of spatial literacy. Hence, to
investigate the three scores visually and simultaneously, a graph of “score space” was
created, with x, y, and z axes signifying the scores of spatial habits of mind (x), spatial
concepts and thinking skills (y), and critical spatial thinking (z), respectively (see the
figure on page 149 in Chapter IV). Then, each participant who completed all the three
tests was positioned in the space based on his/her post-test scores. Thus, if a student had
high scores for the three tests simultaneously, his/her scores would be positioned toward
the right end of the x axis, further up on the y axis, and higher on the z axis. In contrast,
if a student scored low in all the three tests, the student’s scores would be positioned on
the left side of the X axis, further down on the Y axis, and lower on the z axis.

103
In addition, to quantitatively supplement the visual investigation, a test for
independence (chi-square test) was conducted. The mean of each test can work as a focal
point of interest to draw a best fit line (Thompson 2006). Using the three means of the
three tests as reference points, each participant can be positioned in one of the eight
octants. This is because one test is divided into two spaces, that is, above mean and
below mean, and since there are three tests in total, there are eight octants, in which a
person can be located with his/her scores of the three tests (23 = 8, see Table 9). After
participants’ scores were located in one of the eight octants, a test for independence (chi-
square test) was conducted to examine whether differences exist in participants’
positioning in the octants. If there is no trend, participants’ scores are expected to be
located evenly in the eight octants, but if there is any trend, the scores will be clustered,
showing some kind of pattern.
Table 9. Eight octants on which a set of a participant’s scores can be positioned. SHMI (Test 1) SCST (Test 2) CSTOT (Test 3)
+ + + + + – + – + – + + + – – – + – – – + – – –
Note. (+) signifies above mean of the test, and (-) signifies below mean of the test.

104
Finally, exploratory factor analysis was conducted using the three scores. If the
three scores comprise a unitary construct, one factor should be extracted and it should
account for a significant portion of the variance of the data.

105
CHAPTER IV
FINDINGS AND ANALYSIS
This chapter reports the quantitative and qualitative research findings of the three
research experiments described in Chapter III. Three groups were recruited to investigate
whether completing a GIS course affects students’ spatial literacy: 1) a GIS group
(experimental group), 2) a geography group (control group 1), and 3) an education group
(control group 2). The first three sections describe the effects of a GIS course on spatial
habits of mind, spatial concepts and thinking skills, and critical spatial thinking
sequentially. The last section investigates the relationship among these three components
of spatial literacy.
Experiment 1: Spatial Habits of Mind Inventory (SHMI)
This study developed an inventory of spatial habits of mind (SHMI) to examine
whether GIS learning enhances students’ dispositional aspect of spatial literacy. The first
experiment tested the effects of a GIS course on spatial habits of mind. This section first
reports test results regarding the reliability and the validity of the SHMI. Then, the
effects of a GIS course on spatial habits of mind are discussed in terms of treatment
group, gender, and academic majors.

106
Reliability of the Inventory
The reliability of the SHMI was tested using Cronbach’s alpha. This coefficient
measures internal consistency of data (Crocker and Algina 2008). Table 10 presents
calculated alpha values. The cutoff value of Cronbach’s alpha in social science is usually
.70 (de Vaus 2002). The alpha value including all the items of the SHMI was .927.
When the alpha of each sub-dimension was computed, all the sub-dimensions, except
spatial concept use, achieved values greater than .70. The alpha statistic tends to increase
as more test items are added to the test (Crocker and Algina 2008). Considering that the
dimension, spatial concept use, contains only four items, its value is not unreasonably
low (Nori and Giusberti 2006). Thus, this analysis suggests that the inventory is a
reliable test instrument.
Table 10. Cronbach’s alpha of the inventory. Category Alpha Total (28 items) .927 Pattern recognition (6 items) .732 Spatial description (5 items) .822 Visualization (8 items) .806 Spatial concept use (4 items) .675 Spatial tool use (5 items) .803
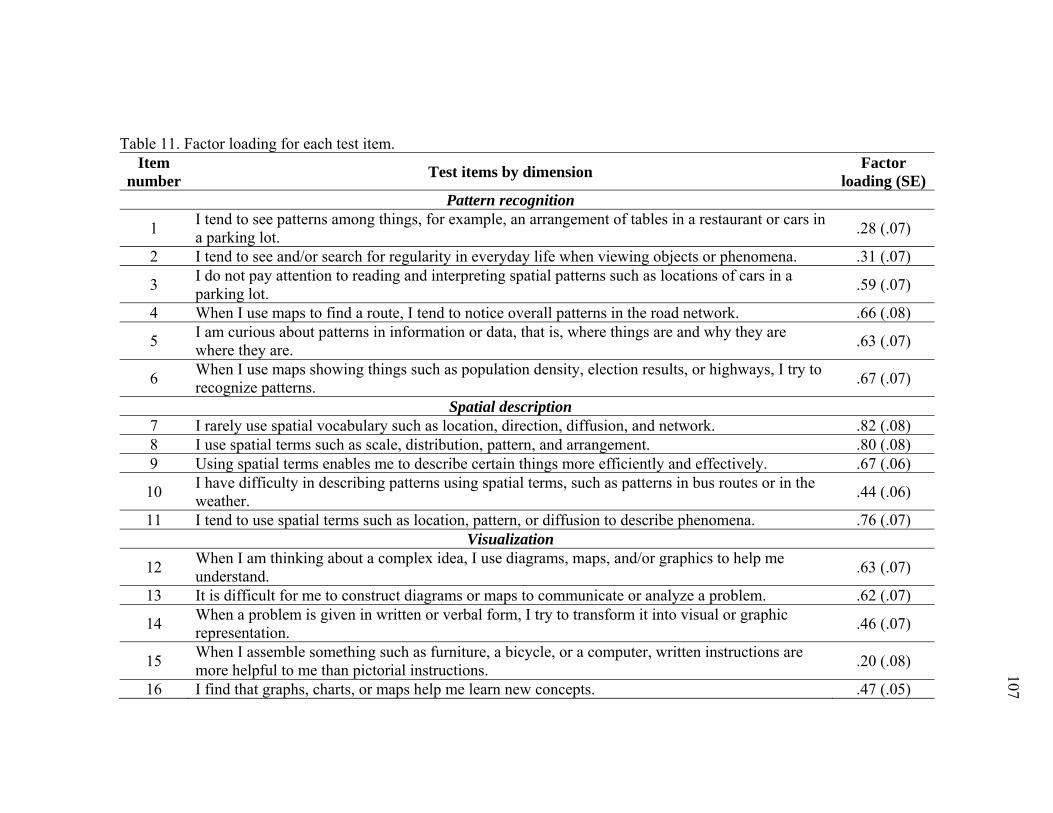
107
Table 11. Factor loading for each test item. Item
number Test items by dimension
Factor loading (SE)
Pattern recognition
1 I tend to see patterns among things, for example, an arrangement of tables in a restaurant or cars in a parking lot.
.28 (.07)
2 I tend to see and/or search for regularity in everyday life when viewing objects or phenomena. .31 (.07)
3 I do not pay attention to reading and interpreting spatial patterns such as locations of cars in a parking lot.
.59 (.07)
4 When I use maps to find a route, I tend to notice overall patterns in the road network. .66 (.08)
5 I am curious about patterns in information or data, that is, where things are and why they are where they are.
.63 (.07)
6 When I use maps showing things such as population density, election results, or highways, I try to recognize patterns.
.67 (.07)
Spatial description 7 I rarely use spatial vocabulary such as location, direction, diffusion, and network. .82 (.08) 8 I use spatial terms such as scale, distribution, pattern, and arrangement. .80 (.08) 9 Using spatial terms enables me to describe certain things more efficiently and effectively. .67 (.06)
10 I have difficulty in describing patterns using spatial terms, such as patterns in bus routes or in the weather.
.44 (.06)
11 I tend to use spatial terms such as location, pattern, or diffusion to describe phenomena. .76 (.07) Visualization
12 When I am thinking about a complex idea, I use diagrams, maps, and/or graphics to help me understand.
.63 (.07)
13 It is difficult for me to construct diagrams or maps to communicate or analyze a problem. .62 (.07)
14 When a problem is given in written or verbal form, I try to transform it into visual or graphic representation.
.46 (.07)
15 When I assemble something such as furniture, a bicycle, or a computer, written instructions are more helpful to me than pictorial instructions.
.20 (.08)
16 I find that graphs, charts, or maps help me learn new concepts. .47 (.05)
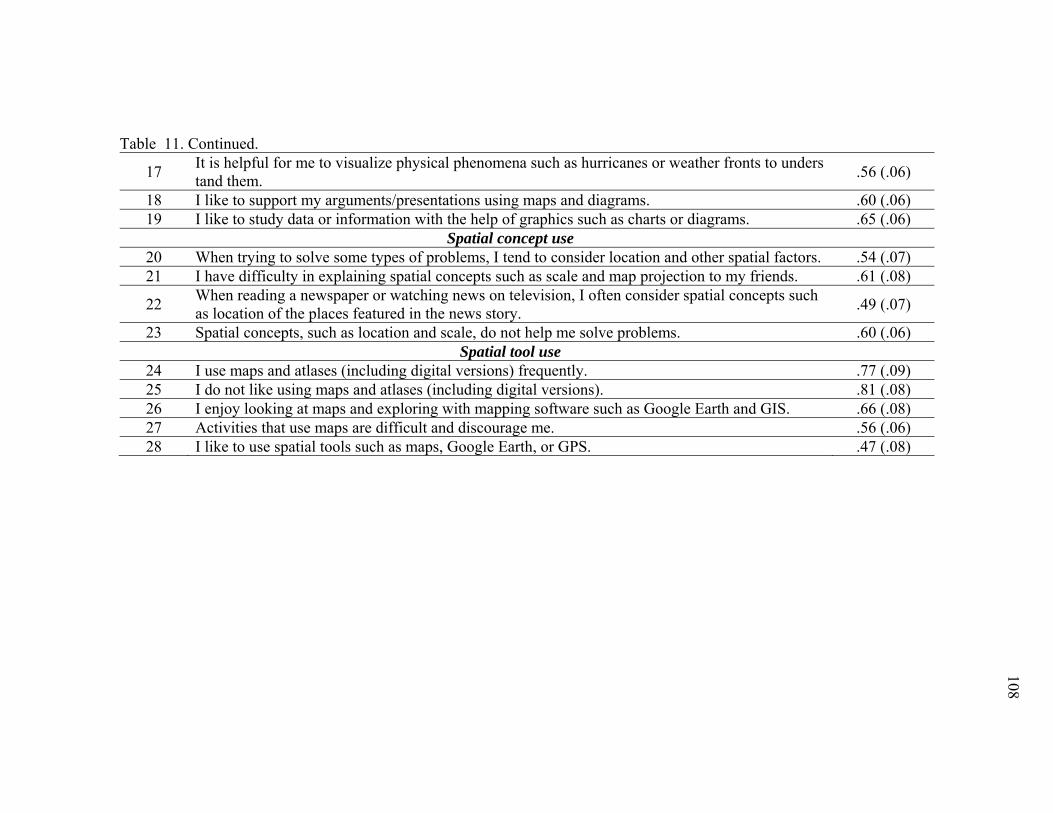
108
Table 11. Continued.
17 It is helpful for me to visualize physical phenomena such as hurricanes or weather fronts to understand them.
.56 (.06)
18 I like to support my arguments/presentations using maps and diagrams. .60 (.06) 19 I like to study data or information with the help of graphics such as charts or diagrams. .65 (.06) Spatial concept use
20 When trying to solve some types of problems, I tend to consider location and other spatial factors. .54 (.07) 21 I have difficulty in explaining spatial concepts such as scale and map projection to my friends. .61 (.08)
22 When reading a newspaper or watching news on television, I often consider spatial concepts such as location of the places featured in the news story.
.49 (.07)
23 Spatial concepts, such as location and scale, do not help me solve problems. .60 (.06) Spatial tool use
24 I use maps and atlases (including digital versions) frequently. .77 (.09) 25 I do not like using maps and atlases (including digital versions). .81 (.08) 26 I enjoy looking at maps and exploring with mapping software such as Google Earth and GIS. .66 (.08) 27 Activities that use maps are difficult and discourage me. .56 (.06) 28 I like to use spatial tools such as maps, Google Earth, or GPS. .47 (.08)

109
Validity of the Inventory
As discussed in Chapter III, the content validity of the SHMI was established by
incorporating experts’ comments. This section describes how the construct validity of
the SHMI was established. Construct validity measures the degree to which an
instrument assesses a theoretical construct of a test (Huck 2008). The following
investigates whether the five sub-dimensions of the SHMI are valid constructs to
conceptualize spatial habits of mind.
The construct validity of the SHMI was investigated through confirmatory factor
analysis (see Table 11). In factor analysis, a factor (a latent variable) aggregates
observed variables and represents underlying concepts contained within the observed
data (Borsboom, Mellenbergh, and van Heerden 2003). By combining observed
variables, a latent variable reduces dimensionality, assisting researchers in understanding
data more effectively. To be specific, in Table 11, items 1 through 6 (observed variables)
are reduced to one latent variable, pattern recognition. A latent variable, in principle,
wholly explains the variance of items that belong to that factor (Bollen 2002).
In practice, however, some additional relationships between items are
incorporated into a model, considering effects such as wording (Williams, Ford, and
Nguyen 2002). That is, relationships that are not explained by a latent variable are
employed into a model. Following this practice, relationships between some items in the
SHMI were added into the current model to improve model fit. Based on model
modification indexes recommended by Mplus, a few associations were incorporated into
the model (Klein 2005). When introducing additional relationships into a model, a
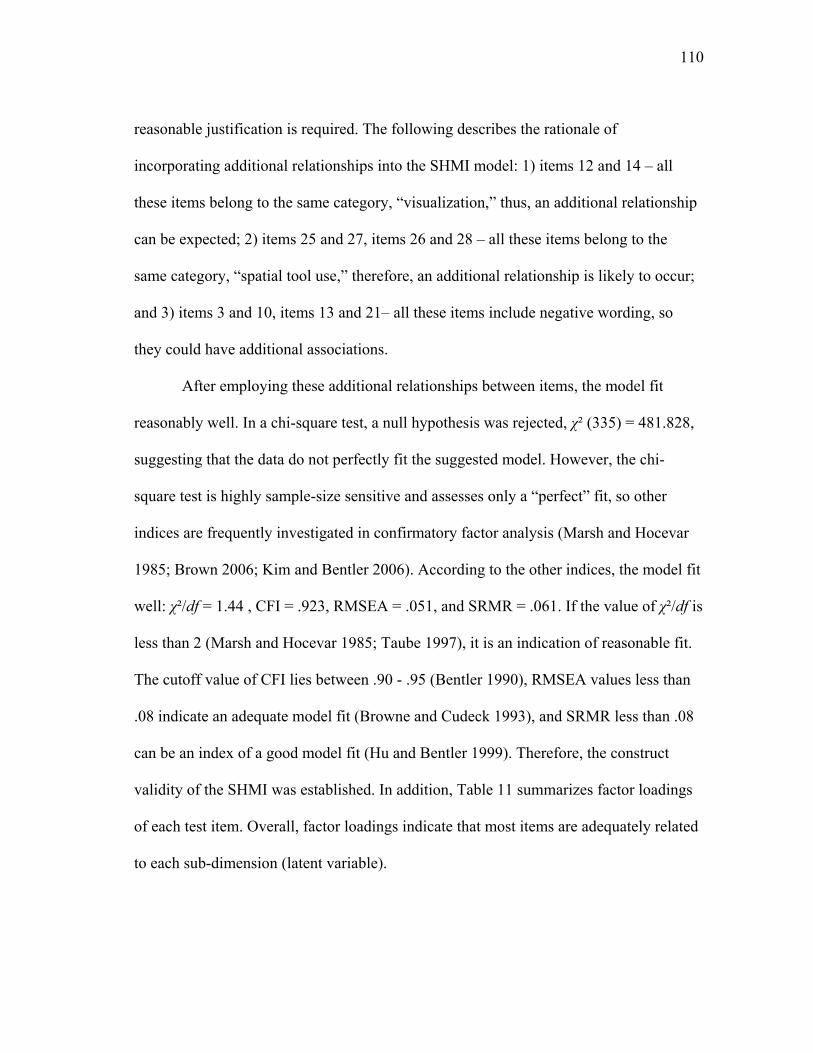
110
reasonable justification is required. The following describes the rationale of
incorporating additional relationships into the SHMI model: 1) items 12 and 14 – all
these items belong to the same category, “visualization,” thus, an additional relationship
can be expected; 2) items 25 and 27, items 26 and 28 – all these items belong to the
same category, “spatial tool use,” therefore, an additional relationship is likely to occur;
and 3) items 3 and 10, items 13 and 21– all these items include negative wording, so
they could have additional associations.
After employing these additional relationships between items, the model fit
reasonably well. In a chi-square test, a null hypothesis was rejected, χ² (335) = 481.828,
suggesting that the data do not perfectly fit the suggested model. However, the chi-
square test is highly sample-size sensitive and assesses only a “perfect” fit, so other
indices are frequently investigated in confirmatory factor analysis (Marsh and Hocevar
1985; Brown 2006; Kim and Bentler 2006). According to the other indices, the model fit
well: χ²/df = 1.44 , CFI = .923, RMSEA = .051, and SRMR = .061. If the value of χ²/df is
less than 2 (Marsh and Hocevar 1985; Taube 1997), it is an indication of reasonable fit.
The cutoff value of CFI lies between .90 - .95 (Bentler 1990), RMSEA values less than
.08 indicate an adequate model fit (Browne and Cudeck 1993), and SRMR less than .08
can be an index of a good model fit (Hu and Bentler 1999). Therefore, the construct
validity of the SHMI was established. In addition, Table 11 summarizes factor loadings
of each test item. Overall, factor loadings indicate that most items are adequately related
to each sub-dimension (latent variable).

111
Score Comparison by Group
This study examined whether taking a specific course affects students’ spatial
habits of mind. Participants’ self-rated spatial habits of mind scores (total scores
combining all the sub-dimensions) in pre- and post-tests by group are presented in Table
12. The results indicated that the spatial habits of mind only for the GIS group improved
significantly, measured by the difference between pre- and post-test scores (paired
sample t-test). There was no improvement for the two control groups. Cohen’s d
indicated that the GIS group’s pre- and post-test score difference is much greater than
that of the two control groups. The magnitude of effect size of the GIS group was
between medium and large (Cohen’s d = .68).
Table 12. A comparison of total pre- and post-test scores by group.
N Pre-test Post-test Score
difference Cohen’s d
Mean SD Mean SD GIS 41 107.54 9.07 113.51 8.60 5.97** .68 Geography 43 103.12 12.85 104.58 15.17 1.46 .10 Education 84 94.88 17.51 94.77 19.03 0.11 .01
** p < .01
Table 12 displays differences in the pre-test score between groups. Prior to the
treatment (GIS learning), the three groups scored differently on the SHMI. Analysis of
variance (ANOVA) was performed on the pre-test scores of the three groups, and they
were found to be statistically different (Table 13). Post-hoc comparisons using the Tukey
method were conducted to determine which groups are statistically different from each
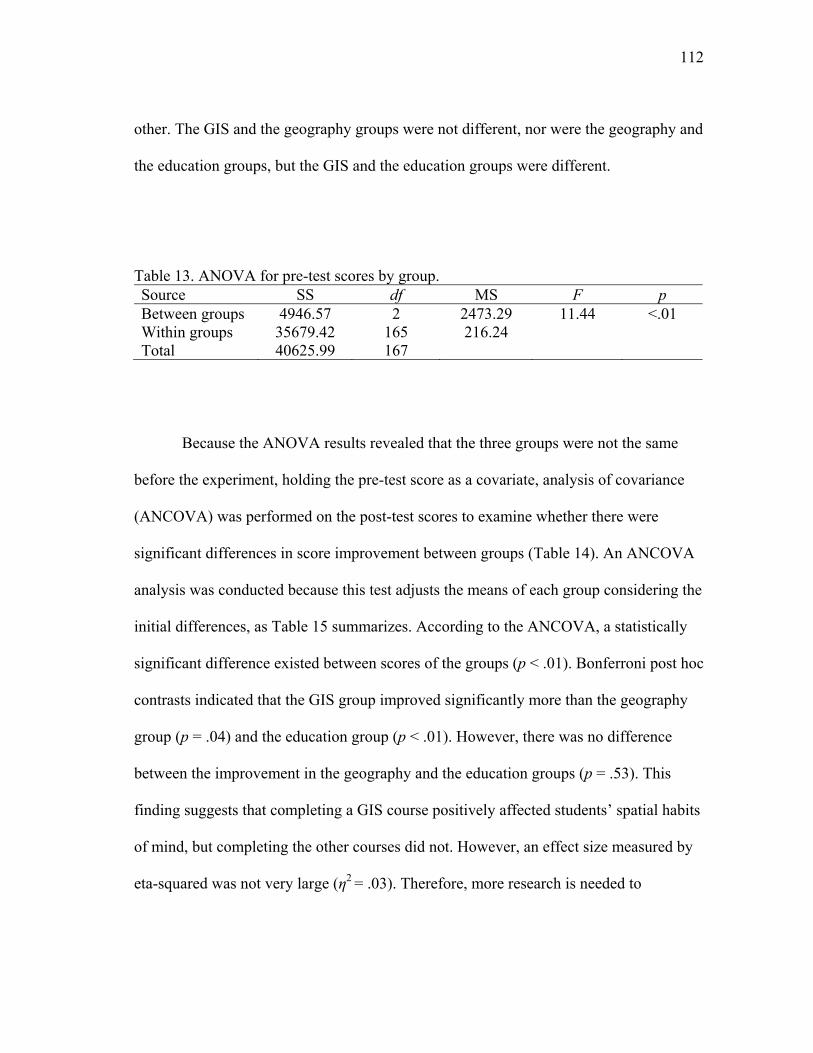
112
other. The GIS and the geography groups were not different, nor were the geography and
the education groups, but the GIS and the education groups were different.
Table 13. ANOVA for pre-test scores by group. Source SS df MS F p Between groups 4946.57 2 2473.29 11.44 <.01 Within groups 35679.42 165 216.24 Total 40625.99 167
Because the ANOVA results revealed that the three groups were not the same
before the experiment, holding the pre-test score as a covariate, analysis of covariance
(ANCOVA) was performed on the post-test scores to examine whether there were
significant differences in score improvement between groups (Table 14). An ANCOVA
analysis was conducted because this test adjusts the means of each group considering the
initial differences, as Table 15 summarizes. According to the ANCOVA, a statistically
significant difference existed between scores of the groups (p < .01). Bonferroni post hoc
contrasts indicated that the GIS group improved significantly more than the geography
group (p = .04) and the education group (p < .01). However, there was no difference
between the improvement in the geography and the education groups (p = .53). This
finding suggests that completing a GIS course positively affected students’ spatial habits
of mind, but completing the other courses did not. However, an effect size measured by
eta-squared was not very large (η2 = .03). Therefore, more research is needed to

113
determine the practical significance of completing a GIS course on students’ spatial
habits of mind.
Table 14. ANCOVA for the SHMI as a function of group, using the pre-test scores as a covariate. Source SS df MS F p η2 Between groups 1327.39 2 663.69 7.90 <.01 .03 Within groups 13793.33 164 84.11 Total 52782.57 167
Table 15. Adjusted and unadjusted group post-test means and variability for the SHMI using the pre-test scores as a covariate.
N Unadjusted Adjusted
Mean SD Mean SE GIS 41 113.51 8.60 106.80 1.48 Geography 43 104.58 15.17 101.85 1.41 Education 84 94.77 19.03 99.45 1.03
Spatial habits of mind in this study comprised five sub-dimensions. The
differences between pre- and post-test scores were explored for each dimension (Table
16). Except for the dimension, spatial tool use, the GIS group’s scores were statistically
different. No difference between pre- and post-test scores was found for any dimension
for either of the two control groups. Furthermore, when ANCOVA was conducted to
investigate the differences in score improvement among groups, the improvement was
statistically significant only for the GIS group, but was not for the control groups. Effect

114
size indices (Cohen’s d) showed that the GIS students improved more than the students
in the control groups.
Table 16. A comparison of pre- and post-test scores of each sub-dimension by group.
N Pre-test Post-test Score
difference Cohen’s
d p
(ANCOVA) Mean SD Mean SD Pattern recognition (Highest score = 30)
GIS 41 22.39 2.53 24.15 1.97 1.76** .78 <.01 Geography 43 22.35 2.90 22.65 3.90 0.30 .09
Education 84 20.18 4.29 20.05 4.55 -0.13 .03 Spatial description (Highest score = 25)
GIS 41 17.17 3.11 18.83 2.82 1.66** .56 <.01 Geography 43 16.86 3.34 17.60 3.44 0.74 .22
Education 84 15.10 4.17 15.25 4.40 0.15 .03 Visualization (Highest score = 40)
GIS 41 31.98 2.95 33.32 2.88 1.34** .46 <.01 Geography 43 30.53 3.56 30.56 3.96 0.03 .01
Education 84 28.82 5.55 28.58 5.89 -0.24 .04 Spatial concept use (Highest score = 20)
GIS 41 15.44 1.96 16.34 1.57 0.9** .51 <.01 Geography 43 14.56 2.35 14.95 2.22 0.39 .17
Education 84 13.32 2.85 13.10 3.42 -0.22 .07 Spatial tool use (Highest score = 25)
GIS 41 20.56 3.19 20.87 2.88 0.31 .10 .30 Geography 43 18.81 3.72 18.81 4.18 0.00 .00
Education 84 17.46 3.78 17.79 3.85 0.33 .09 ** p < .01
Score Comparison by Gender and Academic Major
This study investigated whether gender plays a role in the improvement of spatial
habits of mind. Table 17 presents scores for males and females in the GIS group.
Analyses of independent sample t-tests indicated that the scores of males and females

115
were not different both in pre-test (p = .42) and post-test (p = .40). When independent
sample t-tests were performed by dimension, the result was the same (Table 18). For no
dimension was the pre- and post-test score statistically different by gender.
Table 17. A comparison of male and female scores by test.
N Male Female Score
difference Cohen’s d
Mean SD Mean SD Pre-test 41 108.79 9.08 106.45 9.13 2.34 .26 Post-test 41 114.74 8.97 112.45 8.32 2.29 .26
Table 18. A comparison of male and female scores by test of each sub-dimension.
N Male Female Score
difference Cohen’s
d Mean SD Mean SD Pattern recognition (Highest score = 30)
Pre-test 41 23.16 2.81 21.73 2.10 1.43 .58 Post-test 41 24.58 1.78 23.77 2.10 0.81 .42
Spatial description (Highest score = 25) Pre-test 41 17.32 3.45 17.05 2.85 0.27 .09 Post-test 41 19.32 2.89 18.41 2.75 0.91 .32
Visualization (Highest score = 40) Pre-test 41 31.53 2.63 32.36 3.20 -0.83 .28 Post-test 41 33.21 2.70 33.41 3.08 -0.20 .07
Spatial concept use (Highest score = 20) Pre-test 41 15.26 1.56 15.59 2.28 -0.33 .17 Post-test 41 16.37 1.64 16.32 1.55 0.05 .03
Spatial tool use (Highest score = 25) Pre-test 41 21.53 2.86 19.73 3.30 1.80 .58 Post-test 41 21.26 2.64 20.56 3.10 0.70 .24
Even though no statistically significant differences existed in the scores of pre-
and post-tests by gender, both genders improved their spatial habits after completing a
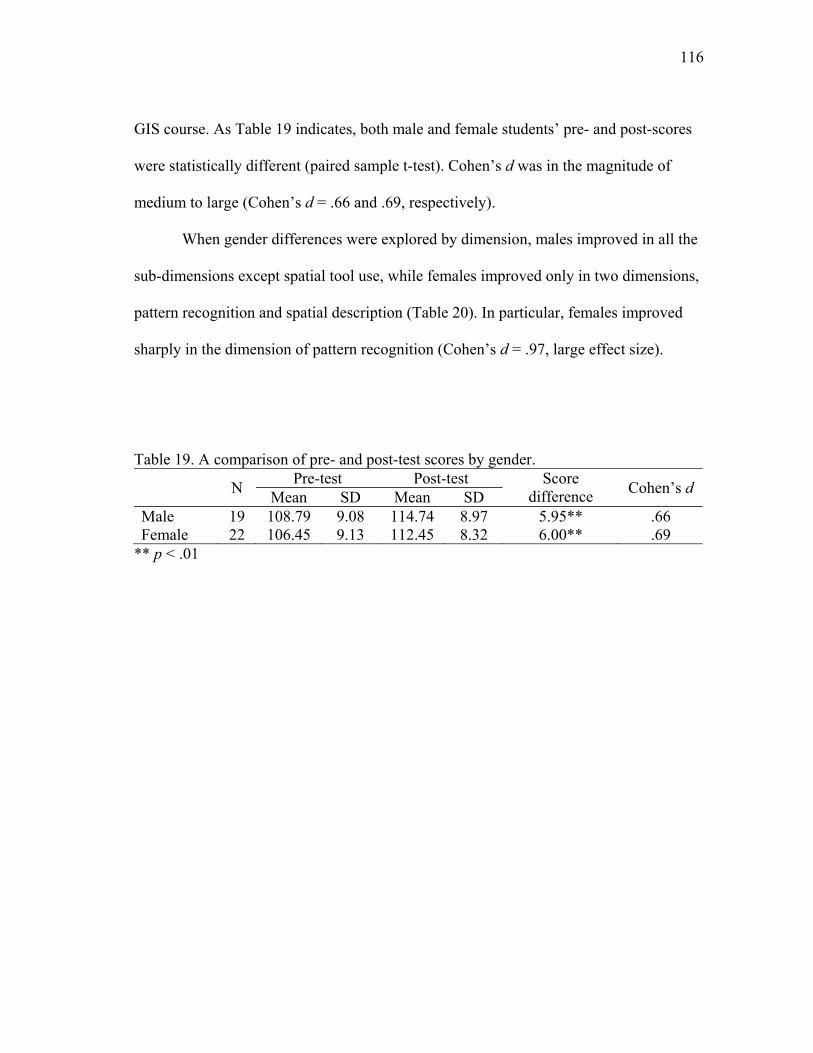
116
GIS course. As Table 19 indicates, both male and female students’ pre- and post-scores
were statistically different (paired sample t-test). Cohen’s d was in the magnitude of
medium to large (Cohen’s d = .66 and .69, respectively).
When gender differences were explored by dimension, males improved in all the
sub-dimensions except spatial tool use, while females improved only in two dimensions,
pattern recognition and spatial description (Table 20). In particular, females improved
sharply in the dimension of pattern recognition (Cohen’s d = .97, large effect size).
Table 19. A comparison of pre- and post-test scores by gender.
N Pre-test Post-test Score
difference Cohen’s d
Mean SD Mean SD Male 19 108.79 9.08 114.74 8.97 5.95** .66 Female 22 106.45 9.13 112.45 8.32 6.00** .69
** p < .01

117
Table 20. A comparison of pre- and post-test scores by gender of each sub-dimension.
N Pre-test Post-test Score
difference Cohen’s d
Mean SD Mean SD Pattern recognition (Highest score = 30)
Male 19 23.16 2.81 24.58 1.78 1.42** .60 Female 22 21.73 2.10 23.77 2.10 2.04** .97
Spatial description (Highest score = 25) Male 19 17.32 3.45 19.32 2.89 2.00** .63 Female 22 17.05 2.85 18.41 2.75 1.36* .49
Visualization (Highest score = 40) Male 19 31.53 2.63 33.21 2.70 1.68* .63 Female 22 32.36 3.20 33.41 3.08 1.05 .33
Spatial concept use (Highest score = 20) Male 19 15.26 1.56 16.37 1.64 1.11* .69 Female 22 15.59 2.28 16.32 1.55 0.73 .37
Spatial tool use (Highest score = 25) Male 19 21.53 2.86 21.26 2.64 -0.27 .10 Female 22 19.73 3.30 20.56 3.10 0.83 .26
* p < .05, **p < .01
Considering that a wide range of prior studies reported male’s superiority in
spatial traits (Battista 1990; Masters and Sanders 1993; Collins and Kimura 1997;
Nordvik and Amponsah 1998; Colom, Quiroga, and Juan-Espinosa 1999; Halpern and
LaMay 2000; Weiss et al. 2003), these findings are intriguing. To further investigate this
situation, analyses regarding gender difference were performed for the two control
groups. Interestingly, in the geography and education groups, both in pre- and post-tests,
gender differences were found. In the geography group, the scores of males were
significantly higher than those of females (pre-test, p < .01; post-test, p < .01), and the
same pattern was found in the education group (pre-test, p < .01; post-test, p < .01).

118
As the results above indicate, gender differences were found both in pre- and
post-tests in the two control groups, but no gender difference in the GIS group existed
even in the pre-test, which is prior to treatment. This result suggests that other variables
play a role here. A noticeable difference between the experimental and control groups
was the academic major of the participants. Most participants (93 percent) who were
enrolled in the GIS course were geography (n = 9) or geography-related majors
(environmental studies (n = 14), environmental geosciences (n = 10), geology (n = 1),
oceanography (n = 1) and university studies (n = 1)) or other majors with a spatial
perspective (e.g., urban planning, n = 2). Only three students majored in non-spatial
majors. In contrast, for the geography group, 40 percent were geography, geography-
related, or spatial majors, and for the education group, only one student was geology
major.
Therefore, a relationship between academic majors and spatial habits of mind
was hypothesized. To examine this hypothesis, differences of spatial habits of mind by
academic major were explored, using the pre-test scores of all the participating students.
Students’ majors were classified into three categories: 1) geography or geography-
related major; 2) spatial major; and 3) non-spatial major. In the category 1, majors in the
College of Geosciences at Texas A&M University were included: geography,
environmental geosciences, environmental studies, geology, meteorology, earth science,
geoinformatics, geophysics, oceanography, and university studies. Majors such as
engineering and urban planning are likely to require spatial thinking, but because they
are not part of the College of Geosciences, these majors were classified as spatial

119
majors, category 2. Finally, majors, such as business, politics, and education, were
allocated to the third category (non-spatial major). ANOVA was conducted to test
whether scores of these groups are statistically different (Table 21). The result indicated
that the scores are statistically different (p < .01, η2 =.22, large effect size). Post-hoc
comparisons using the Tukey method revealed that students who belong to the categories
1 and 2 were not different (p = .98), but statistically significant differences existed
between categories1 and 3 (p < .01) and 2 and 3 (p < .01). This finding demonstrates that
students’ academic major plays an important role in their spatial habits of mind. That is,
prior to GIS intervention, students in categories 1 and 2 had higher inclination to employ
spatial perspectives than those in category 3. However, as previously described, since
most students in the GIS group were majors of category 1, and non-spatial majors
included only three participants, the effects of a GIS course on spatial habits of mind by
academic major could not be investigated in the context of this study due to sample
limitation. Future research with more participants of non-spatial majors should address
this issue.
Table 21. ANOVA for pre-test scores by major. Source SS df MS F p η2 Between groups 9098.74 2 4549.37 23.82 <.01 .22 Within groups 31527.25 165 191.07 Total 40625.99 167

120
Experiment 2: Spatial Concepts and Skills Test (SCST)
This study defined the second component of spatial literacy as spatial concepts
and thinking skills. To measure this aspect of spatial literacy, a spatial concepts and
skills test (SCST) was devised. The second experiment investigated if and how
completing a GIS course would affect students’ spatial cognition. This section first
describes how reliability and validity for the SCST were established. Then, the effects of
completion of a GIS course on spatial concepts and thinking skills are discussed,
including the effects of groups, gender, and academic majors.
Reliability and Validity
As a measure of reliability, Cronbach’s alpha was computed for both pre- and
post-tests. For the pre-test, the alpha value was .672, but in the post-test, the value
improved to .753. As described in Chapter III, the content validity of the SCST was
established through experts’ verification of the SCST.
Score Comparison by Group
This study recruited three groups to investigate whether differences exist in the
improvement of students’ use and understanding of spatial concepts and skills by group.
Participants’ performances in the SCST by group are presented in Table 22. Both the
GIS and geography groups improved their scores (paired sample t-test). Completion of
either a GIS or a geography course helped the development of spatial concepts and

121
thinking skills. However, the GIS students improved much more than the geography
students as indicated by Cohen’s d (.99 and .24, respectively).
Table 22. A comparison of pre- and post-test scores by group.
N Pre-test Post-test Score
difference Cohen’s d
Mean SD Mean SD GIS 42 15.26 2.93 17.67 1.80 2.41** .99 Geography 45 13.71 3.53 14.60 3.83 0.89* .24 Education 84 13.18 3.17 13.60 3.31 0.41 .13
* p < .05, **p < .01
ANOVA was applied to the pre-test scores to identify differences of students’
performances on the SCST before the GIS intervention was initiated. As a result,
statistically significant differences were found (Table 23). Tukey post hoc tests indicated
that the GIS and the geography groups were not different, and the geography and the
education groups were not different, but the GIS and the education groups were
statistically significantly different. These initial differences are the same as in spatial
habits of mind.
Table 23. ANOVA for pre-test scores by group. Source SS df MS F p Between groups 122.40 2 61.20 5.94 < .01 Within groups 1731.69 168 10.31 Total 1854.08 170
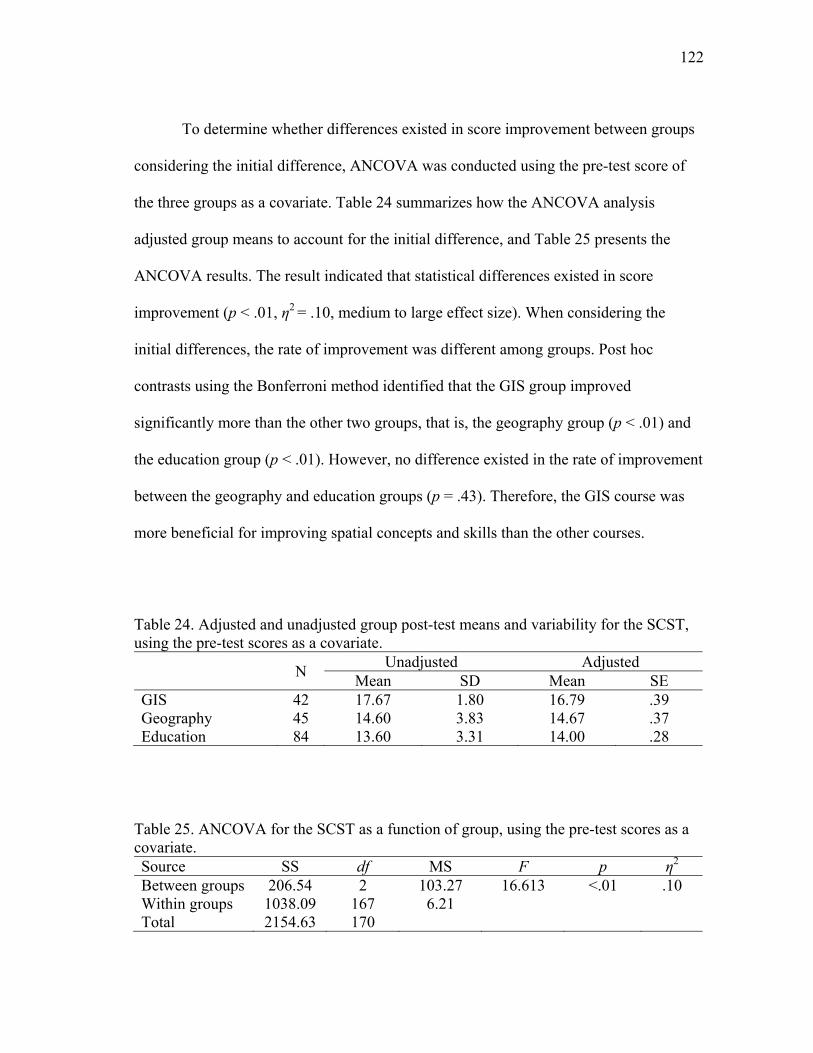
122
To determine whether differences existed in score improvement between groups
considering the initial difference, ANCOVA was conducted using the pre-test score of
the three groups as a covariate. Table 24 summarizes how the ANCOVA analysis
adjusted group means to account for the initial difference, and Table 25 presents the
ANCOVA results. The result indicated that statistical differences existed in score
improvement (p < .01, η2 = .10, medium to large effect size). When considering the
initial differences, the rate of improvement was different among groups. Post hoc
contrasts using the Bonferroni method identified that the GIS group improved
significantly more than the other two groups, that is, the geography group (p < .01) and
the education group (p < .01). However, no difference existed in the rate of improvement
between the geography and education groups (p = .43). Therefore, the GIS course was
more beneficial for improving spatial concepts and skills than the other courses.
Table 24. Adjusted and unadjusted group post-test means and variability for the SCST, using the pre-test scores as a covariate.
N Unadjusted Adjusted
Mean SD Mean SE GIS 42 17.67 1.80 16.79 .39 Geography 45 14.60 3.83 14.67 .37 Education 84 13.60 3.31 14.00 .28
Table 25. ANCOVA for the SCST as a function of group, using the pre-test scores as a covariate. Source SS df MS F p η2 Between groups 206.54 2 103.27 16.613 <.01 .10 Within groups 1038.09 167 6.21 Total 2154.63 170

123
In order to explore which test item in the SCST played a significant role in the
differences of improvement between groups, the average score of each item was
compared (Table 26 and Figures 3 and 4). A scrutiny of the data and accompanying
graph indicated that the GIS students performed better than the other groups for most
problems. This study classified the problems in the SCST into 11 types (see Table 7 in
Chapter III). If students’ performances are compared using the classification, relatively
big gaps between groups were found among the type of problem. First, GIS students
better understood spatial concepts. They had enhanced knowledge regarding key spatial
concepts such as buffer, spatial interpolation, and scale (Type 1 – questions 3, 5, and
19). However, the participants showed very small group differences in question #1
concerning the concept of diffusion even though it belongs to the same problem type.
Second, GIS students effectively applied map overlay skills to solve problems. Their
effective applications of this skill were found both in abstract and real-world contexts
(Type 2 – questions 8, 9, and 10 and Type 3 – questions 18). Third, GIS students were
better skilled than the students in the control groups at constructing a contour map using
elevation data points (Type 4 – question 4). Fourth, GIS students expanded their skills
into a larger scale. Using verbal descriptions, GIS students solved wayfinding problems
effectively, that is, they were well oriented to a real-world frame of reference (Type 6 –
questions 6 and 7). Finally, GIS students were adept at perceiving and transforming
dimension from 2D to 3D. They better created a 3D profile using a 2D map (Type 7 –
question 2).
124
Another interesting finding was that the three graphs showed similar patterns.
That is, the participants, irrespective of group, found similar problems consistently more
difficult than others except for a few items. Bednarz and Lee (2011) reported similar
findings when they studied students from secondary, tertiary, and university levels.
These students also performed similarly on problems measuring spatial thinking ability.
Students’ problem-solving patterns in this study are consistent with that finding.
Score Comparison by Gender and Academic Major
This study also aimed to determine the role, if any, of gender and academic
major in students’ performance on the SCST. Table 27 summarizes the average scores of
males and females on the SCST. Two groups’ scores were not statistically different on
the pre-test (p = .70) or the post-test (p = .91). Cohen’s d was also small in both tests.
However, GIS learning was beneficial for both males and females in developing
their spatial concepts and spatial thinking skills. Paired sample t-tests were conducted,
and the analysis found statistically significant differences between pre- and post-test for
both genders, and large Cohen’s d also demonstrated the positive effects of GIS learning
(Table 28).
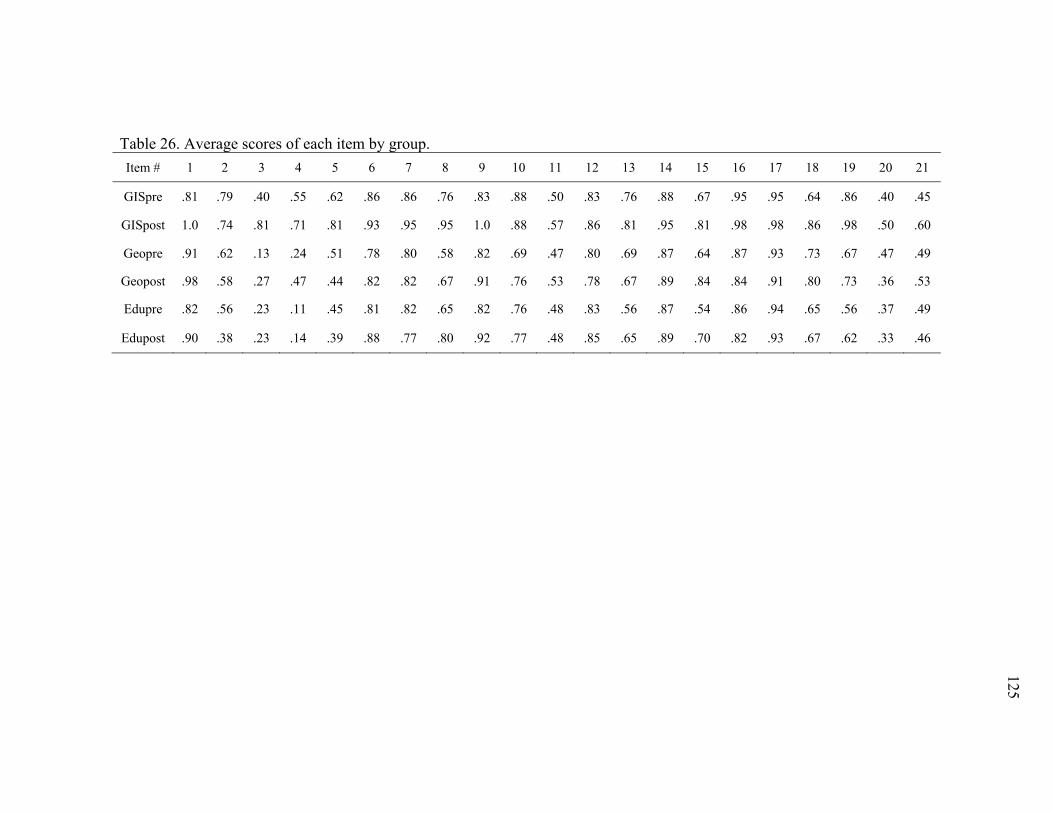
125
Table 26. Average scores of each item by group.
Item # 1 2 3 4 5 6 7 8 9 10 11 12 13 14 15 16 17 18 19 20 21
GISpre .81 .79 .40 .55 .62 .86 .86 .76 .83 .88 .50 .83 .76 .88 .67 .95 .95 .64 .86 .40 .45
GISpost 1.0 .74 .81 .71 .81 .93 .95 .95 1.0 .88 .57 .86 .81 .95 .81 .98 .98 .86 .98 .50 .60
Geopre .91 .62 .13 .24 .51 .78 .80 .58 .82 .69 .47 .80 .69 .87 .64 .87 .93 .73 .67 .47 .49
Geopost .98 .58 .27 .47 .44 .82 .82 .67 .91 .76 .53 .78 .67 .89 .84 .84 .91 .80 .73 .36 .53
Edupre .82 .56 .23 .11 .45 .81 .82 .65 .82 .76 .48 .83 .56 .87 .54 .86 .94 .65 .56 .37 .49
Edupost .90 .38 .23 .14 .39 .88 .77 .80 .92 .77 .48 .85 .65 .89 .70 .82 .93 .67 .62 .33 .46
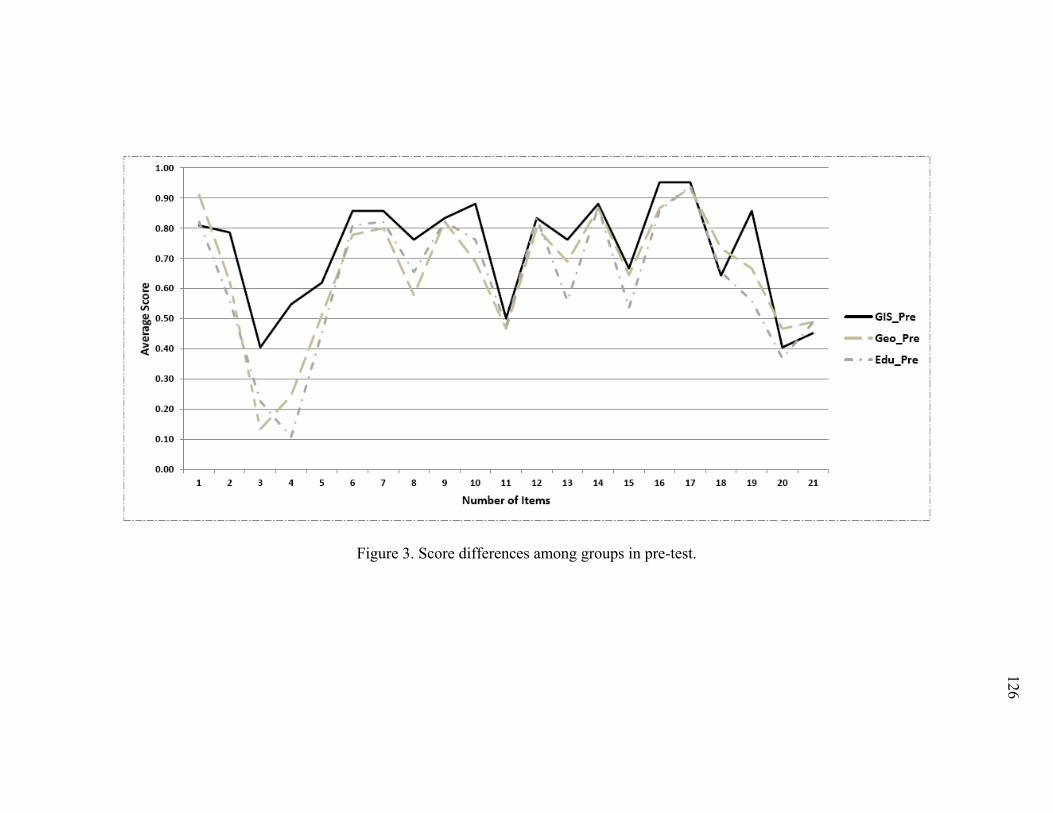
126
Figure 3. Score differences among groups in pre-test.

127
Figure 4. Score differences among groups in post-test.

128
Table 27. A comparison of male and female scores by test.
N Male Female Score
difference Cohen’s d
Mean SD Mean SD Pre-test 42 15.45 3.09 15.10 2.84 0.35 .11 Post-test 42 17.70 1.50 17.64 2.08 0.06 .03
Table 28. A comparison of pre- and post-test scores by gender.
N Pre-test Post-test Score
difference Cohen’s d Mean SD Mean SD Male 20 15.45 3.09 17.70 1.50 2.25** .93 Female 22 15.10 2.84 17.64 2.08 2.54** 1.00
** p < .01
As was the case in the experiment 1, in the other two control groups, both in pre-
and post-tests, gender differences existed. In the geography group, the scores of males
were statistically significantly higher than those of females (pre-test, p = .03; post-test, p
< .01), and the same pattern existed in the education group (pre-test, p = .02; post-test, p
= .02).
In the analyses of experiment 1, academic major made a difference in students’
spatial habits of mind. Because the same participants took part in the second experiment,
the experiment also evaluated the role of academic major in students’ performance.
Students in the three participating groups were classified, using the same scheme
described previously. When ANOVA and subsequent post hoc comparisons were
conducted, patterns similar to those for experiment 1 were found. The scores of the three
groups were statistically different (p < .01, η2 = .12, medium to large size). Scores of

129
categories 1 and 2 were not different (p = .92), but those of categories 1 and 3 (p < .01),
2 and 3 (p < .01) were different. These findings suggest that academic major plays a role
in students’ spatial cognition. Geography, geography-related, or spatial majors
performed better. This is the same result found in the analyses of spatial habits of mind.
However, because the GIS group (93 percent) was composed of mostly spatial types of
majors such as geography or geography-related disciplines or majors with a spatial
perspective, the effects of GIS intervention on spatial cognition by academic majors
could not be examined due to sample limitation.
Table 29. ANOVA for pre-test scores by major. Source SS df MS F p η2 Between groups 224.08 2 112.03 11.55 <.01 .12 Within groups 1630.03 168 9.70 Total 1854.11 170

130
Experiment 3: Critical Spatial Thinking Oral Test (CSTOT)
The third component of spatial literacy is critical spatial thinking, and this
element emphasizes students’ thinking processes. An interview-type critical spatial
thinking oral test, CSTOT, was developed to explore students’ thinking processes. The
development of the CSTOT incorporated the components of critical spatial thinking
suggested by the National Research Council (2006): 1) data reliability, 2) spatial
reasoning, and 3) problem-solving validity. Students’ interviews were assessed
quantitatively and qualitatively. For the quantitative analysis, students’ responses were
assessed using a rubric developed for this study (APPENDIX D). For the qualitative
analysis, students’ interviews were evaluated through thematic analysis. This section
reports the results of both quantitative and qualitative analyses. The first part discusses
how the current study established inter-rater reliability. Since the CSTOT was an oral
test, it was necessary to investigate if the assessment was subject to grader bias. Then,
the results of quantitative and qualitative analyses concerning the CSTOT are described.
Inter-rater Reliability
In assessing qualitative data, the establishment of inter-rater reliability is
significant to confirm that assessment was not biased by graders (Lombard, Snyder-
Duch, and Bracken 2002; Neuendorf 2002). After competing interviews using the
CSTOT, the interviews were transcribed. Then the transcriptions were assessed by three
graders, including the current researcher and two graduate students in the Department of
Geography at Texas A&M University. Krippendorff’s alpha was computed as a measure

131
of inter-rater reliability (Table 30). The cutoff value of Krippendorff’s alpha is .67
(Krippendorff 2004a). Thus, the result in Table 30 indicates that the assessment was not
biased.
Table 30. Krippendorff’s alpha for the three dimensions of critical spatial thinking. Data reliability Spatial reasoning Problem-solving validity Alpha value .743 .683 .713
Quantitative Analysis of the CSTOT by Dimension
Students’ interviews were transcribed upon the completion. The transcribed
interviews were assessed based on the rubric developed for this study (APPENDIX D).
As mentioned previously, the CSTOT consisted of three sub-dimensions: 1) data
reliability, 2) spatial reasoning, and 3) problem-solving validity. These three dimensions
were analyzed separately. The following sections describe the results of the assessment
on each of these three dimensions.
Data Reliability
The sub-dimension of data reliability tests whether students understand that the
accuracy or reliability of a dataset can vary depending on data sources or data collection
procedures. The analysis of students’ responses regarding this dimension is presented in
Table 31. A paired sample t-test found that only the GIS students improved their
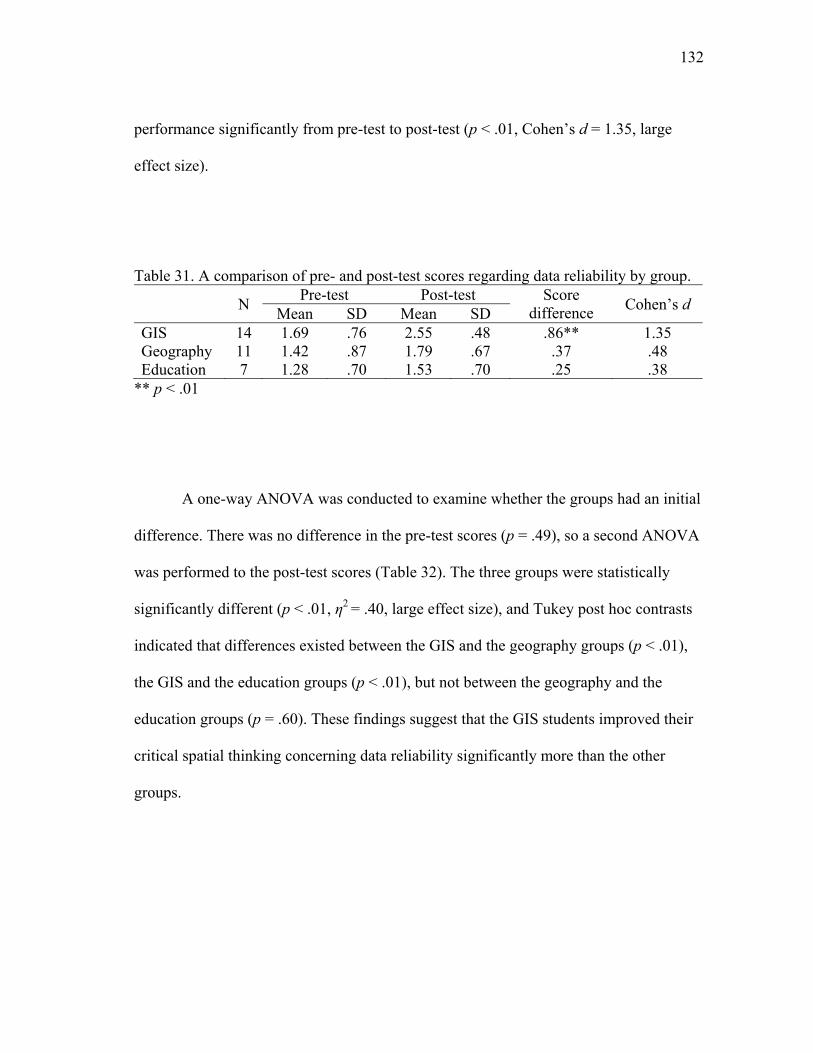
132
performance significantly from pre-test to post-test (p < .01, Cohen’s d = 1.35, large
effect size).
Table 31. A comparison of pre- and post-test scores regarding data reliability by group.
N Pre-test Post-test Score
difference Cohen’s d
Mean SD Mean SD GIS 14 1.69 .76 2.55 .48 .86** 1.35 Geography 11 1.42 .87 1.79 .67 .37 .48 Education 7 1.28 .70 1.53 .70 .25 .38
** p < .01
A one-way ANOVA was conducted to examine whether the groups had an initial
difference. There was no difference in the pre-test scores (p = .49), so a second ANOVA
was performed to the post-test scores (Table 32). The three groups were statistically
significantly different (p < .01, η2 = .40, large effect size), and Tukey post hoc contrasts
indicated that differences existed between the GIS and the geography groups (p < .01),
the GIS and the education groups (p < .01), but not between the geography and the
education groups (p = .60). These findings suggest that the GIS students improved their
critical spatial thinking concerning data reliability significantly more than the other
groups.

133
Table 32. ANOVA of post-test scores regarding data reliability by group. Source SS df MS F p η2 Between groups 6.14 2 3.07 9.89 <.01 .40 Within groups 9.06 29 .31 Total 15.20 31
Spatial Reasoning
The sub-dimension of spatial reasoning examines whether students incorporate
appropriate problem-solving strategies, considering problem contexts. Table 33
summarizes the participant’s performance related to this dimension. Both the GIS and
geography groups improved their performances (p < .01), but the education group did
not improve. However, the magnitude of improvement was much larger in the GIS group
as indicated by the values of Cohen’s d (1.16 and .61, respectively).
Table 33. A comparison of pre- and post-test scores regarding spatial reasoning by group.
N Pre-test Post-test Score
difference Cohen’s d
Mean SD Mean SD GIS 14 1.60 .46 2.29 .70 .69** 1.16 Geography 11 1.00 .60 1.40 .70 .40** .61 Education 7 .86 .61 .76 .63 -.10 .16
** p < .01
ANOVA was conducted with the pre-test scores to examine whether an initial
difference existed among groups. The scores of the three groups were statistically
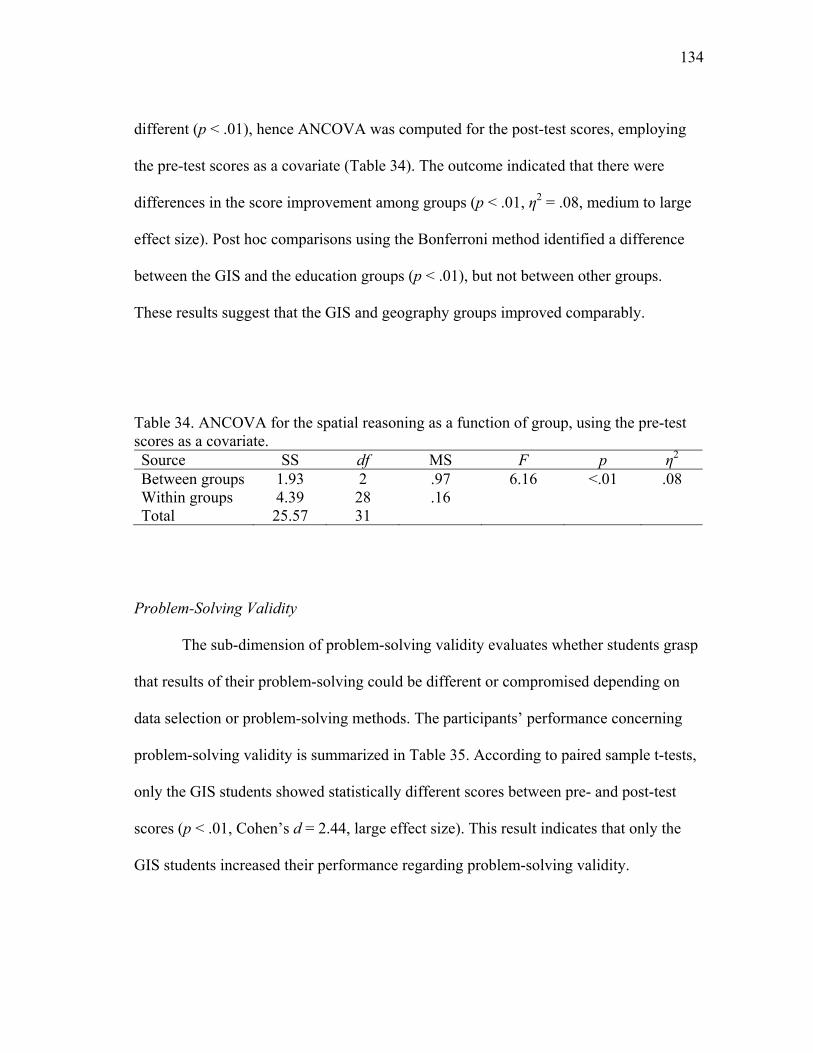
134
different (p < .01), hence ANCOVA was computed for the post-test scores, employing
the pre-test scores as a covariate (Table 34). The outcome indicated that there were
differences in the score improvement among groups (p < .01, η2 = .08, medium to large
effect size). Post hoc comparisons using the Bonferroni method identified a difference
between the GIS and the education groups (p < .01), but not between other groups.
These results suggest that the GIS and geography groups improved comparably.
Table 34. ANCOVA for the spatial reasoning as a function of group, using the pre-test scores as a covariate. Source SS df MS F p η2 Between groups 1.93 2 .97 6.16 <.01 .08 Within groups 4.39 28 .16 Total 25.57 31
Problem-Solving Validity
The sub-dimension of problem-solving validity evaluates whether students grasp
that results of their problem-solving could be different or compromised depending on
data selection or problem-solving methods. The participants’ performance concerning
problem-solving validity is summarized in Table 35. According to paired sample t-tests,
only the GIS students showed statistically different scores between pre- and post-test
scores (p < .01, Cohen’s d = 2.44, large effect size). This result indicates that only the
GIS students increased their performance regarding problem-solving validity.
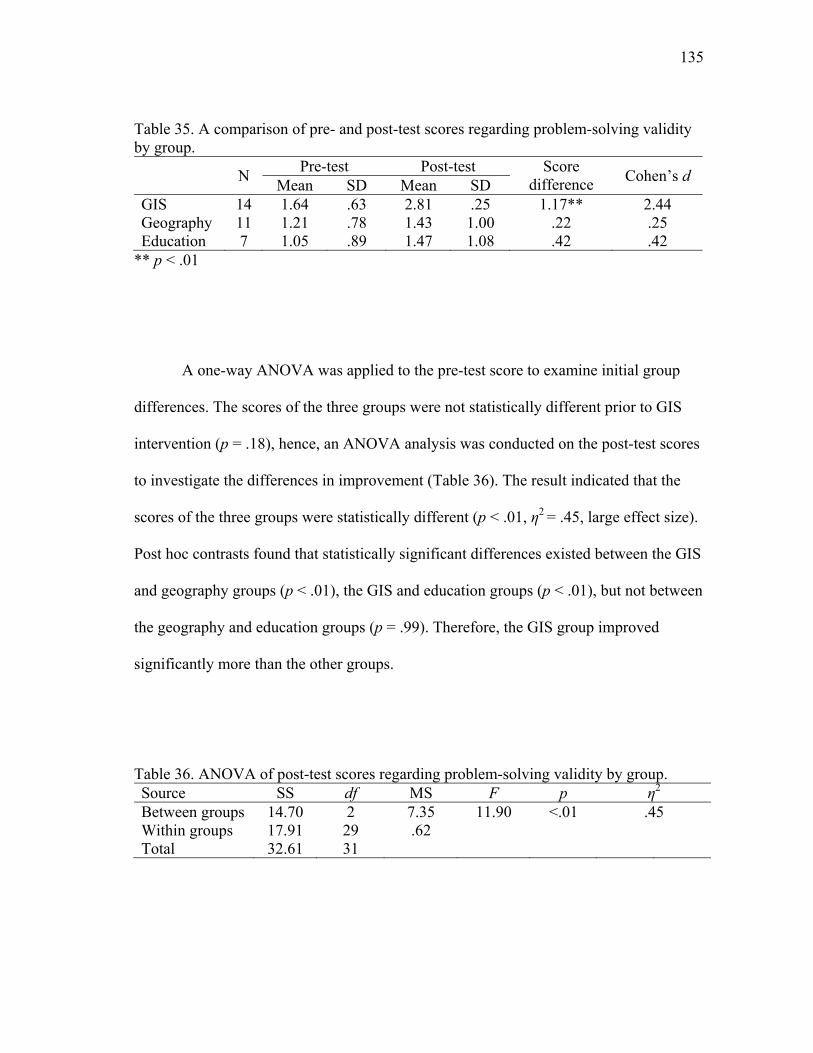
135
Table 35. A comparison of pre- and post-test scores regarding problem-solving validity by group.
N Pre-test Post-test Score
difference Cohen’s d
Mean SD Mean SD GIS 14 1.64 .63 2.81 .25 1.17** 2.44 Geography 11 1.21 .78 1.43 1.00 .22 .25 Education 7 1.05 .89 1.47 1.08 .42 .42
** p < .01
A one-way ANOVA was applied to the pre-test score to examine initial group
differences. The scores of the three groups were not statistically different prior to GIS
intervention (p = .18), hence, an ANOVA analysis was conducted on the post-test scores
to investigate the differences in improvement (Table 36). The result indicated that the
scores of the three groups were statistically different (p < .01, η2 = .45, large effect size).
Post hoc contrasts found that statistically significant differences existed between the GIS
and geography groups (p < .01), the GIS and education groups (p < .01), but not between
the geography and education groups (p = .99). Therefore, the GIS group improved
significantly more than the other groups.
Table 36. ANOVA of post-test scores regarding problem-solving validity by group. Source SS df MS F p η2 Between groups 14.70 2 7.35 11.90 <.01 .45 Within groups 17.91 29 .62 Total 32.61 31

136
Qualitative Evidence Regarding the Improvement of Critical Spatial Thinking
The previous section quantitatively demonstrated that GIS learning is beneficial
for enhancing students’ critical spatial thinking. This section qualitatively describes
participants’ improvement in critical spatial thinking. Through thematic analysis, several
themes which supplement the quantitative findings were identified. Excerpts supporting
the identified themes are provided and these are contrasted with excerpts showing
students’ misunderstanding or poor performance. Moreover, to compare students’
interview responses to their scores on the SCST, their post-test scores were divided into
three clusters: highest 30 percent (high cluster), middle 35 percent (middle cluster), and
lowest 35 percent (low cluster). The information regarding each student’s cluster is also
provided.
Enhanced Understanding Concerning Data Reliability
After taking the GIS course, students’ understanding of data reliability improved.
The participants in the GIS course considered reliable data collection methods or data
sources more carefully in the post-test than in the pre-test. For example, some students in
the GIS group understood that triangulation or cross-checking a dataset against other
sources can be a way to ensure data reliability (one excerpt from the high cluster and the
second from the middle cluster follow).
Well, if several different people collected data, just cross-check to see whether they are close to each other, they agree with each other.
If I can find different data sources are reporting the same numbers, I think that means the data are accurate.

137
Other students in the GIS course considered the quality of data collection procedures. If
data were collected using consistent procedures, the student was more inclined to
consider data reliable. The following excerpt is a response from a high-cluster student.
I guess it goes down to the level of how they collected data. If they used constant methods across, [the data would be reliable and can be compared]. If they used different methods for each data, then, you can’t really overlap them.
Above all, one of the most noticeable changes in students’ responses was their
consideration regarding reliable data sources. For example, one student from the high
cluster in the GIS course mentioned a specific data source for elevation data used in
Critical Question 1.
Anything coming out of the major university or organization like USGS or other government labs has credibility.
Another student from the same cluster in the GIS course showed her consideration
concerning reliable data sources as follows (I: Interviewer, P: Participant).
I: If you need to use this kind of elevation data for your class project or other purpose, you can collect data from various sources, such as books, documents, online, and so on. In this case, what would be your criterion to judge that this dataset is reliable or credible? P: Who collected data, like government database is pretty credible. If it’s a random organization, it might not be very accurate. I: Can you think of any specific government agencies? P: [For example], USGS, TRI, or something like that.
This participant understood that some agencies were more reliable data sources than
others. To be specific, government agencies or data provided by universities are
generally believed to be credible. However, different government agencies have
different areas of expertise, and some of them can provide more accurate data than

138
others. Therefore, knowing concrete and appropriate data sources (e.g., USGS in the
excerpt above) is crucial.
The responses described above were selected mostly from the GIS students who
have high scores. Very few students in the other two groups, however, showed a good
understanding regarding data-source reliability. Some students simply mentioned
“geographer,” “geologist,” “meteorologist,” “surveyor,” or “contractor” as reliable data
sources, but most of these students could not describe why these people were credible. In
addition, many students in the control groups said “I don’t know,” “I have no idea,” or “I
am not sure.” These results suggest that only GIS learning helped students develop a
better understanding of data reliability.
Informed and Explicit Use of Spatial Concepts and Vocabulary
GIS students showed more advanced and frequent use of spatial concepts and
related vocabulary. For instance, some students incorporated the concept of scale
explicitly. The following student from the high cluster in the GIS group recognized that
when solving a problem (Critical Question 2), it is necessary to check whether maps are
the same scale in order to compare them.
I: In terms of each map, do you have any issues? For example, this map could be misleading or distorted in this case. P: It would be inaccurate in picking up potential facility locations if the maps were in different scales. I: You mean the three maps should have the same scale? P: Yeah, that would affect the way we would look at them.
139
In addition, some participants considered how different scales can affect information
displayed on those maps (Critical Question 3). The following excerpt describes one
example from the high cluster in the GIS course.
Because you zoom into a county, having the whole county one color isn’t telling you so much, when you have a larger scale, more detail, the purpose of having a larger scale map, so you have the data broken down by census tract, neighborhood, school district, maybe.
Another GIS student made a similar observation in Critical Question 3. This student did
not score high on the SCST either in pre- and post-tests (middle cluster), but
appropriately applied the concept of scale.
I: If you see this map, there are basic area units like these. Here, one unit is represented by this one color, meaning one value. Can you find any problem or distortion that might happen when you represent the real world this way? P: It’s a scale issue, right? If I don’t know what is going on in this county, I cannot put the county into one color.
A few other examples of the use of spatial concepts included the notion of buffer.
GIS students recognized that a colored area in Critical Question 2 represented buffers,
and further evaluated whether the buffer was appropriate. The following excerpts were
selected from the high cluster GIS students.
They could be more specific as far as elevation, but I don’t know about the electric line whether there would be much difference if they show more buffer or less. Having [buffer] in a computer [program], you can put different layers on top of each other. ArcGIS, for example, say, within a buffer, elevation is less than [200 feet] in spatial query, it will show the area that fits best. Instead of 20 feet, having 10 feet would be a better idea. A buffer zone looks good. I like the colors the way they show the buffer zones.
140
The concept of projection was also used by some high cluster GIS students. They
grasped that if a map was not produced using a proper projection, distortion might occur.
A projection of a map might be wrong, so you could have a better projection, and it would not distort things. If the data wasn’t accurately projected onto the map, the map wasn’t accurate in terms of data representation.
Several students used other GIS-related concepts and terms such as attribute.
These participants understood conditions of a problem as attributes of GIS analyses. The
following describes one excerpt (high cluster) from Critical Question 2.
I: Would you describe your problem solving strategies? P: I think this is a kind of an attribute problem. OK, it has to be within 60 feet, so you get this area, so it narrows down some of the points. And then, you look at that elevation. I: You mentioned this as an attribute problem. What do you mean by attribute? P: Just like a characteristic of data. It’s near to something, and then you can find locations on the map.
As described above, GIS students used spatial terms explicitly in their responses.
The only exceptions in the control groups were two geography students who mentioned
the concept of scale in their interviews. The concepts of buffer, projection, and attribute
were used exclusively by GIS students. This finding supports the assertion that GIS
learning contributes to the development of spatial concept and related vocabulary.
Evaluation of Problem Contexts
The students who completed the GIS course developed their critical spatial
thinking regarding problem contexts. For example, in Critical Question 2, students were
141
asked to find the best location for a flood management facility using criteria specified in
the problem. However, critical spatial thinkers evaluated the criteria instead of simply
using them as given. For example, one participant from the high cluster in the GIS
course stated the following.
A flood management facility, it would need power depending on what it is doing. It would be cost effective within 60 feet to power the location rather to run more cables. As far as elevation, because the river is at 200 feet, maybe they wanted to be sure it does not get flooded, but if so, why have an upper limit instead of a lower limit for the flooding? As far as the state park and public land, land acquisition, you would not want to have private land from private owners because it’s much more expensive.
This participant justified the criteria related to the distance from an existing electric line
and types of land on which the facility would be built. However, the participant critiqued
the condition for elevation because the facility should have a lower limit to prevent it
from flooding. That is, the criterion should be worded, for example, in the following
way: “The facility should be located more than 220 feet in order for it not to be flooded.”
In this way, the student critically interpreted problem criteria. Many students in the
control groups, however, could not critically evaluate these problem contexts. Those
students replied to the questions as follows: “I think they are good enough,” “I am not
quite sure why it should be in state park or public land,” “That’s true.” These responses
show that they did not think critically about the conditions in the problem.
In addition, land classification is a debatable issue when producing a map. The
land use map in Critical Question 2 was created using one type of land classification
scheme. The map divided the land into state park, public land, private land, and military
base. A different map could employ a different scheme. Students had better

142
understanding concerning this issue after taking the GIS course as the following excerpt
reveals:
When it comes to a border line, some people might still consider it a state park, some people would consider it as public land. That is, different people might have different ways of viewing the line coverage. That’s what I am thinking. Some distortion might happen [depending on] who collected data. To me, it could be still a park, but others might [think], no, it’s like something else.
This student knew that “clear” border lines in the map in fact are not absolute. That is,
land use in the real world may not be as clear as the map represents. A map is a
representation interpreted by a map maker. A critical spatial thinker should comprehend
this nature of maps. One interesting fact about this excerpt is that it came from a student
in the low cluster, but she showed enhanced critical spatial thinking. The scores of the
SCST and CSTOT tended to be highly correlated, but this student’s scores represented
an exception. Some insufficient answers concerning land classification in the control
groups included the following: “Not really, it’s pretty straightforward,” “It looks clear to
me. I didn’t have any problem understanding it,” “I think the map is pretty accurate,” “I
believe I don’t understand.” These students could not understand that maps are only
representations of the world, and therefore, can sometimes mislead readers.
Data classes used on a map can also be an issue because they can mislead
readers. Maps in Critical Question 3 were made based on a specific classification
scheme. Different map patterns can be produced if a cartographer selects a different data
classes. One of the students from the high cluster in the GIS course described this issue.
You can manipulate the data. Here, there is 4 percent and here 6 percent, but in the last category, it is 15 percent. Map patterns can be biased because of a data class. It looks like that there are a lot of less educated people because of a bigger

143
range. It could be more accurate or less accurate, depending on different types of classes.
Some students understood that changing data classes influences map patterns, but they
could not elaborate in a way similar to the excerpt above. For example, a high-cluster
geography student stated that “it [different data class] would definitely change this
distribution.” However, this student could not support her thinking with a more detailed
explanation. In addition, more students in the control groups were unaware of this
problem. These students said “I don’t know” or “I have no idea.”
The improvement in GIS students might have occurred because GIS enables
researchers to select data classes from various options, including natural break, equal
interval, etc. Map patterns can be different depending on the selected classification. A
critical spatial thinker should consider this. The following excerpt describes one GIS
student from the middle cluster who evaluated this problem.
The distribution depends on the type of break they use. I don’t know what kind of breaks they used for this map, but anyway this will affect the way the map is represented.
Use of Tools for Problem-Solving
The students in the GIS group explicitly expressed their intention or capability to
use geospatial tools such as GIS in spatial analysis. This finding suggests that GIS
learning helped them widen their problem-solving capabilities. Students knew that their
problem-solving could be improved using GIS functionality. This understanding
indicates that GIS students are aware of various problem-solving methods and
comprehend the strengths and weaknesses of different problem-solving strategies. The

144
following quotes show some examples (the first two from the high cluster and the last
one from the middle cluster).
If you need coordinates for all the electric posts, you just need to put it in ESRI or GIS buffer zones.
If I could use ArcGIS, I would be able to take these different layers overlaid on top of each other, which would be a lot easier than just looking at the four maps. Maybe you could layer them. You can use GIS, if you put them on top of each other, it would be much easier to visualize them, and it would give you other options for the locations.
However, none of the students in the control groups said that they could use GIS
to improve their problem-solving. These students did not have knowledge of GIS and
did not know how to incorporate GIS to improve their problem-solving because they
were unfamiliar with the capabilities and operation of GIS.
A few students in the control groups stated that they could use tools such as
rulers to enhance their problem-solving. For example, one participant in the geography
group (middle cluster) responded that she could make her problem-solving more
accurate if she used a ruler to draw contour lines. However, the introduction of tools
does not necessarily mean the improvement of problem-solving as the following excerpt
describes:
I: Do you have any ideas to improve your contour line drawing? P: If I have tools like rulers or something, I could improve my line drawing. I: If you have a ruler, how can you use it? P: I did this [contour map construction] by free hand-drawing, so [it is] very sloppy. If I have a ruler, these lines would be more accurate because I can draw lines straight.
145
The student above wanted to use a ruler to draw contour lines more neatly. That is, she
intended to use a ruler to draw lines straighter, not to measure intervals between lines
more accurately.
In summary, thematic analysis using students’ interview transcriptions
supplemented and confirmed quantitative findings reported in the previous section. The
thematic analysis identified four themes in students’ responses: 1) enhanced
understanding concerning data reliability; 2) informed use of spatial concepts and
vocabulary; 3) evaluation of problem contexts; and 4) use of tools for problem-solving.
These themes demonstrated that students developed critical spatial thinking. These
themes are closely associated with the three sub-dimensions of critical spatial thinking.
To be specific, enhanced understanding regarding data reliability and source, of course,
is related to the data reliability sub-dimension. The informed use of spatial concepts will
support spatial reasoning which is the second sub-dimension of critical spatial thinking.
Critically evaluating problem contexts and incorporating GIS functions for problem-
solving would be related to the evaluation of the third sub-dimension, problem-solving
validity.

146
Relationships among the Three Components of Spatial Literacy
This study identified three components of spatial literacy. The previous sections
discussed the effects of GIS learning on these components individually. This section
investigates how these components are related each other.
To begin with, Pearson’s correlation coefficients were calculated, using the pre-
and post-test scores of spatial habits of mind (Hpre and Hpost), spatial concepts and
skills (Cpre and Cpost), and critical spatial thinking (Cripre and Cripost). The results are
summarized in Table 37, and Figure 5 presents scatter plots of these relationships. There
is no golden rule of thumb regarding the magnitude of meaningful correlation. However,
|rxy| ≥ 2/√n (n = sample size) can be a rule to judge whether the magnitude of correlation
between two variables is substantial, given the correlation coefficient is statistically
significant (Newbold, Carlson, and Thorne 2003; Krehbiel 2004). According to this rule,
a coefficient greater than .35 (n = 32) can be considered as a meaningful relationship in
the context of this study. The coefficients in Table 37 indicate that most pairs are
meaningfully interrelated.
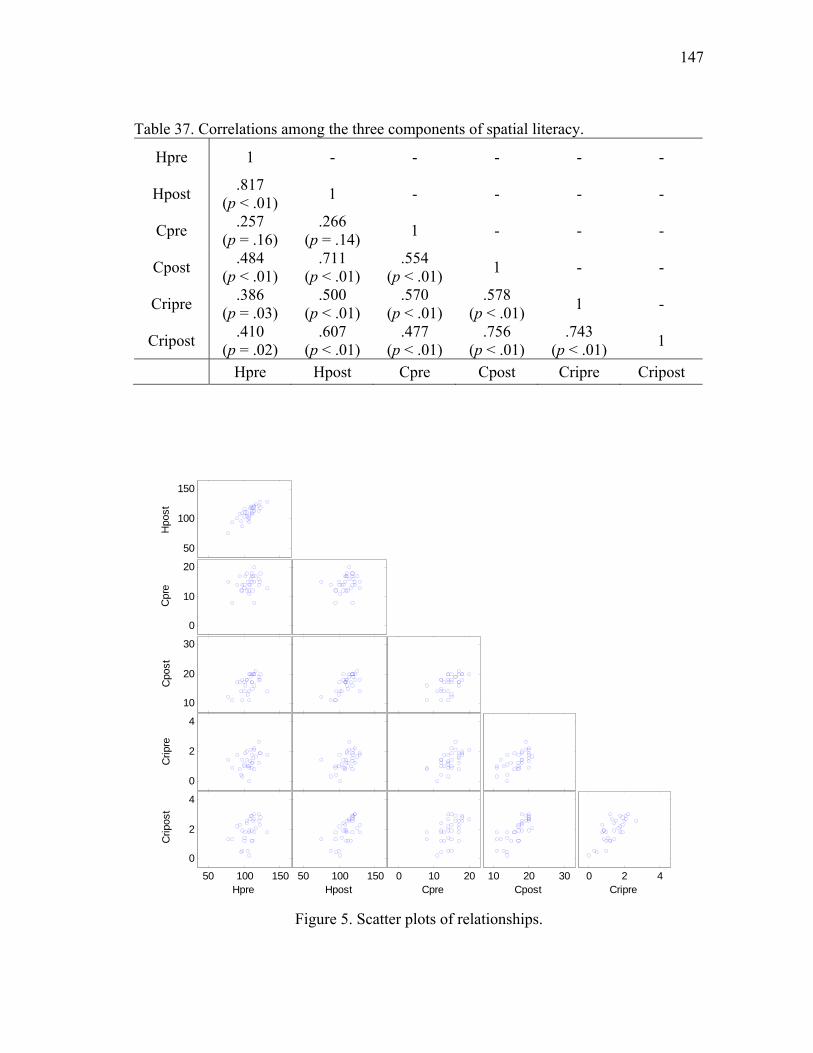
147
Table 37. Correlations among the three components of spatial literacy.
Hpre 1 - - - - -
Hpost .817
(p < .01) 1 - - - -
Cpre .257
(p = .16) .266
(p = .14) 1 - - -
Cpost .484
(p < .01) .711
(p < .01) .554
(p < .01) 1 - -
Cripre .386
(p = .03) .500
(p < .01) .570
(p < .01) .578
(p < .01) 1 -
Cripost .410
(p = .02) .607
(p < .01) .477
(p < .01) .756
(p < .01) .743
(p < .01) 1
Hpre Hpost Cpre Cpost Cripre Cripost
0 2 4Cripre
10 20 30Cpost
0 10 20Cpre
50 100 150Hpost
50 100 150
0
2
4
Hpre
Crip
ost
0
2
4
Crip
re
10
20
30
Cpo
st
0
10
20
Cpr
e
50
100
150
Hpo
st
Figure 5. Scatter plots of relationships.

148
Pearson’s correlation coefficient examines the relationship between two
variables. To investigate the relationship among the three components simultaneously, a
3D scatter plot, termed “score space” in this study, was created (Figure 6). Figures 7, 8,
and 9 show 2D plots from each of the 3D perspectives.
Each participant from the experimental and two control groups was positioned in
the score space based on his/her scores of the three tests (x, y, z values in each axis) –
red color (GIS group), blue color (Geography group), and green color (Education group).
A participant with high scores in all the three components of spatial literacy is positioned
in the upper right side with a long drop line. A visual investigation of the score space
indicates that overall the three scores are interrelated. Participants are located following
a rough line from lower left sides to upper right sides. Group differences are also found.
The GIS students are mostly positioned in the upper right side with long drop lines,
meaning that those students scored higher on the three tests than the other students. The
two control groups tended to score lower than the GIS students. Figures 7, 8, and 9
support this interpretation.

149
7080
90100
110120
130
1012
1416
1820
220
0.5
1
1.5
2
2.5
3
HpostCpost
Crip
ost
GISGeoEdu
Figure 6. 3D scatter plot of the three scores with drop line (score space).
70 80 90 100 110 120 13011
12
13
14
15
16
17
18
19
20
21
Hpost
Cpo
st
GISGeoEdu
Figure 7. 2D scatter plot of two scores (spatial habits of mind and spatial concepts).

150
70 80 90 100 110 120 1300
0.5
1
1.5
2
2.5
3
Hpost
Crip
ost
GISGeoEdu
Figure 8. 2D scatter plot of two scores (spatial habits of mind and critical spatial thinking).
11 12 13 14 15 16 17 18 19 20 210
0.5
1
1.5
2
2.5
3
Cpost
Crip
ost
GISGeoEdu
Figure 9. 2D scatter plot of two scores (spatial concepts and critical spatial thinking).
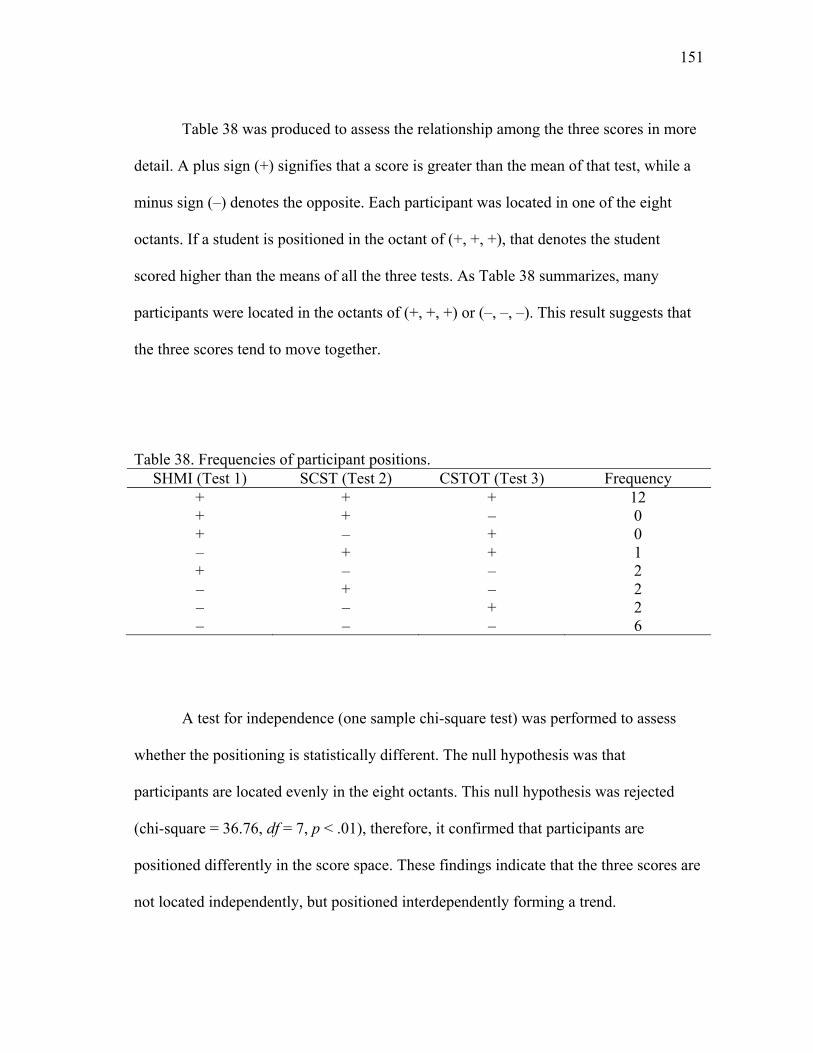
151
Table 38 was produced to assess the relationship among the three scores in more
detail. A plus sign (+) signifies that a score is greater than the mean of that test, while a
minus sign (–) denotes the opposite. Each participant was located in one of the eight
octants. If a student is positioned in the octant of (+, +, +), that denotes the student
scored higher than the means of all the three tests. As Table 38 summarizes, many
participants were located in the octants of (+, +, +) or (–, –, –). This result suggests that
the three scores tend to move together.
Table 38. Frequencies of participant positions. SHMI (Test 1) SCST (Test 2) CSTOT (Test 3) Frequency
+ + + 12 + + – 0 + – + 0 – + + 1 + – – 2 – + – 2 – – + 2 – – – 6
A test for independence (one sample chi-square test) was performed to assess
whether the positioning is statistically different. The null hypothesis was that
participants are located evenly in the eight octants. This null hypothesis was rejected
(chi-square = 36.76, df = 7, p < .01), therefore, it confirmed that participants are
positioned differently in the score space. These findings indicate that the three scores are
not located independently, but positioned interdependently forming a trend.

152
Exploratory factor analysis was also conducted. Principal components analysis
(Varimax rotation) extracted only one factor whose eigen-value was 2.39, which is
greater than the cutoff criterion of 1.0. Furthermore, the extracted factor accounted for
79.5 percent of variance; one factor explained a significant portion of the total variance.
That is, the three scores were accounted for by one common factor substantially.
In conclusion, the visual inspection and the results of the independence test,
exploratory factor analysis support the assertion that the three scores tend to move in a
similar direction. Thus, the three components of spatial literacy are interrelated.

153
CHAPTER V
DISCUSSION AND CONCLUSIONS
This chapter interprets research findings described in Chapter IV. The chapter
discusses analysis outcomes, following the order of research questions, and concludes
with a summary and recommendations for future research. As described in Chapter I, the
research questions for this study are:
1. Will GIS learning affect students’ spatial habits of mind?
a. Will the completion of a GIS course, a geography course, or a non-
geography-related course have the same effects on college students’
spatial habits of mind?
b. Will the effects of a GIS course on spatial literacy be the same for
males and females? Is there a correlation between spatial habits of mind
and participants’ academic majors?
2. Will GIS learning affect students’ spatial concepts and thinking skills?
a. Will the completion of a GIS course, a geography course, or a non-
geography-related course have the same effects on college students’
understanding and use of spatial concepts and thinking skills?
b. Will the effects of a GIS course on spatial literacy be the same for
males and females? Is there a correlation between the use and
understanding of spatial concepts and thinking skills and participants’
academic majors?

154
3. Will GIS learning affect students’ critical spatial thinking?
a. Will the completion of a GIS course, a geography course, or a non-
geography-related course have the same effects on college students’
critical spatial thinking?
b. What qualitative differences in critical spatial thinking will be found in
college students who completed a GIS course by comparing pre- and
post-interview responses?
4. Are the three components of spatial literacy interrelated? If so, what is the
nature of the relationship(s) between them?
Research Question 1a
Will the completion of a GIS course and that of a geography course or a
non- geography-related course have the same effects on college students’ spatial
habits of mind?
The first research question investigated whether after completing a GIS course,
students improved their spatial habits of mind defined as pattern recognition, spatial
description, visualization, spatial concept use, and spatial tool use. A spatial habit of
mind inventory (SHMI), which was developed for this study, was used to investigate the
first research question. When considering the overall scores that include all the sub-
dimensions, the GIS students improved their spatial habits significantly more than the
students in the other groups. This result was demonstrated by ANCOVA statistics and
following Bonferroni post hoc contrasts. When the improvement was explored by

155
dimension, GIS students improved their scores in all the sub-dimensions except for
spatial tool use.
Therefore, the results of this study indicate that completing a GIS course helped
students enhance their spatial habits of mind. Because the spatial habits of mind
inventory was a self-assessment instrument, it is not likely that test-retest effect
significantly affected students’ performance. That is, knowing the questions probably
did not change students’ self-ratings because self-assessment does not measure objective
knowledge. However, one caution that needs to be exercised in this conclusion is that the
magnitude of effect size (eta-squared) was relatively small (η2 = .03). The value lies in
the range of small to medium effect size (Huck 2008). Hence, further research is
necessary to assess the practical significance of completing GIS courses on
improvements in students’ spatial habits of mind.
This study found that GIS learning experiences contributed to promoting
students’ spatial habits of mind. The nature of learning in a GIS course should be
expected to facilitate the development of spatial habits of mind. Holland (1959) argued
that positive experiences lead to an increased interest in and preference for a related
domain, and in turn, enhanced interest generates more inclination to learn related topics.
Through this process, a “positive loop” is established (Ackerman et al. 2001). Similarly,
Hsi, Linn, and Bell (1997) found that positive experiences in spatial problem-solving
enhanced students’ confidence in a spatial domain (e.g., engineering). Practice and
experience related to spatial performance made students believe that they exercised
everyday spatial behaviors more successfully (Quaiser-Pohl and Lehmann 2002).

156
In a GIS course, students typically engage themselves in activities that are related
to spatial habits of mind. For example, GIS learning can be connected to the five sub-
dimensions of spatial habits of mind in the following ways. First, in GIS courses,
students are frequently exposed to a variety of spatial representations such as maps and
remote sensing imagery, and subsequently, they are involved in activities that require
them to recognize and interpret patterns in those representations. It is reasonable to
expect that these activities foster the habit of recognizing spatial patterns in various
contexts. Second, students in a GIS course are expected to learn and use spatial
vocabulary more frequently than in other classes. The nature of the GIS course, which
typically includes spatial theory and spatial analyses as a significant part of the course
content, inevitably requires students to learn and use spatial vocabulary. These
experiences help students establish the spatial habit of understanding and using spatial
terminology (Bednarz and Bednarz 2008). Third, GIS is a powerful tool for visualizing
information, converting invisible data into visible forms (Hearnshaw and Unwin 1994;
Harvey 2008). Thus, through GIS learning, students gain an understanding of the power
and usefulness of visualization. This enables them to apply visualization strategies in
diverse contexts. Fourth, GIS is based on fundamental spatial concepts. As the definition
of GIS has been extended to GIS as a science (Goodchild 1992; Rhind 1992; Abler
1993; Dobson 1993; Goodchild 2004), GIS courses have begun to include a wider range
of basic spatial concepts. Students understand that spatial concepts are the building
blocks of GIS functions. Hence, GIS learning can be expected to help students use
spatial concepts more frequently. Finally, GIS is a spatial tool. GIS students learn the
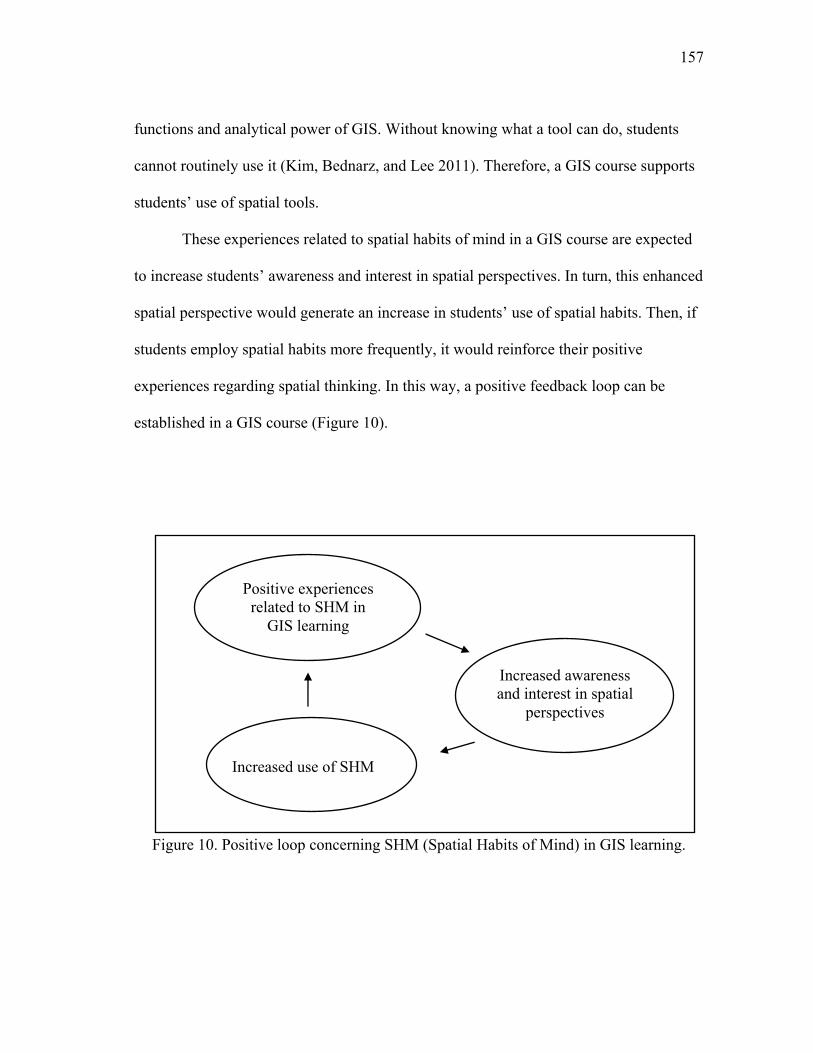
157
functions and analytical power of GIS. Without knowing what a tool can do, students
cannot routinely use it (Kim, Bednarz, and Lee 2011). Therefore, a GIS course supports
students’ use of spatial tools.
These experiences related to spatial habits of mind in a GIS course are expected
to increase students’ awareness and interest in spatial perspectives. In turn, this enhanced
spatial perspective would generate an increase in students’ use of spatial habits. Then, if
students employ spatial habits more frequently, it would reinforce their positive
experiences regarding spatial thinking. In this way, a positive feedback loop can be
established in a GIS course (Figure 10).
Figure 10. Positive loop concerning SHM (Spatial Habits of Mind) in GIS learning.
Positive experiences related to SHM in
GIS learning
Increased awareness and interest in spatial
perspectives
Increased use of SHM
158
As expected, the GIS students in this study improved their spatial habits of mind
concerning pattern recognition, spatial description, visualization, and spatial concept use.
However, the sub-dimension, spatial tool use, was an exception. After completing the
course, the participants did not think that they used spatial tools more frequently than
they did prior to the GIS intervention. There are several potential explanations for this.
First, taking one GIS course might not be sufficient to make students feel that they are
using geospatial technologies more often. Second, GIS students had high scores on the
spatial tool use dimension on the pre-test. The average score was 20.56 out of 25,
therefore, it might have been difficult for them to improve scores because of the ceiling
effect (McMillan and Schumacher 2001). Third, it is possible that participants did not
understand items in the spatial habits of mind inventory clearly. Even though the
inventory was reviewed several times by undergraduate and graduate students during test
development, it is possible that the participants had difficulty matching their level of
performance with the meaning of the items. Finally, students’ understanding of the
definition of spatial tools may have been quite broad. In fact, the inventory of spatial
habits of mind indicated GPS as one type of spatial tool. Even though a student thinks
that he/she uses GIS-related tools more frequently after completing the GIS course, the
person may think that their use of the broader range of spatial tools has not fully
developed. If so, a participant might not rate his/her habit of using spatial tools higher on
the post-test than in the pre-test.
In short, GIS learning made students feel that they employed spatial perspectives
more frequently. The improvement was statistically significant only for the GIS group.
159
Therefore, research question 1a was supported. However, the lack of improvement in
spatial tool use requires further research. Moreover, the findings do not support the
practical significance of a GIS course on improving spatial habits of mind.
Research Question 1b
Will the effects of a GIS course be the same for males and females? Is there
a correlation between spatial habits of mind and participants’ academic majors?
Research question 1b explored whether gender and academic major affected
changes in students’ spatial habits of mind. For the GIS group, no gender differences
were found in either the pre- or post-test scores. However, interestingly, gender
differences were found in the control groups. This result may have been affected by
academic majors of participants. The participants in the GIS group were mostly
geography or geography-related spatial majors, while those in the control groups were
not. More specific interpretations follow.
In the GIS group, when students’ scores of spatial habits of mind were compared
collectively, including all the sub-dimensions, no gender differences were found for both
pre- and post-tests (p = .42, p = .40, respectively). This pattern was maintained when
students’ performance was compared by dimension. No sub-dimension achieved a
statistically significant difference by gender. These findings indicate that at least in the
GIS group, gender did not play a significant role in students’ self-rated spatial habits of
mind.
160
Even though no gender differences existed, both males and females improved in
their assessment of spatial habits of mind from the pre-test to the post-test (p < .01, p <
.01, respectively). When considering the improvement of spatial habits by dimension,
however, some variations appeared. Males thought that they developed spatial habits of
mind in the sub-dimensions of pattern recognition, spatial description, visualization, and
spatial concept use after completing the GIS course, while females thought they
improved only in two sub-dimensions, pattern recognition and spatial description. In
particular, the improvement in pattern recognition was dramatic (Cohen’s d = .97, large
effect size).
Overall, females seem to be more conservative in judging their ability and
improvement. Females did not rate their spatial habits as highly in most sub-dimensions
as males did. They rated themselves highly in only two sub-dimensions, pattern
recognition and spatial description. Baker (2002) reported similar findings that female
students did not rate their attitude and self-efficacy toward science and technology after
GIS instruction as highly as male students who thought they improved in all of these
traits. Females’ conservative judgment of their spatial habits or performance may be
interpreted in light of previous studies which found that women showed less confidence
in the evaluation of their self-image or perceived ability (Parsons et al. 1976; Meece et
al. 1982; Vollmer 1986; Quaiser-Pohl and Lehmann 2002). For example, Meece et al.
(1982) reported that female students tend to evaluate themselves as less able in math
even when they, in fact, perform better than male students. Quaiser-Pohl and Lehmann
(2002) found that females rated themselves less competent in their spatial abilities in

161
everyday life, regardless of their actual spatial abilities. In particular, females tend to
think that they are not adept at spatial domains (Furnham, Clark, and Bailey 1999;
Furnham and Rawles 1999; Holling and Preckel 2005). In addition, women are more
influenced by others’ evaluation of them compared to men (Roberts 1991; Roberts and
Nolen-Hoeksema 1994). Roberts and Nolen-Hoeksema (1994) found that females
believe others’ evaluation of them as more accurate than males do, and therefore, are
more influenced by others’ opinions of them. In contrast, men often take an overly
optimistic view concerning their performance without objective grounds (Gitelson,
Petersen, and Tobin-Richards 1982). The participants in this study were asked to self-
assess their spatial habits of mind. Even in a situation where men and women exercise a
similar level of spatial habits, it is likely that women would rate their ability or
improvement less strong. If this interpretation is true, female students’ high rating on
pattern recognition indicates that they indeed feel that their attention to recognizing
patterns in data or information increased significantly as a result of GIS learning.
The result that both genders benefited from taking a GIS course is promising.
However, the findings indicating no gender-based difference in the GIS group are
interesting because previous studies reported that males scored higher on tests for spatial
traits (Battista 1990; Masters and Sanders 1993; Collins and Kimura 1997; Nordvik and
Amponsah 1998; Colom, Quiroga, and Juan-Espinosa 1999; Halpern and LaMay 2000;
Weiss et al. 2003). One noticeable fact about the GIS group was that most participants
were geography, geography-related, or other spatial majors (93 percent). However, in the
other two groups, majors were more diverse. For these groups, gender differences were

162
found. At this point, it is reasonable to hypothesize a relationship between students’
choice of academic major and spatial habits of mind.
Therefore, to investigate the role of academic major on spatial habits of mind in
depth, this study divided participants into three groups: 1) geography or geography-
related majors, 2) spatial majors (e.g., engineering, urban planning, etc.), and 3) non-
spatial majors (e.g., education, journalism, etc.). Since no students were exposed to GIS
learning before the pre-test, the pre-test scores could be used to investigate the effects of
academic majors prior to the intervention. A one-way ANOVA and following post hoc
contrasts indicated that students majoring in geography, geography-related fields, or
other spatial areas scored higher.
This result is consistent with prior research in which self-ratings of participants’
everyday spatial behavior differed depending on academic majors (Quaiser-Pohl and
Lehmann 2002). Quaiser-Pohl and Lehmann reported that students who major in
computational visualistics, a spatial related field, rated their spatial abilities in everyday
life higher. Other researchers have investigated the relationship between students’
learning style and academic major. Kolb (1984) noted that each student has his/her
preferable way of learning, and named it “learning style.” Kolb suggested four types of
learning style: accommodator, diverger, converger, and assimilator. This notion can be
connected to students’ selection of academic major or courses because each discipline
emphasizes different perspectives that are favored differently by each learning style.
Students select academic majors that match with their learning styles, therefore, each
academic discipline tends to have a cluster of students with a dominant learning style
163
(Kolb 1981; Healey and Jenkins 2000). The discipline of geography is not an exception.
Milicich, Stringer, and Heron (2003) reported that geography majors in New Zealand
were mostly assimilators. Similarly, Healey, Kneale, and Bradbeer (2005) found that
geographers in Australia, New Zealand, the UK, and the US were mostly assimilators.
These findings indicate that the choice of an academic major is related to students’
perceptions regarding their performance and/or preferable ways of learning.
However, it is unclear whether the group difference according to academic major
occurred because students in spatial majors were naturally disposed to spatial
perspectives or if they were more influenced by education. Furthermore, in the GIS
group, since most students were geography or other spatial majors, the effects of
academic majors on GIS intervention could not be investigated (sample limitation).
Future research should be carried out to examine if or how a GIS course differently
affects students majoring in different academic subjects.
To summarize, there was no gender difference in spatial habits of mind for
students in the GIS group. This probably occurred because the female students (mostly
geography or geography-related majors) in the GIS group were not representative of the
larger population. As Quaiser-Pohl and Lehmann (2002) reported, students in spatial
fields tend to self-rate their spatial behaviors highly, indicating they are not typical of the
general population. This argument is plausible because gender differences were found
for the two control groups in which students with various majors were included. The
effects of academic major appear to supersede those of gender. Both genders improved
their spatial habits of mind after taking the GIS course, meaning both genders benefited

164
comparably. However, the pattern varied when considering the improvement by
dimension. Female students improved only in the sub-dimensions of pattern recognition
and spatial description, while male counterparts reported improvement in all the
dimensions except for spatial tool use.
Educational Implications: Spatial Habits of Mind
Spatial habits of mind are dispositional aspects of spatial literacy. Because
disposition is an important factor in education (Schunk 2008), it is significant to consider
this aspect in education for spatial thinking. Relatively fewer studies have investigated
the effects of GIS learning on disposition. Thus, the empirical data of this study support
wider pedagogical roles of GIS. The findings in this study provide insight into spatial
education that would be useful for GIS instructors.
Given the findings, GIS educators (more widely, geography education
instructors) should be aware of the differences in spatial habits of mind by males and
females. As previously discussed, males reported their improved spatial habits of mind
after GIS learning in most sub-dimensions, but females thought they improved in only
two sub-dimensions. Therefore, instructors need to develop appropriate teaching
strategies, depending on the gender composition of their classroom.
Moreover, GIS instructors may want to encourage students to employ spatial
perspectives routinely in their everyday life, particularly those who major in non-spatial
subjects. It is interesting to note that academic majors played a role in determining the
level of spatial habits of mind. Students majoring in geography-related or spatial
165
disciplines showed more inclination to adopt spatial perspectives. Even though the GIS
participants in this study were relatively uniform, it is not unreasonable to expect that
other GIS courses would include students of various majors. Therefore, educators should
be aware that different academic backgrounds, which are likely to be a cause of different
levels of spatial disposition, can affect students’ performance in class. This study found
that even prior to GIS intervention, non-spatial majors scored lower in a test measuring
spatial habits of mind. Hence, GIS instructors should consider varying levels of spatial
habits of mind according to academic majors.
Research Question 2a
Will the completion of a GIS course, a geography course, or a non-
geography-related course have the same effects on college students’ understanding
and use of spatial concepts and thinking skills?
Research question 2a investigated whether a GIS course enhances students’
spatial concepts and skills. A test measuring this component, the Spatial Concepts and
Skills Test (SCST), was administered to examine this research question. According to
the results, the GIS course was beneficial for this component of spatial literacy. The
effects were demonstrated by ANCOVA statistics and subsequent post hoc comparisons.
Participants who took the GIS course improved their scores significantly more than
those in the control groups. This study argues that the GIS course played a significant
role in enhancing students’ spatial cognition. Previous studies also found that GIS
activities were beneficial to spatial thinking (Kidman and Palmer 2006; Lee and Bednarz

166
2009). GIS activities such as classifying spatial data, finding patterns, and analyzing
spatial information are directly related to spatial concepts and thinking skills (Lee 2005).
The findings in this study are consistent with these prior studies.
To confirm the effects of a GIS course on spatial cognition, the pretest-posttest
design employed in this study needs further consideration. Campbell and Stanley (1963)
cautioned that other intervening factors can confound outcomes of a pretest-posttest
design: 1) maturation and 2) test-retest effect (“testing” in the language of Campbell and
Stanley). It is unlikely, however, that these two factors are the causes of the students’
improvement in spatial cognition found in this research. First, the time interval between
pre- and post-test in this study, one semester (15 weeks), is unlikely to produce
maturation effects (Hall-Wallace and McAuliffe 2002). Maturation usually is not
significant in a research design conducted over a short period of time (Glass 1965). This
is the case in this study because the participants are college students who are not likely
to mature dramatically in one semester. Second, the test-retest effect is also not expected
to be a problem because no grades or feedback were given to the participants after the
pre-test (Kubiszyn and Borich 2000). Some researchers studied the test-retest effects
under the term of “pre-test sensitization effects.” According to a meta-analysis
conducted by Willson and Putman (1982) to examine pre-test sensitization effects, when
there is an interval of more than one month between pre- and post-test, the influence of a
pre-test was not significant. Hence, the interval between tests in this study, one semester,
is likely to be long enough to prevent pre-test sensitization effects on students’
performance. Therefore, this study argues that the students’ improved spatial thinking

167
skills resulted from completing the GIS course rather than maturation or test-retest
effect.
A paired-sample t-test indicated that the geography students also improved their
understanding of spatial concepts and their thinking skills. This should not be surprising
because the geography course also covered spatial components in the course content,
such as locations of economic activities. However, when the three groups were
considered simultaneously, controlling for the initial difference, only the GIS group
improved significantly. There was no difference in improvement between the geography
and education groups. These findings suggest that a geography course can be beneficial
for enhancing understanding of spatial concepts and thinking skills, but the rate of
improvement is even higher for a GIS course.
In summary, this study demonstrated that GIS and geography learning have
positive influences on students’ spatial concept and thinking skills. However, the extent
of effect was far greater for the GIS course. This finding is consistent with prior studies
in which positive correlations between GIS learning and spatial thinking skills were
found (Hall-Wallace and McAuliffe 2002; Drennon 2005; Lee and Bednarz 2009;
Songer 2010).
Research Question 2b
Will the effects of a GIS course be the same for males and females? Is there
a correlation between the use and understanding of spatial concepts and thinking
skills and participants’ academic majors?

168
This study also investigated if and how different genders and academic majors
affected students’ spatial thinking skills. In the GIS group, there was no gender
difference both in pre- and post-test scores. This finding appears to be related to
academic majors of the GIS students, most of whom were geography, geography-related,
or other spatial majors (93 percent). When scores were compared for the control groups,
gender differences were detected. More specific descriptions follow.
With regard to gender, both in pre-test (p = .70) and post-test (p = .91),
performances by males and females were not statistically different. However, when
scores between pre- and post-test were compared within each gender, both genders
improved their performance. This finding suggests that males and females benefited
comparably by completing the GIS course.
The finding showing no gender difference is intriguing because previous studies
reported that males’ spatial thinking skills are better (Battista 1990; Masters and Sanders
1993; Collins and Kimura 1997; Nordvik and Amponsah 1998; Colom, Quiroga, and
Juan-Espinosa 1999; Halpern and LaMay 2000; Weiss et al. 2003). To explore this
situation, the current researcher looked into majors in the GIS group and found that most
students (93 percent) in the experimental group were geography, geography-related, or
other spatial majors. Because prior studies indicated that academic majors can be an
important factor in spatial performance (Orion, Ben-Chaim, and Kali 1997; Lee 2005),
more analyses were conducted with the participants in the control groups where fewer
students with geography or geography-related academic majors were included. As a
result, in the control groups, gender differences were detected. Males performed better
169
than females both in the geography and education groups. This result suggests that
academic majors can be an important variable in determining students’ spatial cognition.
This finding is consistent with that of spatial habits of mind as previously discussed.
To further examine this interpretation, this study divided the participants into
three groups based on academic majors as in the analyses of spatial habits of mind: 1)
geography or geography-related majors, 2) spatial majors, and 3) non-spatial majors.
Since no student was exposed to a GIS course before the pre-test, GIS learning could be
controlled for the pre-test scores. A one-way ANOVA and following post hoc contrasts
indicated that students majoring in geography or geography-related fields and/or other
spatial majors such as urban planning scored higher. Therefore, the lack of gender
difference in the GIS group may be related to the majors of female students in the group.
Previous studies support this interpretation. Researchers postulated that females in
spatial majors are different from the general female population in spatial ability. For
example, Casey and Brabeck (1989) reported that females majoring in math-science
fields outperformed other women, and furthermore the females showed equivalent
performance in spatial tests to males. Lord and Rupert (1995) conducted research with
elementary education majors. The outcomes indicated that men generally scored higher
than women in standardized spatial tests, but the gender difference disappeared when
analysis was performed for students on science and math tracks. That is, gender
differences were not found in a sample of specific majors that require spatial thinking.
Paying attention to the increasing number of women majoring in science, Lord (1995,
758) argued that “females going to the sciences are at the high end of the spatial aptitude
170
curve for women.” Lord found that females who chose a science-related major
performed much better on spatial tests than both women and men in non-science majors.
Furthermore, those females were equivalent to their male counterparts in some fields of
spatial ability. Orion, Ben-Chaim, and Kali (1997) found no gender differences for
spatial-visualization tests and concluded that the lack of difference resulted from the
sample recruited for their study. Orion, Ben-Chaim, and Kali argued that their female
participants, majors in geology, were not representative of the general population,
because women who major in geology are typically better spatial thinkers. Vincent
(2004) also found no gender difference among GIS students and hypothesized that it was
mainly due to the participants’ majors. Many of the female participants in the Vincent
study were geography majors, so it is reasonable to suppose that they might have had
prior spatial activities or favorable spatial aptitude. Hence, the female participants in the
GIS group may have not been representative of the general female population. However,
further research should be conducted to confirm this interpretation.
In summary, no gender differences both in pre- and post-tests were found in the
GIS group. The result might be associated with the female students’ academic majors.
Most students in the GIS group were spatial majors, which is likely to suppress the effect
of gender. This interpretation was supported by the gender differences found in the
control groups. However, further research is necessary to examine whether the effects of
GIS learning have a different impact on participants with different majors.
171
Educational Implications: Spatial Concepts and Skills
Spatial cognition has been a topic of interest for many scholars in GIS education
research. Since the development of ability or skills is an important aim of education,
empirical evidence supporting the pedagogical role of GIS in developing spatial
concepts and skills is a significant outcome of this study. The following discusses
educational implications of the findings.
When GIS educators organize their course content, they should pay attention to
teaching fundamental spatial concepts as the base for spatial thinking skills, considering
the complexity of those concepts. The findings in this study indicated that GIS students
learned key spatial concepts. A scrutiny of students’ performance in the spatial concepts
and skills test (SCST) revealed that GIS students performed particularly well in
problems assessing the meaning of spatial concepts (see Table 26 and Figures 3 and 4 in
Chapter IV). In addition, as Golledge and his colleagues (Marsh, Golledge, and
Battersby 2007; Golledge, Marsh, and Battersby 2008a, 2008b) have argued, a hierarchy
of spatial concepts existed. More specifically, this study tested spatial concepts of
diffusion, buffer, spatial interpolation, and scale. Students’ levels of understanding
differed, depending on the complexity of the concepts. The concept of diffusion was
easier for students to grasp, while the concept of buffer appeared to be relatively
difficult. Considering that understanding of spatial concepts is the building block for
spatial thinking skills (National Research Council 2006; Huynh 2009), GIS students’
advanced knowledge of spatial concepts might be related to their enhanced spatial
thinking skills which were also found in this study. Hence, GIS educators should
172
recognize that teaching basic spatial concepts can support the development of spatial
thinking skills.
As in spatial habits of mind, academic major was a variable making a difference
in students’ spatial cognition. Students of diverse academic backgrounds had varying
levels of prior spatial knowledge, thus careful educational strategies must be exercised
for effective GIS training. This study suggests incorporating multiple examples or
contexts when teaching spatial concepts, as research for conceptual change has
emphasized (Clement 2008; Levrini and diSessa 2008). Conceptual change researchers
have noted the significance of multiple contexts to facilitate students’ conceptual
understanding and to prevent misconceptions. diSessa (1988, 2006) defined conceptual
change as a process in which “fragmented collections” of ideas approach a systematic
knowledge (systematicity). According to diSessa, students do not naturally have a
coherent intuitive theory. An intuitive theory is a knowledge structure one maintains
without explicit and intentional learning. One’s intuitive theory is a “fragmented
collection of ideas, loosely connected and reinforcing, having none of the commitment
or systematicity that one attributes to theories” (diSessa 1988, 50). diSessa coined the
term “p-prim” (phenomenological primitives) to denote the fragments, pieces of
knowledge, in intuitive theory. P-prim is established through everyday life experiences.
P-prim is very simple and only requires common sense, so students do not need
explanation to understand it (diSessa 1988). P-prim itself is correct, but when it is
applied to incorrect contexts, it results in misconceptions. Therefore, students should be
guided to apply their p-prims to a wide range of contexts to understand how a piece of

173
knowledge, p-prim, can be used in diverse real-world contexts, and subsequently, how it
establishes a coherent theory. In this regard, GIS instructors are advised to incorporate
various contexts when introducing spatial concepts and training spatial thinking skills.
Using primitive phenomena that students intuitively understand through their everyday
life, instructors have to show how spatial concepts combine pieces of knowledge into
coherent meaning. Within multiple contexts, each student may encounter examples that
are more understandable to him/her, depending on his/her existing knowledge. The GIS
students in this study had opportunities to see how spatial concepts are connected to
various real-world contexts through lectures and lab exercises. These experiences must
have facilitated students’ robust understanding of spatial concepts.
Research Question 3a
Will the completion of a GIS course and that of a geography course or a
non-geography-related course have the same effects on college students’ critical
spatial thinking?
Research question 3a explored whether completing a GIS course affects students’
critical spatial thinking defined as their ability to judge data reliability, use sound spatial
reasoning processes, and employ valid problem-solving strategies (National Research
Council 2006). An interview-type critical spatial thinking oral test (CSTOT) was used to
collect information regarding students’ performance on these dimensions.
For the sub-dimensions of data reliability and problem-solving validity, the pre-
test scores of the three groups recruited for this study were not statistically different, so

174
ANOVAs and post hoc contrasts were conducted on the post-test scores. GIS students
improved significantly more than students in the control groups in both sub-dimensions.
For spatial reasoning, the pre-test scores of the three groups were statistically different.
Therefore, ANCOVA and post hoc contrasts were conducted. The result showed that the
GIS group improved more than the control groups. These findings demonstrated the
effects of the GIS course on improving critical spatial thinking.
It is interesting to note that the sub-dimensions of data reliability and problem-
solving validity did not show group differences at the beginning. This finding suggests
that none of the students had relevant education or experience related to these aspects.
Recall that in the tests for the first and second components of spatial literacy, GIS
students performed better even prior to the intervention. Therefore, the improvement of
critical spatial thinking regarding data reliability and problem-solving validity is a
unique contribution of GIS learning, which is not fostered by other non-GIS courses. In
addition, the development of spatial reasoning processes supports the findings in the
second experiment. Students incorporated appropriate spatial reasoning strategies
supported by spatial concepts and thinking skills.
The reasons for the improvement could be explained by the nature of GIS
learning. First, in the GIS course, students were asked to think about the reliability of
data used for spatial representations such as maps or remote sensing imagery. For
example, GIS students are frequently required to analyze spatial information or to
produce spatial representations (DeMers and Vincent 2007). In addition, the participants
in this study had to complete lab assignments that required them to collect data to

175
support their spatial analyses. When collecting data, students had to judge what data
adequately supported their argument and where their data came from. Through these
activities, students learned what roles data play and what kinds of data are appropriate
for reasonable spatial analysis. Students understood that credible data are a prerequisite
to produce good spatial representations and conduct sound spatial analyses.
Second, GIS students were involved in activities in which various spatial
reasoning skills were employed. The notion of GIScience, the foundation for organizing
the GIS course, emphasizes spatial concepts and thinking skills (Rhind 1992; Abler
1993; Dobson 1993; Goodchild 2004). Students learn not only key spatial concepts
including definitions and connotations of those concepts, but also acquire skills
applicable to a wide range of contexts based on spatial concepts. Using spatial concepts
and relevant spatial thinking skills acquired through GIS learning, students have the
opportunity to exercise sound spatial reasoning.
Finally, spatial activities in the GIS course can enhance the development of
students’ thinking concerning problem-solving validity. In a GIS course, students have
opportunities to evaluate spatial representations or spatial analyses. For example, when
producing maps, students have to judge whether chosen data classes, unit area, and
patterns displayed on maps are appropriate to achieve their aims. The GIS students in
this study combined wide ranging learning experiences in lab assignments. The
assignments required them to consider various spatial topics, collect data, select methods
of analysis, and visualize findings. While completing hands-on lab assignments, students
176
had to think critically and evaluate their activities. This assignment enabled students to
foster analytical spatial thinking (Lee 2005).
In summary, GIS learning enhanced students’ critical spatial thinking. In
particular, the developed ability to assess data reliability and problem-solving validity is
noticeable because it is not likely to be enhanced by other coursework. In addition, the
development of spatial reasoning is expected to support students’ ability to evaluate data
reliability and problem-solving validity.
Research Question 3b
What qualitative differences in critical spatial thinking will be found in
college students who completed a GIS course by comparing pre- and post-interview
responses?
Along with the quantitative analyses discussed above, this study qualitatively
analyzed students’ interviews. Thematic analysis was conducted to find patterns in
students’ thinking (Braun and Clarke 2006). Since critical spatial thinking, which
emphasizes students’ evaluative thinking processes, cannot be easily revealed though a
standardized multiple choice test (Keeley and Browne 1986; Norris 1988, 1989; Beier,
Campbell, and Crook 2010), qualitative analysis provided an appropriate method to
identify students’ thinking more deeply.
Through thorough investigation of students’ interview transcriptions, several
themes were identified. These themes indicated that students developed critical spatial
thinking after they completed the GIS course. This study found the following themes: 1)

177
enhanced understanding concerning data reliability; 2) informed and explicit use of
spatial concepts and vocabulary; 3) evaluation of problem contexts; and 4) use of tools
for problem-solving. As previously discussed, this study defined sub-dimensions of
critical spatial thinking as data reliability, spatial reasoning, and problem-solving
validity. These three dimensions and the identified themes coincide. More specifically,
enhanced understanding of data reliability and source, of course, is associated with the
data reliability sub-dimension. The informed use of spatial concepts will be the base for
sound spatial reasoning, the second sub-dimension of critical spatial thinking. Critically
evaluating problem contexts and having the capability to use GIS for problem-solving
would promote the third sub-dimension, problem-solving validity.
The development of critical spatial thinking found in this research indicates that
students’ approach to problems became more similar to that of experts. Experts
understand problems at a deeper level and are not distracted by superficial features (Chi,
Glaser, and Rees 1982; Audet and Abegg 1996; Ericsson 2003; Stylianou and Silver
2004). Experts incorporate appropriate knowledge to solve problems, considering
problem contexts (Anderson and Leinhardt 2002). The themes identified demonstrated
that GIS students acquired expert-like skills in their problem-solving. For example,
students were not limited to a superficial grasp of problems, but considered whether data
were appropriately selected and collected. GIS students paid attention to data collection
procedures or sources of data.
I guess it goes down to the level of how they collected data. If they used constant methods across, [the data would be reliable and can be compared]. If they used different methods for each data, then, you can’t really overlap them.
178
Who collected data, like government database is pretty credible. If it’s a random organization, it might not be very accurate.
With respect to spatial reasoning, GIS students incorporated advanced spatial
knowledge to make their thinking sound. GIS students used spatial concepts such as
scale, buffer, projection, or attribute explicitly. For instance, the concept of buffer was
difficult for non-GIS students, but GIS students explicitly used the term in their
problem-solving.
They could be more specific as far as elevation, but I don’t know about the electric line whether there would be much difference if they show more buffer or less.
Having [buffer] in a computer [program], you can put different layers on top of each other. ArcGIS, for example, say, within a buffer, elevation is less than [200 feet] in spatial query, it will show the area that fits best.
In addition, GIS students reflected on problem contexts to determine whether
they employed valid problem-solving strategies and whether their problem-solving could
be enhanced with the aid of other tools such as GIS. The following exemplifies that GIS
students extended their problem-solving repertoires by taking the GIS course.
Maybe you could layer them. You can use GIS, if you put them on top of each other, it would be much easier to visualize them, and it would give you other options for the locations.
These characteristics manifest expert-like problem-solving. GIS students
employed sound spatial reasoning with consideration of data reliability and problem-
solving validity.
179
To summarize, qualitative findings supplemented and confirmed the quantitative
analyses. GIS students developed their critical spatial thinking regarding data reliability,
spatial reasoning, and problem-solving validity.
Educational Implications: Critical Spatial Thinking
Educators have noted the importance of critical thinking (Kennedy, Fisher, and
Ennis 1991; Taube 1997; Pithers and Soden 2000; Albert and Albert 2002). Along the
line, geography educators have begun to stress critical spatial thinking which emphasizes
a spatial perspective in critical thinking (National Research Council 2006; Milson and
Alibrandi 2008).
Given the findings in this study, GIS instructors are advised to emphasize
activities evaluating data reliability and problem-solving validity. GIS classes that
combine teaching of theories and labs of hands-on activities can provide beneficial
opportunities for students to develop critical spatial thinking. As the quantitative
analyses of the pre-test of the CSTOT indicated, students had few, if any, learning
experiences that deal with the reliability of data or the validity of their problem-solving
in non-GIS courses. However, critical spatial thinkers have the ability to assess these
aspects (National Research Council 2006; Milson and Alibrandi 2008). Therefore, GIS
instructors should take advantage of favorable conditions of GIS courses to improve
students’ critical spatial thinking.
Furthermore, this study emphasizes project-type lab assignments. This
recommendation reinforces the validity of previous GIS education studies that reported
180
the benefits of project-type assignments (Vincent 2004; Lee 2005). As these prior studies
found, lab sessions provided students with useful opportunities that were directly related
to the development of critical spatial thinking. In completing hands-on lab assignments,
students had to apply real-world data into a wide range of contexts, evaluating the
validity of their spatial analyses. Therefore, GIS educators are encouraged to incorporate
project-type (open-ended) lab assignments to give students opportunities to synthesize
diverse GIS components. The GIS students in this study were required to study a lab-
oriented manual, and lab assignments accounted for 50 percent of their course grade.
Anecdotal interviews with GIS students verified that a wide range of lab activities in the
GIS class were beneficial.
Even though it [lab assignment] was time-consuming and required a lot of work, I feel that it was very helpful in understanding spatial concepts and developing relevant GIS skills. I had to digitize maps and create data, discuss my analysis with friends, evaluate if my project was reasonably done.
Research Question 4
Are the three components of spatial literacy interrelated? If so, what is the
nature of the relationship(s) between components?
This research investigated whether the three components of spatial literacy are
interrelated. As previously noted, this study employed three tests to measure spatial
literacy. The same participants took part in tests measuring spatial habits of mind (first
component) and spatial concepts and skills (second component), and a subset of the
participants of the first two experiments were interviewed to examine critical spatial
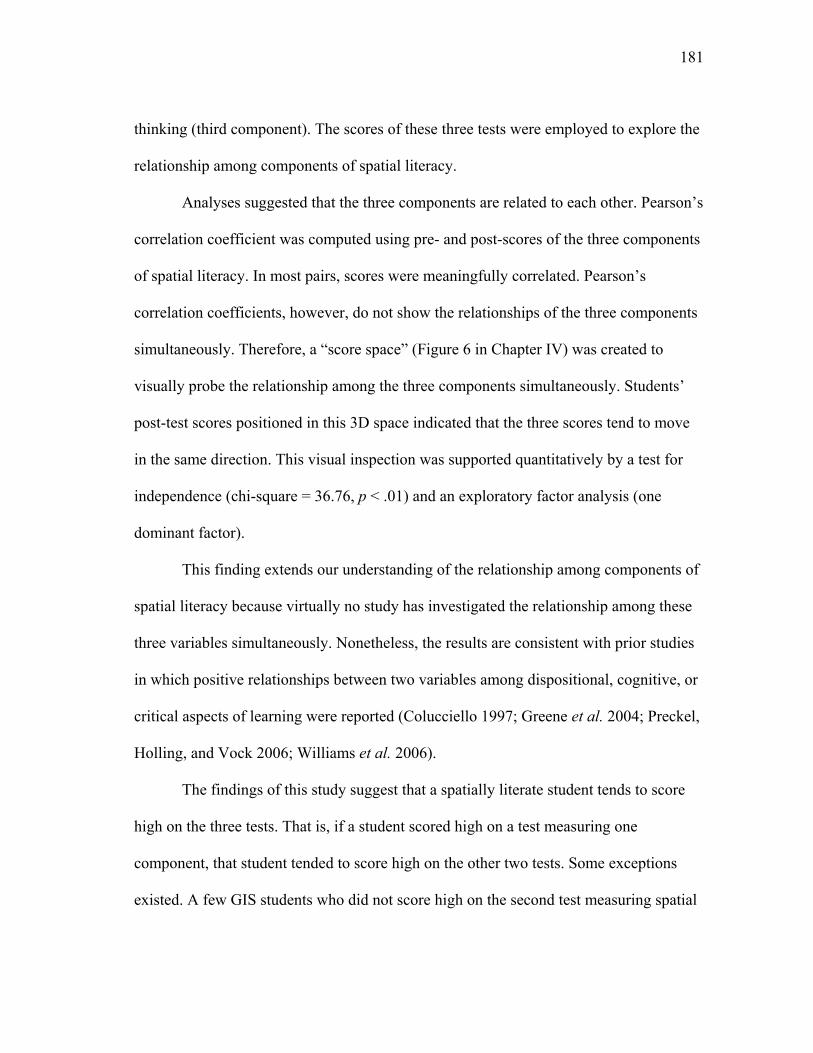
181
thinking (third component). The scores of these three tests were employed to explore the
relationship among components of spatial literacy.
Analyses suggested that the three components are related to each other. Pearson’s
correlation coefficient was computed using pre- and post-scores of the three components
of spatial literacy. In most pairs, scores were meaningfully correlated. Pearson’s
correlation coefficients, however, do not show the relationships of the three components
simultaneously. Therefore, a “score space” (Figure 6 in Chapter IV) was created to
visually probe the relationship among the three components simultaneously. Students’
post-test scores positioned in this 3D space indicated that the three scores tend to move
in the same direction. This visual inspection was supported quantitatively by a test for
independence (chi-square = 36.76, p < .01) and an exploratory factor analysis (one
dominant factor).
This finding extends our understanding of the relationship among components of
spatial literacy because virtually no study has investigated the relationship among these
three variables simultaneously. Nonetheless, the results are consistent with prior studies
in which positive relationships between two variables among dispositional, cognitive, or
critical aspects of learning were reported (Colucciello 1997; Greene et al. 2004; Preckel,
Holling, and Vock 2006; Williams et al. 2006).
The findings of this study suggest that a spatially literate student tends to score
high on the three tests. That is, if a student scored high on a test measuring one
component, that student tended to score high on the other two tests. Some exceptions
existed. A few GIS students who did not score high on the second test measuring spatial

182
thinking skills showed advanced performance on the third test measuring critical spatial
thinking. However, the general trend was that the three scores tend to go together.
Therefore, spatial learning, such as that which occurs in a GIS course, can
collectively contribute to enhancing spatial literacy. Because the three elements are
interrelated, they can be considered together within students’ “frame of mind”
(Colucciello 1997). It is not unreasonable to expect that the three components would
produce synergistic effects because the positive correlation indicates that a higher value
in one component would be connected to higher values in the other components. To
make an analogy, if a runner wants to perform well, he/she needs to have not only
physical strength but also an attitude to do his/her best using his/her physical capability
and critical evaluation of relevant situations such as body, weather, and road conditions.
These elements would affect each other and work mutually. Of course, a runner can
perform well, for example, without passion to do well or critical assessment of external
conditions. However, generally speaking, when the three components are simultaneously
considered and work well together, it is more likely that a runner performs well. Thus,
neglecting one aspect might be a missing link for good performance. In the same
manner, educators need to consider three components of spatial literacy together. If so,
they would develop together, mutually reinforcing each other. A lack of strategies in
promoting one of these dimensions will be a weak point in the development of spatial
literacy.
However, at this point, it is unclear whether the three components of spatial
literacy in this study comprehensively cover constituents of spatial literacy, and

183
therefore, it can be concluded that spatial literacy is composed of interrelated sub-
components (Figure 11) or the three components of this study belong to one sub-part of
spatial literacy, so they are interrelated (Figure 12). Because there has been no consensus
about the definition of spatial literacy (Caplan, MacPherson, and Tobin 1985; Linn and
Petersen 1985; Voyer, Voyer, and Bryden 1995; Lloyd 2003; Black 2005; Schultz,
Kerski, and Patterson 2008; Yang and Chen 2010), this issue remains unsolved. If the
latter is true, further research should find other sub-components of spatial literacy and
examine how they are related and interact.
Spatial literacy
Spatial habits of mind
Spatial concepts
and skills
Critical spatial thinking
Figure 11. Spatial literacy composed of the three components.
Spatial literacy
subcomponent 1 subcomponent 2 subcomponent 3 subcomponent N - spatial habits of mind - spatial concepts and skills - critical spatial thinking
- element 1 - element 2 - element 3 - element 4
- element 1 - element 2
…… - element 1 - element 2 - element 3
Figure 12. Spatial literacy with the three components as one part of its constituent.

184
Summary and Conclusions
This study investigated whether completing a GIS course improves students’
spatial literacy defined as spatial habits of mind, spatial concepts and skills, and critical
spatial thinking. This conceptualization of spatial literacy synthesizes prior studies,
therefore, it is one of the most comprehensive discussions regarding spatial literacy
(Ackerman et al. 2001; Ackerman 2003; Ackerman and Wolman 2007; Beier, Campbell,
and Crook 2010). This study employed three tests to measure students’ performance on
these three elements, and furthermore, it investigated the relationship among the three
components. This research employed a quasi-experimental design including pre- and
post-tests conducted at the beginning and the end of the 2010 fall semester. Texas A&M
undergraduate students participated in the research.
The first research question investigated whether GIS learning improves spatial
habits of mind. Since no study specifically has identified constituents of spatial habits of
mind, this study defined pattern recognition, spatial description, visualization, spatial
concept use, and spatial tool use as sub-dimensions of spatial habits of mind. Based on
this conceptualization, an inventory of spatial habits of mind was created, and students’
performance was examined. After taking the GIS course, students’ spatial habits of mind
were enhanced.
The second research question explored whether GIS learning affects students’
understanding and use of spatial concepts and thinking skills. The spatial skills test
(Association of American Geographers 2005) was employed with slight modification. In
addition, one performance task that required students to complete a contour map and

185
four problems that explicitly asked about spatial concepts were added. This research
found that the GIS course was beneficial in improving students’ comprehension of
spatial concepts and use of spatial thinking skills.
The third research question examined the effects of a GIS course on the three
sub-dimensions of critical spatial thinking: data reliability, spatial reasoning, and
problem-solving validity. An interview-type critical spatial thinking test was developed.
Students’ interviews were transcribed and analyzed quantitatively and qualitatively. The
outcomes indicated that GIS students improved their critical spatial thinking based on
their learning experiences in the GIS course.
The final research question probed the relationship among the three components
of spatial literacy. The results of analyses suggested that the three elements are closely
related. Pearson’s correlation coefficients between two elements achieved substantially
high values. Moreover, when the three test scores were placed simultaneously in a 3D
space, termed “score space” in this study, the graph visually showed that the three
components tend to move together. A test for independence and exploratory factor
analysis statistically confirmed that there is a trend among the scores.
The following paragraphs summarize major findings of this research.
First, this study identified sub-dimensions of spatial habits of mind and verified
their validity. No research has explicitly defined sub-dimensions of spatial habits or
developed a test instrument to measure them. Therefore, defining spatial habits of mind
and developing a test to measure them were innovative aspects of this study.
186
Second, this study refined the spatial skills test (Association of American
Geographers 2005). The spatial concepts and skills test developed for this study added
test items evaluating spatial concepts and requiring map construction to the spatial skills
test and modified some wording to facilitate students’ understanding of the test.
Considering that few standardized spatial skills tests exist, this study could contribute to
advancing the development of test instruments for spatial thinking skills.
Third, this study created a critical spatial thinking test measuring sub-dimensions
of data reliability, spatial reasoning, and problem-solving validity. Despite increasing
interest in critical thinking, few studies have defined critical spatial thinking. Therefore,
virtually no research has developed a test instrument to investigate students’ critical
spatial thinking with the established sub-dimensions. Therefore, this study could provide
a good starting point to facilitate future research regarding critical spatial thinking.
Fourth, this study empirically demonstrated that GIS learning can enhance
students’ spatial habits of mind, spatial concepts and skills, and critical spatial thinking.
The educational settings where the GIS intervention of this study occurred are expected
to be found across institutions of higher education. Therefore, the findings would not be
confined to a specific institution, even though it may be difficult to generalize them into
all the educational settings. Therefore, the findings of this research could play a part in
securing the role of spatial thinking and GIS in competitive curricula competition.
Fifth, this study investigated the effects of gender and academic major in spatial
literacy. In particular, females appeared to be more conservative in self-rating their
spatial habits of mind. In addition, academic major superseded the influence of gender.

187
Female students who majored in subjects emphasizing spatial perspectives performed
equally well on spatial tests as their male counterparts, while gender differences were
found in participants with other non-spatial majors.
Sixth, this study found that GIS courses can play a relatively unique role in
developing students’ critical spatial thinking to evaluate data reliability and problem-
solving validity. In a GIS course, students have opportunities to collect and evaluate
data. Moreover, GIS students need to examine various spatial representations and should
conduct spatial analyses and evaluate them. These activities in a GIS course should
contribute to promoting students’ skills to assess data reliability and problem-solving
validity.
Seventh, this study showed that effect size is a useful analytical technique. When
statistical analyses were conducted, this study presented effect size estimates, along with
the outcomes of statistical significance testing. The effect size indices provided insight
into the magnitude of differences in group means or variability. For example, female
students’ variation in spatial habits of mind by dimension could be more concretely
examined by referring to effect size. Recall that females’ dramatic increase in the
dimension of pattern recognition was demonstrated by a large value of Cohen’s d. The
statistical significance testing investigates whether a difference is statistically significant
or not, but effect size estimates enable researchers to know the extent of a difference.
Finally, this study considered three component of spatial literacy simultaneously,
and furthermore, explored the relationship among them. Because virtually no previous

188
research discussed these elements together in one study, this study provided a big picture
of how components of spatial literacy are related.
Recommendations for Future Research
This research investigated whether and how GIS learning affects students’ spatial
literacy. The following recommendations could enrich this research and related studies
in the field of GIS education.
First, further research examining the reliability and the validity of the test
instruments developed in this study should be conducted. Even though this study
evaluated the reliability and the validity of the tests, more empirical research should
support the findings. More specifically, the development of the spatial habits of mind
inventory (SHMI) represents only a first attempt to identify sub-dimensions of spatial
habits and collect empirical data. Thus, more empirical data are necessary to support the
conceptualization of spatial habits of mind proposed in this research. This study
evaluated the content and construct validities of the instrument, but examining other
types of validity would strengthen the SHMI. For example, investigating criterion-
related validity would inform us whether and how spatial habits of mind are related to
other spatial traits. In addition, the spatial concepts and skills test (SCST) modified the
spatial skills test (Association of American Geographers 2005). However, the SCST
added more items to the spatial skills test, so it includes test items that were not
examined during the development of the spatial skills test. Hence, more data are needed
to establish the validity of the SCST. Finally, the critical spatial thinking oral test
189
(CSTOT) was the first attempt to develop an instrument and measure students’ critical
approach to spatial thinking with an established framework. Virtually, few studies
explicitly have sought to develop a test for critical spatial thinking. Therefore, more
research should confirm the validity of the test.
Second, the practical significance of GIS learning on the improvement of spatial
habits of mind should be further explored. The GIS students in this study improved their
spatial habits of mind, and the improvement was statistically significant. However, the
magnitude of practical significance was relatively small. Therefore, future research
should address whether GIS learning contributes to the development of spatial habits of
mind in practical terms. If the current instructional strategies are not sufficiently
effective to enhance students’ spatial habits, educators should try to develop different
types of learning activities or materials.
Third, the effect of GIS learning on non-spatial majors needs more research. In
the context of this study, the question of whether or how a GIS course affects students
from diverse majors differently could not be demonstrated due to sample limitation.
Very few students of non-spatial majors participated in the GIS course, so the sample
size was too small to conduct statistical analysis by academic major. Therefore, future
research with participants from diverse non-spatial fields will supplement and confirm
the findings in this study. The effect of academic major on spatial literacy is an area that
needs further attention (Lee 2005).
Finally, more research investigating the relationship among components of
spatial literacy is required. The current study investigated if and how the three elements

190
of spatial literacy are interrelated and found they are closely related. However, more
empirical data should confirm the outcomes reported in this study. The sample size of
this research was relatively small to generalize the findings into the larger population.
With more data regarding the relationship among components of spatial literacy, it
would be possible to deeply understand the nature of spatial literacy. Research of this
issue is important because depending on how various constituents of spatial literacy
interact, different educational strategies need to be created.

191
REFERENCES
Aarts, H., B. Verplanken, and A. van Knippenberg. 1997. Habit and information use in
travel mode choices. Acta Psychologia 96: 1-14.
Abbott, T. D. 2001. An Evaluation of Geographic Information System Software and its
Utility in Promoting the Use of Integrated Process Skills in Secondary Students.
Ph.D. diss., University of Connecticut, Storrs.
Abler, R. F. 1993. Everything in its place: GPS, GIS, and geography in the 1990s.
Professional Geographer 45: 131-139.
Ackerman, P. L. 2003. Cognitive ability and non-ability trait determinants of expertise.
Educational Researcher 32 (8): 15-20.
Ackerman, P. L., K. R. Bowen, M. E. Beier, and R. Kanfer. 2001. Determinants of
individual differences and gender differences in knowledge. Journal of
Educational Psychology 93: 797-825.
Ackerman, P. L., and S. D. Wolman. 2007. Determinants and validity of self-estimates
of abilities and self-concept measures. Journal of Experimental Psychology:
Applied 13: 57-78.
Akin, O. 1980. Models of Architectural Models. London: Pion.
Aladağ, E. 2010. The effects of GIS on students' academic achievement and motivation
in seventh-grade social studies lessons in Turkey. International Research in
Geographical and Environmental Education 19: 11-23.

192
Albert, R. T., and R. E. Albert. 2002. Relationship among bilingualism, critical thinking
ability, and critical thinking disposition. Journal of Professional Nursing 18:
220-229.
Albert, W. S., and R. G. Golledge. 1999. The use of spatial cognitive abilities in
geographical information systems: The map overlay operation. Transactions in
GIS 3: 7-21.
Alibrandi, M. 2002. Geography is everywhere: Connecting schools and communities
with GIS. Learning & Leading with Technology 29 (7): 32-37.
Alibrandi, M., and H. M. Sarnoff. 2006. Using GIS to answer the 'whys' of 'where' in
social studies. Social Education 70: 138-143.
Anderson, K. C., and G. Leinhardt. 2002. Maps as representations: Expert novice
comparison of projection understanding. Cognition and Instruction 20: 283-321.
Arias, S. 2010. Rethinking space: An outsider's view of the spatial turn. GeoJournal 75:
29-41.
Association of American Geographers. 2005. Spatial Skills Test. Washington, DC:
Association of American Geographers.
Audet, R. H., and G. L. Abegg. 1996. Geographic information systems: Implications for
problem solving. Journal of Research in Science Teaching 33: 21-45.
Bailin, S. 2002. Critical thinking and science education. Science & Education 11: 361-
375.
Baker, R., and F. Dwyer. 2000. A meta-analytic assessment of the effect of visualized
instruction. International Journal of Instructional Media 27: 417-426.
193
Baker, T. R. 2002. The Effects of Geographic Information System (GIS) Technologies on
Students' Attitudes, Self-efficacy, and Achievement in the Middle School
Classroom. Ph.D. diss., University of Kansas, Lawrence.
Baker, T. R., and S. W. Bednarz. 2003. Lessons learned from reviewing research in GIS
education. Journal of Geography 102: 231-233.
Baker, T. R., and S. H. White. 2003. The effects of GIS on students' attitudes, self-
efficacy, and achievement in middle school science classrooms. Journal of
Geography 102: 243-254.
Barke, H.-D. 1993. Chemical education and spatial ability. Journal of Chemical
Education 70: 968-971.
Battersby, S. E., R. G. Golledge, and M. J. Marsh. 2006. Incidental learning of
geospatial concepts across grade levels: Map overlay. Journal of Geography 105:
139-146.
Battista, M. T. 1990. Spatial visualization and gender differences in high school
geometry. Journal of Research in Mathematics Education 21: 47-60.
Bauer, M. I., and P. N. Johnson-Laird. 1993. How diagrams can improve reasoning.
Psychological Science 4: 372-378.
Beachboard, M. R., and J. C. Beachboard. 2010. Critical-thinking pedagogy and student
perceptions of university contributions to their academic development. Informing
Science: The International Journal of an Emerging Transdiscipline 13: 53-71.
194
Bednarz, R., and S. Bednarz. 2009. The effect of long-term instruction in spatial
thinking. Paper presented at the Annual Meeting of the Association of American
Geographers. NV: Las Vegas.
Bednarz, R., and J. Lee. 2011. The components of spatial thinking: Empirical evidence.
Procedia: Social and Behavioral Sciences 21: 103-107.
Bednarz, S. W. 2004. Geographic information systems: A tool to support geography and
environmental education? Geojournal 60: 191-199.
Bednarz, S. W., G. Acheson, and R. S. Bednarz. 2006. Maps and map learning in social
studies. Social Education 70: 398-404, 432.
Bednarz, S. W., and R. S. Bednarz. 2008. The key to success in using geospatial
technologies in the social studies classroom. In Digital Geography, eds. A. J.
Milson and M. Alibrandi, 249-270. Charlotte, NC: Information Age Publishing.
Beier, M. E., M. Campbell, and A. E. Crook. 2010. Developing and demonstrating
knowledge: Ability and non-ability determinants of learning and performance.
Intelligence 38: 179-186.
Ben-Chaim, D., G. Lappan, and R. T. Houang. 1988. The effect of instruction on spatial
visualization skills of middle school boys and girls. American Educational
Research Journal 25: 51-71.
Bentler, P. M. 1990. Comparative fit indices in structural models. Psychological Bulletin
107: 238-246.
Bishop, A. J. 1979. Visualising and mathematics in a pre-technological culture.
Educational Studies in Mathematics 10: 135-146.

195
———. 1980. Spatial abilities and mathematics education: A review. Educational
Studies in Mathematics 11: 257-269.
Black, A. A. 2005. Spatial ability and earth science conceptual understanding. Journal of
Geoscience Education 53: 402-414.
Blaser, A. D., M. Sester, and M. J. Egenhofer. 2000. Visualization in an early stage of
the problem-solving process in GIS. Computers & Geosciences 26: 57-66.
Bloom, B. S. 1976. Human Characteristics and School Learning. New York: McGraw-
Hill.
Bollen, K. A. 1989. Structural Equations with Latent Variables. New York: John Wiley
and Sons.
Bollen, K. A. 2002. Latent variables in psychology and the social sciences. Annual
Review of Psychology 53: 605-634.
Bolstad, P. 2008. GIS Fundamentals: A First Text on Geographic Information Systems.
3rd ed. White Bear Lake, MN: Eider Press.
Borsboom, D., G. J. Mellenbergh, and J. van Heerden. 2003. The theoretical status of
latent variables. Psychological Review 110: 203-219.
Bosco, A., A. M. Longoni, and T. Vecchi. 2004. Gender effects in spatial orientation:
Cognitive profiles and mental strategies. Applied Cognitive Psychology 18: 519-
532.
Boyes, K., and G. Watts. 2009. Developing Habits of Mind in Secondary Schools.
Alexandra, VA: Association for Supervision & Curriculum Development.

196
Brandt, L., J. Elen, J. Hellemans, and L. Heerman. 2001. The impact of concept mapping
and visualization on the learning of secondary school chemistry students.
International Journal of Science Education 23: 1303-1313.
Braun, N. M. 2004. Critical thinking in the business curriculum. Journal of Education
for Business 79 (4): 232-236.
Braun, V., and V. Clarke. 2006. Using thematic analysis in psychology. Qualitative
Research in Psychology 3: 77-101.
Brown, T. A. 2006. Confirmatory Factor Analysis for Applied Research. New York: The
Guildford Press.
Browne, M. W., and R. Cudeck. 1993. Alternative ways of assessing model fit. In
Testing Structural Equation Models, eds. K. A. Bollen and J. S. Long, 136-162.
Newbury Park, CA: Sage.
Brunt, B. A. 2005. Critical thinking in nursing: An integrated review. Journal of
Contiuing Education in Nursing 36 (2): 60-67.
Bryant, L. M. P. 2010. A Phenomenological Study of a Collaborative Inquiry Model for
Teaching Educators to Use Geographic Information Systems. Ph.D. diss., Texas
State University, San Marcos.
Burbach, M. E., G. S. Matkin, and S. M. Fritz. 2004. Teaching critical thinking in an
introductory leadership course utilizing active learning strategies: A confirmatory
study. College Student Journal 38: 482-493.
Campbell, D. T., and J. C. Stanley. 1963. Handbook of Research on Teaching. Chicago:
Rand McNally.

197
Caplan, P. J., G. M. MacPherson, and P. Tobin. 1985. Do sex-related differences in
spatial abilities exist? American Psychologist 40: 786-799.
Carlson, T. 2007. A field-based learning experience for introductory level GIS students.
Journal of Geography 106: 193-198.
Case, R. 2005. Bringing critical thinking to the main stage. Education Canada 45 (2):
45-49.
Casey, M. B., and M. M. Brabeck. 1989. Exceptions to the male advantage on a spatial
task: Family handedness and college major as factors indentifying women who
excel. Neuropsychologia 27: 689-696.
Catling, S. J. 1978. The child's spatial conception and geographic education. Journal of
Geography 77: 24-28.
Chalkley, B. 2006. Tertiary teaching excellence: The CETLs scheme in England. New
Zealand Geographer 62: 155-157.
Charbonneau, P. C., H. A. Jackson, G. C. Kobylski, J. W. Roginski, C. A. Sulewski, and
F. Wattenberg. 2009. Developing students' "habits of mind" in a mathematics
program. PRIMUS 19: 105-126.
Chase, W. G., and H. A. Simon. 1973. Perception in chess. Cognitive Psychology 4: 55-
81.
Chi, M. T. H., P. J. Feltovich, and R. Glaser. 1981. Categorization and representation of
physics problems by experts and novices. Cognitive Science 5: 121-152.
198
Chi, M. T. H., R. Glaser, and E. Rees. 1982. Expertise in problem solving. In Advances
in the Psychology of Human Intelligence, ed. R. J. Sternberg, 7-75. Hillsdale, NJ:
Lawrence Erlbaum Associates.
Clark, A. M., J. Monk, and S. R. Yool. 2007. GIS pedagogy, web-based learning and
student achievement. Journal of Geography in Higher Education 31: 225-239.
Clement, J. 2008. The role of explanatory models in teaching for conceptual change. In
International Handbook of Research on Conceptual Change, ed. S. Vosniadou,
417-452. New York: Routledge.
Clements, D. H., M. T. Battista, J. Sarama, and S. Swaminathan. 1997. Development of
students' spatial thinking in a unit on geometric motions and area. The
Elementary School Journal 98: 171-186.
Colcott, D., B. Russell, and H. Skouteris. 2009. Thinking about thinking: Innovative
pedagogy designed to foster thinking skills in junior primary classrooms.
Teacher Development 13: 17-27.
Collins, D. W., and D. Kimura. 1997. A large sex difference on a two-dimensional
mental rotation task. Behavioral Neuroscience 111: 845-849.
Colom, R., M. A. Quiroga, and M. Juan-Espinosa. 1999. Are cognitive sex differences
disappearing? Evidence from Spanish populations. Personality and Individual
Differences 27: 1189-1195.
Colucciello, M. L. 1997. Critical thinking skills and dispositions of baccalaureate
nursing students: A conceptual model for evaluation. Journal of Professional
Nursing 13: 236-245.

199
Costa, A. L. 2008. Describing the habits of mind. In Learning and Leading with Habits
of Mind: 16 Essential Characteristics for Success, eds. A. L. Costa and B.
Kallick, 15-41. Alexandria, VA: Association for Supervision and Curriculum
Development.
Costa, A. L., and B. Kallick. 2008. Habits of mind in the curriculum. In Learning and
Leading with Habits of Mind: 16 Essential Characteristics for Success, eds. A. L.
Costa and B. Kallick, 42-58. Alexandria, VA: Association for Supervision and
Curriculum Development.
Crocker, L., and J. Algina. 2008. Introduction to Classical & Modern Test Theory.
Mason, OH: Cengage Learning.
Cummins, J. 1981. The role of primary language development in promoting educational
success for language minority students. In Schooling and Language Minority
Students: A Theoretical Framework, 3-9. Sacramento, CA: California State
Department of Education.
Cuoco, A. 2007. The case of the CME project. In Perspectives on the Design and
Development of School Mathematics Curricula, ed. C. R. Hirsch, 119-127.
Reston, VA: The National Council of Teachers of Mathematics.
Cuoco, A., E. P. Goldenberg, and J. Mark. 1996. Habits of mind: An organizing
principle for mathematics curricula. Journal of Mathematical Behavior 15: 375-
402.
———. 2010. Organizing a curriculum around mathematical habits of mind.
Mathematics Teacher 103: 682-688.
200
Dark, S. J., and D. Bram. 2007. The modifiable areal unit problem (MAUP) in physical
geography. Progress in Physical Geography 34: 417-479.
Davies, C., and D. H. Uttal. 2006. Map use and the development of spatial cognition. In
The Emerging Spatial Mind, eds. J. M. Plumert and J. P. Spencer, 219-247. New
York: Oxford University Press.
de Smith, M. J., M. F. Goodchild, and P. A. Longley. 2007. Geospatial Analysis: A
Comprehensive Guide to Principles, Techniques and Software Tools. Leicester:
Troubador Publishing Ltd.
de Vaus, D. 2002. Surveys in Social Research. 5th ed. London: Routledge.
DeMers, M. N., and J. S. Vincent. 2007. ArcAtlas in the classroom: Pattern
identification, description, and explanation. Journal of Geography 106: 277-284.
diSessa, A. A. 1988. Knowledge in pieces. In Constructivism in the Computer Age, eds.
G. Forman and P. B. Pufall, 49-70. Hillsdale, NJ: Erlbaum.
———. 2006. A history of conceptual change research: Threads and fault lines. In The
Cambridge Handbook of the Learning Sciences, ed. R. K. Sawyer, 265-281. New
York: Cambridge University Press.
Dobson, J. E. 1993. The geographic revolution: A retrospective on the age of automated
geography. Professional Geographer 45: 431-439.
Downs, R. M. 1994. The need for research in geography education: It would be nice to
have some data. Journal of Geography 93: 57-60.
201
Downs, R. M., and L. S. Liben. 1990. Getting a bearing on maps: The role of projective
spatial concepts in map understanding by children. Children's Environmental
Quarterly 7: 15-25.
———. 1991. The development of expertise in geography: A cognitive-developmental
approach to geographic education. Annals of the Association of American
Geographers 81: 304-327.
Downs, R. M., L. S. Liben, and D. G. Daggs. 1988. On education and geographers: The
role of cognitive developmental theory in geographic education. Annals of the
Association of American Geographers 78: 680-700.
Drennon, C. 2005. Teaching geographic information systems in a problem-based
learning environment. Journal of Geography in Higher Education 29: 385-402.
Duke, B. A., and J. Kerski. 2010. Geo-cool: Exploring with geotechnologies. Learning
& Leading with Technology 38 (2): 28-31.
Edelson, D. C., and D. Gordin. 1998. Visualization for learners: A framework for
adapting scientists' tools. Computers & Geosciences 24: 607-616.
Egan, D., and B. Schwartz. 1979. Chunking in recall of symbolic drawings. Memory and
Cognition 7: 149-158.
Elder, L. 2004. Diversity: Making sense of it through critical thinking. Journal for
Quality and Participation 27 (4): 9-13.
Ennis, R. H. 1987. A taxonomy of critical thinking dispositions and abilities. In
Teaching Thinking Skills, eds. J. B. Baron and R. J. Sternberg, 9-26. New York:
Freeman.

202
Ericsson, K. A. 2003. The acquisition of expert performance as problem solving:
Construction and modification of mediating mechanisms through deliberate
practice. In The Psychology of Problem Solving, eds. J. E. Davidson and R. J.
Sternberg, 31-83. New York: Cambridge University Press.
Ericsson, K. A., and J. Smith. 1991. Toward a General Theory of Expertise. New York:
Cambridge University Press.
Facione, N. C., and P. A. Facione. 1996. Externalizing the critical thinking in knowledge
development and clinical judgment. Nursing Outlook 44: 129-136.
Facione, P. A. 2000. The disposition toward critical thinking: Its character,
measurement, and relationship to critical thinking skill. Informal Logic 20: 61-
84.
Ferrini-Mundy, J. 1987. Spatial training for calculus students: Sex differences in
achievement and in visualization ability. Journal of Research in Mathematics
Education 18: 126-140.
Fitzpatrick, C. 2011. A place for everything: Geographic analysis and geospatial tech in
schools. The Geography Teacher 8: 10-15.
Fleming, M. L., and M. R. Malone. 1983. The relationship of student characteristics and
student performance in science viewed by meta-analysis research. Journal of
Research in Science Teaching 20: 481-495.
Ford, J. S., and J. Profetto-McGrath. 1994. A model for critical thinking within the
context of curriculum as praxis. Journal of Nursing Education 33: 341-344.
203
Furnham, A., K. Clark, and K. Bailey. 1999. Sex differences in estimates of multiple
intelligences. European Journal of Personality 13: 247-259.
Furnham, A., and R. Rawles. 1999. Correlations between self-estimated and
psychometrically measured IQ. Journal of Social Psychology 139: 405-410.
Gardner, H. 1993. Frames of Mind: The Theory of Multiple Intelligences. 10th ed. New
York: Basic Books.
Gatrell, J. D. 2001. Structural, technical, and definitional issues: The case of geography,
"GIS," and K-12 classrooms in the United States. Journal of Educational
Technology Systems 29: 237-249.
Gelman, R. 1994. Constructivism and supporting environments. In Implicit and Explicit
Knowledge: An Educational Approach, ed. D. Tirosh, 55-82. New York: Ablex.
Geography Education Standards Project. 1994. Geography for Life: National Geography
Standards. Washington, DC: National Geographic Research & Exploration.
Gersmehl, P. 2005. Teaching Geography. New York: The Guildford Press.
Gersmehl, P. J., and C. A. Gersmehl. 2006. Wanted: A concise list of neurologically
defensible and assessable spatial thinking skills. Research in Geographic
Education 8: 5-38.
———. 2007. Spatial thinking by young children: Neurologic evidence for early
development and "educability". Journal of Geography 106: 181-191.
Gewin, V. 2004. Mapping opportunities. Nature 427: 376-377.

204
Giancarlo, C., and N. Facione. 1994. A Study of the Critical Thinking Disposition and
Skill of Spanish and English Speaking Students at Camelback High School.
Millbrae, CA: The California Academic Press.
Gibbons, P. 2002. Scaffolding Language, Scaffolding Learning: Teaching Second
Language Learners in the Mainstream Classroom. Portsmouth, NH: Heinemann.
Gitelson, I. B., A. C. Petersen, and M. H. Tobin-Richards. 1982. Adolescents'
expectancies of success, self-evaluations, and attributions about performance on
spatial and verbal tasks. Sex Roles 8: 411-419.
Glaser, E. M. 1985. Critical thinking: Educating for responsible citizenship in a
democracy. National Forum: The Phi Kappa Phi Journal 65: 24-27.
Glaser, R. 1984. Education and thinking: The role of knowledge. American Psychologist
39: 93-104.
Glass, G. V. 1965. Evaluating testing, maturation, and treatment effects in a pretest-
posttest quasi-experimental design. American Educational Research Journal 2:
83-87.
Goldenberg, E. P. 1996. "Habit of mind" as an organizer for the curriculum. Journal of
Education 178: 13-34.
Goldstein, D., D. Haldane, and C. Mitchell. 1990. Sex differences in visual-spatial
ability: The role of performance factors. Memory and Cognition 85: 546-550.
Golledge, R. G. 1991. Cognition of physical and built environments. In Environment,
Cognition, and Action, eds. T. Gärling and G. W. Evans, 35-62. New York:
Oxford University Press.
205
———. 1992. Do people understand spatial concepts: The case of first-order
primitives. Paper read at International GIS conference, at Pisa, Italy.
———. 1995. Primitives of spatial knowledge. In Cognitive Aspects of Human-
Computer Interaction for Geographic Information Systems, eds. T. L. Nyerges,
D. M. Mark, R. Laurini and M. J. Egenhofer, 29-44. Dordrecht: Kluwer
Academic Publishers.
———. 2002. The nature of geographic knowledge. Annals of the Association of
American Geographers 92: 1-14.
Golledge, R. G., M. Marsh, and S. Battersby. 2008a. A conceptual framework for
facilitating geospatial thinking. Annals of the Association of American
Geographers 98: 285-308.
———. 2008b. Matching geospatial concepts with geographic education needs.
Geographical Research 46: 85-98.
Golledge, R. G., and R. J. Stimson. 1997. Spatial Behavior: A Geographic Perspective.
New York: The Guildford Press.
Goodchild, M. F. 1992. Geographical information science. International Journal of
Geographical Information Systems 6: 31-45.
———. 2004. GIScience, geography, form, and process. Annals of the Association of
American Geographers 94: 709-714.
———. 2006. The fourth R? Rethinking GIS education. ArcNews 28 (3): 5-7.
———. 2007. Citizens as sensors: The world of volunteered geography. GeoJournal 69:
211-221.
206
Goodchild, M. F., L. Anselin, R. P. Appelbaum, and B. H. Harthorn. 2000. Toward
spatially integrated social science. International Regional Science Review 23:
139-159.
Goodchild, M. F., and D. G. Janelle. 2004. Thinking spatially in the social sciences. In
Spatially Integrated Social Science, eds. M. F. Goodchild and D. G. Janelle, 3-
17. New York: Oxford University Press.
———. 2010. Toward critical spatial thinking in the social sciences and humanities.
GeoJournal 75: 3-13.
Gordin, D. N., and R. D. Pea. 1995. Prospects for scientific visualization as an
educational technology. Journal of the Learning Sciences 4: 249-279.
Gould, M. 2010. The challenges of GIS education today. GEOconnexion International
November: 22-24.
Greene, B. A., R. B. Miller, M. Crowson, B. L. Duke, and K. L. Akey. 2004. Predicting
high school students' cognitive engagement and achievement: Contributions of
classroom perceptions and motivation. Contemporary Educational Psychology
29: 462-482.
Gregg, M., Sr., and D. C. Sekeres. 2006. My word! Vocabulary and geography learning.
Journal of Geography 105: 53-58.
Gűnther, O., and R. Műller. 1999. From GISystems to GIServices: Spatial computing in
the Internet marketplace. In Interoperability in Geographic Information Systems,
eds. M. Goodchild, M. J. Egenhofer, R. Fegeas and C. Kottman, 427-442.
Boston, MA: Kluwer Academic Publishers.

207
Hall-Wallace, M. K., and C. M. McAuliffe. 2002. Design, implementation, and
evaluation of GIS-based learning materials in an introductory geoscience course.
Journal of Geoscience Education 50: 5-14.
Halpern, D. F. 1999. Teaching for critical thinking: Helping college students develop the
skills and dispositions of a critical thinker. New Directions for Teaching and
Learning 80: 69-74.
Halpern, D. F., and M. L. LaMay. 2000. The smarter sex: A critical review of sex
differences in intelligence. Educational Psychology Review 12: 229-246.
Hammond, T. C., and A. M. Bodzin. 2009. Teaching with rather than about geographic
information systems. Social Education 73: 119-123.
Harel, G. 2007. The DNR system as a conceptual framework for curriculum
development and instruction. In Foundations for the Future in Mathematics
Education, eds. R. Lesh, J. Kaput and E. Hamilton, 263-280. Mahwah, NJ:
Lawrence Erlbaum Associates.
Harvey, F. 2008. A Primer of GIS: Fundamental Geographic and Cartographic
Concepts. New York: The Guildford Press.
Hayes, A. F., and K. Krippendorff. 2007. Answering the call for a standard reliability
measure for coding data. Communication Methods and Measures 1: 77-89.
Healey, M., and A. Jenkins. 2000. Kolb's experiential learning theory and its application
in geography in higher education. Journal of Geography 99: 185-195.
Healey, M., P. Kneale, and J. Bradbeer. 2005. Learning styles among geography
undergraduates: An international comparison. Area 37: 30-42.

208
Hearnshaw, H. M., and D. J. Unwin. 1994. Visualization in Geographical Information
Systems. New York: John Wiley & Sons.
Hegarty, M., and M. Kozhenvnikov. 1999. Types of visual-spatial representations and
mathematical problem solving. Journal of Educational Psychology 91: 684-689.
Hegarty, M., and D. A. Waller. 2005. Individual differences in spatial abilities. In The
Cambridge Handbook of Visuospatial Thinking, eds. P. Shah and A. Miyake,
121-169. New York: Cambridge University Press.
Henninger, E. A., and J. M. Hurlbert. 1996. Critical thinking and information across the
undergraduate business curriculum. Journal of Business & Finance
Librarianship 2: 29-40.
Hespanha, S. R., F. Goodchild, and D. G. Janelle. 2009. Spatial thinking and
technologies in the undergraduate social science classroom. Journal of
Geography in Higher Education 33, Supplement: S17-S27.
Hmelo-Silver, C. E., and A. Nagarajan. 2002. "It's harder than we thought it would be":
A comparative case study of expert-novice experimentation strategies. Science
Education 86: 219-243.
Holland, J. L. 1959. A theory of vocational choice. Journal of Counseling Psychology 6:
35-45.
Holling, H., and F. Preckel. 2005. Self-estimates of intelligence: Methodological
approaches and gender differences. Personality and Individual Differences 38:
503-517.
209
Holt, D., D. G. Steel, and M. Tranmer. 1996. Area homogeneity and the modifiable unit
problem. Journal of Geographical Systems 3: 181-200.
Howell, D. C. 2010. Statistical Methods for Psychology. 7th ed. Belmont, CA: Cengage
Wadsworth.
Hsi, S., M. C. Linn, and J. E. Bell. 1997. The role of spatial reasoning in engineering and
the design of spatial instruction. Journal of Engineering Education 86: 151-158.
Hu, L., and P. M. Bentler. 1999. Cutoff criteria for fit indexes in covariance structure
analysis: Conventional criteria versus new alternatives. Structural Equation
Modeling 6: 1-55.
Huck, S. W. 2008. Reading Statistics and Research. 5th ed. Boston, MA: Pearson
Education.
Huttenlocher, J., S. Levine, and J. Vevea. 1998. Environmental input and cognitive
growth: A study using time-period comparisons. Child Development 69: 1012-
1029.
Huynh, N. T. 2009. The Role of Geospatial Thinking and Geographic Skills in Effective
Problem Solving with GIS: K-16 Education. Ph.D. diss., Wilfrid Laurier
University, Waterloo.
Inagaki, K., and G. Hatano. 2002. Conceptual change in naive biology. In Young
Children's Naive Thinking about the Biological World, 151-180. New York:
Psychology Press.
Ioannides, C., and S. Vosniadou. 2002. The changing meaning of force. Cognitive
Science Quarterly 2: 5-61.

210
Ishikawa, T., and K. A. Kastens. 2005. Why some students have trouble with maps and
other spatial representations. Journal of Geoscience Education 53: 184-197.
Janelle, D. G., and M. F. Goodchild. 2009. Location across disciplines: Reflections on
the CSISS experience. In Geospatial Technology and the Role of Location in
Science, eds. H. J. Scholten, R. Velde and N. van Manen, 15-29. Dordrecht:
Springer.
Janelle, D. G., and M. F. Goodchild. in press. Concepts, principles, tools, and challenges
in spatially integrated social science. In The SAGE Handbook of GIS and Society,
eds. T. Nyerges, H. Couclelis and R. McMaster: Sage Publications.
Jankowski, P., M.-H. Tsou, and R. D. Wright. 2007. Applying internet geographic
information system for water quality monitoring. Geography Compass 1: 1315-
1337.
Jenner, P. 2006. Engaging students through the use of GIS at Pimlico State High School.
International Research in Geographical and Environmental Education 15: 278-
282.
Jensen, R. R. 2002. Teaching GIS and remote sensing integration using fire ecology in
longleaf pine sandhills. Journal of Geoscience Education 50: 292-295.
Jiang, B., and X. Yao. 2010. Geospatial analysis and modeling of urban structure and
dynamics: An overview. In Geospatial Analysis and Modeling of Urban
Structure and Dynamics, eds. B. Jiang and X. Yao, 3-11. New York: Springer.
Jo, I., A. Klein, R. S. Bednarz, and S. W. Bednarz. in press. An exploration of spatial
thinking in introductory GIS courses. In Teaching Geographic Information

211
Science and Techology in Higher Education, eds. D. J. Unwin, K. E. Foote, N. J.
Tate and D. DiBiase. John Wiley & Sons.
Jonassen, D., and B. Grabowski. 1993. Handbook of Individual Differences, Learning,
and Instruction. Hillsdale, NJ: Lawrence Erlbaum Associates.
Kail, R., P. Carter, and J. W. Pellegrino. 1979. The locus of sex differences in spatial
ability. Perception and Psychophysics 26: 182-186.
Kali, Y., and N. Orion. 1996. Spatial abilities of high-school students in the perception
of geologic structures. Journal of Research in Science Teaching 33: 369-391.
Kali, Y., N. Orion, and E. Mazor. 1997. Software for assessing high-school students in
the spatial perception of geological structures. Journal of Geoscience Education
45: 10-21.
Kastens, K. A., and T. Ishikawa. 2006. Spatial thinking in the geosciences and cognitive
sciences: A cross-disciplinary look at the intersection of the two fields. In Earth
and Mind: How Geoscientists Think and Learn about the Complex Earth, eds. C.
A. Manduca and D. W. Mogk, 53-76. Boulder, CO: Geological Society of
America.
Kastens, K. A., C. A. Manduca, C. Cervato, R. Frodeman, C. Goodwin, L. S. Liben, D.
W. Mogk, T. C. Spangler, N. A. Stillings, and S. Titus. 2009. How geoscientists
think and learn. EOS 90 (31): 265-272.
Kawabata, M., R. B. Thapa, T. Oguchi, and M.-H. Tsou. 2010. Multidisciplinary
cooperation in GIS education: A case study of US colleges and universities.
Journal of Geography in Higher Education 34: 493-509.

212
Keeley, S. M., and M. N. Browne. 1986. How college seniors operationalize critical
thinking behavior. College Student Journal 20: 389-395.
Keiper, T. A. 1999. GIS for elementary students: An inquiry into a new approach to
learning geography. Journal of Geography 98: 47-59.
Kemp, K. K., M. F. Goodchild, and R. F. Dodson. 1992. Teaching GIS in geography.
Professional Geographer 44: 181-191.
Kennedy, M., M. B. Fisher, and R. H. Ennis. 1991. Critical thinking: Literature review
and needed research. In Educational Values and Cognitive Instruction:
Implications for Reform, eds. L. Idol and B. F. Jones, 11-40. Hillsdale, NJ:
Lawrence Erlbaum.
Kerski, J. J. 2003. The implementation and effectiveness of geographical information
systems technology and methods in secondary education. Journal of Geography
102: 128-137.
Kidman, G., and G. Palmer. 2006. GIS: The technology is there but the teaching is yet to
catch up. International Research in Geographical and Environmental Education
15: 289-296.
Kim, K. H., and P. M. Bentler. 2006. Data modeling: Structural equation modeling. In
Handbook of Complementary Methods in Education Research, eds. J. L. Green,
G. Camilli, P. B. Elmore, A. Skukauskaite and E. Grace, 161-175. Mahwah, NJ:
Lawrence Erlbaum Associates.

213
Kim, M., R. Bednarz, and S.-I. Lee. 2011. GIS education for teachers in South Korea:
Who participates and why? Journal of the Korean Geographical Society 46: 382-
395.
Kimmel, P. 1995. A framework for incorporating critical thinking into accounting
education. Journal of Accounting Education 13: 299-318.
Kissling, M. 2011. A call for Wikipedia in the classroom. Social Education 75: 60-64.
Kitchin, R. M. 1996. Are there sex differences in geographic knowledge and
understanding? The Geographical Journal 3: 273-286.
Klein, R. B. 2005. Principles and Practice of Structural Equation Modeling. New York:
The Guildford Press.
Kolb, D. 1981. Learning styles and disciplinary differences. In The Modern American
College, ed. A. W. Chickering, 232-255. San Francisco, CA: Jossey-Bass.
Kolb, D. A. 1984. Experiential Learning: Experience as a Source of Learning and
Development. Englewood Cliffs, NJ: Prentice Hall.
Kolvoord, B. 2008. Geospatial technologies: Real projects in real classrooms.
Knowledge Quest 36: 40-45.
Kozhevnikov, M., M. Hegarty, and R. E. Mayer. 2002. Revising the visualizer-
verbalizer dimension: Evidence for two types of visualizers. Cognition and
Instruction 20: 47-77.
Krehbiel, T. C. 2004. Correlation coefficient rule of thumb. Decision Sciences Journal of
Innovative Education 2: 97-100.

214
Krippendorff, K. 2004a. Content Analysis: An Introduction to Its Methodology. 2nd ed.
Thousand Oaks, CA: Sage.
———. 2004b. Reliability in content analysis: Some common misconceptions and
recommendations. Human Communication Research 30: 411-433.
Kubiszyn, T., and G. Borich. 2000. Educational testing and measurement. New York:
John Wiley and Sons.
Lajoie, S. P. 2003. Transitions and trajectories for studies of expertise. Educational
Researcher 32 (8): 21-25.
Larkin, J. H., and H. A. Simon. 1987. Why a diagram is (sometimes) worth ten thousand
words. Cognitive Science 11: 65-99.
Lauer, T. 2005. Teaching critical-thinking skills using course materials: A reversal of
roles. Journal of College Science Teaching 34 (6): 34-37.
Lee, J. 2005. Effect of GIS Learning on Spatial Ability. Ph.D. diss., Texas A&M
University, College Station.
Lee, J., and R. Bednarz. 2005. Video analysis of map-drawing strategies. Journal of
Geography 104: 211-221.
———. 2009. Effect of GIS learning on spatial thinking. Journal of Geography in
Higher Education 33: 183-198.
Leech, N. L., K. C. Barrett, and G. A. Morgan. 2008. SPSS for Intermediate Statistics:
Use and Interpretation. 3rd ed. New York: Lawrence Erlbaum Associates.
215
Leikin, R. 2007. Habits of mind associated with advanced mathematical thinking and
solution spaces of mathematical tasks. Paper presented at the Fifth Conference of
the European Society for Research in Mathematics Education. Larnaca, Cyprus.
Lesgold, A. M., H. Rubinson, P. J. Feltovich, R. Glaser, D. Klopfer, and Y. Wang. 1988.
Expertise in a complex skill: Diagnosing X-ray picture. In The Nature of
Expertise, eds. M. T. H. Chi, R. Glaser and M. Farr, 311-342. Hillsdale, NJ:
Lawrence Erlbaum Associates
Levrini, O., and A. A. diSessa. 2008. How students learn from multiple contexts and
definitions: Proper time as a coordination class. Physical Review Special Topics -
Physics Education Research 4 (1): 010107.
Libarkin, J. C., and C. Brick. 2002. Research methodologies in science education:
Visualization and the geosciences. Research Methodologies in Science Education
50: 449-455.
Liben, L. S., and R. M. Downs. 1986. Children's production and comprehension of
maps: Increasing graphic literacy. National Institute of Education.
Liben, L. S., and L. J. Myers. 2006. Developmental changes in children's understanding
of maps. In The Emerging Spatial Mind, eds. J. M. Plumert and J. P. Spencer,
193-218. New York: Oxford University Press.
Liben, L. S., and C. A. Yekel. 1996. Preschoolers' understanding of plan and oblique
maps: The role of geometric and representational correspondence. Child
Development 67: 2780-2796.

216
Lillich, H. 1999. Teaching skills and habits of mind in world history. The History
Teacher 32: 293-296.
Linn, M. C., and A. C. Petersen. 1985. Emergence and characterization of sex
differences in spatial ability: A meta-analysis. Child Development 56: 1479-
1498.
Linn, S., J. Kerski, and S. Wither. 2005. Development of evaluation tools for GIS: How
does GIS affect student learning? International Research in Geographical and
Environmental Education 14: 217-222.
Liu, S., and X. Zhu. 2008. Designing a structured and interactive learning environment
based on GIS for secondary geography education. Journal of Geography 107:
12-19.
Liu, Y., E. N. Bui, C.-H. Chang, and H. G. Lossman. 2010. PBL-GIS in secondary
geography education: Does it result in higher-order learning outcomes? Journal
of Geography 109: 150-158.
Lloyd, R. E. 2003. The interaction of biological and environmental effects on spatial
abilities: A review. Research in Geographic Education 5: 48-84.
Lombard, M., J. Snyder-Duch, and C. C. Bracken. 2002. Content analysis in mass
communication: Assessment and reporting of intercoder reliability. Human
Communication Research 28: 587-604.
Longley, P. A., M. F. Goodchild, D. J. Maguire, and D. W. Rhind. 2005. Geographic
Information Systems and Science. West Sussex, England: John Wiley & Sons.

217
Lord, T. R. 1987. A look at spatial abilities in undergraduate women science majors.
Journal of Research in Science Teaching 24: 757-767.
Lord, T. R., and J. L. Rupert. 1995. Visual-spatial aptitude in elementary education
majors in science and math tracks. Journal of Elementary Science Education 7
(2): 47-58.
Lund, J. J., and D. S. Sinton. 2007. Critical and creative visual thinking. In
Understanding Place: GIS and Mapping across the Curriculum, eds. D. S.
Sinton and J. J. Lund, 1-17. Redlands, CA: ESRI Press.
MacEachren, A. M., and J. H. Ganter. 1990. A pattern identification approach to
cartographic visualization. Cartographica 27: 64-81.
Mark, D. M. 2003. Geographic information science: Defining the field. In Foundations
of Geographic Information Science, eds. M. Duckham, M. F. Goodchild and M.
F. Worboys, 3-18. New York: Taylor and Francis.
Mark, J., A. Cuoco, P. Goldenberg, and S. Sword. 2010. Developing mathematical
habits of mind. Mathematics Teaching in the Middle School 15: 505-509.
Markwell, J., and D. W. Brooks. 2008. Evaluating web-based information: Access and
accuracy. Journal of Chemical Education 85: 458-459.
Marsh, H. W., and D. Hocevar. 1985. Application of confirmatory factor analysis to the
study of self-concept: First- and higher order factor models and their invariance
across groups. Psychological Bulletin 97: 562-582.

218
Marsh, M., R. G. Golledge, and S. E. Battersby. 2007. Geospatial concept understanding
and recognition in G6-college students: A preliminary argument for Minimal
GIS. Annals of the Association of American Geographers 97: 696-712.
Masters, M. S., and B. Sanders. 1993. Is the gender difference in mental rotation
disappearing? Behavior Genetics 23: 337-341.
Mathewson, J. H. 1999. Visual-spatial thinking: An aspect of science overlooked by
educators. Science Education: 33-54.
McArthur, J. M. 1996. Reexamining spatial ability within a Piagetian framework.
Journal of Research in Science Teaching 33: 1065-1082.
McMillan, J. H., and S. Schumacher. 2001. Research in Education: A Conceptual
Introduction. 5th ed. New York: Addison Wesley Longman.
Meece, J. L., J. Eccles-Parsons, C. M. Kaczala, S. B. Goff, and R. Futterman. 1982. Sex
differences in math achievement: Toward a model of academic choice.
Psychological Bulletin 91: 324-348.
Mendicino, L. 1958. Mechanical reasoning and space perception: Native capacity of
experience. Personality Guidance Journal 36: 335-338.
Milicich, M., C. Stringer, and R. L. Heron. 2003. Learning styles of Auckland
geography students: Some preliminary findings. New Zealand Journal of
Geography 115: 49-52.
Miller, J., C. T. Keller, and L. D. Yore. 2005. Suggested geographic information literacy
for K-12. International Research in Geographical and Environmental Education
14: 243-260.

219
Milson, A. J., and M. Alibrandi. 2008. Critical map literacy and geographic information
systems: The spatial dimension of civic decision making. In The Electronic
Republic? The Impact of Technology on Education for Citizenship, eds. P. J.
VanFossen and M. J. Berson, 110-128. West Lafayette, IN: Purdue University
Press.
Milson, A. J., and M. D. Curtis. 2009. Where and why there? Spatial thinking with
geographic information systems. Social Education 73: 113-118.
Milson, A. J., L. M. DeChano, R. L. Bunch, J. Caito, and X. Qiu. 2005. GIS in K-12
education: Pedagogical tool or weapon of mass distraction? Research in
Geographic Education 7: 62-73.
Milson, A. J., and B. D. Earle. 2007. Internet-based GIS in an inductive learning
environment: A case study of ninth-grade geography students. Journal of
Geography 106: 227-237.
Mitchell, J. T., K. A. Borden, and M. C. Schmidtlein. 2008. Teaching hazards geography
and geographic information systems: A middle school level experience.
International Research in Geographical and Environmental Education 17: 170-
188.
Mitchelmore, M. 1980. Three dimensional geometrical drawings in three cultures.
Educational Studies in Mathematics 11: 205-216.
Montello, D. R., K. K. Lovelace, R. G. Golledge, and C. M. Self. 1999. Sex-related
differences and similarities in geographic and environmental spatial abilities.
Annals of the Association of American Geographers 89: 515-534.
220
National Research Council. 2000. How People Learn: Brain, Mind, Experience, and
School. Washington, DC: National Academy Press.
———. 2006. Learning to Think Spatially: GIS as a Support System in the K-12
Curriculum. Washington, DC: The National Academies Press.
National Science Board. 2010. Preparing the next generation of STEM innovators:
Identifying and developing our nation's human capital. Arlington, VA: National
Science Foundation.
Nersessian, N. 1992. Constructing and instructing: The role of "abstract techniques" in
creating and learning physics. In Philosophy of Science, Cognitive Psychology,
and Educational Theory and Practice eds. R. A. Duschl and R. J. Hamilton, 48-
68. New York: State University of New York Press.
Neuendorf, K. A. 2002. The Content Analysis Guidebook. Thousand Oaks: CA: Sage.
Newbold, P., W. L. Carlson, and B. M. Thorne. 2003. Statistics for Business and
Economics. 5th ed. Upper Saddle River, NJ: Prentice Hall.
Newcombe, N. S. 2010. Picture this: Increasing math and science learning by improving
spatial thinking. American Educator 34 (2): 29-35, 43.
Nielsen, C. P., A. Oberle, and R. Sugumaran. 2011. Implementing a high school level
geospatial technologies and spatial thinking course. Journal of Geography 110:
60-69.
Nordvik, H., and B. Amponsah. 1998. Gender differences in spatial abilities and spatial
activity among university students in an egalitarian educational system. Sex Roles
38: 1009-1023.

221
Nori, R., and F. Giusberti. 2006. Predicting cognitive styles from spatial abilities.
American Journal of Psychology 119: 67-86.
Norris, S. P. 1985. Synthesis of research on critical thinking. Educational Leadership 42
(8): 40-45.
———. 1988. Controlling for background beliefs when developing multiple-choice
critical thinking tests. Educational Measurement: Issues and Practice 7 (3): 5-11.
———. 1989. Can we test validly for critical thinking? Educational Researcher 18 (9):
21-26.
Nystuen, J. D. 1963. Identification of some fundamental spatial concepts. Papers of the
Michigan Academy of Science, Arts, and Letters XLVIII: 373-384.
Oberle, A. P., S. A. Joseph, and D. W. May. 2010. Geospatial technologies as a vehicle
for enhancing graduate education and promoting the value of geography. Journal
of Geography in Higher Education 34: 475-492.
Olejnik, S., and J. Algina. 2003. Generalized eta and omega squared statistics: Measures
of effect size for some common research design. Psychological Methods 8: 434-
447.
Oosterhof, A. 1994. Classroom Applications of Educational Measurement. 2nd ed.
Englewood Cliffs, NJ: Macmillan Publishing Company.
Orion, N., D. Ben-Chaim, and Y. Kali. 1997. Relationship between earth-science
education and spatial visualization. Journal of Geoscience Education 45: 129-
132.
222
Pallrand, G., and F. Seeber. 1984. Spatial abilities and achievement in introductory
physics. Journal of Research in Science Teaching 21: 507-516.
Parsons, J. E., D. N. Ruble, K. L. Hodges, and A. W. Small. 1976. Cognitive-
developmental factors in emerging sex differences in achievement-related
expectancies. Journal of Social Issues 32: 47-61.
Patterson, M. W., K. Reeve, and D. Page. 2003. Integrating geographic information
systems into the secondary curricula. Journal of Geography 102: 275-281.
Patterson, T. C. 2007. Google Earth as a (not just) geography education tool. Journal of
Geography 106: 145-152.
Perkins, D. N., E. Jay, and S. Tishman. 1993. Beyond abilities: A dispositional theory of
thinking. Merrill-Palmer Quarterly 39: 1-21.
Peterson, K. D., Jr. 2000. Using a geographic information system to teach economics.
Journal of Economic Education 2: 169-178.
Piaget, J., and B. Inhelder. 1967. The Child's Conception of Space. New York: Norton.
Piburn, M. D., S. J. Reynolds, D. E. Leedy, C. M. MaAuliffe, J. P. Birk, and J. K.
Johnson. 2002. The hidden Earth: Visualization of geologic features and their
subsurface geometry. Paper presented at the Annual Meeting of the National
Association for Research in Science Teaching. New Orleans, LA.
Pithers, R. T., and R. Soden. 2000. Critical thinking in education: A review. Educational
Research 42: 237-249.
Poole, C., and G. Stanley. 1972. A factorial and predictive study of spatial abilities.
Australian Journal of Psychology 24: 317-320.
223
Preckel, F., H. Holling, and M. Vock. 2006. Academic underachievement: Relationship
with cognitive motivation, achievement motivation, and conscientiousness.
Psychology in the Schools 43: 401-411.
Presmeg, N. 2008. Spatial abilities research as a foundation for visualization in teaching
and learning mathematics. In Critical Issues in Mathematics Education, eds. P.
Clarkson and N. Presmeg, 83-95. New York: Springer.
Qiu, X. 2006. Geographic Information Technologies: An Influence on the Spatial Ability
of University Students? Ph.D. diss., Texas State University, San Marcos.
Quaiser-Pohl, C., and W. Lehmann. 2002. Girls' spatial abilities: Charting the
contributions of experiences and attitudes in different academic groups. British
Journal of Educational Psychology 72: 245-260.
Rafi, A., K. A. Samsudin, and C. S. Said. 2008. Training in spatial visualization: The
effects of training method and gender. Educational Technology & Society 11 (3):
127-140.
Ramirez, M. 1996. A driving force in technology education: Geographic information
systems (GIS). TechTrends 41: 34-36.
Read, J. M. 2010. Teaching introductory geographic information systems through
problem-based learning and public scholarship. Journal of Geography in Higher
Education 34: 379-399.
Rees, P. W., and J. A. Silberman. 2010. The Delaware geography-health initiative:
Lessons learned in designing a GIS-based curriculum. Journal of Geography
109: 61-74.

224
Rennie, L. J., and K. F. Punch. 1991. The relationship between affect and achievement
in science. Journal of Research in Science Teaching 28: 193-209.
Rhind, D. 1992. The next generation of geographical information systems and the
context in which they will operate. Computers, Environment and Urban Systems
16: 261-268.
Rieber, L. P. 1995. A historical review of visualization in human cognition. Educational
Technology Research and Development 43: 45-56.
Roberts, T.-A. 1991. Gender and the influence of evaluations on self-assessments in
achievement settings. Psychological Bulletin 109: 297-308.
Roberts, T.-A., and S. Nolen-Hoeksema. 1994. Gender comparisons in responsiveness to
others' evaluations in achievement settings. Psychology of Women Quarterly 18:
221-240.
Rudd, R., M. Baker, and T. Hoover. 2000. Undergraduate agriculture student learning
styles and critical thinking abilities: Is there a relationship? Journal of
Agricultural Education 41 (3): 2-12.
Rutherford, D. 2002. Building empirically-based theory in geography education.
International Research in Geographical and Environmental Education 11: 283-
286.
Saccuzzo, D. P., A. S. Craig, N. E. Johnson, and G. E. Larson. 1996. Gender differences
in dynamic spatial abilities. Personality and Individual Differences 21: 599-607.

225
Saleh, I. M., and M. S. Khine. 2009. Fostering Scientific Habits of Mind: Pedagogical
Knowledge and Best Practices in Science Education. Rotterdam, The
Netherlands: Sense Publishers.
Salsbury, D. E. 2006. Comparing teacher-directed and computer-assisted instruction of
elementary geographic place vocabulary. Journal of Geography 105: 147-154.
Schmidt, F. L. 1996. Statistical significance testing and cumulative knowledge in
psychology: Implications for training of researchers. Psychological Methods 1:
115-129.
Schrock, K. 2007. Critical evaluation in the collaborative era. Technology & Learning
28 (3): 38-39.
Schultz, R. B., J. J. Kerski, and T. C. Patterson. 2008. The use of virtual globes as a
spatial teaching tool with suggestions for metadata standards. Journal of
Geography 107: 27-34.
Schunk, D. H. 2008. Learning Theories: An Educational Perspective. 5th ed. Upper
Saddle River, NJ: Pearson Education.
Self, C. M., and R. G. Golledge. 1994. Sex-related differences in spatial ability: What
every geography educators should know. Journal of Geography 93: 234-243.
Self, C. M., S. Gopal, R. G. Golledge, and S. Fenstermaker. 1992. Gender-related
differences in spatial abilities. Progress in Human Geography 16: 315-342.
Shadish, W. R., T. D. Cook, and D. T. Campbell. 2002. Experimental and Quasi-
Experimental Designs for Generalized Causal Inference. Boston, MA: Houghton
Mifflin Company.

226
Shepard, N. S. 1978. Externalization of mental images and the act of creation. In Visual
Learning, Thinking and Communication, eds. B. S. Randhawa and W. E.
Coffman, 133-189. London: Academic Press.
Shepard, R. 1988. The imagination of the scientist. In Imagination and Education, eds.
K. Egan and D. Nadaner, 153-185. New York: Teachers College Press.
Shepherd, I. D. H. 2009. From geography department to business school: Strategies for
translating GIS courses between disciplines. Journal of Geography in Higher
Education 33, Supplement 1: S28-S45.
Shin, E. 2006. Using geographic information system (GIS) to improve fourth graders'
geographic content knowledge and map skills. Journal of Geography 105: 109-
120.
Shin, K., D. Jung, S. Shin, and M. Kim. 2006. Critical thinking dispositions and skills of
senior nursing students in associate, baccalaureate, and RN-to-BSN programs.
Journal of Nursing Education 45: 233-237.
Siemankowski, F. T., and F. C. MacKnight. 1971. Spatial cognition: Success
prognosticator in college science courses. Journal of College Science Teacher 1:
56-59.
Silverman, I., and M. Eals. 1992. Sex differences in spatial ability: Evolutionary theory
and data. In The Adapted Mind: Evolutionary Psychology and the Generation of
Culture, eds. J. H. Barkow, L. Cosmides and J. Tooby, 533-549. New York:
Oxford University Press.

227
Sinton, D. S. 2009. Roles for GIS within higher education. Journal of Geography in
Higher Education 33, Supplement: S7-S16.
Sinton, D. S., and S. W. Bednarz. 2007. About that G in GIS. In Understanding Place:
GIS and Mapping Across the Curriculum, eds. D. S. Sinton and J. J. Lund, 19-33.
Redlands, CA: ESRI Press.
Sinton, D. S., and R. B. Schultz. 2009. GIS and mapping technologies: Applications for
reasoning and critical thinking. In Teaching College Geography: A Practical
Guide for Graduate Students and Early Career Faculty, eds. M. Solem and K.
Foote, 69-80. Upper Saddle River, NJ: Pearson.
Smith, I. 1964. Spatial Ability. London: University of London Press.
Smith, W. S., and C. K. Schroeder. 1981. Preadolescents' learning and retention of a
spatial visualization skill. School Science and Mathematics 81: 705-709.
Songer, L. C. 2010. Using web-based GIS in introductory human geography. Journal of
Geography in Higher Education 34: 401-417.
Stapleton, P. 2011. A survey of attitudes towards critical thinking among Hong Kong
secondary school teachers: Implications for policy change. Thinking Skills and
Creativity 6: 14-23.
Steinkuehler, C., and S. Duncan. 2008. Scientific habits of mind in virtual worlds.
Journal of Science Education and Technology 17: 530-543.
Sternberg, R. J. 1987. Teaching critical thinking: Eight ways to fail before you begin.
Phi Delta Kappan 68: 456-459.
Sternberg, R. J. 2003. What is an "expert student?". Educational Researcher 32 (8): 5-9.

228
Sternberg, R. J., and J. B. Baron. 1985. A statewide approach to measuring critical
thinking skills. Educational Leadership 43 (2): 40-43.
Stoltman, J., S. Bednarz, S. Hume, J. Marran, C. Fitzpatrick, L. Lewis, S. Gallagher, and
J. Bock. 2008. Geography for life: Second edition. Paper presented at the Annual
Meeting of the National Council for Geographic Education. Dearborn, MI.
Stylianou, D. A., and E. A. Silver. 2004. The role of visual representations in advanced
mathematical problem solving: An examination of expert-novice similarities and
differences. Mathematical Thinking and Learning 6: 353-387.
Subrahmanyam, K., and P. M. Greenfield. 1994. Effect of video game practice on spatial
skills in girls and boys. Journal of Applied Developmental Psychology 15: 13-32.
Sui, D. Z. 1995. A pedagogic framework to link GIS to the intellectual core of
geography. Journal of Geography 94: 578-591.
———. 2008. The wikification of GIS and its consequences: Or Angelina Jolie's new
tattoo and the future of GIS. Computers, Environment and Urban Systems 32: 1-
5.
———. 2010. GeoJournal: A new focus on spatially integrated social sciences and
humanities. GeoJournal 75: 1-2.
Summerby-Murray, R. 2001. Analysing heritage landscapes with historical GIS:
Contributions from problem-based inquiry and constructivist pedagogy. Journal
of Geography in Higher Education 25: 37-52.
Swanson, P. E. 2010. The intersection of language and mathematics. Mathematics
Teaching in the Middle School 15: 516-523.

229
Tapscott, D. 2009. Grown Up Digital: How the Net Generation Is Changing Your
World. New York: McGraw Hill.
Tate, N. J., C. H. Jarvis, and K. E. Moore. 2005. Locating spatial thinking in teaching
practice. Computers, Environment and Urban Systems 29: 87-91.
Taube, K. T. 1997. Critical thinking ability and disposition as factors of performance on
a written critical thinking test. Journal of General Education 46: 129-164.
Thoemmes, F. J., and E. S. Kim. 2011. A systematic review of propensity score methods
in the social sciences. Multivariate Behavioral Research 46: 90-118.
Thompson, B. 2002. "Statistical," "practical," and "clinical": How many kinds of
significance do counselors need to consider? Journal of Counseling and
Development 80: 64-80.
———. 2006. Foundations of Behavioral Statistics. New York: The Guilford Press.
Tinker, R. F. 1992. Mapware: Educational applications of geographic information
systems. Journal of Science Education and Technology 1: 35-47.
Titus, S., and E. Horsman. 2009. Characterizing and improving spatial visualization
skills. Journal of Geoscience Education 57: 242-254.
Tsou, M.-H., and K. Yanow. 2010. Enhancing general education with geographic
information science and spatial literacy. URISA Journal 22: 45-54.
Tsui, L. 2002. Fostering critical thinking through effective pedagogy: Evidence from
four institutional case studies. Journal of Higher Education 73: 740-763.
———. 2008. Cultivating critical thinking: Insights from an elite liberal arts college.
Journal of General Education 56: 200-227.
230
Tzuriel, D., and G. Egozi. 2010. Gender differences in spatial ability of young children:
The effects of training and processing strategies. Child Development 81: 1417-
1430.
US Census Bureau. 2005. http://factfinder.census.gov (accessed September 22, 2011).
Uttal, D. H. 2000. Seeing the big picture: map use and the development of spatial
cognition. Developmental Science 3: 247-264.
Uttal, D. H., J. A. Fisher, and H. A. Taylor. 2006. Words and maps: Developmental
changes in mental models of spatial information acquired from descriptions and
depictions. Developmental Science 9: 221-235.
Uttal, D. H., and H. M. Wellman. 1989. Children's mental representation of spatial
information acquired from maps. Developmental Psychology 25: 128-138.
Vamvakoussi, X., and S. Vosniadou. 2004. Understanding the structure of the set of
rational numbers: A conceptual change approach. Learning and Instruction 14:
453-467.
Verplanken, B., and H. Aarts. 1999. Habit, attitude, and planned behavior: Is habit an
empty construct or an interesting case of goal-directed automaticity? Vol. 10. In
European Review of Social Psychology, eds. W. Stroebe and M. Hewstone, 101-
134. West Sussex, England: John Wiley & Sons.
Vincent, P. 2010. Structure and content of introductory GIS courses. Paper presented at
the Annual Meeting of the National Council for Geographic Education. GA:
Savannah.

231
Vincent, P. C. 2004. Using Cognitive Measures to Predict the Achievement of Students
Enrolled in an Introductory Course of Geographic Information Systems. Ph.D.
diss., Texas A&M University, College Station.
Vollmer, F. 1986. Why do men have higher expectancy than women? Sex Roles 14: 351-
362.
Vosniadou, S., and W. F. Brewer. 1992. Mental models of the Earth: A study of
conceptual change in childhood. Cognitive Psychology 24: 535-585.
———. 1994. Mental models of the day/night cycle. Cognitive Science 18: 123-183.
Voyer, D., A. Postma, B. Brake, and J. Imperato-McGinley. 2007. Gender difference in
object location memory: A meta-analysis. Psychonomic Bulletin & Review 14:
23-38.
Voyer, D., S. Voyer, and M. P. Bryden. 1995. Magnitude of sex differences in spatial
abilities: A meta-analysis and consideration of critical variables. Psychological
Bulletin 117: 250-270.
Wade, S. E. 1990. Using think alouds to assess comprehension. The Reading Teacher
43: 442-451.
Walqui, A. 2006. Scaffolding instruction for English language learners: A conceptual
framework. International Journal of Bilingual Education and Bilingualism 9:
159-180.
Weeden, P. 1997. Learning through maps. In Teaching and Learning Geography, eds. D.
Tilbury and M. Williams, 168-179. New York: Routledge.

232
Weiss, E. M., G. Kemmler, E. A. Deisenhammer, W. W. Fleischhacker, and M. Delazer.
2003. Sex differences in cognitive functions. Personality and Individual
Differences 35: 863-875.
West, B. A. 1999. Geographical literacy and the role of GIS. New Zealand Journal of
Geography 24: 24-25.
West, B. A. 2003. Student attitudes and the impact of GIS on thinking skills and
motivation. Journal of Geography 102: 267-274.
Wiegand, P. 2003. School students' understanding of choropleth maps: Evidence from
collaborative mapmaking using GIS. Journal of Geography 102: 234-242.
Wigglesworth, J. C. 2003. What is the best route? Route-finding strategies of middle
school students using GIS. Journal of Geography 102: 282-291.
Wilkinson, L., and Task Force on Statistical Inference. 1999. Statistical methods in
psychology journals. American Psychologist 54: 594-604.
Willett, K. B., and E. W. Sanderson. 2000. Taking GIS into the wild: Teaching GIS to
practicing international conservation biologists. Bulletin of the Ecological Society
of America 81: 276-281.
Williams, K. B., C. Schmidt, T. S. I. Tilliss, K. Wilkins, and D. R. Glasnapp. 2006.
Predictive validity of critical thinking skills and disposition for the National
Board Dental Hygiene Examination: A preliminary investigation. Journal of
Dental Education 70: 536-544.
Williams, L. J., L. R. Ford, and N. Nguyen. 2002. Basic and advanced measurement
models for confirmatory factor analysis. In Handbook of Research Methods in

233
Industrial and Organizational Psychology, ed. S. G. Rogelberg, 366-389.
Malden, MA: Blackwell Publishers.
Willson, V. L., and R. R. Putman. 1982. A meta-analysis of pretest sensitization effects
in experimental design. American Educational Research Journal 19: 249-258.
Wilson, V. L. 1983. A meta-analysis of the relationship between science achievement
and science attitude: Kindergarten through college. Journal of Research in
Science Teaching 20: 839-850.
Winner, E., L. Hetland, S. Veenema, K. Sheridan, and P. Palmer. 2006. Studio thinking:
How visual arts teaching can promote disciplined habits of mind. In New
Directions in Aesthetics, Creativity, and the Arts, eds. P. Locher, C. Martindale,
L. Dorfman and D. Leontiev, 189-205. Amityville, NY: Baywood Publishing
Company.
Wolcott, S. K., C. P. Baril, B. M. Cunningham, D. R. Fordham, and K. St. Pierre. 2002.
Critical thought on critical thinking research. Journal of Accounting Education
20: 80-103.
Wright, D. J., M. F. Goodchild, and J. D. Proctor. 1997. GIS: Tool or science?
Demystifying the persistent ambiguity of GIS as "Tool" versus "Science". Annals
of the Association of American Geographers 87: 346-362.
Wright, R., W. L. Thompson, G. Gains, N. S. Newcombe, and S. M. Kosslyn. 2008.
Training generalized spatial skills. Psychonomic Bulletin & Review 15: 763-771.
Yager, R. E. 1983. The importance of terminology in teaching K-12 science. Journal of
Research in Science Teaching 20: 577-588.

234
Yang, J. C., and S. Y. Chen. 2010. Effects of gender differences and spatial abilities
within a digital pentominoes game. Computers & Education 55: 1220-1233.

235
APPENDIX A

236
Personal Information
1. Name: 2. Major: 3. Freshman / Sophomore / Junior / Senior / Graduate 4. Gender: Male / Female 5. Did you take a GIS course or are you taking a GIS course this
semester? Yes / No • If “Yes,” please list the GIS course you have taken (GIS courses
include Computer Cartography and Remote Sensing related courses): Previous Semester:
Current Semester:
Spatial Habits of Mind Inventory
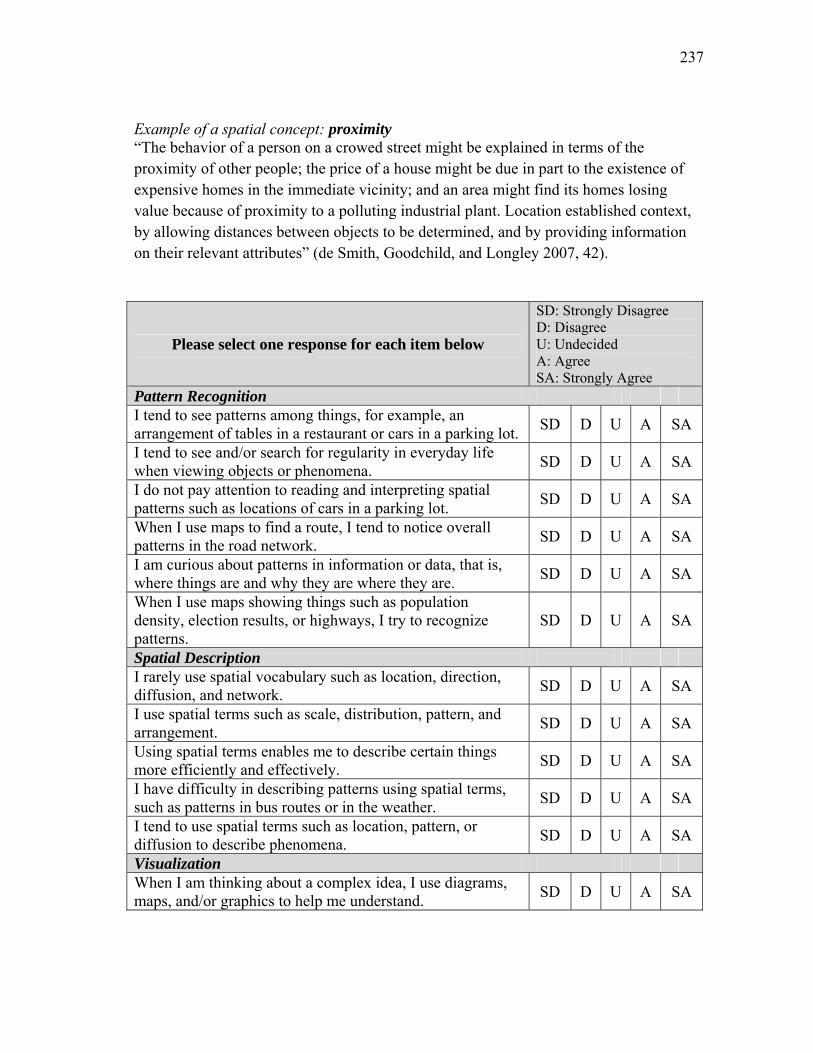
237
Example of a spatial concept: proximity “The behavior of a person on a crowed street might be explained in terms of the proximity of other people; the price of a house might be due in part to the existence of expensive homes in the immediate vicinity; and an area might find its homes losing value because of proximity to a polluting industrial plant. Location established context, by allowing distances between objects to be determined, and by providing information on their relevant attributes” (de Smith, Goodchild, and Longley 2007, 42).
Please select one response for each item below
SD: Strongly Disagree D: Disagree U: Undecided A: Agree SA: Strongly Agree
Pattern Recognition I tend to see patterns among things, for example, an arrangement of tables in a restaurant or cars in a parking lot.
SD D U A SA
I tend to see and/or search for regularity in everyday life when viewing objects or phenomena.
SD D U A SA
I do not pay attention to reading and interpreting spatial patterns such as locations of cars in a parking lot.
SD D U A SA
When I use maps to find a route, I tend to notice overall patterns in the road network.
SD D U A SA
I am curious about patterns in information or data, that is, where things are and why they are where they are.
SD D U A SA
When I use maps showing things such as population density, election results, or highways, I try to recognize patterns.
SD D U A SA
Spatial Description I rarely use spatial vocabulary such as location, direction, diffusion, and network.
SD D U A SA
I use spatial terms such as scale, distribution, pattern, and arrangement.
SD D U A SA
Using spatial terms enables me to describe certain things more efficiently and effectively.
SD D U A SA
I have difficulty in describing patterns using spatial terms, such as patterns in bus routes or in the weather.
SD D U A SA
I tend to use spatial terms such as location, pattern, or diffusion to describe phenomena.
SD D U A SA
Visualization When I am thinking about a complex idea, I use diagrams, maps, and/or graphics to help me understand.
SD D U A SA

238
It is difficult for me to construct diagrams or maps to communicate or analyze a problem.
SD D U A SA
When a problem is given in written or verbal form, I try to transform it into visual or graphic representation.
SD D U A SA
When I assemble something such as furniture, a bicycle, or a computer, written instructions are more helpful to me than pictorial instructions.
SD D U A SA
I find that graphs, charts, or maps help me learn new concepts.
SD D U A SA
It is helpful for me to visualize physical phenomena such as hurricanes or weather fronts to understand them.
SD D U A SA
I like to support my arguments/presentations using maps and diagrams.
SD D U A SA
I like to study data or information with the help of graphics such as charts or diagrams.
SD D U A SA
Spatial Concept Use When trying to solve some types of problems, I tend to consider location and other spatial factors.
SD D U A SA
I have difficulty in explaining spatial concepts such as scale and map projection to my friends.
SD D U A SA
When reading a newspaper or watching news on television, I often consider spatial concepts such as location of the places featured in the news story.
SD D U A SA
Spatial concepts, such as location and scale, do not help me solve problems.
SD D U A SA
Spatial Tool Use I use maps and atlases (including digital versions) frequently.
SD D U A SA
I do not like using maps and atlases (including digital versions).
SD D U A SA
I enjoy looking at maps and exploring with mapping software such as Google Earth and GIS.
SD D U A SA
Activities that use maps are difficult and discourage me. SD D U A SA I like to use spatial tools such as maps, Google Earth, or GPS.
SD D U A SA

239
APPENDIX B
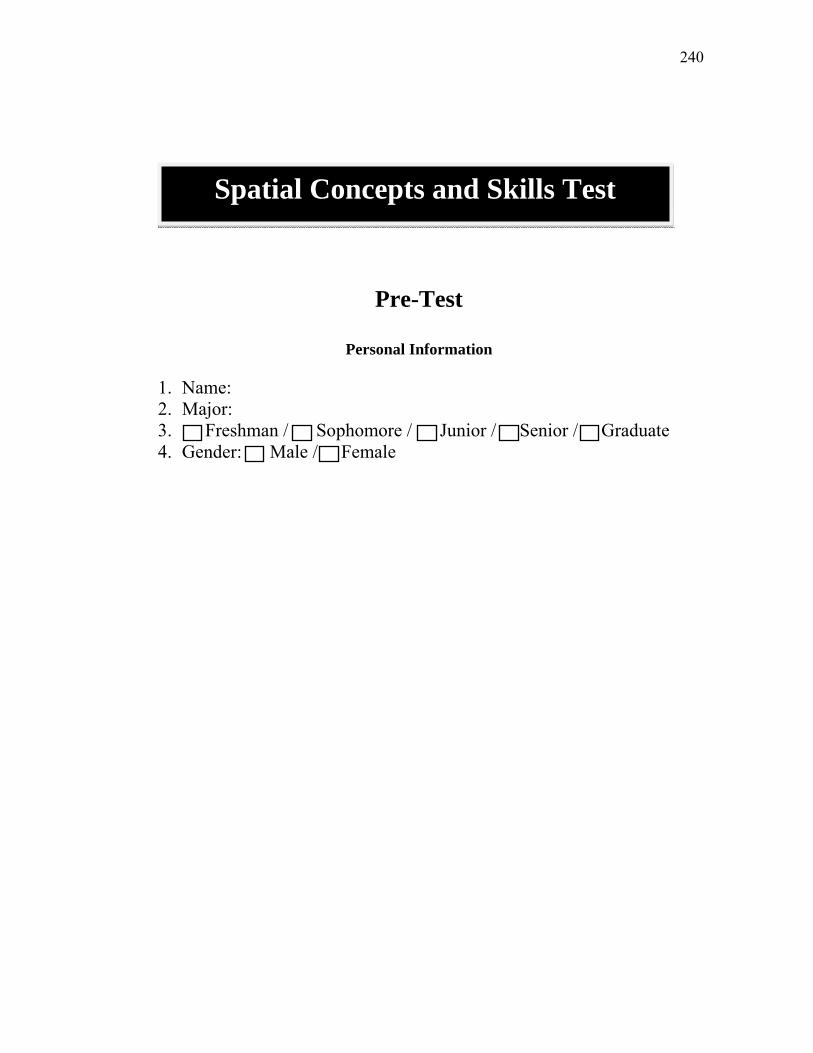
240
Pre-Test
Personal Information
1. Name: 2. Major: 3. Freshman / Sophomore / Junior / Senior / Graduate 4. Gender: Male / Female
Spatial Concepts and Skills Test
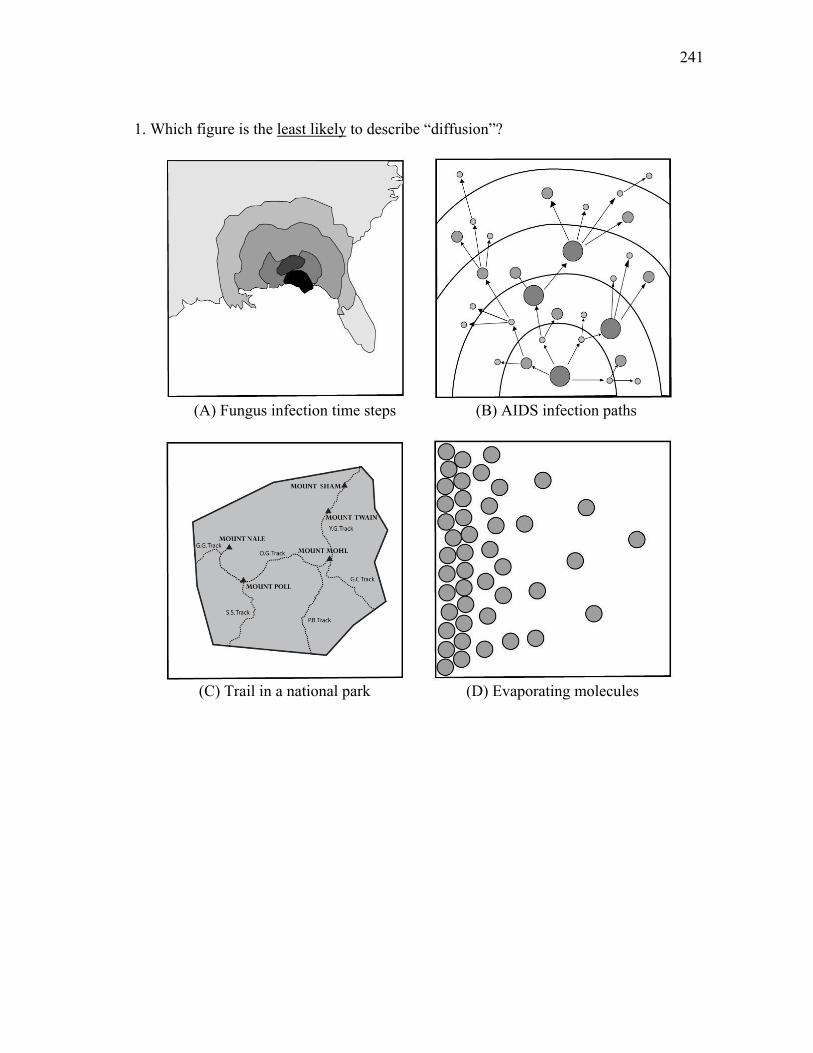
241
1. Which figure is the least likely to describe “diffusion”?
(A) Fungus infection time steps (B) AIDS infection paths
(C) Trail in a national park (D) Evaporating molecules

242
2. Imagine you are standing at location X and looking in the direction of A and B. Among the 5 slope profiles (A – E), which profile most closely represents what you would see?

243
3. You are planning to find a place to open a new ice cream store. The map below shows the location of existing stores and their market areas. What concept best describes the techniques needed to illustrate the situation?
(A) Isolation (B) Buffer (C) Gradient (D) Corridor (E) Surface

244
4. You are given the task to construct a contour map using the following elevation data. You have to complete the map on the right following the same contour intervals as the map on the left.
5. What is the spatial concept used when you completed the above right map?
(A) Distribution (B) Distance (C) Spatial buffer (D) Spatial interpolation (E) Central Place

245
Direction: Answer question on the basis of the street map below.
6. If you are located at point 1 and travel north one block, then turn west and travel three blocks, and then turn south and travel two blocks, what point will you be closest (nearest) to? (A) 2 (B) 3 (C) 4 (D) 5 (E) 6 7. If you are located at point 1 and travel west one block, then turn left and travel three, then turn west and travel two blocks, and then turn right and travel two blocks, what point will you be closest (nearest) to? (A) 2 (B) 3 (C) 4 (D) 5 (E) 6
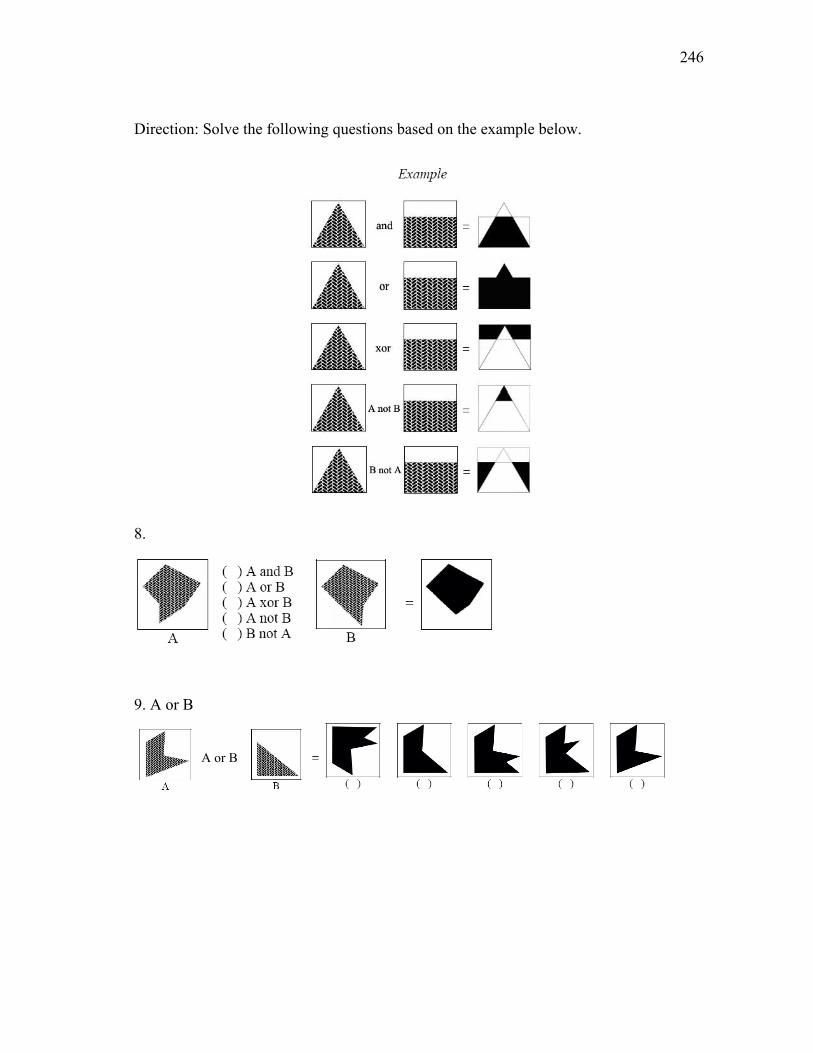
246
Direction: Solve the following questions based on the example below.
8.
9. A or B
A or B
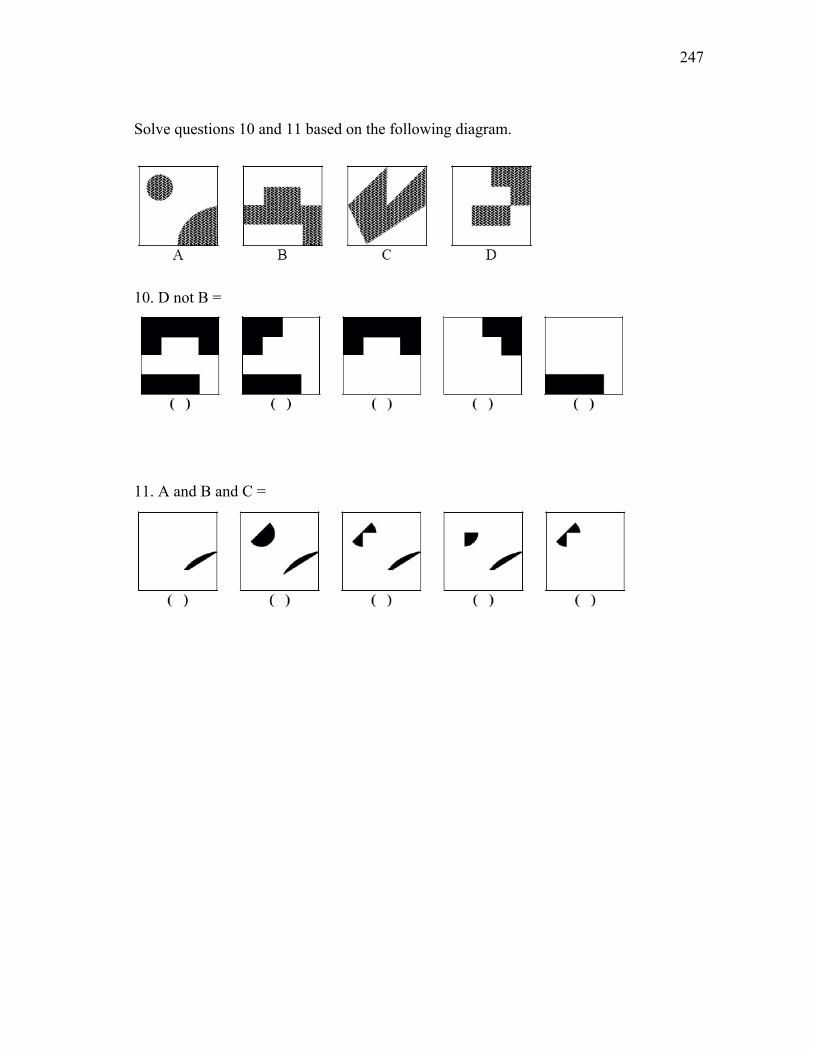
247
Solve questions 10 and 11 based on the following diagram.
10. D not B =
11. A and B and C =

248
Direction: Real world objects can be represented explicitly by different spatial elements: a point, a line (arc), and/or an area (polygon). For each example below, identify which spatial element would best represent it.
Example
Point Line Area
·
Ex. trees, road interactions, poles in distribution networks
Ex. roads, rivers Ex. the areal extent of a city, an area of a continent
12. Locations of weather stations and the Brazos County (A) Lines (B) Area (C) Points and Lines (D) Points and Area 13. Mississippi River channels and their basins (A) Lines (B) Area (C) Points and Lines (D) Lines and Area 14. Shuttle bus stops and route of the Patterson Middle School (A) Points (B) Area (C) Points and Lines (D) Points and Area 15. Places that can be reached by Franklin County fire engines in 5 minutes or less (A) Points (B) Lines (C) Points and Area (D) Points and Lines

249
Direction: Your job is to find maps that have spatial correlations. For example, map (B) and map (D) have positive correlations (similar patterns).
16. Find a map (A – F) having a strong positive correlation with the map on the left. (Choose the closest one)
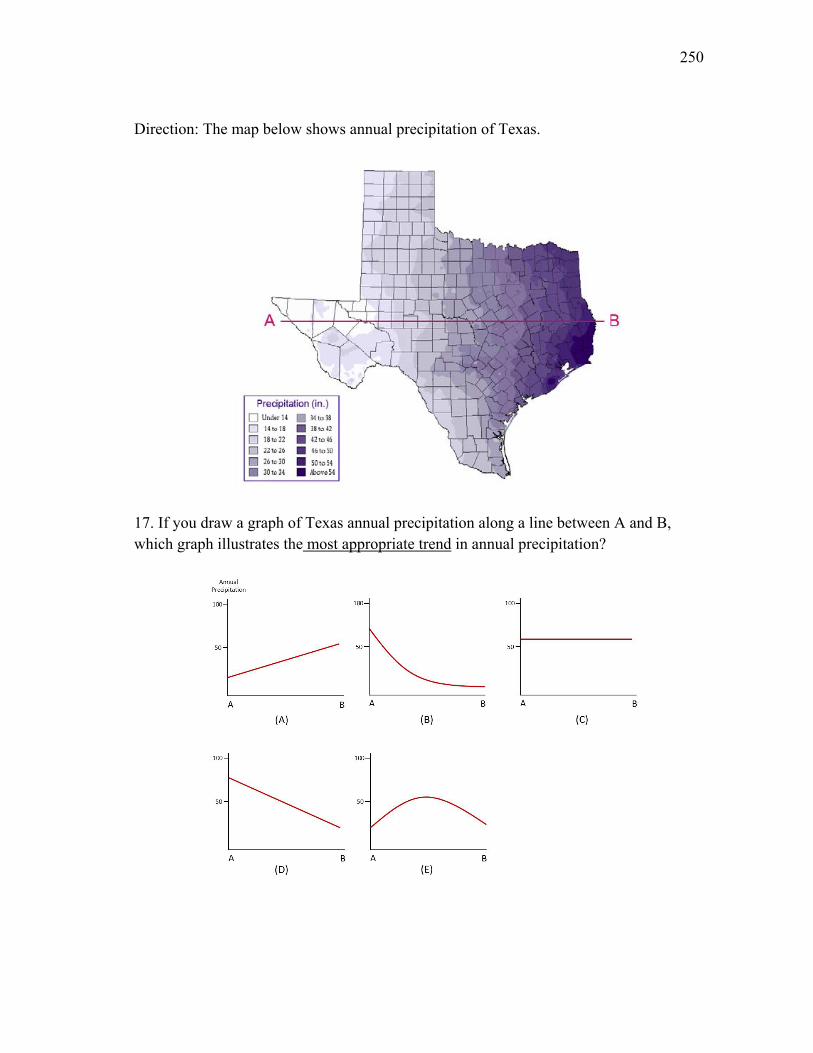
250
Direction: The map below shows annual precipitation of Texas.
17. If you draw a graph of Texas annual precipitation along a line between A and B, which graph illustrates the most appropriate trend in annual precipitation?
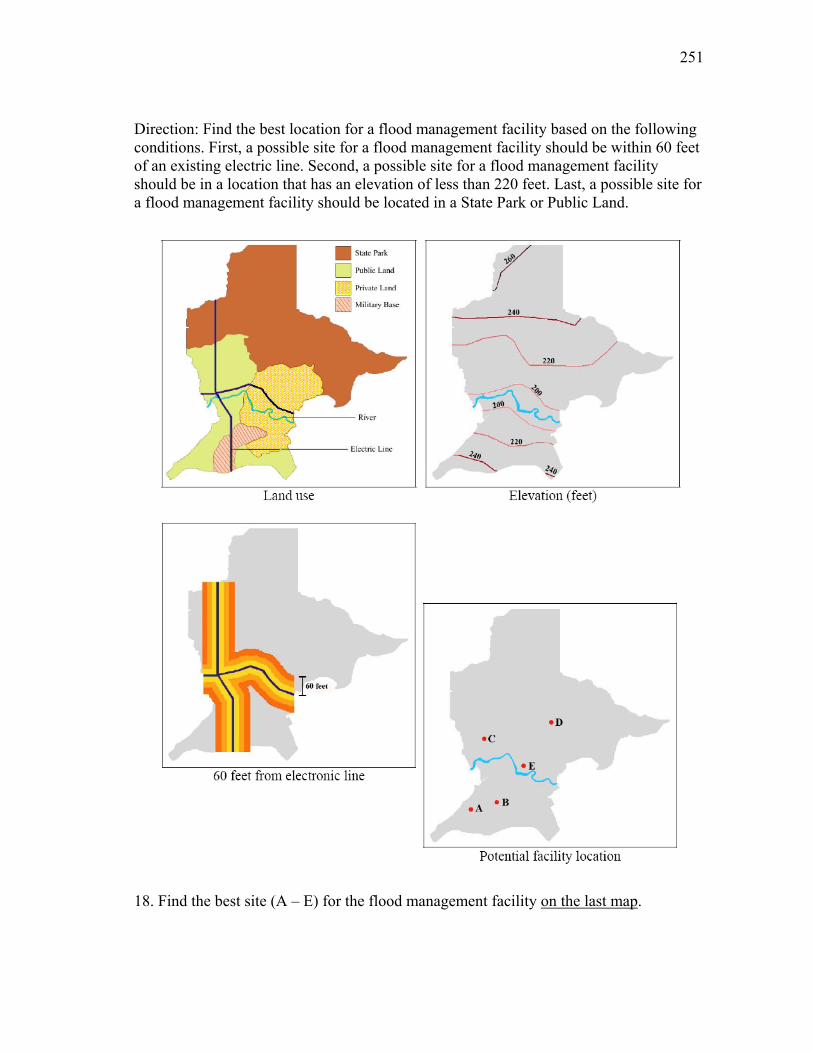
251
Direction: Find the best location for a flood management facility based on the following conditions. First, a possible site for a flood management facility should be within 60 feet of an existing electric line. Second, a possible site for a flood management facility should be in a location that has an elevation of less than 220 feet. Last, a possible site for a flood management facility should be located in a State Park or Public Land.
18. Find the best site (A – E) for the flood management facility on the last map.
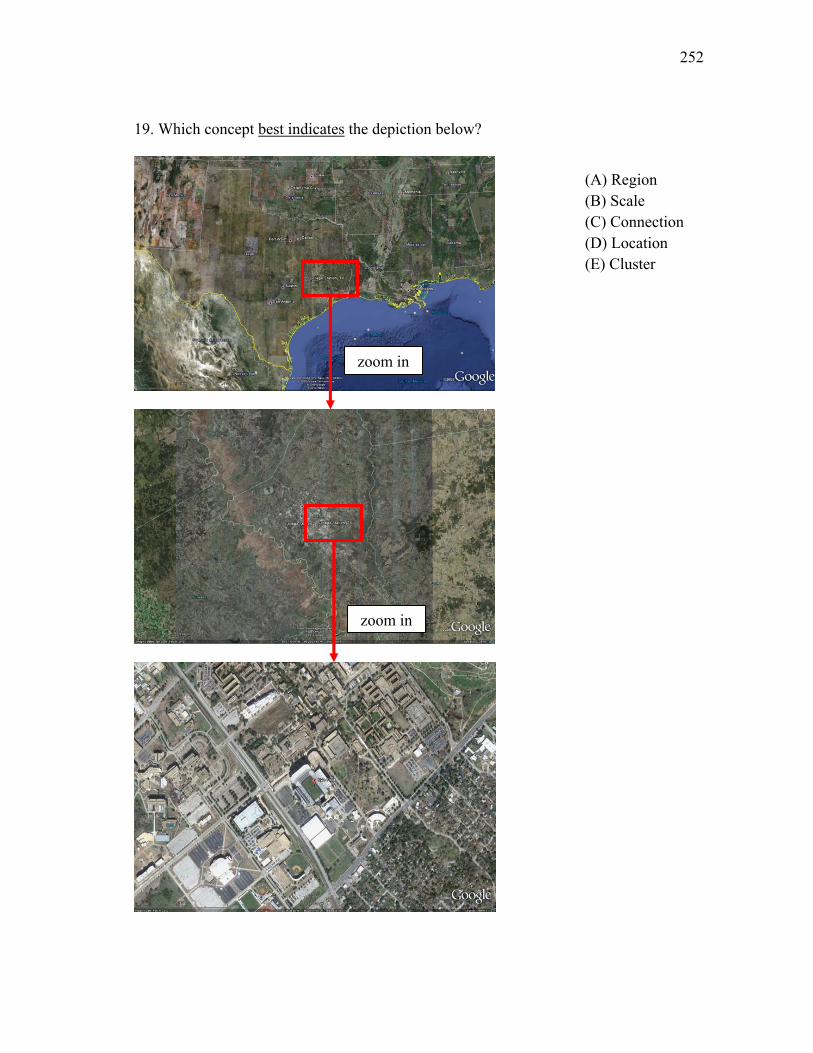
252
19. Which concept best indicates the depiction below?
(A) Region (B) Scale (C) Connection (D) Location (E) Cluster
zoom in
zoom in
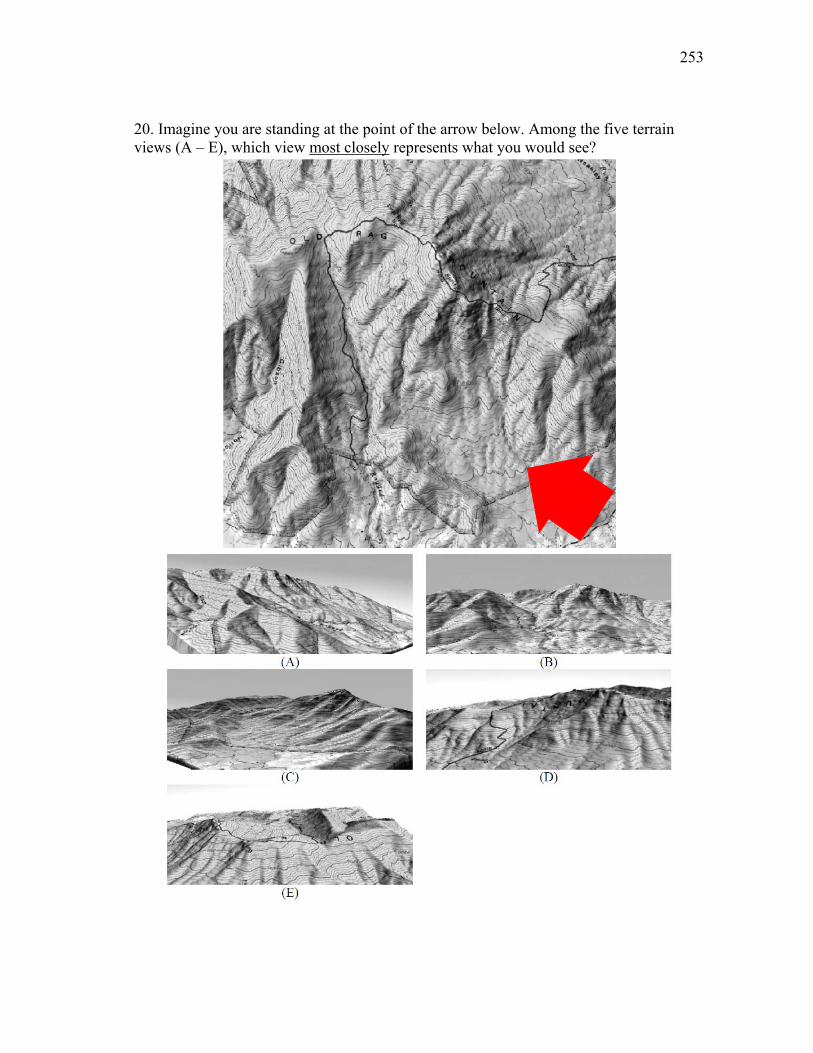
253
20. Imagine you are standing at the point of the arrow below. Among the five terrain views (A – E), which view most closely represents what you would see?

254
21. Choose the graph that most accurately represents the relationships between the two variables displayed on maps I and II.
(I) Percentage of persons 25 years and over with less than a 9th grade education
(II) Percentage of households with income of $100,000 or more
____________ The maps in this problem were produced using the information and tools in the US Census Bureau (http://factfinder.census.gov).

255
Post-Test
Personal Information
1. Name: 2. Major: 3. Freshman / Sophomore / Junior / Senior / Graduate 4. Gender: Male / Female
Spatial Concepts and Skills Test

256
1. Which figure is the least likely to describe “diffusion”?
(A) Fungus infection time steps (B) AIDS infection paths
(C) Trail in a national park (D) Evaporating molecules

257
2. Imagine you are standing at location X and looking in the direction of A and B. Among the 5 slope profiles (A – E), which profile most closely represents what you would see?

258
3. You are planning to find a place to open a new ice cream store. The map below shows the location of existing stores and their market areas. What concept best describes the techniques needed to illustrate the situation?
(A) Isolation (B) Buffer (C) Gradient (D) Corridor (E) Surface

259
4. You are given the task to construct a contour map using the following elevation data. You have to complete the map on the right following the same contour intervals as the map on the left.
5. What is the spatial concept used when you completed the above right map?
(A) Distribution (B) Distance (C) Spatial buffer (D) Spatial interpolation (E) Central Place

260
Direction: Answer question on the basis of the street map below.
6. If you are located at point 1 and travel south two blocks, then turn west and travel three blocks, and then turn north and travel one block, what point will you be closest (nearest) to? (A) 2 (B) 3 (C) 4 (D) 5 (E) 6 7. If you are located at point 1 and travel west one block, then turn left and travel three, then turn west and travel two blocks, and then turn right and travel two blocks, what point will you be closest (nearest) to? (A) 2 (B) 3 (C) 4 (D) 5 (E) 6
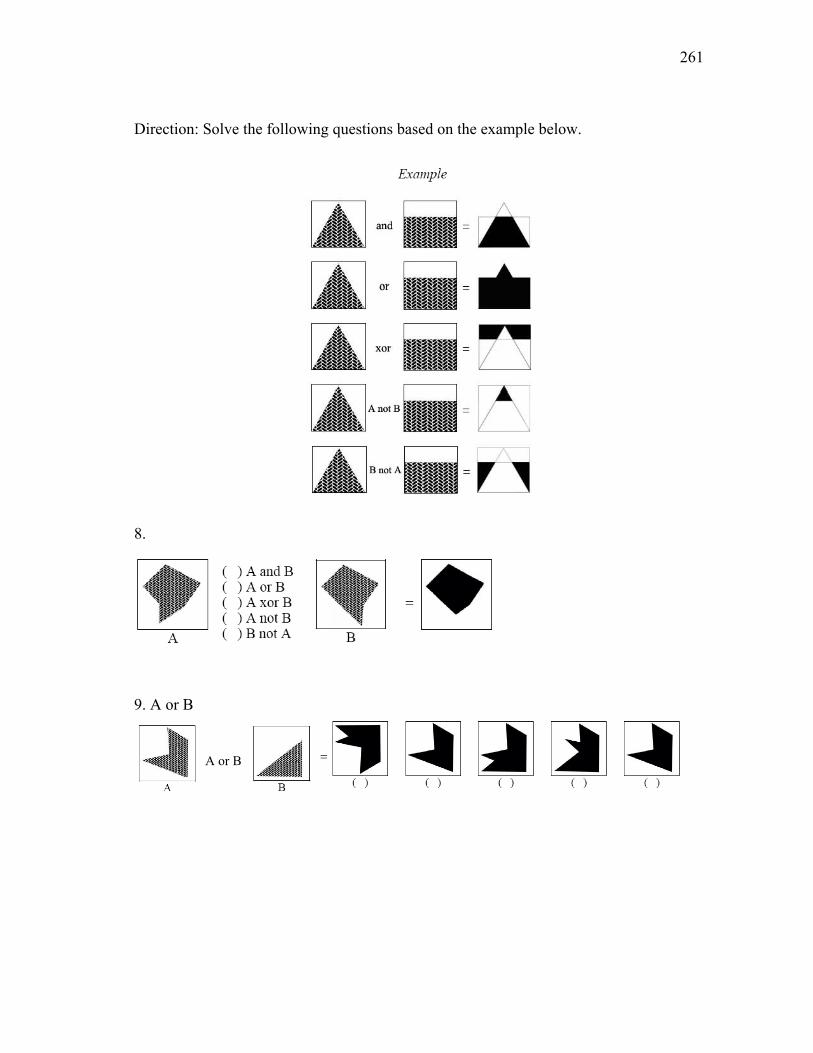
261
Direction: Solve the following questions based on the example below.
8.
9. A or B
A or B

262
Solve questions 10 and 11 based on the following diagram.
10. D not B =
11. A and B and C =

263
Direction: Real world objects can be represented explicitly by different spatial elements: a point, a line (arc), and/or an area (polygon). For each example below, identify which spatial element would best represent it.
Example
Point Line Area
·
Ex. trees, road interactions, poles in distribution networks
Ex. roads, rivers Ex. the areal extent of a city, an area of a continent
12. Locations of weather stations and the Brazos County (A) Lines (B) Area (C) Points and Lines (D) Points and Area 13. Mississippi River channels and their basins (A) Lines (B) Area (C) Points and Lines (D) Lines and Area 14. Shuttle bus stops and route of the Patterson Middle School (A) Points (B) Area (C) Points and Lines (D) Points and Area 15. Places that can be reached by Franklin County fire engines in 5 minutes or less (A) Points (B) Lines (C) Points and Area (D) Points and Lines

264
Direction: Your job is to find maps that have spatial correlations. For example, map (B) and map (D) have positive correlations (similar patterns).
16. Find a map (A – F) having a strong positive correlation with the map on the left. (Choose the closest one)

265
Direction: The map below shows annual precipitation of Texas.
17. If you draw a graph of Texas annual precipitation along a line between A and B, which graph illustrates the most appropriate trend in annual precipitation?

266
Direction: Find the best location for a flood management facility based on the following conditions. First, a possible site for a flood management facility should be within 60 feet of an existing electric line. Second, a possible site for a flood management facility should be in a location that has an elevation of less than 220 feet. Last, a possible site for a flood management facility should be located in a State Park or Public Land.
18. Find the best site (A – E) for the flood management facility on the last map.

267
19. Which concept best indicates the depiction below?
(A) Region (B) Scale (C) Connection (D) Location (E) Cluster
zoom in
zoom in

268
20. Imagine you are standing at the point of the arrow below. Among the five terrain views (A – E), which view most closely represents what you would see?
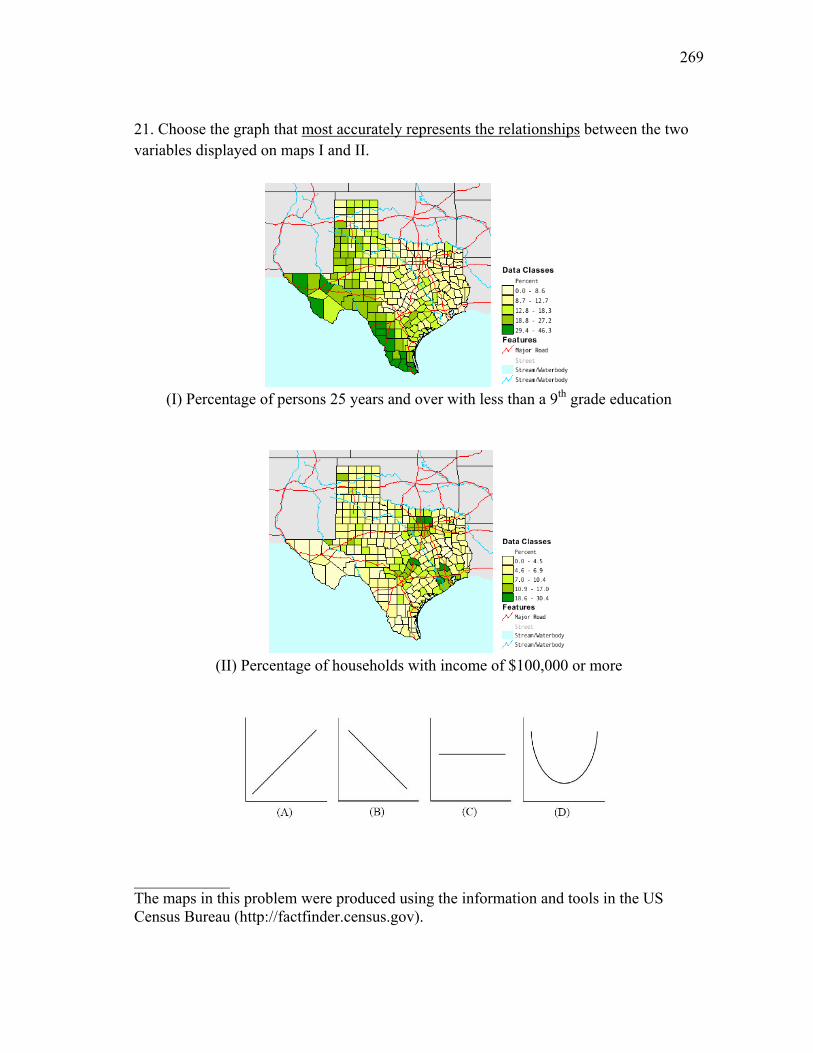
269
21. Choose the graph that most accurately represents the relationships between the two variables displayed on maps I and II.
(I) Percentage of persons 25 years and over with less than a 9th grade education
(II) Percentage of households with income of $100,000 or more
____________ The maps in this problem were produced using the information and tools in the US Census Bureau (http://factfinder.census.gov).

270
APPENDIX C

271
Critical Question 1 You are given the task to construct a contour map using the following elevation data. You have to complete the map on the right following the same contour intervals as the map on the left.

272
Critical Question 2 Direction: Find the best location for a flood management facility based on the following conditions. First, a possible site for a flood management facility should be within 60 feet of an existing electric line. Second, a possible site for a flood management facility should be in a location that has an elevation of less than 220 feet. Last, a possible site for a flood management facility should be located in a State Park or Public Land.
Find the best site (A – E) for the flood management facility on the last map.

273
Critical Question 3 Choose the graph that most accurately represents the relationships between the two variables displayed on maps I and II.
(I) Percentage of persons 25 years and over with less than a 9th grade education
(II) Percentage of households with income of $100,000 or more

274
APPENDIX D

275
Rubric for Critical Spatial Thinking
1. Excellent: Student answers interview questions almost perfectly. Student provides critical and/or creative critiques on the data and/or problem. Student incorporates relevant spatial concepts and/or vocabulary in an informed manner. 2. Good: Student answers interview questions reasonably well, with only some parts missing. Student sometimes provides critical and/or creative critiques on the data and problem. 3. Acceptable: Student answers interview questions acceptably, but more parts than in the category of “good” are not answered. 4. Insufficient: Student does not understand the given problem or interview questions sufficiently.
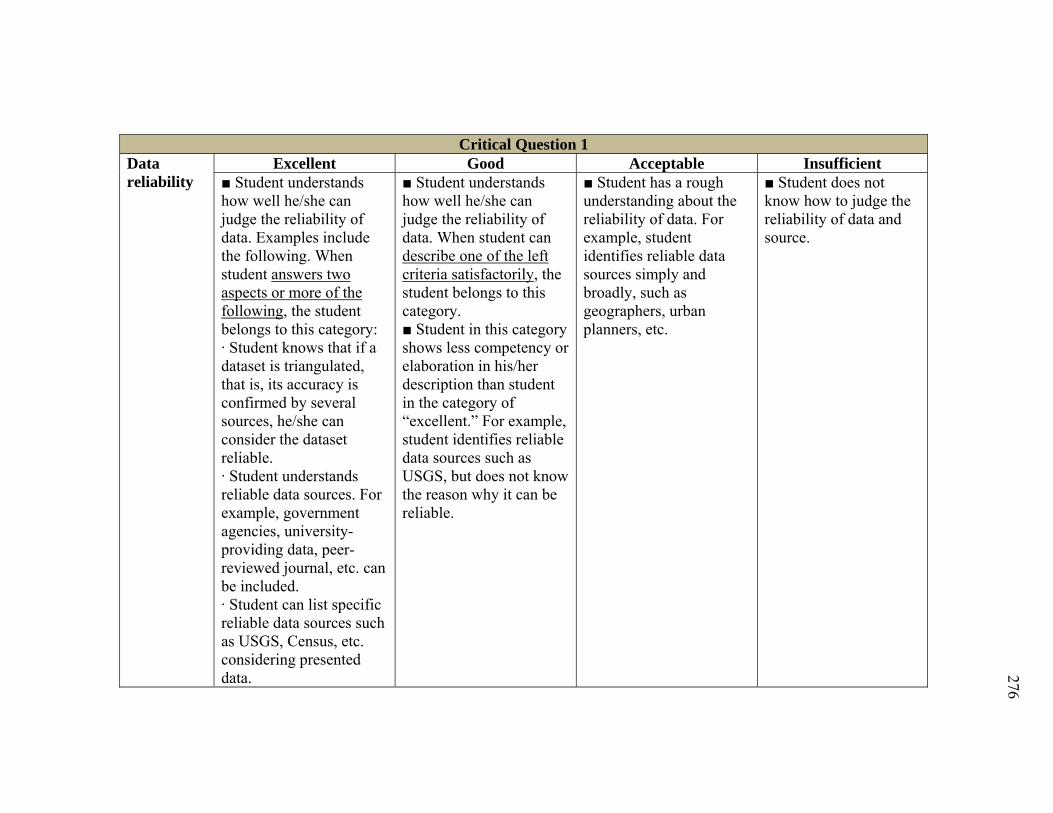
276
Critical Question 1 Data reliability
Excellent Good Acceptable Insufficient ■ Student understands how well he/she can judge the reliability of data. Examples include the following. When student answers two aspects or more of the following, the student belongs to this category: · Student knows that if a dataset is triangulated, that is, its accuracy is confirmed by several sources, he/she can consider the dataset reliable. · Student understands reliable data sources. For example, government agencies, university-providing data, peer-reviewed journal, etc. can be included. · Student can list specific reliable data sources such as USGS, Census, etc. considering presented data.
■ Student understands how well he/she can judge the reliability of data. When student can describe one of the left criteria satisfactorily, the student belongs to this category. ■ Student in this category shows less competency or elaboration in his/her description than student in the category of “excellent.” For example, student identifies reliable data sources such as USGS, but does not know the reason why it can be reliable.
■ Student has a rough understanding about the reliability of data. For example, student identifies reliable data sources simply and broadly, such as geographers, urban planners, etc.
■ Student does not know how to judge the reliability of data and source.
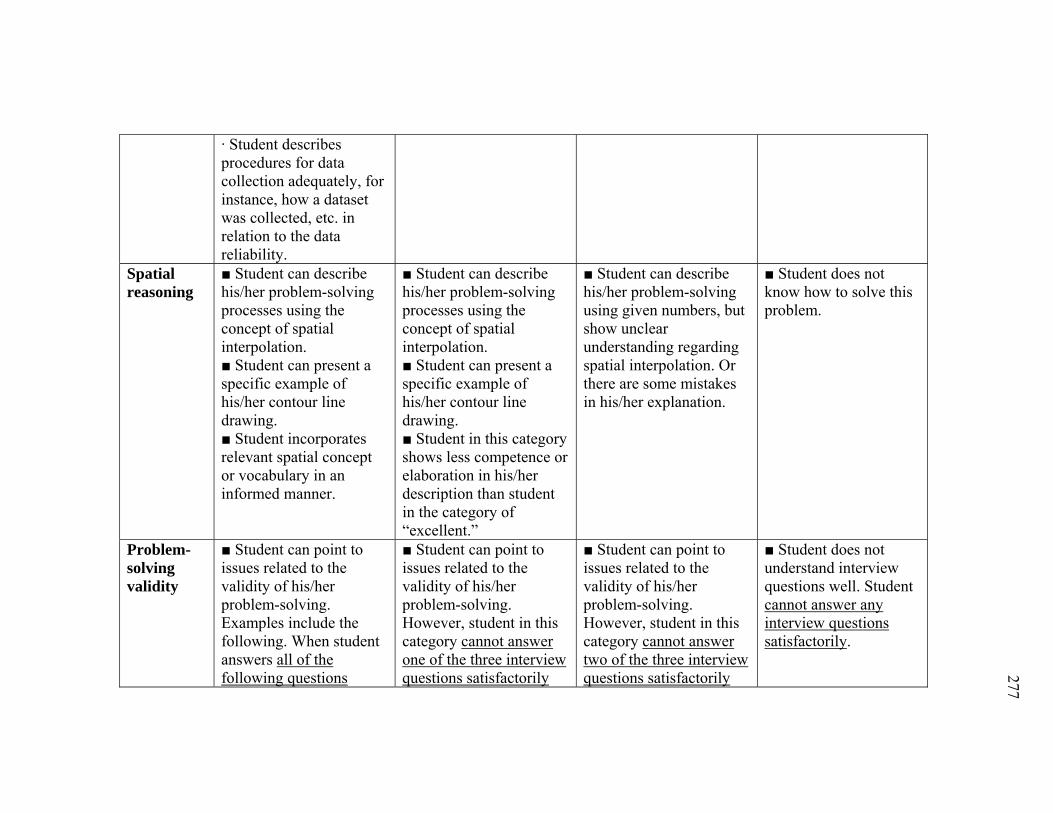
277
· Student describes procedures for data collection adequately, for instance, how a dataset was collected, etc. in relation to the data reliability.
Spatial reasoning
■ Student can describe his/her problem-solving processes using the concept of spatial interpolation. ■ Student can present a specific example of his/her contour line drawing. ■ Student incorporates relevant spatial concept or vocabulary in an informed manner.
■ Student can describe his/her problem-solving processes using the concept of spatial interpolation. ■ Student can present a specific example of his/her contour line drawing. ■ Student in this category shows less competence or elaboration in his/her description than student in the category of “excellent.”
■ Student can describe his/her problem-solving using given numbers, but show unclear understanding regarding spatial interpolation. Or there are some mistakes in his/her explanation.
■ Student does not know how to solve this problem.
Problem-solving validity
■ Student can point to issues related to the validity of his/her problem-solving. Examples include the following. When student answers all of the following questions
■ Student can point to issues related to the validity of his/her problem-solving. However, student in this category cannot answer one of the three interview questions satisfactorily
■ Student can point to issues related to the validity of his/her problem-solving. However, student in this category cannot answer two of the three interview questions satisfactorily
■ Student does not understand interview questions well. Student cannot answer any interview questions satisfactorily.

278
satisfactorily, the student belongs to this category: · Improvement of problem-solving - Student can suggest a method to make his/her problem-solving more accurate. For example, more data points would make the map more accurate. When using a ruler, it should be used to make an educated guess (e.g., To draw a 20 line, one can divide the interval between 17 and 22 as five units using a ruler). However, using a ruler simply to draw a neat line is not considered as a good answer. · Situations of distortion - Student can imagine a situation in which the constructed map would not accurately show the real topography. For example, even though spatial interpolation is a reasonable technique to
that include improvement of problem-solving, situations of distortion, and relationship between contour interval and map accuracy.
that include improvement of problem-solving, situations of distortion, and relationship between contour interval and map accuracy.
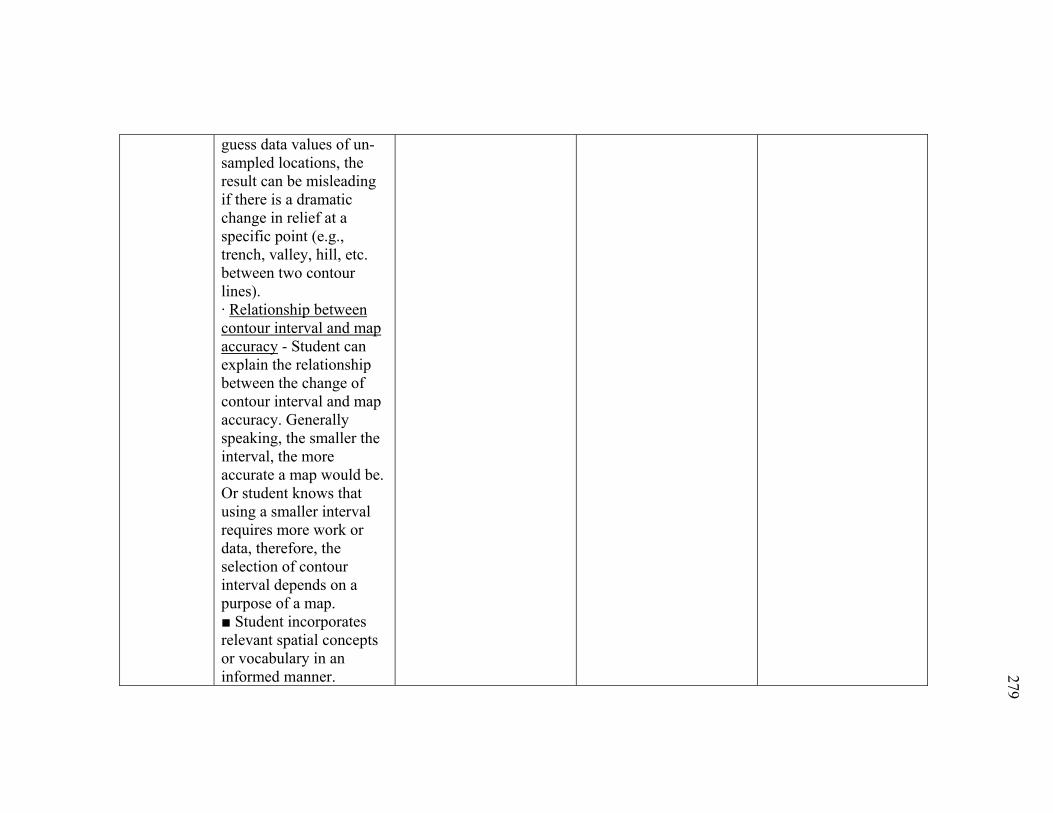
279
guess data values of un-sampled locations, the result can be misleading if there is a dramatic change in relief at a specific point (e.g., trench, valley, hill, etc. between two contour lines). · Relationship between contour interval and map accuracy - Student can explain the relationship between the change of contour interval and map accuracy. Generally speaking, the smaller the interval, the more accurate a map would be. Or student knows that using a smaller interval requires more work or data, therefore, the selection of contour interval depends on a purpose of a map. ■ Student incorporates relevant spatial concepts or vocabulary in an informed manner.

280
Critical Question 2 Data reliability
Excellent Good Acceptable Insufficient ■ Same as in Question 1, but student should describe different data sources and/or data collection procedures in relation to the data presented in Critical Question 2.
Spatial reasoning
■ Student can describe his/her problem-solving processes using the method of spatial map overlay or process of elimination (eliminating inappropriate sites sequentially). ■ Student can suggest more effective methods of data presentation or problem-solving (e.g., superimposing three maps together, using geospatial technologies such as GIS). ■ Student incorporates relevant spatial concepts or vocabulary in an informed manner.
■ Student can describe his/her problem-solving processes using the method of spatial map overlay or process of elimination (eliminating inappropriate sites sequentially). ■ Student in this category shows less competence or elaboration in his/her statements than student in the category of “excellent.”
■ Student can describe his/her problem-solving processes using the method of spatial map overlay or process of elimination (eliminating inappropriate sites sequentially). However, student’s thinking is confined to simply solving the problem and he/she does not reasonably cope with other interview questions regarding suggestions for effective methods of data presentation or problem-solving. Or student understands the problem, but selects an incorrect answer.
■ Student does not know how to solve this problem.
Problem-solving validity
■ Student can point to issues related to the validity of his/her problem-solving. Examples include the
■ Student can point to issues related to the validity of his/her problem-solving. However, student in this
■ Student can point to issues related to the validity of his/her problem-solving. However, student in this
■ Student does not understand interview questions well. Student cannot answer any interview questions
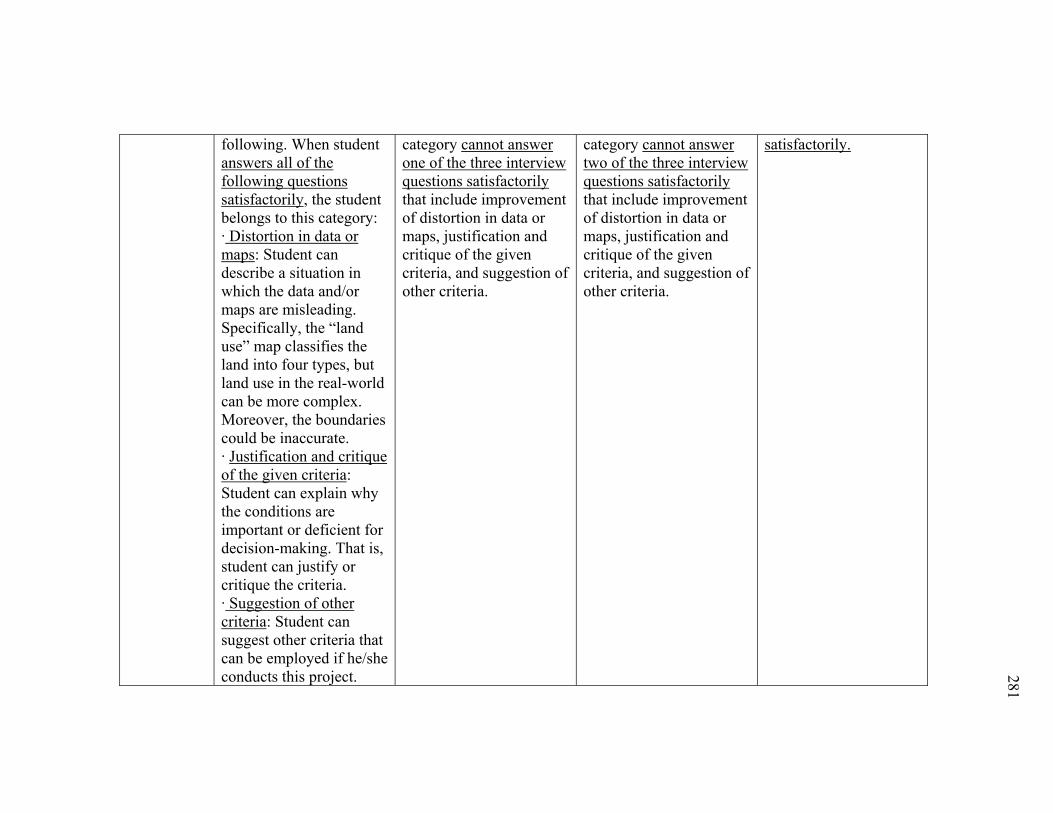
281
following. When student answers all of the following questions satisfactorily, the student belongs to this category: · Distortion in data or maps: Student can describe a situation in which the data and/or maps are misleading. Specifically, the “land use” map classifies the land into four types, but land use in the real-world can be more complex. Moreover, the boundaries could be inaccurate. · Justification and critique of the given criteria: Student can explain why the conditions are important or deficient for decision-making. That is, student can justify or critique the criteria. · Suggestion of other criteria: Student can suggest other criteria that can be employed if he/she conducts this project.
category cannot answer one of the three interview questions satisfactorily that include improvement of distortion in data or maps, justification and critique of the given criteria, and suggestion of other criteria.
category cannot answer two of the three interview questions satisfactorily that include improvement of distortion in data or maps, justification and critique of the given criteria, and suggestion of other criteria.
satisfactorily.

282
■ Student incorporates relevant spatial concepts or vocabulary in an informed manner.
Critical Question 3 Data reliability
Excellent Good Acceptable Insufficient ■ Same as in Question 1, but student should describe different data sources and/or data collection procedures in relation to the data presented in Critical Question 3.
Spatial reasoning
■ Student can describe map patterns of the two maps. ■ Student can describe how to create a graph from the mapped data perfectly. ■ Students can support their problem-solving using the titles of the two provided maps (e.g., the more the less educated people reside in a county, the less the income level would be; thus, the two phenomena are negatively correlated). ■ Student incorporates relevant spatial concepts or vocabulary in an informed manner.
■ Student can describe map patterns of the two maps. ■ Student can describe how to create a graph from the mapped data acceptably. ■ Student in this category shows less competence or elaboration in his/her description than student in the category of “excellent.”
■ Student can describe map patterns of the given two maps. ■ Student is confused how to transform the relationship between the two maps into a graphical representation from a geographical representation. Or student understands the problem and data, but chooses an incorrect answer.
■ Student does not understand the given problem.

283
Problem-solving validity
■ Student can point to issues related to the validity of his/her problem-solving. Examples include the following. When student answers all of the following questions satisfactorily, the student belongs to this category: · Generalization: Student can point to a problem when he/she generalizes the relationship between the two phenomena displayed on the maps into one graph. That is, some deviant patterns are generalized into one relationship, even though for some the real pattern is opposite. · Distortion in data or maps: Student can imagine a situation in which the data and/or maps are misleading. Specifically, 1) Different data classes adopted in the map can represent the
■ Student can point to issues related to the validity of his/her problem-solving. However, student in this category cannot answer one of the four interview questions satisfactorily that include generalization and distortion in data or maps (data classes, data aggregation, and area of basic units).
■ Student can point to issues related to the validity of his/her problem-solving. However, student in this category cannot answer two of the four interview questions satisfactorily that include generalization and distortion in data or maps (data classes, data aggregation, and area of basic units).
■ Student does not understand interview questions well. Student cannot answer more than two of the four interview questions satisfactorily.

284
same data differently; 2) In aggregating data, some patterns can disappear. One unit is averaged, so variation within groups is lost; 3) Changing the area of basic units can change the pattern. Student can expect the result when the area of basic units becomes smaller or bigger. Student knows advantages and disadvantages of a selected area unit. ■ Student incorporates relevant spatial concepts or vocabulary in an informed manner.

285
VITA Name: Minsung Kim
Address: Department of Geography, Texas A&M University College Station, TX 77840 [email protected] Education: Ph.D. Geography Texas A&M University, College Station, Texas, December 2011 M.A. Geography Education Seoul National University, Seoul, February 2006 B.A. Geography Education Seoul National University, Seoul, February 2004