effectiveness of zone therapy on quality of life …
TRANSCRIPT

EFFECTIVENESS OF ZONE THERAPY ON
QUALITY OF LIFE AMONG PATIENTS WITH
HYPERTENSION IN SELECTED VILLAGES
AT TIRUNELVELI DISTRICT
DISSERTATION SUBMITTED TO
THE TAMILNADU DR.M.G.R.MEDICAL UNIVERSITY
CHENNAI
IN PARTIAL FULFILLMENT OF REQUIREMENT FOR THE DEGREE OF
MASTER OF SCIENCE IN NURSING
SEPTEMBER 2015

EFFECTIVENESS OF ZONE THERAPY ON
QUALITY OF LIFE AMONG PATIENTS WITH
HYPERTENSION IN SELECTED VILLAGES
AT TIRUNELVELI DISTRICT
BY
Mrs.G.JEBAKANI PRINCES
DISSERTATION SUBMITTED TO
THE TAMILNADU DR.M.G.R.MEDICAL UNIVERSITY
CHENNAI
IN PARTIAL FULFILLMENT OF REQUIREMENT FOR THE DEGREE OF
MASTER OF SCIENCE IN NURSING
SEPTEMBER 2015

SRI.K.RAMACHANDRAN NAIDU COLLEGE OF NURSING
Affiliated to The Tamilnadu Dr.M.G.R. Medical University,K. R. Naidu Nagar, Sankarankovil, Tirunelveli District-627 753
Tamilnadu.
CERTIFICATE
This is a bonafide work of Mrs. G.JEBAKANI PRINCES M.Sc NURSING
II year (2013-2015 Batch) student of Sri. K.RamachandranNaiduCollege of Nursing,
Sankarankovil-627 753. Submitted in partial fulfillment for the Degree of Master of
Science in Nursing,under the TamilnaduDr.M.G.R.Medical University, Chennai.
SIGNATURE: ________________
Prof. (Mrs).N.Saraswathi, M.Sc. (N).,Ph.D (N).,
Principal, Head of the Department of Paediatric Nursing
Sri K. Ramachandran Naidu College of Nursing
Sankarankovil (Tk), Tirunelveli (Dist).
COLLEGE SEAL

EFFECTIVENESS OF ZONE THERAPY ON QUALITY OF LIFE
AMONG PATIENTS WITH HYPERTENSION IN SELECTED
VILLAGES AT TIRUNELVELI DISTRICT
APPROVED BY THE DISSERTATION COMMITTEE ON
PROFESSOR IN NURSING RESEARCH
Prof. (Mrs).N.SARASWATHI, M. Sc. (N)., Ph. D (N).,
Principal, Head of the Department of Pediatric Nursing,
Sri. K. Ramachandran Naidu College of Nursing,
Sankarankovil, Tirunelveli-627 753,
Tamilnadu.
CLINICAL SPECIALITY GUIDE
Mrs.V.JAYA, M. Sc (N).,
Reader, Medical Surgical Nursing Department,
Sri. K. Ramachandran Naidu College of Nursing,
Sankarankovil, Tirunelveli-627 753,
Tamilnadu.
MEDICAL GUIDE
Dr. T. K. SENTHIL KUMAR, M.B.B.S., M.D.,
Consultant Physician,
Annamalai Hospital,
Railway feeder Road, sankarankovil-627 756,
Tirunelveli District, Tamilnadu.
DISSERTATION SUBMITTED TO
THE TAMILNADU DR.M.G.R.MEDICAL UNIVERSITY
CHENNAI
IN PARTIAL FULFILLMENT FOR THE DEGREE OF
MASTER OF SCIENCE IN NURSING
SEPTEMBER 2015

ACKNOWLEDGEMENT
I, the researcher of this study wish to express deep sense of gratitude to all
those who have contributed in the successful completion of this study. I wish to
acknowledge each one of them.
First of all I thank “THE LORD ALMIGHTY” constantly providing
abundance of grace and shower his unfavorable blessings on me to complete this
study in an excellent manner.
I express my sincere thanks to our respected and honorable chairman
Mr.R.Vivekanandan M.A., and our trustee Mrs.G.Prem Shantha for giving me this
opportunity to study in their esteemed institution and to conduct this study.
I express my humble gratitude and heartiest thanks to our respected principal
Prof.(Mrs).N.Saraswathi M.sc(N).,Ph.D., for the constant inspiration and
encouragement. There is no word to thank her for her excellent guidance and
encouragement offered in the presentation of this study.
I express my thanks to Mrs.P.Subbalakshmi M.Sc (N)., Associate professor,
class coordinator M.sc (N) second year for her valuable guidance and constant
support to make this study better.
I express my thanks to Mrs.V.Jaya M.Sc (N)., Reader, Medical Surgical
Nursing department for giving continuous support throughout this study.
I express my thanks to Mrs.J.Sathya M.Sc (N)., Lecturer, Medical Surgical
Nursing department for her valuable guidance and constant support to make this study
better.
I extend my sincere thanks to Dr.T.K.Senthil Kumar, M.B.B.S, M.D
Consultant Physician, Annamalai hospital for his encouragement, valuable
suggestions and technical guidance throughout the study.

I extend my sincere thanks to all the Medical and Nursing Experts for giving
their valuable guidance and suggestions towards modification of the tool for data
collection.
With deep sense of gratitude I thank the Medical officer of Primary Health
center, Karivalam for giving me permission to conduct the study.
I am very much thankful to the hypertensive patients who participated in this
study.
I am grateful to thank the librarians of Sri.K.Ramachandran Naidu college of
Nursing for their help and cooperation.
I also extend my sincere gratitude to all my friends for their timely help to
complete this study.
Above all I express my sincere thanks to my beloved father (Late)
Mr.G.Gunaseelan B.Sc (Agri)., and my mother Mrs.G.Rajammal, Retired Road
Inspector Highways department for their continuous efforts and unfavorable
support and prayers to make this study as best as possible. And I extend my loving
thanks to my sweet son Master.S.Geoprin and my lovable daughter
Baby.S.Gibishaprin for their kind cooperation.
Once again I thank “THE LORD ALMIGHTY” for guiding me and
protecting me up to this time and making this study better.

TABLE OF CONTENTS
CHAPTE
R No.CONTENTS
PAGE
No.
I INTRODUCTION 1
Background of the study 1
Need for the study 6
Statement of the problem 10
Objectives of the study 10
Hypotheses 11
Operational definitions 11
Assumption 12
Delimitations 12
Projected outcome 13
Conceptual framework 14
II REVIEW OF LITERATURE 18 – 32
Review of related literature 18
III RESEARCH METHODOLOGY 33 – 45
Research approach 33
Research design 33
Variables 34
Setting of the study 34
Population 34
Sample 34
Sample size 34
Sampling technique 35
Criteria for selection of sample 36
Development and description of the tool 37
Score interpretation 37
Content Validity 38
Reliability 38
Intervention 38
Pilot Study 41
Data collection procedure 42

Plan for data analysis 43
Protection of human rights 44
IV DATA ANALYSIS AND INTERPRETATION 46 – 76
Organization of data 46
Presentation of data 48
V DISCUSSION 77 – 84
VI SUMMARY, CONCLUSION, LIMITATIONS,
NURSING IMPLICATIONS, AND
RECOMMENDATIONS
85 – 93
BIBLIOGRAPHY
APPENDICES
LIST OF TABLES
TABLENo TITLE
PAGENo
1. Frequency and percentage distribution of demographic variables
of hypertensive patients with respect to age, sex, religion,
education, occupation, monthly income, marital status, type of
family, number of children, dietary habits, duration of illness,
following DASH, and mode of treatment in experimental group
and control group.
48
2. Frequency and percentage distribution of the pre test and post test
level of quality of life among hypertensive patients in
experimental group.
61
3. Frequency and percentage distribution of the pre test and post test
level of quality of life among hypertensive patients in and control
63

group.4. Mean and standard deviation of the pre test level of quality of life
among hypertensive patients in experimental group and control
group.
65
5. Mean and standard deviation of the post test level of quality of life
among hypertensive patients in experimental group and control
group.
67
6. Mean and standard deviation of pre test and post test level of
quality of life among hypertensive patients in experimental group
and control group.
69
7. Association between the post test level of quality of life among
hypertensive patients with their selected demographic variables
like age, sex, religion, education, occupation, monthly income,
marital status, type of family, number of children, dietary habits,
duration of illness, following DASH, and mode of treatment in
experimental group.
71
8. Association between the post test level of quality of life among
hypertensive patients with their selected demographic variables
like age, sex, religion, education, occupation, monthly income,
marital status, type of family, number of children, dietary habits,
duration of illness, following DASH, and mode of treatment in
control group.
74

LIST OF FIGURES
FIGURE No. TITLE PAGE
No.1. Conceptual framework Based on modified theory 17
2. Schematic representation of Research design. 33
3. Schematic representation of Research methodology. 45
4.Percentage distribution of demographic variables of age in
experimental and control group.54
5. Percentage distribution of demographic variables of sex in
experimental and control group.54
6. Percentage distribution of demographic variables of religion in
experimental and control group.55
7. Percentage distribution of demographic variables of education in
experimental and control group.55
8. Percentage distribution of demographic variables of occupation in
experimental and control group.56
9. Percentage distribution of demographic variables of monthly
income in experimental and control group.56

10. Percentage distribution of demographic variables of marital status
in experimental and control group.57
11. Percentage distribution of demographic variables of type of
family in experimental and control group.57
12. Percentage distribution of number of demographic variables of
children in experimental and control group.58
13. Percentage distribution of demographic variables of dietary habits
in experimental and control group.58
14. Percentage distribution of demographic variables of duration of
illness in experimental and control group. 59
15. Percentage distribution of demographic variables of following
DASH in experimental and control group.59
16. Percentage distribution of demographic variables of mode of
treatment in experimental and control group.60
17. Percentage distribution of the pre test and post test level of
quality of life among hypertensive patients in experimental
group.
62
18. Percentage distribution of the pre test and post test level of
quality of life among hypertensive patients in control group.64
19. Mean and standard deviation of the pre test level of quality of life
among hypertensive patients in experimental group and control
group.
66
20. Mean and standard deviation of the post test level of quality of
life among hypertensive patients in experimental group and
control group.
68
21. Mean and standard deviation of pre test and post test level of
quality of life among hypertensive patients in experimental group
and control group.
70

LIST OF APPENDICES
APPENDIX TITLE
A. Letter seeking and granting permission for conducting the study
B. Letter seeking expert’s opinion for content validity
C. Content validity certificate
D. List of experts for content validity
E. Certificate of foot zone therapy training
F. Certificate of English editing
G. Certificate of Informed Consent
H. Copy of the tool for data collection-English
I. Steps of intervention

ABSTRACT
The Research Project, “A study to assess the effectiveness of zone therapy
on quality of life among patients with hypertension in selected villages at
Tirunelveli district’. It was conducted in partial fulfillment of the requirement for the
Degree of Master of science in nursing at Sri K. Ramachandran Naidu College of
Nursing which was affiliated to the Tamil Nadu Dr. M.G.R Medical University,
Chennai during the year 2013 - 2015.
The Objectives of the study were:
To assess the pre test and post test level of quality of life among
patients with hypertension in experimental group and control group.
To find out the effectiveness of zone therapy on quality of life among
patients with hypertension in experimental group
To compare the pre test and post test level of quality of life among
patients with hypertension in experimental group.
To associate the post test level of quality of life among patients with
hypertension in experimental group and control group with their
selected demographic variables like age, sex, religion, education,
occupation, monthly income, marital status, type of family, number of
children, dietary habits, duration of illness, following DASH, and mode
of treatment.
All Hypotheses were tested at 0.05 level of significance
H1: The mean post test level of quality of life in experimental group will be
significantly higher than the mean post test level of quality of life in control group.
H2: The mean post test level of quality of life in experimental group will be
significantly higher than their mean pre test level of quality of life.
H3: There will be a significant association between the post test level of quality
of life among patients with hypertension in experimental and control group with their
selected demographic variables. (age, sex, religion, education, occupation, monthly
income, marital status, type of family, number of children, dietary habits, duration of
illness, following DASH, and mode of treatment .)
The framework of the study was based on the Modified Wiedenbach’s Helping
Art of Clinical Nursing Theory
Totally sixty patients were selected from the two villages. Thirty patients were
selected to experimental group, thirty patients were selected to control group. The
samples were selected based on the criteria for sample selection. According to
purposive sampling technique the patients were selected to the experimental group
and control group. The experimental group received zone therapy for about 15
minutes a day on alternative days for 3 weeks. Posttest was carried out for the
experimental group and control group on fourth week.
The Research design was Quasi experimental – Pretest and Posttest control
group design. The setting of the study was perumpattur and puliampatti villages at
Tirunelveli district. It was situated about 15 kms and 18 kms from
Sri.K.Ramachandran Naidu College of Nursing at Tirunelveli district.
The descriptive and inferential statistics were used to analyze the data.

The significant Findings of the study were
On analysis of frequency and percentage distribution of demographic variables
in age in experimental group out of 30 samples, majority 15 (50%) of them were in
the age group of 56 – 65 years and in the control group out of 30 samples, majority
13 (43.33%) of them were in the age group of 56 – 65 years.
With respect to the variable sex in experimental group, out of 30 samples,
majority 18 (60%) of them were males and in the control group out of 30 samples,
majority 19 (63.33%) of them were males.
With regard to the variable religion in experimental group, out of 30 samples,
majority 28 (93.33%) of them were Hindus and in the control group out of 30
samples, majority 29 (96.67%) of them were Hindus.
Concerning to the variable education in experimental group, out of 30
samples, majority 16 (53.34%) of them were illiterates and in the control group out of
30 samples, majority 18 (60%) of them were illiterates.
Pertaining to the variable occupation in experimental group, out of 30
samples, majority 14 (46.67%) of them were self employed and in the control group
out of 30 samples, majority 13 (43.33%) of them were coolie workers.
With respect to the variable monthly income in experimental group, out of 30
samples majority 22 (73.33%) of them were having the income of Rs.3001 – Rs.6000

and in the control group out of 30 samples majority 18 (60%) of them were having the
income of Rs.3001 – Rs.6000.
With regard to the variable marital status in experimental group, out of 30
samples majority 28 (93.33%) of them were married and in the control group out of
30 samples, all 30 (100%) of them were married.
Concerning the variable type of family in experimental group, out of 30
samples majority 19 (63.33%) of them were from nuclear family and in the control
group out of 30 samples, majority 17 (56.67%) of them were from joint family.
Regarding the variable number of children in experimental group, out of 30
samples majority 17 (56.67%) of them were having more than 2 children and in the
control group out of 30 samples majority 18 (60%) of them were having more than 2
children.
With respect to the variable dietary habits in experimental group, out of 30
samples majority 26 (86.67%) of them were non- vegetarian and in the control group
out of 30 samples majority 27 (90%) of them were non- vegetarian.
With regard to the variable duration of illness in experimental group, out of 30
samples majority 16 (53.33%) of them were suffering for 3 years and in the control
group out of 30 samples majority 14 (46.66%) of them were suffering for 3 years.
With respect to the variable following DASH in experimental group, out of 30
samples majority 26 (86.67%) of them were not following DASH and in the control
group out of 30 samples majority 26 (86.67%) of them were not following DASH.

Pertaining to the variable mode of treatment in experimental group, out of 30
samples majority 26 (86.67%) of them were taking medication and in the control
group out of 30 samples majority 28 (93.33%) of them were taking medication.
On analysis of the mean and standard deviation in post test experimental group
showed a mean value of 87 with the standard deviation of 4.42 and the control group
showed a mean value of 42.76 with the standard deviation of 3.99. The calculated ‘t”
value was 40.66 at P< 0.05 level. This shows improvement in quality of life.
There was a significant association between the post test level of quality of life
among hypertensive patients in experimental group with their selected demographic
variables age, education, monthly income, dietary habits, following DASH, and mode
of treatment and there was no significant association between the post test level of
quality of life among hypertensive patients with their selected demographic variables
sex, religion, occupation, marital status, type of family, number of children, and
duration of illness.
There was a no significant association between the post test level of quality of
life among hypertensive patients in control group with their selected demographic
variables age, sex, religion, education, occupation, monthly income, marital status,
type of family, number of children, dietary habits, duration of illness, following
DASH, and mode of treatment.
Based on the findings of the study, it is recommended that,
Based on the findings of the present study the following recommendations are
made
A similar study can be conducted with large samples for better generalisation.

A study can be conducted to assess the level of knowledge and practice of
nurses with regard to zone therapy in improving the quality of life of
hypertensive patients.
A comparative study can be conducted by using zone therapy and aroma
therapy on improvement of quality of life of hypertensive patients.
The same study can be repeated to assess the effectiveness of zone therapy to
improve the quality of life of secondary hypertensive patients admitted in
hospitals.
CONCLUSION
This study assessed the effectiveness of zone therapy on quality of life among
patients with hypertension. The study findings revealed that, there was a significant
improvement in the quality of life of hypertensive patients after application of zone
therapy in the experimental group. On the basis of the study, the researcher concluded
that application of zone therapy to the hypertensive patients to improve the quality of
life. Zone therapy is an effective; easy and potentially risk free intervention.

1
CHAPTER I
INTRODUCTION
“The quality of life is more important than life itself”
-- Alexis Carrel
BACKGROUND OF THE STUDY
In the modern world each and every individual’s life has become stressful. This
stressful life is directly affecting a common Person. A common man is suffering from
various psycho physiological disorders. In this busy life schedule man is not having the
time to relax. As the world is moving cardiovascular diseases have became one of the
leading cause of mortality and morbidity.
Hypertension is one of the major risk factor for stroke, myocardial infarction,
vascular disease and chronic kidney disease. (Framingham heart study, 2004)
High blood pressure termed “hypertension” is a condition that afflicts almost
1billion people worldwide and is a leading cause of morbidity and mortality. More than
20% of Americans are hypertensive, and one third of these Americans are not even aware
they are hypertensive. Therefore, this disease is sometimes called “silent killer”. The
disease is usually asymptomatic until the damaging effects of hypertension such as
stroke, myocardial infarction, renal dysfunction, visual problems etc are observed.
(Richard E.klabunde, 2007)
Hypertension is defined as a consistent elevation of systolic blood pressure > 120
mm of hg and consistent elevation of diastolic blood pressure >80 mm of hg.

2
Hypertension mainly two types primary (essential) and secondary hypertension. (Sharon
Lewis, 2007)
Hypertension means "High blood pressure; transitory or sustained elevation of
systemic arterial blood pressure to a level likely to induce cardiovascular damage or other
adverse consequences." (Medilexicon's medical dictionary, 2000)
The prevalence of chronic disease is showing an upward trend in most countries.
In particular of hypertension in India is 59.9 and 69.9/1000 in males and females
respectively. “As blood pressure goes up, life expectancy goes down”. (WHO, 2003)
International hypertension guidelines have created categories. Classification of
Blood Pressure for adults aged 18 years or older is as follows: Normal: Systolic lower
than 120 mm Hg, diastolic lower than 80 mm Hg, Pre hypertension: Systolic 120-139
mmHg, diastolic 80-89 mm Hg, Stage 1hypertension: Systolic 140-159 mmHg, diastolic
90-99 mmHg, Stage 2 hypertension: Systolic 160 mmHg or greater, diastolic 100 mmHg
or greater. (JNC, 2003)
Hypertension may be primary, which may develop as a result of environmental or
genetic causes, or secondary which has multiple etiologies including renal, vascular, and
endocrine causes. Primary or essential hypertension accounts for 90-95% of adult cases,
and secondary hypertension accounts for 2-10% of cases. (Vasan, 2006)
Ninety five hypertensive patients in community are essential, idiopathic etiology
and only small percentages have an identifiable cause. Epidemiological evidence shows
that there are several factors which play an important role in the development, evolution
and prognosis of hypertension. Some of them are non modifiable factors such as age, sex,
ethnicity and heredity and modifiable factors are body weight, salt intake, use of

3
hormonal contraceptive drugs, sedentary life, stress, cigarette smoking and alcoholism.
(Warrel, 2008)
Quality of life refers to the general wellbeing of individuals and societies. It is a
broad multidimensional concept that usually includes self-reported measures of physical
and mental health. The study of quality of life is an examination of influences upon the
goodness and meaning of life as well as individual’s happiness and wellbeing. (Pub
med.com)
In general, quality of life (QOL) is the perceived quality of an individual's daily
life, that is, an assessment of their well-being or lack thereof. This includes
all emotional, social, and physical aspects of the individual's life. In health care, health-
related quality of life (HRQOL) is an assessment of how the individual's well-being may
be affected over time by a disease, disability, or disorder. (wikipedia.com)
The term quality of life (QOL) refers to the general well-being of individuals and
societies. The term is used in a wide range of contexts, including the fields
of international development, healthcare, and politics. Quality of life should not be
confused with the concept of standard of living, which is based primarily on income.
Instead, standard indicators of the quality of life include not only wealth and employment
but also the built environment, physical and mental health, education, recreation and
leisure time, and social belonging. (Pubmed.com)
Also frequently related are concepts such as freedom, human rights,
and happiness. However, since happiness is subjective and difficult to measure, other
measures are generally given priority. It has also been shown that happiness, as much as
it can be measured, does not necessarily increase correspondingly with the comfort that

4
results from increasing income. As a result, standard of living should not be taken to be a
measure of happiness. Also sometimes considered related is the concept of human
security, though the latter may be considered at a more basic level and for all people.
(Robert Costanza, 2011)
Researchers at the University of Toronto's Quality of Life Research Unit define
quality of life as "The degree to which a person enjoys the important possibilities of his
or her life" (UofT). Their Quality of Life Model is based on the categories "being",
"belonging", and "becoming", respectively who one is, how one is not connected to one's
environment, and whether one achieves one's personal goals, hopes, and aspirations. (The
University of Toronto, 2010)
Quality of life is assessed through WHOQOL-BREF questionnaire. The
WHOQOL-BREF consists of 24 facets and provides scores on four dimensions of quality
of life such as physical health, psychological, social relationships and environmental
health. WHOQOL-BREF is available in both self-administered and interviewer
administered forms. (Wikipedia.com)
There is growing evidence that non pharmacological interventions lower blood
pressure. These interventions are not costly and are generally beneficial in promoting
health. They also help in decreasing the cardiovascular risk factors at little cost and with
minimal risk they are progressive relaxation, effective goal setting, meditation, exercise,
foot reflexology, deep breathing and yoga to control blood pressure. (Panwar, 2007)
Reflexology is a natural, holistic therapy based on the discovery that there are
points on the feet and hands which correspond to organs and systems of the body. For
thousands of years, techniques similar to reflexology have been used in Egypt and China.

5
A technique called "zone therapy" was developed in the early 20th century by an
American physician named William Fitzgerald. Dr. Fitzgerald suggested that maps of the
foot could be used to diagnose and treat medical conditions. He divided the body into 10
zones and labeled what he believed to be the corresponding parts of the foot. He proposed
that gentle pressure on the foot could bring relief to the corresponding zone.
In the 1930s, Eunice Ingham, a nurse and physiotherapist, further developed these
maps to include specific reflex points. Zone therapy was renamed reflexology.
Reflexology charts are diagrams of the feet with corresponding parts of the body. The
right foot corresponds to the right side of the body, and the left foot corresponds to the
left side.

6
Modern reflexologists use Ingham's methods, or similar techniques developed by
the reflexologist Laura Norman. Massage therapists, chiropractors, podiatrists, physical
therapists, and nurses may also use reflexology.
Foot Reflexology is an extended form of touch which results in mutual energy
exchange. It produces relaxation. It is the most widely used complementary therapy in
nursing practice. It is one of the way nurses use to communicate caring to patient and
touch is central to the nurses role in healing. (Walter Last, 2008)
NEED FOR THE STUDY
Hypertension is very common indeed and hence a major public health issue. The
estimated number of adults living with high blood pressure globally was 972 million.
This is expected to increase to 1.56 billion by 2025. (Duluth, 2003)
Hypertension was common in both developed (333 million) and undeveloped
(639 million) countries. In Europe hypertension occurs in about 30-45% of people.
(Soreson, 2010)
Hypertension is a worldwide epidemic. The prevalence of hypertension in the
United States is increasing and reached 34% in 2006and African American adults have
among the highest rates of hypertension in the world at 44%.Hypertension is more
prevalent in men (though menopause tends to decrease this difference) and in those of
low socioeconomic status. (Ferroini, 2007)
In India, hypertension has increased by 30 times in urban populations over 25
years and by 10 times in rural populations over 36 years. (World health day, 2013)
Hypertension was directly responsible for 7.5 million deaths in 2004, 2.8 per cent
of the total global deaths. The prevalence of hypertension in the age group 20 to 59 was

7
27.50 per cent. Of these, 53.30 per cent were aware of their diagnosis; 42.80 per cent
were taking treatment and only 10.50 per cent had controlled BP. (Shimona, 2013)
Pooling of epidemiological studies shows 31.5 million hypertensive in rural and
34 million in urban populations. A total of 70% of these were Stage I hypertension
(systolic BP 140-159 mmHg and diastolic BP 90-99 mmHg). Recent reports shows that
Stage I hypertension carry a significant cardiovascular risk and there is a need to reduce
this blood pressure. (Gupta, 2004)
A very high percentage of Indians are in a pre-hypertension stage. Mizoram had
58.5 per cent people in pre-hypertension stage though the actual population suffering
from high blood pressure was only 19 per cent. This was followed by Uttarakhand with
48.8 per cent, Kerala (48.1 per cent) and Maharashtra (46.2 per cent). Madhya Pradesh,
Tamilnadu and Andhra Pradesh are among the other States that have over 40 per cent of
the population in the pre-hypertension category. (Integrated Disease Surveillance
Survey, 2008)
In Tamilnadu recently the high prevalence of hypertension is in rural areas. The
study reported 21.4 per cent hypertension prevalence in about 10,500 people aged
between 25 to 64 in 11 villages in the State with both sexes being affected equally. It was
published in the International Journal of Public Health. (Dr. PrabhdeepKaur, 2012)
In Tamilnadu 857616 people in the 16 districts who came to healthcare facilities
for other ailments were screened between July to September 2012 alone. 60,517 of these
were found to have hypertension. (Jerard, 2013)
In Tamilnadu, pilot study was conducted in Sivaganga and Virudhunagar districts
during 2007-2010 to screen and treat people for hypertension during which about 11,

8
31,000 people were screened for hypertension in 98 health facilities.The median age at
occurrence of hypertension was 54 years (range, 41-70). (Vasudevan, 2012)
Hypertension or high blood pressure is one common ailment in adults. It is
estimated that more than 10 million people may have higher blood pressure but also
unaware their illness. As per research conducted in India about 2 percent in rural areas
have suffering from hypertension. The overall incidence of hypertension is estimated to
be 66 million (J Hum, 2000)
Association of physicians of India conducted a survey and concluded urban areas
in the counts had a significantly higher incidence of hypertension 27-37% as compared to
rural areas 2-8%. In India about 20% of adults’ population suffers from hypertension
making if the country’s highest silent killer from this almost 90% of the cases fall into the
category of primary essential hypertension (Agarwal, 2001)
Three hundred and eighty five camps in rural areas in Tamilnadu and 7.35 lakhs
people were screened and found out that 5.02% of population was affected with
hypertension (Tamilnadu Government public and preventive medicine, 2003)
Seventy million adults in the United States are affected by hypertension. The
condition also affects about two million teens and children. Over half of all Americans
with hypertension do not have their high blood pressure under control. (Centers for
Disease Control and Prevention, 2012)
The incidence of hypertension is increasing in developing countries such as
Thailand, as a result of sociological, political and economic changes. These changes are
producing enormous alterations in people’s lifestyles, following similar trends in western

9
countries. Negative changes in food consumption, alcohol consumption, and level of
physical activity, smoking, stress and tension have led to an increase in chronic health
problems for Thai people. Age, gender, ethnicity, genetic background, family health
history and hyper lipidaemia are likely to influence hypertension. (National Economic
and Social Development Board, 1997)
It has been found that health care professionals and patients with chronic disease
have increased their use of complementary therapies to help relieve uncomfortable
symptoms and suffering (Long, Huntley & Ernst, 2001)
The quality of life of hypertensive patients is not good. There are many ways to
improve the quality of life of hypertensive patients. Among one is zone therapy. Zone
therapy is a well known complementary therapy which claims to help the body achieve
homeostasis. It is believed that pressing specific areas on the feet related to specific
glands or organs of the body can help these glands and organs to function at their peak,
allowing the body to heal itself. The principle difference between massage and touch and
zone therapy is that zone therapy provides not only the relaxation effect obtained from
massage or touch is said to also improve body’s immunity contributing to healing process
(Byers, 2001; Dougans, 2002)
Zone therapy has been scientifically researched in many studies to explore the
claimed benefits. Some studies have supported its ability to reduce anxiety and pain.
There has been scientific evidence to support the claim that zone therapy can reduce
blood pressure and serum lipids, and can improve the quality of life in patients with
hypertension. (Hodgson 2000; Milligan et al 2002; Park & Cho, 2004)

10
During the clinical posting the researcher collected history of many hypertensive
patients. After the patients diagnosed as hypertension, they have some dietary
restrictions, dietary modifications and life style modifications. Because of this the
patients are psychologically dull and they have poor quality of life. Hence the researcher
felt the need to improve the quality of life of those patients. So the researcher selected the
study to assess the effectiveness of zone therapy on quality of life of hypertensive
patients.
STATEMENT OF THE PROBLEM
“A study to assess the effectiveness of zone therapy on quality of life among
patients with hypertension in selected villages at Tirunelveli district”.
OBJECTIVES
To assess the pre test and post test level of quality of life among patients with
hypertension in experimental group and control group.
To find out the effectiveness of zone therapy on quality of life among patients
with hypertension in experimental group.
To compare the pre test and post test level of quality of life among patients with
hypertension in experimental group.
To associate the post test level of quality of life among patients with hypertension
in experimental group and control group with their selected demographic
variables like age, sex, religion, education, occupation, monthly income, marital
status, type of family, number of children, dietary habits, duration of illness,
following DASH, and mode of treatment.

11
HYPOTHESES
H1: The mean post test level of quality of life in experimental group will be
significantly higher than the mean post test level of quality of life in control group.
H2: The mean post test level of quality of life in experimental group will be
significantly higher than their mean pre test level of quality of life.
H3: There will be a significant association between the post test level of quality of
life among patients with hypertension in experimental and control group with their
selected demographic variables. (age, sex, religion, education, occupation, monthly
income, marital status, type of family, number of children, dietary habits, duration of
illness, following DASH, and mode of treatment).
OPERATIONAL DEFINITIONS
Assess
It refers to the systematically, continuously, collecting, validating and
communicating the data regarding the quality of life of hypertensive patients.
Effectiveness
It refers to the extent to which zone therapy will improve the quality of life of
hypertensive patients and was measured by modified WHO quality of life questionnaire.
Zone therapy

12
It refers to the application of pressure to the heart and lung zones of the feet of
hypertensive patients for 15 minutes duration once a day on alternative days for 3 weeks.
Based on a system of zones and reflex areas as per zone therapy foot chart, the
investigator selected the zones of diaphragm line to the base of the toes on both feet and
zone therapy was administered by the investigator who has undergone a basic training in
zone therapy. Zone therapy technique includes finger walking, thumb walking, toe
rotation, slide and press and hooking method. The investigator was used only thumb
walking method.
Quality of lifeThe term used to assess the wellbeing of individual in various aspects such as
physical, psychological, environmental, and social aspects. It can be assessed by
modified WHO Quality of life qusetionarrie.
Hypertension Hypertension refers to the persistent systolic blood pressure (SBP) 140 mm hg,
diastolic blood pressure (DBP) 90 mm hg. In this study hypertension refers to those
persons with first stage of hypertension i.e. 140/90 mm hg to 160/100 mm hg.
ASSUMPTIONS
Hypertensive patients may not have adequate quality of life.
Zone therapy may improve the quality of life of hypertensive patients.
Quality of life may differ from individual to individual.
DELIMITATIONS
The study is delimited to only hypertensive patients.
The study is delimited to 4 weeks.

13
The study is delimited to the hypertensive patients in selected village.
PROJECTED OUTCOME
1. The finding of the study will help the nurse to plan and use zone therapy in
improving the quality of life of patients.
2. Zone therapy will improve the quality of life and thereby improving the comfort
and feeling of pleasant to the patient.
3. The findings of the study will help the nurse to plan the educational program
based on zone therapy.

14
CONCEPTUAL FRAMEWORK
The conceptual framework is a set of interrelated concepts that are assemble
together in some rational scheme, in virtue of their relevance to a common theme.
Conceptual framework helps to stimulate research and extensive knowledge. (Polit,
1990)
The conceptual framework for research study presents the measure on which the
purpose of study is based. The framework provides the perspective from which the
investigator views the problems. The study is based on the concept that the effectiveness
of zone therapy to improve the quality of life among patients with hypertension. The
investigator adopted the modified Ernestine Wiedenbach’s helping art of clinical nursing
theory as a base for developing conceptual framework.
Ernestine Wiedenbach’s proposes helping art of clinical nursing theory in 1964
for nursing, which describes a desired situation and a way to attain it. It directs action
towards the explicit goal. This theory has 3 factors.
Central purpose
Prescription
Realities
CENTRAL PURPOSE

15
In this study, the central purpose is to improve the quality of life among patients
with hypertension.
PRESCRIPTIONS
The application of zone therapy will improve the quality of life among patients
with hypertension.
REALITIES
The five realities are identified by Wiedenbach are agent, recipient, goal, means,
activities and framework
Agent: The agent is one who has personal attributes, capacities, capabilities,
commitment and competence to provide demonstration. In this study the researcher is the
agent. It refers to plan for providing zone therapy to the hypertensive patients.
Recipient: The recipient is the patients who had received the investigator’s
intervention. In this study, hypertensive patients who receive zone therapy were the
recipients.
Goal: The goal is to direct actions and suggests that the reason for taking those
actions. In this study goal is to improve the quality of life after the application of zone
therapy among the hypertensive patients.
Means: The means are the activities used by the investigator to achieve the goal.
In this study application of zone therapy with a purpose of improving quality of life.
Framework: The framework refers to the facilities in which nursing is practiced.
In this study framework refers to puliampatti village and perumpattur village.
The conceptualization of nursing according to this theory consists of three
steps as follows.

16
Step I : Identifying the need for help.
Step II : Ministering the need for help.
Step III : Validating the need for help.
Step I: Identifying the need for help.
This step involves determining the need for help. The hypertensive patients were
identified based on the inclusive and exclusive criteria. Purposive sampling technique
was used to select the samples. Assess the quality of life among hypertensive patients by
using WHO modified quality of life qusetionarrie in both the groups.
Step II: Ministering the need for help.
This refers to the provision of needed help. In my study after the selection of
samples the investigator applied zone therapy to the hypertensive patients in the
experimental group for the period of 15 minutes alternative days for 3 weeks and the
control group not received the intervention.
Step III: Validating the need for help.
The validation was done by doing the post test after 3 weeks of application of
zone therapy and by using the WHO modified quality of life qusetionarrie in both the
experimental and control group. Hypertension were categorized by pre hypertension,
stage I hypertension and stage II hypertension and quality of life were categorized by
three views that poor quality of life, good quality of life and very good quality of life.
It is accomplished by means of rendering zone therapy and it is followed by
analysis of data findings.

17
18
CHAPTER II
REVIEW OF LITERATURE
Review of literature is defined as a critical summary of review on a topic of
interest, often prepared to put a research problem in contest (Polit& Beck, 2006).
The review of literature in the research report is a summary of current
knowledge about a particular practice problem and includes what is known and not
known about the problem. The literature is reviewed to summarize knowledge for use
in practices or to provide a basis for conducting a study (Burns, 1997)
ORGANISATION OF REVIEW OF LITERATURE:
Section A: Studies related to prevalence and risk factors of hypertension.
Section B: Studies related to zone therapy on hypertension.
Section C: Studies related to zone therapy on quality of life of hypertensive patients.
SECTION A: STUDIES RELATED TO PREVALENCE AND RISK
FACTORS OF HYPERTENSION
Godwin et al., (2013) conducted a descriptive cross-sectional study among
hypertensive patients attending clinics at the Cardiology Unit, Colombo to study the
prevalence and define differential risk factors for hypertension in a hypertensive of South
Asian origin. All the patients with hypertension who provided informed written consent
were recruited to the study (n = 277). Mean age was 61±10.3 years and 50.2% were
males. The mean of average systolic and diastolic blood pressures (BP) were
133.04±12.91 mmHg and 81.07±6.41 mmHg respectively. Uncontrolled BP was present
in 41.1% (n = 114) of patients. Those with diabetes mellitus, obesity (body mass index >

19
27.5 kg/m2) and those who were older than 55 years were significantly higher in the risk
hypertensive group. A significant proportion of the hypertensive patients were having
uncontrolled hypertension which was significantly associated with the presence of
obesity and diabetes mellitus.
Laurencia., (2013) did a study on prevalence and risk factors for hypertension in
Adansi South, Ghana. Hypertension continues to emerge globally as one of the most
dangerous cardiovascular disease risk factors. This article presents the results of a cross-
section analysis of Adansi South residents (N = 539) 5 years and older to investigate the
blood pressure status and select hypertension risk factors across all age groups.
Approximately a third of Adansi South respondents (27.1%) were identified as
hypertensive. While the largest percent of the hypertensive samples were in the 40 to 59
age group, of concern was the emerging pattern among young and adolescent respondents
who were either identified as hypertensive and having modifiable risk factors for
hypertension like elevated body mass index.
Kotani et al., (2013) conducted a study to evaluate the impact of a number of
demographic, biological, behavioral and lifestyle health risk factors on the incidence of
hypertension in Thailand over a 4-year period. A prospective study of health risk factors
and their effects on the incidence of hypertension. The overall 4-year incidence of
hypertension was 3.5%, with the rate in men being remarkably higher than that in women
(5.2%).In both men and women, hypertension was strongly associated with age, obesity
and co morbidities while it had no association with socioeconomic factors. The cohort
patterns of socioeconomic and hypertension reflect that the health risk transition in Thais
20
is likely to be at the middle stage. Diet and lifestyle factors associate with incidence of
hypertension in Thais and may be amenable targets for hypertension control programmes.
Padwal et al., (2012) conducted a large cross-sectional study on prevalence of
hypertension in United States. Hispanic ethnicity (18.9%) compared to either non-
Hispanic white (27.7%) or non-Hispanic black (35.5%) was associated with the lowest
prevalence of hypertension. Race/ethnicity was a single independent predictor of
hypertension, with non-Hispanic black more likely to be hypertensive compare with
Hispanic Racial/ethnic disparities in hypertension persisted after controlling for potential
predictors of hypertension, implying the inability of known hypertension risk factors to
account for racial/ethnic variability in hypertension in US.
Sinha., (2011) conducted a cross sectional study to estimate the prevalence of
hypertension and to explore the risk factors associated with hypertension in adults living
in Central Development Region of Nepal. The participants underwent anthropometric
measurement and blood pressure and answered a pretested questionnaire. Overall
prevalence of hypertension was 22.4% (males: 32.7% and female: 15.3%). Bivariate
analysis showed significant relationship of hypertension with gender, age, literacy,
physical inactivity, body mass index (body mass index), smoking and alcohol
consumption. Therefore, intervention measures are warranted emphasizing on modifiable
risk factors such as smoking, alcohol consumption, physical activity and obesity to
prevent hypertension.
Lorenzo et al., (2011) conducted a study to examine the mortality risk among
3632, 97% participants in the sanantanio heart study to evaluate the impact of blood

21
pressure on relationship between prehypertension and mortality risks not known in
individuals who are free of diabetes mellitus and cardiovascular disease. The results were
prehypertension prevalence was 31.6% at baseline. There were 218 deaths during the
follow up period. Conclusion says that prehypertension increases mortality risk (all
causes and cardiovascular) in individual who are free of diabetes mellitus and
cardiovascular disease.
Peter songolo et al., (2011) conducted a study on prevalence of hypertension in
Zambia in which total of 1928 individuals participated in the survey, of which 33.0%
were males. About a third of the respondents had attained secondary level education
(35.8%), and 20.6% of males and 48.6% of females were overweight or obese. The
prevalence for hypertension was 34.8% (38.0% of males and 33.3% of females). In
multivariate analysis, factors independently associated with hypertension were: age, sex,
body mass index, alcohol consumption, sedentary lifestyle, and fasting blood glucose
level.
Adnan et al., (2010) conducted an analytical prospective study that aims to
determine prevalence of arterial hypertension in a population from ClujCounty. Study
included 2266 patients; each subject was subody mass indextted to an interview based on
a questionnaire. Diagnosis of arterial hypertension was established according to ESH
criteria. Arterial hypertension represents an important health problem in Romania due to
an increased prevalence, major impact on morbidity and mortality by cardiovascular and
cerebro-vascular disease. These facts accentuate the necessity of an early diagnosis, of
making people aware of the severity of the disease and it’s impact on their lifestyle.

22
Reddy et al., (2010) conducted a cross sectional study in tirupathi town to study
the prevalence of hypertension and it’s risk factors as well as it’s extent of diagnosis and
management among adults aged 40-60 years. This review summarizes that overall
hypertension. Prevalence rate was 8.6% among 1000 adults. 83.7% were aware of their
hypertension, all of those treated only 41.7% had satisfactory control of their
hypertension. Higher prevalence was found with the history of cerebrovascular accident,
cardiovascular accident 50%, alcohol intake 20%, diabetes mellitus 33.3%, family history
of hypertension 23.3%, smoking 22.4%, age more than 50 years 22.2%, lack of physical
exercise 15.8%, body mass index above 25 14.9%.
Yuvraj et al., (2009) did a study on prevalence, awareness, treatment and control
of hypertension in rural areas of davanagere was conducted. The results shows that
prevalence rate of hypertension in the study population were 18.3% than in females
17.5%. 11.6%, 5.6% and 1.2% of total subjects had grade 1, 2 and 3 respectively. Only
33.8% of them were aware of their hypertension status. Hypertension of 32.1% was on
treatment and 12.5% adequately controlled their blood pressure.
Nahla et al., (2008) conducted a cross sectional study to investigate the prevalence
and associated risk factors of hypertension and prehypertension among preparatory and
secondary school teachers in Jeddah, KSA. A multistage stratified random sampling
technique was used. The prevalence of hypertension & prehypertension were 25.2 % &
43.0 %, respectively, among the sample of 1476 teachers.Predictors of prehypertension
were male gender (aOR = 3.22, CI: 2.49, 4.16), age 40, and body mass index 25.The

23
prevalence of prehypertension and hypertension was high among teachers in Jeddah &
body mass index was the strongest modifiable risk factor.
Das et al., (2008) conducted a study on prevalence of hypertension in urban areas
of India using the Joint National Committee VII criteria with the aim of identifying the
risk factors and suggesting intervention strategies. A total of 1609 respondents out of
1602 individuals participated. Age and sex specific prevalence of hypertension showed
progressive rise of systolic and diastolic hypertension in women when compared to men.
Men showed progressive rise in systolic hypertension beyond fifth decade of life.
Bivariate analysis showed significant relationship of hypertension with age, sedentary
occupation, body mass index, diet, ischemic heart disease and smoking. The observed
prevalence of hypertension in this study and other studies suggest the need for a
comprehensive national policy to control hypertension in India and in other similar
developing countries.
Boston., (2006) conducted a study on trends in prevalence, incidence, and control
of hypertension in US. Prior to 1990, population data suggest that hypertension
prevalence was decreasing; however, recent data suggest that it is again on the rise.
Hypertension prevalence has also been increasing in other countries, and an estimated
972 million people in the world are suffering from this problem. Incidence rates of
hypertension range between 3% and 18%, depending on the age, gender, ethnicity, and
body size of the population studied. Despite advances in hypertension treatment, control
rates continue to be suboptimal. Only about one third of all hypertensives are controlled
in the United States. Programs that improve hypertension control rates and prevent
hypertension are urgently needed.

24
Rabecca et al., (2005) had done a prospective study of body mass index and the
risk of developing hypertension in fodor. They studied 13,563 initially healthy non
hypertensive men who participated in physician’s health study. They calculated body
mass index from self reported weight and height and defined hypertension as self
reported systolic blood pressure 140mmHg, diastolic blood pressure 90mmHg/new
antihypertensive medication use. After a median 14.5 years 4920 participants developed
hypertension. Higher baseline body mass index, even in consistently associated with
increased risk of hypertension compared to participants in lowest body mass index
quintile <22.4kg/m the relative risk of developing hypertension for men with a body mass
index 22.4-23.6, 23.7-24.7, 24.8-26.4kg/m were 1.20, 1.31, 1.56 and 1.85 respectively.
Further adjustment for diabetes mellitus, high cholesterol and baseline blood pressure did
not substantially after these results. They found a strong gradient between higher body
mass index and increased risk of hypertension even among men within the normal and
mildly overweight body mass index range. Approaches to decrease the risk of developing
hypertension may induce prevention of overweight and obesity.
Vikas et al., (2004) conducted cross-sectional studies in puducherry showed that
systolic blood pressure increases throughout life, whereas diastolic blood pressure
increases until about age 50 years and then declines in men and women and in all racial
groups resulting in a widening pulse pressure resulting in isolated systolic hypertension in
older persons. By age 60 years, about two third of those with hypertension have isolated
systolic hypertension. Now it is widely recognized that systolic blood pressure is equally
important than diastolic blood pressure in determining cardiovascular and renal
complications of hypertension.

25
Shapo., (2003)conducted a cross sectional study on prevalence of hypertension
and other cardiovascular risk factors on the adult population of Tirana City
(Albania).1120 adults aged 25 years and over (response rate=72.7%) were participated.
Overall, hypertension prevalence (blood pressure =140 and/or 90 mm Hg, or known
hypertensive receiving anti-hypertensive treatment) was 31.8% (36.6% and 27.4% in men
and women respectively). Age standardized prevalence of hypertension (adjusted to the
adult population of Tirana) was 30.2% (99% confidence intervals 29.8% to 30.6%) in
men and 22.7% (22.3% to 23.1%) in women. The prevalence of hypertension increased
with increasing age and was more common in the obese in both sexes. Albania is in a
state of rapid transition, with evidence that risk factors for non-communicable diseases
have already increased considerably over the past two decades.
Kumar et al., (2003) conducted a study on prevalence of hypertension in the
employees of a mega industry at south Gujarat to find out the prevalence of hypertension
and the impact of various risk factors on it and suggest the remedial measures. 1300
employees of industry were included in this study. Results revealed that the prevalence of
hypertension. Hypertension was more in general shift workers and in certain sections
(transport, finance, accounts, fire and security). Prevalence was also high in persons who
were overweight. (Consuming alcohol and tobacco). Treatment, compliance amongst
204, aware patients was only 17%.
Toprak et al., (2003) conducted a study in Germany to assess hypertension
patient’s baseline health behavior their disease, life styles, behavioral modifications,
sources of information about their disease and management of hypertension. The
researcher administered questionnaire to 72 hypertensive patients. The patients mean
26
body mass index was 27±4kg/m, though diet restriction had been most common
traditional self treatments found among hypertension patients were eating egg, yogurt
with garlic 27.8% and eating sour foods 25%. From media a considerable proportion of
patients gained their knowledge regarding hypertension. It was concluded that through
media, client education and behavioral modification can be achieved and it will help in
treatment and control of hypertension.
Sanjay et al., (2003) conducted a cross sectional study to describe the prevalence
of hypertension and other cardiovascular risk factors on the adult population of china
City (Albania). A total of 1120 adults aged 25 years and above were included in this
study. Overall, hypertension prevalence was 31.8% (36.6% and 27.4% in men and
women respectively). Age standardized prevalence of hypertension (adjusted to the adult
population of china) was 30.2% (99% confidence intervals 29.8% to 30.6%) in men and
22.7% (22.3% to 23.1%) in women. Men were significantly more likely to be
hypertensive than women (p value=0.001). The prevalence of hypertension increased
with increasing age and was more common in the obese in both sexes.
Wamala., (2003) did a community-based cross-sectional study on prevalence
factors associated with hypertension in rukungiri district, Uganda was done. A random
sample of consenting district residents, aged 20 years or older was enrolled to participate
in this study. The questionnaire collected data on demographics, social economic and
exposure history to various potential risk factors for hypertension. Out of 842 study
participants, 252 were hypertensive. The age-standardized prevalence of hypertension
was 30.5%.The prevalence of hypertension in this rural Ugandan district is relatively
27
high. The findings confirm the growing concern about hypertension as a public health
problem in Uganda.
SECTION B: STUDIES RELATED ZONE THERAPY ON
HYPERTENSION
Nadia Mohamed Taha and Zeinab Hussain Ali., (2011) conducted a clinical
trial on 68 patients with hypertension and divided randomly into two experiment (n=34)
and control (n=34) groups. Each patient in the experiment group received foot
reflexology for 30 minutes. Data were recorded in the demographic and blood pressure
record form. There were no significant differences between the mean systolic and
diastolic blood pressures of patients in experiment and control groups at baseline. The
blood pressure was significantly reduced among the experiment group after receiving the
foot reflexology (P<0.05). The mean systolic blood pressure was significantly reduced in
the experiment group after 10 and 30 minutes of massage; and the diastolic blood
pressure was reduced significantly in all measured times. Results showed positive effects
of foot reflexology on reducing blood pressure in patients with hypertension. Foot
reflexology should be recommended as a supplement treatment in patients with
hypertension.
Jasvir Kaur, Sukhpal Kaur, Neerja Bhardwaj et al., (2009) conducted a study
to assess the effect of 'foot massage and reflexology' on physiological parameters i.e
systolic and diastolic blood pressure, heart rate and oxygen saturation of critically ill
patients. The study was carried out in five intensive care units. Using purposive sampling,
60 patients were enrolled. A protocol on the procedure of 'foot massage and reflexology'

28
was developed. An Observation checklist was used to record the various parameters.
Three days the procedure of 'foot massage and reflexology' was implemented on the
patients. There was no significant difference in any of the physiological parameters.
There was significant decrease in the systolic blood pressure, increase in diastolic blood
pressure, reduction in the heart rate and improvement in the oxygen saturation in some
interventional observations after the intervention.
Dr. Jesus Manzanare., (2009) conducted a study to evaluate the effectiveness of
foot reflexology on patients with high blood pressure on 54 patients diagnosed with HBP,
34 females and 20 males. The 54 patients were divided in 2 groups experiment group and
control group. Two different protocols were used consisting of (1) a generalized
reflexology treatment and (2) a specific reflexology treatment for high blood pressure.
All subject in Groups (a) received Reflexology Protocol All subject in Groups (b)
received specific Reflexology Protocol. All groups received foot reflexology treatments 2
times per week over 10 weeks for a total of 20 sessions. The sessions included firm
pressure of reflexology for duration of 5 to 7 minutes in each foot. After all 20 sessions
were completed; the experimental group achieve lowered blood pressure levels than the
normal reflexology group.
Garrido-Ardila EM et al., (2007) conducted a systematic review and meta-
analysis to evaluate the effectiveness of foot reflexology on patients with hypertension.
Electronic database and manual searches were conducted on all published studies
reporting the effects of foot reflexology on hypertension. Forty four studies were eligible
including fifty studies associated with hypertension. The effects of foot reflexology were

29
analyzed by using Comprehensive Meta-Analysis Version 2.0. Foot reflexology had a
larger effect reducing blood pressure.
Park HS, Cho GY., (2004) conducted a study to evaluate the effects of foot
reflexology on blood pressure, serum lipids level and life satisfaction in essential
hypertension patients. The research design used was a nonequivalent control group
pretest-posttest design. Foot Reflexology was used as the experimental treatment. Thirty-
four subjects were assigned to an experimental group (18) and control group (16). Foot
Reflexology was administered twice a week for 6 weeks and self foot Reflexology was
administered twice a week for 4 weeks on the experimental group. There was a
significant decrease in systolic blood pressure but no significant decrease in diastolic
pressure in the experimental group compared to the control group. The total cholesterol
level in the experimental group compared to the control group was not significantly
decreased after foot reflexology. However, the triglyceride level in the experimental
group compared to the control group was significantly decreased after foot reflexology.
On the other hand, high density lipoprotein and low density lipoprotein levels in the
experimental group compared to the control group was not significantly decreased after
foot reflexology. Life satisfaction in the experimental group compared to the control
group was significantly improved after foot reflexology. The results proved that foot
reflexology was an effective nursing intervention to decrease systolic pressure, and
triglyceride but not for the blood cholesterol.

30
SECTION C: STUDIES RELATED TO ZONE THERAPY ON
QUALITY OF LIFE OF HYPERTENSION
Karima elshamy and eman elsafety., (2010) conducted a study to investigate the
effect of foot reflexology on blood pressure and quality of life among hypertensive
patients. A quasi-experimental study was con-ducted for patients with hypertension
attended the outpatient clinic of the Specialized Medical Hospital at Mansoura Uni-
versity, Egypt, samples were randomly allocated into two equal groups (40 in the foot
reflexology group (intervention), and 40 in the control group. Two tools were used for
data collection: I : Demographic and medical interview schedule. II: Quality of Life
Questionnaire. Systolic blood pressure decreased significantly in inter-vention group
from 160.2mmHg to 136.5mmHg compared to (162.5mmHg to 155.2mmHg) in controls.
There was a statistically significant decrease in means of diastolic blood pressure
between pre and post intervention (102.0mmHg –87.5mmHg) within the intervention
group and also in Quality of Life in either group (pre levels was 42.2, 47.1 and post levels
was 45.9, 47.4 in the 2 groups respectively). This study supported that foot reflexology
can reduce blood pressure levels in patients with hypertension, and quality of life.
Taehan Kanho Hakhoe chi., (2008) conducted a study to evaluate the effects of
foot reflexology on blood pressure, and quality of life in essential hypertension patients.
The research design used was a nonequivalent control group pretest-posttest design. fouty
subjects were assigned to an experimental group (20) and control group (20). Foot
Reflexology was administered twice a week for 3 weeks and self foot Reflexology was
administered twice a week for 4 weeks on the experimental group. There was a
significant decrease in systolic blood pressure in the experimental group compared to the

31
control group. Life satisfaction in the experimental group compared to the control group
was significantly improved after foot reflexology.
Somchock, Jeranut., (2006) conducted a study to investigate the effect of foot
reflexology on reducing blood pressure in patients with hypertension. One hundred
twenty eight patients with hypertension who attended the hypertensive clinic in the
medical outpatients department of Phramongkutklao Hospital, Bangkok, Thailand were
enrolled and participated in the study. This study used a randomized controlled trial
design. Participants were randomly allocated into one of two groups 64 participants in the
foot reflexology group (intervention) and 64 in the light foot massage group (control).
Participants were asked to complete a demographic data questionnaire and the World
Health Organization Quality of Life-BREF (WHOQOLBREF) (World Health
Organization 1996) questionnaire. Participants in the foot reflexology group received
their usual medical treatment and a 50-minute foot reflexology treatment twice a week
for 3 weeks. Participants in the light foot massage group received their usual medical
treatment and 30-minute light foot massage session without pressure on specific
reflexology areas twice a week for 3 weeks. Blood pressure was recorded before and after
each treatment. At the end of the study, participants were asked to complete the
WHOQOL-BREF. The study proved that foot reflexology can decrease blood pressure,
and it could improve the quality of life in patients with hypertension.
Maria.A. et al., (2005) conducted an experimental study to assess the
effectiveness of foot reflexology on quality of life of hypertensive patients. The research
design used was randomized control design. Foot Reflexology was used as the
experimental treatment. Foot Reflexology was administered twice a week for 4 weeks to

32
the experimental group. There was a significant improvement in the mean quality of life
in experimental group compared to the control group
Vibe Hansen., (2004) conducted a study to identify the effectiveness of
reflexology on quality of life of patients with hypertension among thirty patients with
hypertension. The patients were divided into two groups, as reflexology group, and
control group. The results showed that 9 out of the 10 patients in the reflexology group
experienced reduction of blood pressure and improvement in the mean quality of life
after reflexology treatment. The researcher concluded that, reflexology treatment was
effective in reducing blood pressure and improving the quality of life of hypertensive
patients.

33
CHAPTER III
RESEARCH METHODOLOGY Methodology includes the steps, procedures and strategies for gathering and
analyzing the data in the research investigation.
This chapter describes the methodology, includes the research approach, research
design, variables, setting of the study, population, sample, sample size, sampling
technique, criteria for selection of the sample, intervention, development and description
of the tool, content validity, pilot study, reliability, data collection procedure and plan for
data analysis.
RESEARCH APPROACHQuantitative research approach was used for the study.
RESEARCH DESIGNThe research design adopted for the study was quasi experimental pre test and
post test control group design.
The research design is diagrammatically represented as:
GROUP PRE TEST INTERVENTION POST TEST
Experimental
groupO1 X O2
Control Group O1 -- O2
Fig 2: Schematic Representation of Research Design
Keys:
O1: Pre test level of quality of life of experimental and control group.
X: Providing zone therapy to experimental group.

34
O2: Post test level of quality of life of experimental and control group.
VARIABLESVariables are characters that can have more than one value. The categories of
variables discussed in the present study are, independent variable and dependent variable.
Independent variables
Zone therapy
Dependent variables
Quality of life of patients with hypertension.
SETTING OF THE STUDYThe setting of the study refers to the area where the study was conducted. The
study was conducted in two villages in Tirunelveli district. In that puliampatti was
selected for experimental group and perumpattur village was selected for control group.
This arrangement helped the investigator to carry out the intervention for the
experimental group and also reduced the interruption from the control group. The
distances between the two villages from the college were 18 killo meters and 15 killo
meters respectively. The peoples from both villages got the health care facilities from
karivalamvandhanalloor primary health centre. The primary health centre was providing
the basic medical care facilities such as immunization, family planning, maternal child
health care etc.
STUDY POPULATIONThe population of the study was persons with hypertension, residing in
Tirunelveli district.
SAMPLE
35
The patients who are all having stage I hypertension within the age between 35-70
years of both sex residing in puliampatti and perumpattur villages in Tirunelveli district.
SAMPLE SIZEThe Sample size for the study was 60. Among 60 samples, 30 were selected for
experimental group and another 30 were for control group. The Samples were selected
based on the inclusive and exclusive criteria.
SAMPLING TECHNIQUEThe non probability purposive sampling technique was adopted for the study.
Step 1: The investigator selected puliampatti village for experimental group. Total
population of puliampatti village is 3745. In that 1930 were males and 1815 were
females. The researcher got the list of hypertensive patients residing in puliampatti
village from primary health center karivalamvanthanallur. The total number of
hypertensive patients in pulampatti village was 148. Based on the inclusion and exclusion
criteria, the researcher sort out 96 patients. The researcher checked the blood pressure by
using sphygmomanometer and stethoscope. Among them 18 patients were having pre
hypertension, 57 patients were having stage I hypertension and 21 patients were having
stage II hypertension. The researcher conducted pre test by using modified WHO quality
of life questionnaire to the stage I hypertensive patients (57). Based on the pre test scores
48 patients were having poor quality of life, 9 patients were having good quality of life
and none of them having very good quality of life. Among the 48 patients with poor
quality of life, 30 samples were selected for the experimental group.
Step 2: The investigator selected perumpattur village for control group. Total population
of perumpattur village is 4672. In that 2456 were males and 2186 were females. The
researcher got the list of hypertensive patients residing in perumpattur village from

36
primary health center karivalamvanthanallur. The total number of hypertensive patients
in perumpattur village was 173. Based on the inclusion and exclusion criteria, the
researcher sort out 112 patients. The researcher checked the blood pressure by using
sphygmomanometer and stethoscope. Among them 19 patients were having pre
hypertension, 65 patients were having stage I hypertension and 28 patients were having
stage II hypertension. The researcher conducted pre test by using modified WHO quality
of life questionnaire to the stage I hypertensive patients (65). Based on the pre test scores
54 patients were having poor quality of life, 11 patients were having good quality of life
and none of them having very good quality of life. Among the 54 patients with poor
quality of life, 30 samples were selected for the control group.
CRITERIA FOR THE SELECTION OF THE SAMPLEInclusive criteria
Persons with in the age group of 35 to 70 years.Persons with first stage of hypertension i.e.140/90 mm hg to 160/100 mm hg.Persons with illness duration of 2 to 5 years.Persons with poor quality of life. Persons who are willing to participate.Persons who were present at the time of data collection.Both male and female patients with stage I hypertension.
Exclusive criteria
Patients with prehypertension and stage II hypertension.The patients with hypertension associated with other systemic illness such as
diabetes mellitus, renal disease and cardiac disease.The Patients who have wound or ulcer in foot.The Patients who were already on zone therapy.
DEVELOPMENT AND DESCRIPTION OF THE TOOL The tool consist of two sections

37
SECTION-A
Section-A comprises of demographic variables like age, sex, religion,
education, occupation, monthly income, marital status, type of family, number of
children, dietary habits, duration of illness, following DASH, and mode of treatment.
SECTION-B
Section B consists of modified WHO quality of life questionnaire to assess
the quality of life of patients with hypertension.
SCORE INTERPRETATION Section B consists of WHO quality of life questionnaire with 4 options, with
positive and negative questions.
Positive questions scored as:
4- Not at all
3- Moderate
2- Very much
1-Extremely
Negative questions scored as:
1- Not at all
2- Moderate
3- Very much
4- Extremely
The maximum score is 120
Scoring key:
DESCRIPTION SCORE
38
Poor 0 -60Good 61-90Very good 91-120
VALIDITY:
The content validity of the tool was obtained from four nursing experts and one
medical expert in the field of medical surgical nursing. The content validity of the tool
was established on the basis of opinion given by the experts.
RELIABILITY:
The researcher was used modified WHO quality of life questionnaire. It is
standardized and universally acceptable one. Reliability of WHO quality of life
questionnaire of hypertensive patients was established by test-retest method by using
Karl Pearson’s correlation coefficient. The reliability score was r=0.8 which showed a
highly positive correlation of the tool. Hence the tool was considered reliable for
preceding the main study.
INTERVENTIONThe investigator introduced herself to the participants and explained the
purpose of the study and established rapport with them and got informed consent. The
participants were assured that the information provided by them would be kept
confidential.
Because of gravity the substances like uric acid settle in the feet and thereby
making the heart function and circulatory function difficult. Zone therapy increases the
temperature of the foot makes the substances settled in the feet to expel from the body

39
through the excretory system, there by improve the circulation and reduce the blood
pressure.
STEPS OF THE PROCEDURE
Tell the patient to lie down in supine position in a relaxed manner. Start with a
warm up thereby preparing the feet for therapy. Start directly on the heart and lung area.
This area stretches from the diaphragm line to the base of the toes on both feet. Using a
technique called the thumb walk, work on this area thoroughly. This area helps
strengthen and regulate the heart.
Work over the diaphragm line running just below the ball of the foot using thumb
walk. This will help deepen and open breathing and bring more oxygen and ch'i or prana
to each cell.
Work on the reflex areas for chest. This area is located on top of both feet, in the
troughs between the toes. Starting in zone 1 (at the base of the big toe), work up toward
leg, about 2 inches up from the webbing. Continue working each zone, ending in zone 5
near the outside edge of foot using the thumb walk.
Around the base of big toe (on the bottom of foot) is the reflex area for the thyroid
and parathyroid glands. These regulate the pulse rate and help with calcium absorption.
Work the reflex zone for the thyroid gland by thumb walk technique.

40
(KEVIN & BARBARA 1980)

41
Now work on the spine reflexes. These are located on the inside edge of both feet
(zone 1), extending from the heel nearly to the top of the big toe, opposite the root of the
toenail. Work slowly up the foot and then all the way down using the thumb walk
technique.
Working on the spine reflexes nourishes the nervous system that feeds the entire
body. Now, work on the soft center of foot, from the diaphragm line down to the midline.
This will stimulate the liver, kidneys, adrenals, and other organs vital for
circulation and the regulation of water levels in the body. Thoroughly cover this area,
moving up, down, and/ or diagonally. Use the thumb walk technique. It was given 15
minutes a day on alternative days for 3 weeks.
PILOT STUDYThe pilot study was a trial run for main study. A formal permission was obtained
from the principal, research and ethical committee of Sri. K. Ramachandran Naidu
College of Nursing, Medical officer in primary health centre at karivalam and the
president of the village. The tool used for the main study was validated by the pilot study.
Pilot study was conducted in Nainapuram village from 23.02.2015 to 01.03.2015. The
sample size was 6, in that 3 of them were assigned to experimental group and 3 of them
were assigned to control group. The investigator introduced herself to the participants and
explained the purpose of the study and established rapport with them and got informed
consent. The participants were assured that the information provided by them would be
kept confidential. The data related to demographic variables was collected by interview
method and it was recorded immediately. The pre test level of quality of life of patients
with hypertension was assessed for both groups by modified WHO quality of life
questionnaire. Based on the scores and inclusion criteria the researcher selected the

42
samples. The researcher given zone therapy only to the experimental group. Regular
treatment was continued by the control group and post test was done using the same tool
and done data analysis. The findings showed that there was a significant difference
between the post test level of quality of life of hypertensive patients in experimental
group and control group. The tool was found feasible and practicable to proceed with the
main study. There was no modification made in the tool after pilot study.
PROCEDURE FOR DATA COLLECTION A formal permission was obtained from the principal, research and ethical
committee of Sri. K. Ramachandran Naidu College of Nursing, Medical officer in
primary health centre at karivalam and the president of the village. The village selected
for data collection was puliampatti and perumpattur. In that puliampatti was assigned for
experimental group and perumpattur was assigned for control group. The period of data
collection was 30 days. The investigator introduced herself to the participants and
established rapport with them. Then explained the purpose of the study and got informed
consent. The participants were assured that the information provided by them would be
kept confidential. The data related to demographic variables was collected by interview
method and it was recorded immediately. The pre test level of quality of life of patients
with hypertension was assessed for both groups by modified WHO quality of life
questionnaire. Based on the scores and inclusion criteria the researcher selected the
samples by using purposive sampling technique. The sample size was 60 in that 30 of
them from puliampatti were assigned to experimental group and 30 of them from
perumpattur were assigned to control group. The researcher given zone therapy 15
minutes a day on alternative days for 3 weeks only to the experimental group. Regular

43
treatment was given to the control group and post test was done using the same tool. The
collected data was analyzed in terms of descriptive and inferential statistics.
PLAN FOR DATA ANALYSIS
Both descriptive and inferential statistics were used
DESCRIPTIVE STATISTICS
Frequency and percentage distribution was used to assess the demographic
variables.Frequency and percentage distribution was used to assess level of quality of life
of hypertensive patientsMean and standard deviation was used to compare the pre test and post test level
of quality of life of hypertensive patients.
INFERENTIAL STATISTICS
Paired “t” test was used to compare the pretest and post test level of quality of life
of hypertensive patients in experimental group.Unpaired “t” test was used to compare post test level of quality of life of
hypertensive patients between experimental group and control group.Chi- square test was used to find out the association between the post tests level
of quality of life of hypertensive patients with their selected demographic
variables in experimental group and control group.
PROTECTION OF HUMAN RIGHTS
Research proposal was approved by the research and ethical committee prior to
the pilot study and the main study formal permission was obtained from the Head of the
department of Medical surgical Nursing, Sri.k.Ramachandran Naidu college of Nursing,
Sankarankovil. Informed consent from each participant was obtained before starting the
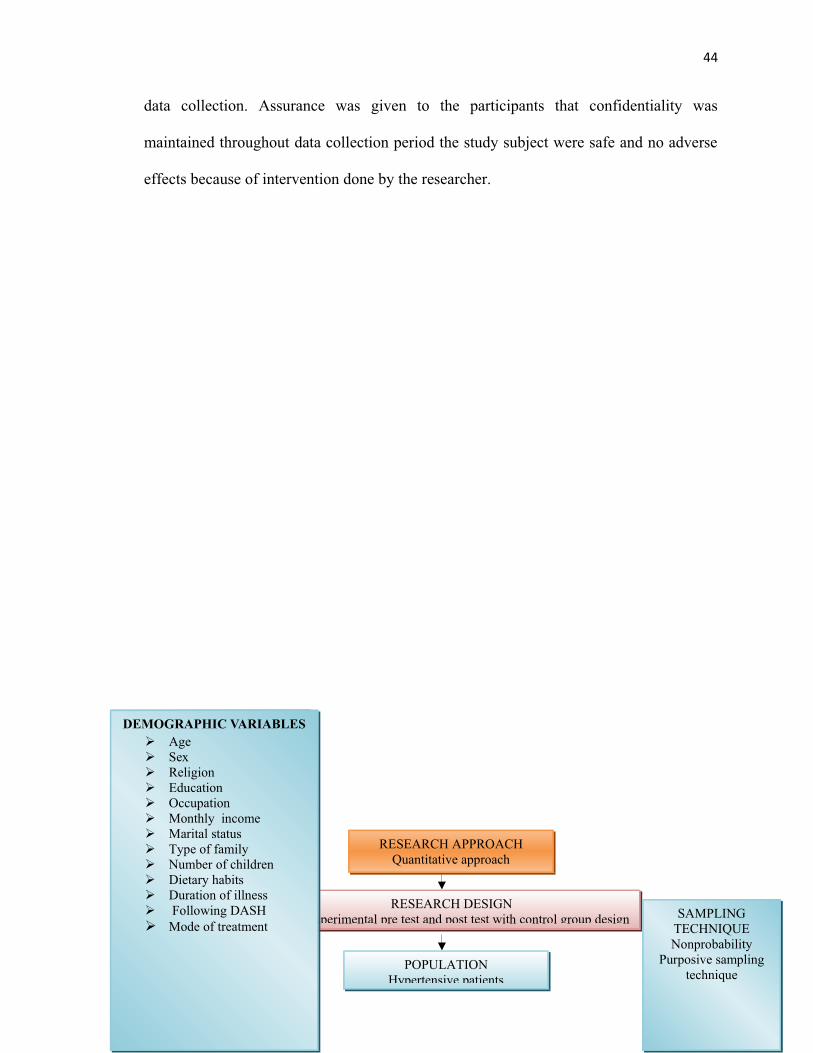
44
data collection. Assurance was given to the participants that confidentiality was
maintained throughout data collection period the study subject were safe and no adverse
effects because of intervention done by the researcher.
RESEARCH APPROACHQuantitative approach
RESEARCH DESIGNQuasi experimental pre test and post test with control group design
POPULATIONHypertensive patients
SAMPLINGTECHNIQUENonprobability
Purposive samplingtechnique
DEMOGRAPHIC VARIABLESAgeSexReligionEducation OccupationMonthly incomeMarital statusType of familyNumber of childrenDietary habitsDuration of illness Following DASHMode of treatment

45
SAMPLEHypertensive patients who fulfilled the inclusion and exclusion
criteria from selected village of Tirunelveli district
ACCESSIBLE POPULATIONHypertensive patients from selected village of Tirunelveli district
SAMPLE SIZEStage I hypertensive patients
Experimental group-30and Control group-30
Experimental Groupn=30
PRETESTAssessment of the quality of life using Modified
WHO Quality of life questionnaire
TARGET POPULATIONHypertensive patients of Tirunelveli district
Control Groupn=30
Zone therapy No intervention
ANALYSIS AND INTERPRETATIONDescriptive and inferential statistics
POST TESTAssessment of the quality of life using Modified WHO Quality of life questionnaire
REPORT
FINDINGSZone therapy was effective in improving the quality of life of hypertensive patients
Figure: 3 Schematic representation of Research methodology.
DatacollectionprocedureBy usingModified
WHOQuality of
life
46
CHAPTER IV
DATA ANALYSIS AND INTERPRETATION
This chapter deals with the analysis and interpretation of data related to the assessment
of the effectiveness of zone therapy on quality of life among patients with hypertension in
selected villages at Tirunelveli district.
Descriptive and inferential statistics were used for analyzing the data on the basis
of the objectives of the study. The data has been tabulated and organized as follows.
ORGANISATION OF DATA
Section A: Description of demographic variables of hypertensive patients in
experimental group and control group.
Frequency and percentage distribution of demographic variables of
hypertensive patients with regard to age, sex, religion, education, occupation,
monthly income, marital status, type of family, number of children, dietary
habits, duration of illness, following DASH, and mode of treatment in
experimental group and control group.
Section B: Assessment of the level of quality of life among hypertensive patients in
experimental group and control group.
Frequency and percentage distribution of the pre test and post test level of quality
of life among hypertensive patients in experimental group.Frequency and percentage distribution of the pre test and post test level of quality
of life among hypertensive patients in control group.

47
Section C: Comparison of the effectiveness of zone therapy on quality of life among
hypertensive patients in experimental group and control group.
Mean and standard deviation of the pre test level of quality of life among
hypertensive patients in experimental group and control group.Mean and standard deviation of the post test level of quality of life among
hypertensive patients in experimental group and control group.Mean and standard deviation of pre test and post test level of quality of
life among hypertensive patients in experimental group and control group.
Section D: Association between the post test level of quality of life among
hypertensive patients in experimental group and control group.
Association between the post test level of quality of life among
hypertensive patients with their selected demographic variables like age,
sex, religion, education, occupation, monthly income, marital status, type
of family, number of children, dietary habits, duration of illness, following
DASH, and mode of treatment in experimental group. Association between the post test level of quality of life among
hypertensive patients with their selected demographic variables like age,
sex, religion, education, occupation, monthly income, marital status, type
of family, number of children, dietary habits, duration of illness, following
DASH, and mode of treatment in control group.
SECTION A: DESCRIPTION OF DEMOGRAPHIC VARIABLES OF
HYPERTENSIVE PATIENTS IN EXPERIMENTAL GROUP AND CONTROL
GROUP.

48
Table: 1 Frequency and percentage distribution of demographic variables of
hypertensive patients with regard to age, sex, religion, education, occupation,
monthly income, marital status, type of family, number of children, dietary habits,
duration of illness, following DASH, and mode of treatment in experimental group
and control group.
(N=60)
S.N
o DEMOGRAPHIC VARIABLES
EXPERIMENTAL
GROUP
CONTROL
GROUPf % f %
1. Age
a. 35 – 45 yearsb. 46 – 55 yearsc. 56 – 65 yearsd. 66 – 70 years
3
8
15
4
10
26.67
50
13.33
2
9
13
6
6.67
30
43.33
202 Sex
a. Maleb. Female
17
13
56.67
43.33
19
11
63.33
36.673 Religion
a. Hindu b. Christian c. Muslimd. Others
28
2
0
0
93.33
6.67
0
0
29
1
0
0
96.67
3.33
0
04 Education
a. Illiterate b. Primary educationc. Higher secondary educationd. Diploma or degree education
16
9
4
1
53.34
30
13.33
3.33
18
7
3
2
60
23.33
10
6.675 Occupation
a. Unemployed b. cooliec. Private employee d. Government employeee. Self employed
2
11
3
0
14
6.66
36.67
10
0
46.67
3
13
3
0
11
10
43.33
10
0
36.67

49
6 Monthly income
a. Below Rs.3000b. Rs.3001 – Rs.6000c. Rs.6001 – Rs.9000d. Above Rs.9001
2
22
4
2
6.66
73.33
13.33
6.67
3
18
5
4
10
60
16.67
13.337 Marital status
a. Unmarried b. Married
2
28
6.66
93.34
0
30
0
1008 Type of family
a. Joint familyb. Nuclear family
11
19
36.67
63.33
17
13
56.67
43.339 Number of children
a. None b. 1c. 2d. More than 2
3
4
6
17
10
13.33
20
56.67
4
3
5
18
13.33
10
16.67
6010 Dietary habits
a. Vegetarianb. Non-vegetarian
4
26
13.33
86.67
3
27
10
9011 Duration of illness
a. 2 yearsb. 3 yearsc. 4 yearsd. 5 years
9
16
3
2
30
53.33
10
6.67
11
14
3
2
36.67
46.66
10
6.6712 Following DASH
a. Yes b. No
4
26
13.33
86.67
4
26
13.33
86.6713 Mode of treatment
a. Medication b. Both medication and exercise
26
4
86.67
13.33
28
2
93.33
6.670
Table 1 reveals the frequency and percentage distribution of demographic
variables of hypertensive patients with regard to age, sex, religion, education, occupation,
50
monthly income, marital status, type of family, number of children, dietary habits,
duration of illness, following DASH, and mode of treatment in experimental group and
control group.
With regard to the variable age in experimental group, out of 30 samples, 3
(10%) of them were in the age group of 35 – 45 years, 8 (26.67%) of them were in the
age group of 46 – 55 years, 15 (50%) of them were in the age group of 56 – 65 years and
4 (13.33%) of them were in the age group of 66 – 70 years whereas in the control group
out of 30 samples, 2 (6.67%) of them were in the age group of 35 – 45 years, 9 (30%) of
them were in the age group of 46 – 55 years, 13 (43.33%) of them were in the age group
of 56 – 65 years and 6 (20%) of them were in the age group of 66 – 70 years.
Pertaining to the variable sex in experimental group, out of 30 samples, 18 (60%)
of them were males and 12 (40%) of them were females whereas in the control group out
of 30 samples, 19 (63.33%) of them were males and 11 (36.67%) of them were females.
With respect to the variable religion in experimental group, out of 30 samples, 28
(93.33%) of them were Hindus, 2 (6.67%) of them were Christians, and none of them
were Muslims and belong to other category whereas in the control group out of 30
samples, 29 (96.67%) of them were Hindus, 1 (3.33%) of them was Christians, and none
of them were Muslims and belong to other category.
With regard to the variable education in experimental group, out of 30 samples,
16 (53.34%) of them were illiterates, 9 (30%) of them were having primary education, 4
(13.33%) of them were having higher secondary education and 1 (3.33%) of them was
having diploma or degree education whereas in the control group out of 30 samples, 18

51
(60%) of them were illiterates, 7 (23.33%) of them were having primary education, 3
(10%) of them were having higher secondary education and 2 (6.67%) of them were
having diploma or degree education.
Pertaining to the variable occupation in experimental group, out of 30 samples, 2
(6.66%) of them were unemployed, 11 (36.67%) of them were coolie workers, 3 (10%) of
them were private employees, 14 (46.67%) of them were self employed none of them
were government employees whereas in the control group out of 30 samples, 3 (10%) of
them were unemployed, 13 (43.33%) of them were coolie workers, 3 (10%) of them were
private employees, 11 (36.67%) of them were self employed and, none of them were
government employees
Concerning the variable monthly income in experimental group, out of 30
samples, 2 (6.67%) of them having the income below Rs.3000, 22 (73.33%) of them were
having the income of Rs.3001 – Rs.6000, 4 (13.33%) of them were having the income of
Rs.6001 – Rs.9000, and 2 (6.67%) of them were having the income of above Rs.9001
whereas in the control group out of 30 samples, 3 (10%) of them having the income
below Rs.3000, 18 (60%) of them were having the income of Rs.3001 – Rs.6000, 5
(16.67%) of them were having the income of Rs.6001 – Rs.9000, and 4 (13.33%) of them
were having the income of above Rs.9001.
With regard to the variable marital status in experimental group, out of 30
samples, 2 (6.67%) of them were unmarried and 28 (93.33%) of them were married
whereas in the control group out of 30 samples, all 30 (100%) of them were married and
none of them were unmarried.

52
With respect to the variable type of family in experimental group, out of 30
samples, 11 (36.67%) of them were from joint family and 19 (63.33%) of them were
from nuclear family whereas in the control group out of 30 samples, 17 (56.67%) of them
were from joint family and 13 (43.33%) of them were from nuclear family.
Pertaining to the variable number of children in experimental group, out of 30
samples, 3 (10%) of them were having no children, 4 (13.33%) of them were having one
child, 6 (20%) of them were having 2 children, and 17 (56.67%) of them were having
more than 2 children whereas in the control group out of 30 samples, 4 (13.33%) of them
were having no children, 3 (10%) of them were having one child, 5 (16.67%) of them
were having 2 children, and 18 (60%) of them were having more than 2 children.
With respect to the variable dietary habits in experimental group, out of 30
samples, 4 (13.33%) of them were vegetarian and 26 (86.67%) of them were non-
vegetarian whereas in the control group out of 30 samples, 3 (10%) of them were
vegetarian and 27 (90%) of them were non- vegetarian.
With regard to the variable duration of illness in experimental group, out of 30
samples, 9 (30%) of them were suffering for 2 years, 16 (53.33%) of them were suffering
for 3 years, 3 (10%) of them were suffering for 4 years, and 2 (6.67%) of them were
suffering for 5 years whereas in the control group out of 30 samples, 11 (36.67%) of
them were suffering for 2 years, 14 (46.66%) of them were suffering for 3 years, 3 (10%)
of them were suffering for 4 years, and 2 (6.67%) of them were suffering for 5 years.
With respect to the variable following DASH in experimental group, out of 30
samples, 4 (13.33%) of them were following DASH and 26 (86.67%) of them were not
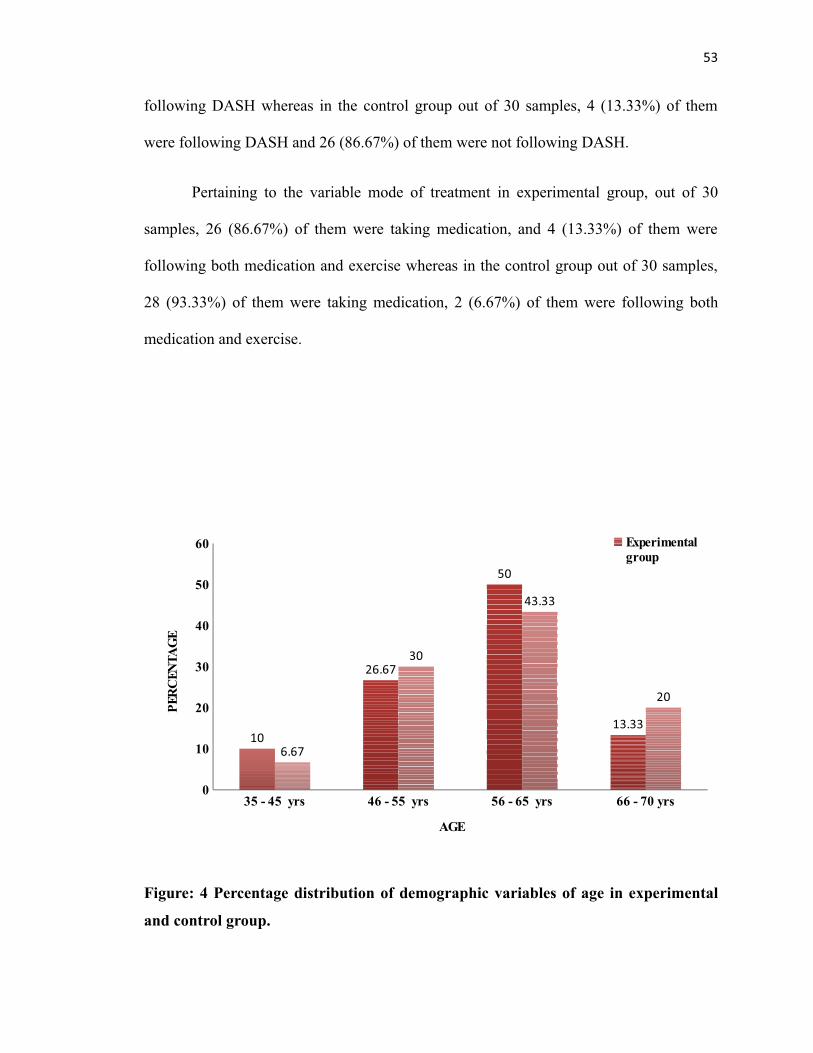
53
following DASH whereas in the control group out of 30 samples, 4 (13.33%) of them
were following DASH and 26 (86.67%) of them were not following DASH.
Pertaining to the variable mode of treatment in experimental group, out of 30
samples, 26 (86.67%) of them were taking medication, and 4 (13.33%) of them were
following both medication and exercise whereas in the control group out of 30 samples,
28 (93.33%) of them were taking medication, 2 (6.67%) of them were following both
medication and exercise.
35 - 45 yrs 46 - 55 yrs 56 - 65 yrs 66 - 70 yrs0
10
20
30
40
50
60
10
26.67
50
13.33
6.67
30
43.33
20
Experimental group
AGE
PER
CEN
TAG
E
Figure: 4 Percentage distribution of demographic variables of age in experimental
and control group.

54
Figure: 5 Percentage distribution of demographic variables of sex in experimental
and control group.
Figure: 6 Percentage distribution of demographic variables of religion in
experimental and control group

55
Figure: 7 Percentage distribution of demographic variables of education in
experimental and control group
Figure: 8 Percentage distribution of demographic variables of occupation in
experimental and control group.

56

57
Figure: 9 Percentage distribution of demographic variables of monthly income in
experimental and control group.

58
Figure: 10 Percentage distribution of demographic variables of marital status in
experimental and control group
Figure: 11 Percentage distribution of demographic variables of type of family in
experimental and control group.

59
Figure: 12 Percentage distribution of demographic variables of number of children
in experimental and control group

60
Figure: 13 Percentage distribution of demographic variables of dietary habits in
experimental and control group.
Figure: 14 Percentage distribution of demographic variables of duration of illness in
experimental and control group.

61
Figure: 15 Percentage distribution of demographic variables of following DASH in
experimental and control group.

62
Figure: 16 Percentage distribution of demographic variables of mode of treatment
in experimental and control group
Section B: Assessment of the level of quality of life among hypertensive patients in
experimental group and control group.
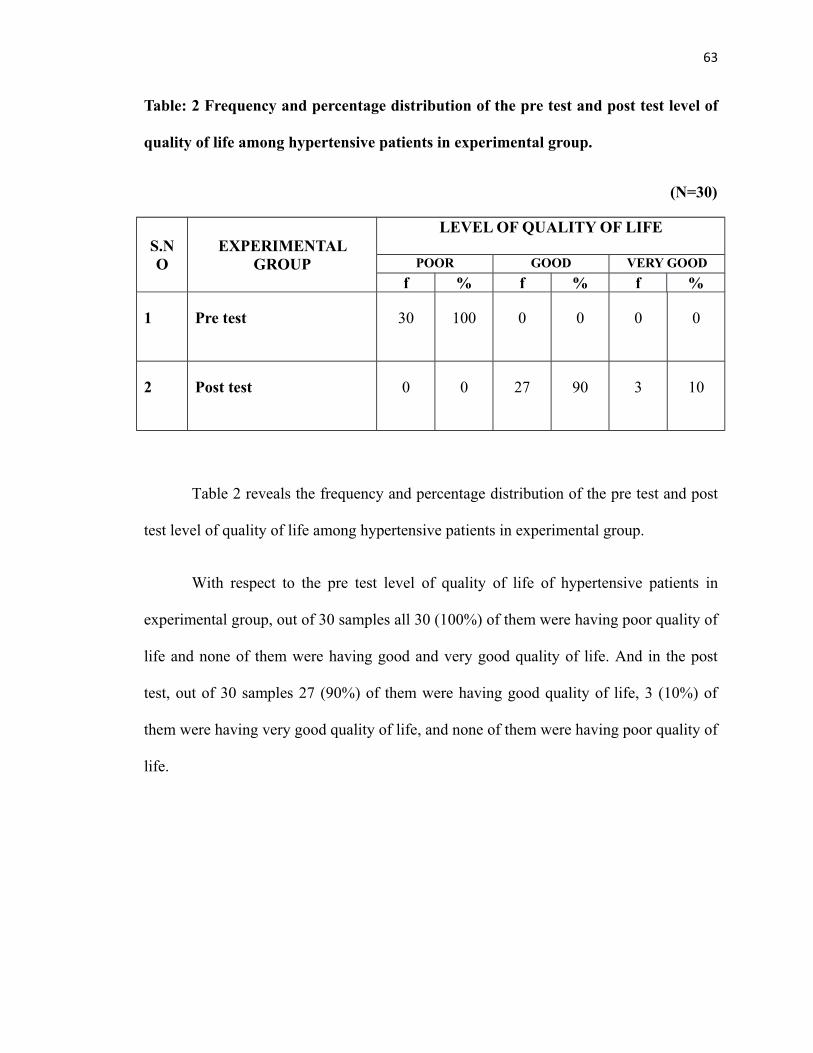
63
Table: 2 Frequency and percentage distribution of the pre test and post test level of
quality of life among hypertensive patients in experimental group.
(N=30)
S.NO
EXPERIMENTALGROUP
LEVEL OF QUALITY OF LIFE
POOR GOOD VERY GOODf % f % f %
1 Pre test 30 100 0 0 0 0
2 Post test 0 0 27 90 3 10
Table 2 reveals the frequency and percentage distribution of the pre test and post
test level of quality of life among hypertensive patients in experimental group.
With respect to the pre test level of quality of life of hypertensive patients in
experimental group, out of 30 samples all 30 (100%) of them were having poor quality of
life and none of them were having good and very good quality of life. And in the post
test, out of 30 samples 27 (90%) of them were having good quality of life, 3 (10%) of
them were having very good quality of life, and none of them were having poor quality of
life.

64
Figure: 17 Percentage distribution of the pre test and post test level of quality of life
among hypertensive patients in experimental.
Table: 3 Frequency and percentage distribution of the pre test and post test level of
quality of life among hypertensive patients in control group.

65
(N=30)
S.NO CONTROL GROUP
LEVEL OF QUALITY OF LIFE
POOR GOOD VERY GOODf % f % f %
1 Pre test 30 100 0 0 0 0
2 Post test 30 100 0 0 0 0
Table 3 reveals the frequency and percentage distribution of the pre test and post
test level of quality of life among hypertensive patients in control group.
With respect to the pre test and post test level of quality of life of hypertensive
patients in control group, out of 30 samples all 30 (100%) of them were having poor
quality of life and none of them were having good and very good quality of life.

66
Figure: 18 Percentage distribution of the pre test and post test level of quality of life
among hypertensive patients in control group.
Section C: Comparison of the effectiveness of zone therapy on quality of life among
hypertensive patients in experimental group and control group.

67
Table: 4 Mean and standard deviation of the pre test level of quality of life among
hypertensive patients in experimental group and control group.
(N=60)
S.NO PRE TEST EXPERIMENTAL
GROUPCONTROL
GROUP
‘t’ Value
1 Mean 42.76 42.14
0.66 #NS
2 Standard Deviation 3.28 4.05
# NS = Nil significance
Table 4 reveals the mean and standard deviation of the pre test level of quality of
life among hypertensive patients in experimental group and control group.
In pre test experimental group showed a mean value of 42.76 with the standard
deviation of 3.28 and the control group showed a mean value of 42.14 with the standard
deviation of 4.05. The calculated ‘t” value was 0.66.
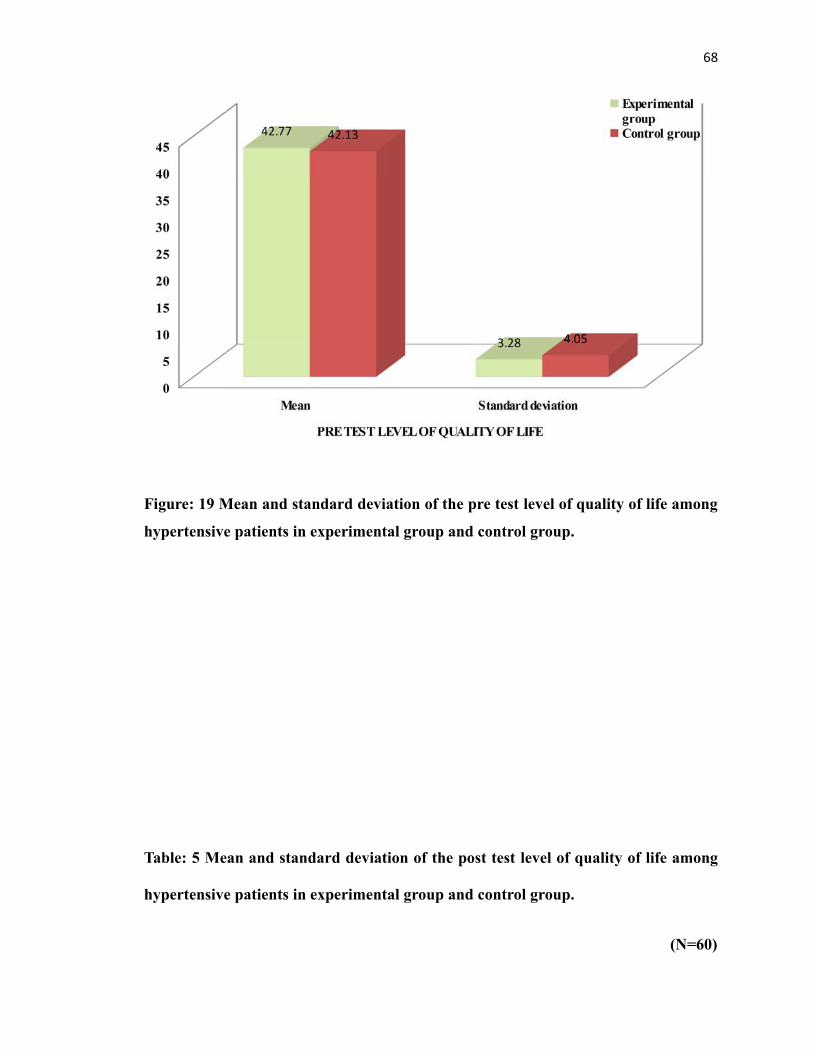
68
Figure: 19 Mean and standard deviation of the pre test level of quality of life among
hypertensive patients in experimental group and control group.
Table: 5 Mean and standard deviation of the post test level of quality of life among
hypertensive patients in experimental group and control group.
(N=60)

69
S.NO POST TEST
EXPERIMENTALGROUP
CONTROLGROUP
‘t’ Value
1 Mean 87 42.76
40.66*S
2 Standard Deviation4.42 3.99
* S = Significance p<0.05
Table 5 reveals the mean and standard deviation of the post test level of quality of
life among hypertensive patients in experimental group and control group.
In post test experimental group showed a mean value of 87 with the standard
deviation of 4.42 and the control group showed a mean value of 42.76 with the standard
deviation of 3.99. The calculated ‘t” value was 40.66 at P< 0.05 level. Hence the stated
hypothesis “The mean post test level of quality of life in experimental group will be
significantly higher than the mean post test level of quality of life in control group” was
accepted.
.

70
Figure: 20 Mean and standard deviation of the post test level of quality of life
among hypertensive patients in experimental group and control group.
Table: 6 Mean and standard deviation of pre test and post test level of quality of life
among hypertensive patients in experimental group.

71
(N=30)
S.NO GROUP
PRE TEST POST TEST MeanDifference
‘t’ ValueMEAN SD MEAN SD
1 Experimentalgroup
42.76 3.28 87 4.42 44.23 44.02 *
S
*S = Significance p<0.05
Table 6 reveals the mean and standard deviation of pre test and post test level of
quality of life among hypertensive patients in experimental group.
The experimental group showed a mean value of 42.76 with the standard
deviation of 3.28 in the pre test and a mean value of 87 with the standard deviation of
4.42 in the post test. The mean difference was 44.23. The calculated “t” value was 44.02
at P< 0.05 level. Hence the stated hypothesis “The mean post test level of quality of life
in experimental group will be significantly higher than their mean pre test level of quality
of life” was accepted.

72
Figure: 21 Mean and standard deviation of pre test and post test level of quality of
life among hypertensive patients in experimental group.
Section D: Association between the post test level of quality of life among
hypertensive patients in experimental group and control group.

73
Table :7 Association between the post test level of quality of life among hypertensive
patients with their selected demographic variables like age, sex, religion, education,
occupation, monthly income, marital status, type of family, number of children,
dietary habits, duration of illness, following DASH, and mode of treatment in
experimental group.
(N=30)
S.N
oDEMOGRAPHIC
VARIABLES
QUALITY OF LIFE
2POOR GOOD VERY
GOODf % f % f %
1. Age
a. 35 – 45 yearsb. 46 – 55 yearsc. 56 – 65 yearsd. 66 – 70 years
-
-
-
-
-
-
-
-
1
7
15
4
3.33
23.33
50
13.33
2
1
0
0
6.67
3.33
0
0
12.87*
df=3
S
2 Sex
a. Maleb. Female
-
-
-
-
15
12
50
40
2
1
6.67
3.33
0.13#df=1
NS3 Religion
a. Hindu b. Christian c. Muslimd. Others
-
-
-
-
-
-
-
-
26
1
0
0
86.67
3.33
0
0
2
1
0
0
6.67
3.33
0
0
3.80#df=1
NS
4 Education
a. Illiterate b. Primary educationc. Higher secondary
educationd. Diploma or degree
education
-
-
-
-
-
-
-
-
16
8
3
0
53.33
26.67
10
0
0
1
1
1
0
3.33
3.33
3.34
11.79*
df=3
S
5 Occupation
a. Unemployed b. cooliec. Private employee d. Government
-
-
-
-
-
-
2
10
2
6.67
33.33
6.67
0
1
1
0
3.33
3.33
0
2.17#df =3
NS

74
employeee. Self employed
-
-
-
-
0
13
0
43.33
0
13.33
6 Monthly income
a. Below Rs.3000b. Rs.3001 – Rs.6000c. Rs.6001 – Rs.9000d. Above Rs.9001
-
-
-
-
-
-
-
-
2
22
2
1
6.67
73.33
6.67
3.33
0
0
2
1
0
0
6.67
3.33
13.33*
df=3
S
7 Marital status
a. Unmarried b. Married
-
-
-
-
1
26
3.33
86.67
1
2
3.33
6.67
3.80#df=1
NS8 Type of family
a. Joint familyb. Nuclear family
-
-
-
-
10
17
33.33
56.67
1
2
3.33
6.67
0.015#df=1
NS9 Number of children
a. None b. 1c. 2d. More than 2
-
-
-
-
-
-
-
-
2
3
6
16
6.67
10
20
53.33
1
1
0
1
3.33
3.33
0
3.34
3.80#df=3
NS
10 Dietary habits
a. Vegetarianb. Non-vegetarian
-
-
-
-
2
25
6.67
83.33
2
1
6.67
3.33
8.20*
df=1
S11 Duration of illness
a. 2 yearsb. 3 yearsc. 4 yearsd. 5 years
-
-
-
-
-
-
-
-
6
16
3
2
20
53.33
10
6.67
3
0
0
0
10
0
0
0
7.77#df=3
NS
12 Following DASH
a. Yes b. No
-
-
-
-
2
25
6.67
83.33
2
1
6.67
3.33
8.2051*
df=1
S13 Mode of treatment
a. Medication b. Both medication and
exercise
-
-
-
-
25
2
83.33
6.67
1
2
3.33
6.67
8.20*
df=1
S

75
*S – Significant # NS – Nil significant p<0.05
Table 7 reveals the association between the post test level of quality of life among
hypertensive patients with their selected demographic variables like age, sex, religion,
education, occupation, monthly income, marital status, type of family, number of
children, dietary habits, duration of illness, following DASH, and mode of treatment in
experimental group.
The findings showed that there was a significant association between the post test
level of quality of life among hypertensive patients in experimental group with their
selected demographic variables age, education, monthly income, dietary habits, following
DASH, and mode of treatment and there was no significant association between the post
test level of quality of life among hypertensive patients with their selected demographic
variables sex, religion, occupation, marital status, type of family, number of children, and
duration of illness.
Table :8 Association between the post test level of quality of life among hypertensive
patients with their selected demographic variables like age, sex, religion, education,
occupation, monthly income, marital status, type of family, number of children,
dietary habits, duration of illness, following DASH, and mode of treatment in
control group.
(N=30)S.N
o
DEMOGRAPHIC
VARIABLES
QUALITY OF LIFE
2POOR GOOD VERY
GOOD

76
f % f % f %
1. Age
a. 35 – 45 yearsb. 46 – 55 yearsc. 56 – 65 yearsd. 66 – 70 years
2
9
13
6
6.67
30
43.33
20
-
-
-
-
-
-
-
-
-
-
-
-
-
-
-
-
0#df=0
NS
2 Sex
a. Maleb. Female
19
11
63.33
36.67
-
-
-
-
-
-
-
-
0#df=0
NS3 Religion
a. Hindu b. Christian c. Muslimd. Others
29
1
0
0
96.67
3.33
0
0
-
-
-
-
-
-
-
-
-
-
-
-
-
-
-
-
0#df=0
NS
4 Education
a. Illiterate b. Primary educationc. Higher secondary
educationd. Diploma or degree
education
18
7
3
2
60
23.33
10
6.67
-
-
-
-
-
-
-
-
-
-
-
-
-
-
-
-
0#df=0
NS
5 Occupation
a. Unemployed b. cooliec. Private employee d. Government
employeee. Self employed
3
13
3
0
2
10
43.33
10
0
6.67
-
-
-
-
-
-
-
-
-
-
-
-
-
-
-
0#df=0
NS
6 Monthly income
a. Below Rs.3000b. Rs.3001 – Rs.6000c. Rs.6001 – Rs.9000
3
18
10
60
-
-
-
-
-
-
-
-
0#df=0
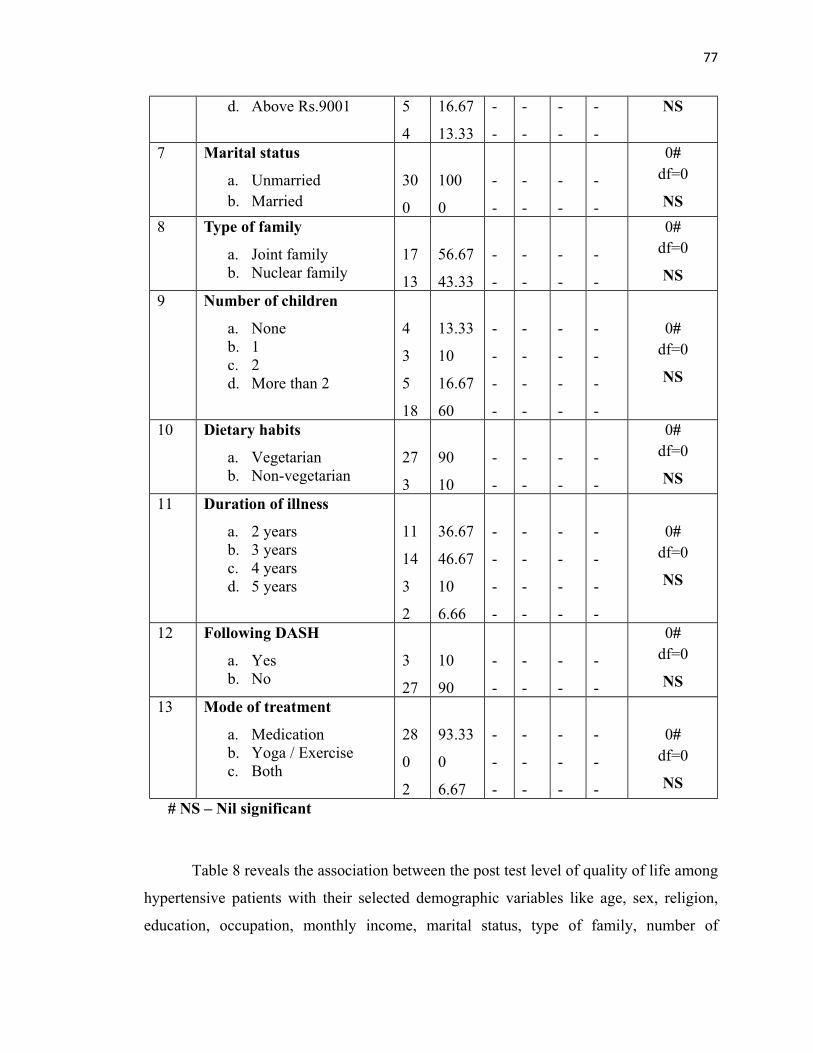
77
d. Above Rs.9001 5
4
16.67
13.33
-
-
-
-
-
-
-
-
NS
7 Marital status
a. Unmarried b. Married
30
0
100
0
-
-
-
-
-
-
-
-
0#df=0
NS8 Type of family
a. Joint familyb. Nuclear family
17
13
56.67
43.33
-
-
-
-
-
-
-
-
0#df=0
NS9 Number of children
a. None b. 1c. 2d. More than 2
4
3
5
18
13.33
10
16.67
60
-
-
-
-
-
-
-
-
-
-
-
-
-
-
-
-
0#df=0
NS
10 Dietary habits
a. Vegetarianb. Non-vegetarian
27
3
90
10
-
-
-
-
-
-
-
-
0#df=0
NS11 Duration of illness
a. 2 yearsb. 3 yearsc. 4 yearsd. 5 years
11
14
3
2
36.67
46.67
10
6.66
-
-
-
-
-
-
-
-
-
-
-
-
-
-
-
-
0#df=0
NS
12 Following DASH
a. Yes b. No
3
27
10
90
-
-
-
-
-
-
-
-
0#df=0
NS13 Mode of treatment
a. Medication b. Yoga / Exercisec. Both
28
0
2
93.33
0
6.67
-
-
-
-
-
-
-
-
-
-
-
-
0#df=0
NS # NS – Nil significant
Table 8 reveals the association between the post test level of quality of life among
hypertensive patients with their selected demographic variables like age, sex, religion,
education, occupation, monthly income, marital status, type of family, number of

78
children, dietary habits, duration of illness, following DASH, and mode of treatment in
control group.
The findings showed that there was no significant association between the post
test level of quality of life among hypertensive patients in control group with their
selected demographic variables age, sex, religion, education, occupation, monthly
income, marital status, type of family, number of children, dietary habits, duration of
illness, duration of treatment, following DASH, and mode of treatment.

77
CHAPTER V
DISCUSSION
This chapter deals with the discussion of the result of the data analysis to evaluate
the effectiveness of zone therapy on quality of life among patients with hypertension.
The discussion is based on the objectives of the study and the hypotheses specified in the
study.
MAJOR FINDINGS OF THE STUDY WERE,
On analysis of frequency and percentage distribution of demographic variables in
age out of 30 samples, majority 15 (50%) of them were in the age group of 56 – 65
years, 3 (10%) of them were in the age group of 35 – 45 years, 8 (26.67%) of them were
in the age group of 46 – 55 years, and 4 (13.33%) of them were in the age group of 66 –
70 years whereas in the control group out of 30 samples, majority 13 (43.33%) of them
were in the age group of 56 – 65 years, 2 (6.67%) of them were in the age group of 35 –
45 years, 9 (30%) of them were in the age group of 46 – 55 years, and 6 (20%) of them
were in the age group of 66 – 70 years.
With regard to the variable sex in experimental group, out of 30 samples, majority
18 (60%) of them were males and 12 (40%) of them were females whereas in the control
group out of 30 samples, majority 19 (63.33%) of them were males and 11 (36.67%) of
them were females.
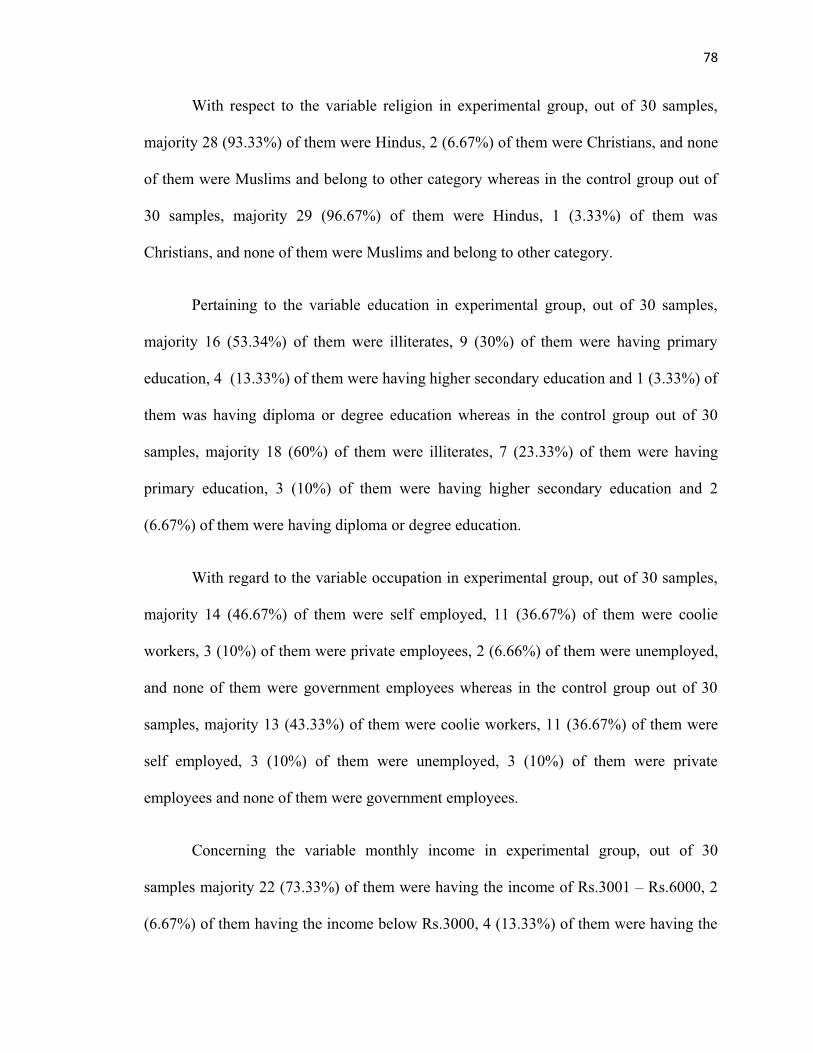
78
With respect to the variable religion in experimental group, out of 30 samples,
majority 28 (93.33%) of them were Hindus, 2 (6.67%) of them were Christians, and none
of them were Muslims and belong to other category whereas in the control group out of
30 samples, majority 29 (96.67%) of them were Hindus, 1 (3.33%) of them was
Christians, and none of them were Muslims and belong to other category.
Pertaining to the variable education in experimental group, out of 30 samples,
majority 16 (53.34%) of them were illiterates, 9 (30%) of them were having primary
education, 4 (13.33%) of them were having higher secondary education and 1 (3.33%) of
them was having diploma or degree education whereas in the control group out of 30
samples, majority 18 (60%) of them were illiterates, 7 (23.33%) of them were having
primary education, 3 (10%) of them were having higher secondary education and 2
(6.67%) of them were having diploma or degree education.
With regard to the variable occupation in experimental group, out of 30 samples,
majority 14 (46.67%) of them were self employed, 11 (36.67%) of them were coolie
workers, 3 (10%) of them were private employees, 2 (6.66%) of them were unemployed,
and none of them were government employees whereas in the control group out of 30
samples, majority 13 (43.33%) of them were coolie workers, 11 (36.67%) of them were
self employed, 3 (10%) of them were unemployed, 3 (10%) of them were private
employees and none of them were government employees.
Concerning the variable monthly income in experimental group, out of 30
samples majority 22 (73.33%) of them were having the income of Rs.3001 – Rs.6000, 2
(6.67%) of them having the income below Rs.3000, 4 (13.33%) of them were having the

79
income of Rs.6001 – Rs.9000, and 2 (6.67%) of them were having the income of above
Rs.9001 whereas in the control group out of 30 samples majority 18 (60%) of them were
having the income of Rs.3001 – Rs.6000, 3 (10%) of them having the income below
Rs.3000, 5 (16.67%) of them were having the income of Rs.6001 – Rs.9000, and 4
(13.33%) of them were having the income of above Rs.9001.
With regard to the variable marital status in experimental group, out of 30
samples, majority 28 (93.33%) of them were married and 2 (6.67%) of them were
unmarried whereas in the control group out of 30 samples, all 30 (100%) of them were
married and none of them were unmarried.
Pertaining to the variable type of family in experimental group, out of 30 samples,
majority 19 (63.33%) of them were from nuclear family and 11 (36.67%) of them were
from joint family whereas in the control group out of 30 samples, majority 17 (56.67%)
of them were from joint family and 13 (43.33%) of them were from nuclear family.
With respect to the variable number of children in experimental group, out of 30
samples majority 17 (56.67%) of them were having more than 2 children, 3 (10%) of
them were having no children, 4 (13.33%) of them were having one child and 6 (20%) of
them were having 2 children whereas in the control group out of 30 samples majority 18
(60%) of them were having more than 2 children, 4 (13.33%) of them were having no
children, 3 (10%) of them were having one child and 5 (16.67%) of them were having 2
children.
Concerning the variable dietary habits in experimental group, out of 30 samples
majority 26 (86.67%) of them were non- vegetarian and 4 (13.33%) of them were

80
vegetarian whereas in the control group out of 30 samples majority 27 (90%) of them
were non- vegetarian and 3 (10%) of them were vegetarian.
With regard to the variable duration of illness in experimental group, out of 30
samples majority 16 (53.33%) of them were suffering for 3 years, 9 (30%) of them were
suffering for 2 years, 3 (10%) of them were suffering for 4 years, and 2 (6.67%) of them
were suffering for 5 years whereas in the control group out of 30 samples majority 14
(46.66%) of them were suffering for 3 years, 11 (36.67%) of them were suffering for 2
years, 3 (10%) of them were suffering for 4 years, and 2 (6.67%) of them were suffering
for 5 years.
With respect to the variable following DASH in experimental group, out of 30
samples majority 26 (86.67%) of them were not following DASH and 4 (13.33%) of
them were following DASH whereas in the control group out of 30 samples majority 26
(86.67%) of them were not following DASH and 4 (13.33%) of them were following
DASH.
Pertaining to the variable mode of treatment in experimental group, out of 30
samples majority 26 (86.67%) of them were taking medication, and 4 (13.33%) of them
were following both medication and exercise whereas in the control group out of 30
samples majority 28 (93.33%) of them were taking medication and 2 (6.67%) of them
were following both medication and exercise.
On analysis of the mean and standard deviation in post test experimental group
showed a mean value of 87 with the standard deviation of 4.42 and the control group
81
showed a mean value of 42.76 with the standard deviation of 3.99. The calculated ‘t”
value was 40.66 at P< 0.05 level. This shows improvement in quality of life.
There was a significant association between the post test level of quality of life
among hypertensive patients with their selected demographic variables age, education,
monthly income, dietary habits, following DASH, and mode of treatment and there was
no significant association between the post test level of quality of life among
hypertensive patients with their selected demographic variables sex, religion, occupation,
marital status, type of family, number of children, and duration of illness.
The first objective was to assess the pre test and post test level of quality of life
among patients with hypertension in experimental group and control group.
On analysis of the pre test level of quality of life of hypertensive patients in
experimental group, out of 30 samples all 30 (100%) of them were having poor quality of
life and none of them were having good and very good quality of life. And in the post
test, out of 30 samples 27 (90%) of them were having good quality of life, 3 (10%) of
them were having very good quality of life, and none of them were having poor quality of
life.
On analysis of the pre test and post test level of quality of life of hypertensive
patients in control group, out of 30 samples all 30 (100%) of them were having poor
quality of life and none of them were having good and very good quality of life.

82
The above result was supported by a study conducted by Barbar Kunz et al
(2007) on effectiveness of zone therapy on 48 hypertensive patients. The study indicates
that hypertensive patients experienced significant improvement in the quality of life.
The second objective was to find out the effectiveness of zone therapy on quality of
life among patients with hypertension in experimental group.
On analysis of the post test the experimental group showed a mean value of 87
with the standard deviation of 4.42 and the control group showed a mean value of 42.76
with the standard deviation of 3.99. The calculated ‘t” value was 40.66 at P< 0.05 level.
This shows improvement in quality of life.
Hence the stated hypothesis “The mean post test level of quality of life in
experimental group will be significantly higher than the mean post test level of quality of
life in control group” was accepted.
The above result was supported by a study conducted by Boston and jamiz
(2002) simple cross over design used to study the effect of zone therapy on quality of life
of hypertensive patients. 20 samples were selected by using purposive sampling
technique during experimental period patients received zone therapy for 1 hour per day
for 7 days and in the control period patients did not received zone therapy for 7 days. The
instruments used for data collection were demographic data, and WHO quality of life
questionnaire. The data analyzed by using frequency, mean, standard deviation and
ANOVA. The results of the study shown that the quality of life score in the experimental
period after receiving zone therapy was statistically higher than the control period

83
(P<.001). So the study revealed that zone therapy can be used as a complementary
therapy to improve the quality of life.
The third objective was to compare the pre test and post test level of quality of life
among patients with hypertension in experimental group.
On analysis of the experimental group it showed a mean value of 42.76 with the
standard deviation of 3.28 in the pre test and a mean value of 87 with the standard
deviation of 4.42 in the post test. The mean difference was 44.23. The calculated “t”
value was 44.02 at P< 0.05 level. This shows improvement in quality of life.
Hence the stated hypothesis “The mean post test level of quality of life in
experimental group will be significantly higher than their mean pre test level of quality of
life” was accepted.
The above result was supported by a study conducted by Mohammed nizam et al
(2006) to find out the effectiveness of foot reflexology on hypertensive patients in Korea.
The foot reflexology was applied to the experimental group 3 times a week for 4 weeks
30 minutes each. For the data analysis conducted to verify the quality of life. After foot
reflexology, the subjects in experimental group show significant improvement in quality
of life. The results suggest that the foot reflexology is effective in improving the quality
of life.
The fourth objective was to associate the post test level of quality of life among
patients with hypertension in experimental group and control group with their
selected demographic variables.

84
The chi square test findings showed that there was a significant association
between the post test level of quality of life among hypertensive patients in experimental
group with their selected demographic variables age, education, monthly income, dietary
habits, following DASH, and mode of treatment and there was no significant association
between the post test level of quality of life among hypertensive patients in experimental
group with their selected demographic variables sex, religion, occupation, marital status,
type of family, number of children, and duration of illness.
Hence the stated hypothesis “There will be a significant association between the
post test level of quality of life among patients with hypertension in experimental and
control group with their selected demographic variables” was accepted for the variables
age, education, monthly income, dietary habits, following DASH, and mode of treatment
and rejected for the variables sex, religion, occupation, marital status, type of family,
number of children, and duration of illness.
The above result was supported by a study conducted by Nessrin & Maxwel
Heinrich (2001) to assess the effect of foot reflexology on quality of life of hypertensive
patients in Ohio territory hospital. The samples consisted of 143 inpatients (age, sex,
occupation, duration of illness etc) and the tool included WHO quality of life
questionnaire. Researchers noted a significant association with the variables occupation,
duration of illness and marital status.

85
CHAPTER VI
SUMMARY, CONCLUSION, IMPLICATION,
LIMITATIONS AND RECOMMENDATIONS
This chapter deals with summary, findings, conclusion, implications, limitations
and recommendations, which creates a base for evidence based practice.
SUMMARY
High blood pressure termed “hypertension” is a condition that afflicts almost
1billion people worldwide and is a leading cause of morbidity and mortality. More than
20% of Americans are hypertensive, and one third of these Americans are not even aware
they are hypertensive. Therefore, this disease is sometimes called “silent killer”. The
disease is usually asymptomatic until the damaging effects of hypertension such as
stroke, myocardial infarction, renal dysfunction, visual problems etc are observed.
(Richard E.klabunde, 2007)
In general, quality of life (QOL) is the perceived quality of an individual's daily
life, that is, an assessment of their well-being or lack thereof. This includes
all emotional, social, and physical aspects of the individual's life. In health care, health-
related quality of life (HRQOL) is an assessment of how the individual's well-being may
be affected over time by a disease, disability, or disorder. (wikipedia.com )
The term quality of life (QOL) refers to the general well-being of individuals and
societies. The term is used in a wide range of contexts, including the fields

86
of international development, healthcare, and politics. Quality of life should not be
confused with the concept of standard of living, which is based primarily on income.
Instead, standard indicators of the quality of life include not only wealth and employment
but also the built environment, physical and mental health, education, recreation and
leisure time, and social belonging. (Pubmed.com )
Association of physicians of India conducted a survey and concluded urban areas
in the counts had a significantly higher incidence of hypertension 27-37% as compared to
rural areas 2-8%. In India about 20% of adults’ population suffers from hypertension
making if the country’s highest silent killer from this almost 90% of the cases fall into the
category of primary essential hypertension (Agarwal ,2001)
Three hundred and eighty five camps in rural areas in Tamilnadu and 7.35 lakhs
people were screened and found out that 5.02% of population was affected with
hypertension (Tamilnadu Government public and preventive medicine, 2003)
The quality of life of hypertensive patients is not good. There are many ways to
improve the quality of life of hypertensive patients. Among one is zone therapy.Zone
therapy is a well known complementary therapy which claims to help the body achieve
homeostasis. It is believed that pressing specific areas on the feet related to specific
glands or organs of the body can help these glands and organs to function at their peak,
allowing the body to heal itself. The principle difference between massage and touch and
zone therapy is that zone therapy provides not only the relaxation effect obtained from
massage or touch is said to also improve body’s immunity contributing to healing process
(Byers 2001; Dougans ,2002)
87
Zone therapy has been scientifically researched in many studies to explore the
claimed benefits. Some studies have supported its ability to reduce anxiety and pain.
There has been scientific evidence to support the claim that zone therapy can reduce
blood pressure and serum lipids, and can improve the quality of life in patients with
hypertension. (Hodgson 2000; Milligan et al 2002; Park & Cho 2004)
The Objectives of the study were:
To assess the pre test and post test level of quality of life among patients with
hypertension in experimental group and control group.
To find out the effectiveness of zone therapy on quality of life among patients
with hypertension in experimental group
To compare the pre test and post test level of quality of life among patients with
hypertension in experimental group.
To associate the post test level of quality of life among patients with hypertension
in experimental group and control group with their selected demographic
variables.
The Hypotheses formulated were:
H1: The mean post test level of quality of life in experimental group will be
significantly higher than the mean post test level of quality of life in control group.
H2: The mean post test level of quality of life in experimental group will be
significantly higher than their mean pre test level of quality of life.

88
H3: There will be a significant association between the post test level of quality of
life among patients with hypertension in experimental and control group with their
selected demographic variables.
The assumptions of the study were:
Hypertensive patients may not have adequate quality of life.
Zone therapy may improve the quality of life of hypertensive patients.
Quality of life may differ from individual to individual.
The review of literature collected for the study provided a strong basis for the
study. It provided the basis for creating conceptual frame work and formation of tool. It
was categorized under three headings.
Section A: Studies related to prevalence and risk factors of hypertension.
Section B: Studies related to zone therapy on hypertension.
Section C: Studies related to zone therapy on quality of life of hypertensive patients.
The conceptual frame work of this study was based on Modified Wiedenbach’s
Helping Art of Clinical Nursing Theory and it provided a complete frame work for
achieving the central purpose of the study. The research methodology adopted for the
study was quasi experimental pre-test and post-test with control group design.
The content validity of the tool was established on the basis of opinion given by
four nursing experts and one medical expert in the field of medical surgical nursing.

89
Pilot study was conducted in perumpattur village of Tirunelveli district. The pilot
study findings showed that there was a significant difference between the post test level
of quality of life of hypertensive patients in experimental group and control group at P <
0.05 level.
The village selected for data collection was puliampatti and perumpattur. In that
puliampatti was allotted for experimental group and perumpattur was allotted for control
group. The period of data collection was 30 days. Purposive sampling technique was used
to select samples for experimental group and control group. The Sample size for the
study was 60. Among 60 samples, 30 persons were in experimental group and another 30
persons were in control group. The collected data was analyzed and interpreted based on
the objectives using descriptive and inferential statistics.
The study findings revealed that there was a significant improvement in the
quality of life of hypertensive patients after application of zone therapy in the
experimental group.
There was a significant association between the post test level of quality of life
among hypertensive patients with their selected demographic variables age, education,
monthly income, dietary habits, following DASH, and mode of treatment and there was
no significant association between the post test level of quality of life among
hypertensive patients with their selected demographic variables sex, religion, occupation,
marital status, type of family, number of children, and duration of illness.

90
CONCLUSION
This study assessed the effectiveness of zone therapy on quality of life among
patients with hypertension. The study findings revealed that there was a significant
improvement in the quality of life of hypertensive patients after application of zone
therapy in the experimental group. On the basis of the study, the researcher concluded
that application of zone therapy to the hypertensive patients to improve the quality of
life. Zone therapy is an effective; easy and potentially risk free intervention.
IMPLICATIONS
Investigator has derived the following implications from the study that are of vital
concern in the field of nursing practice, nursing education, nursing administration and
nursing research.
NURSING PRACTICE
The nurses have a vital role in providing safe and effective nursing interventions
to enhance the quality of life of hypertensive patients.Zone therapy can be facilitated by motivating the nurses to have an in depth
knowledge regarding non pharmacological therapies to improve the quality of
life.Develop skill in providing efficient nursing interventions for improving the
quality of life and teach the patients about the effectiveness of zone therapy
quality of life. Nurses need to practice evidence based approach while giving care to the
hypertensive patients.
NURSING EDUCATION

91
Before nurses enter into their practice, they need to have strong foundation in
terms of education. Nurse educators not only have a role to educate the students but also
to educate the staff nurses in order to prepare them and update their knowledge, to
enhance the application of theory into practice. The education in the clinical area should
be provided in the form of:
Incorporate zone therapy in the curriculum of nursing with clinical experience.
Motivate the nursing students to follow zone therapy to improve the quality of life
of hypertensive patients.
Update the knowledge of student nurses with in-service education programs
emphasizing various measures to improve the quality of life of patients.
Make use of available studies related to zone therapy and its benefits.
NURSING ADMINISTRATION
Conduct in-service education programs and continuing education programs
related to zone therapy on improvement of quality of life of hypertensive patients.
Collaborate with governing bodies for the formulation of standard policies and
protocols regarding zone therapy to improve the quality of life of hypertensive
patients.
Provide more opportunities for nurses to attend training programs in zone therapy
on quality of life of hypertensive patients.
Update the knowledge of staff nurses with in-service education programs
emphasizing various measures to improve the quality of life of hypertensive
patients.

92
Arrange and conduct workshops, conferences, seminars on zone therapy on
improvement of quality of life of hypertensive patients.
NURSING RESEARCH
Nurse researcher can disseminate the findings of the studies through conference,
seminar and publishing in professional journals to the Medical Surgical nursing
staffs.
Nurse researcher can encourage conducting further researches related to zone
therapy intervention on other psychological parameters.
The findings of the research study would help in building and strengthening the
body of knowledge of zone therapy.
As a nurse researcher, promote more research on effectiveness of zone therapy on
other systemic illness.
Evidence based nursing practice must take higher profile in order to increase the
knowledge about zone therapy intervention for hypertensive patients.
LIMITATIONS
During the period of study the limitations faced by the investigator were as
follows,
Only limited literatures and studies were obtained from the Indian context.
Due to time constraints, the investigator was unable to take larger samples for the
study.
RECOMMENDATIONS
Based on the findings of the present study the following recommendations are
made,
93
A similar study can be conducted with large samples for better generalisation.
A study can be conducted to assess the level of knowledge and practice of nurses
with regard to zone therapy in improving the quality of life of hypertensive
patients.
A comparative study can be conducted by using zone therapy and aroma therapy
on improvement of quality of life of hypertensive patients.
The same study can be repeated to assess the effectiveness of zone therapy to
improve the quality of life of secondary hypertensive patients admitted in
hospitals.

Ministeringthene
ed
Cont
rol
Grou
p
Pret
est b
y us
ing
WHO
qua
lity
of li
fe q
ues
onna
irePo
ses
t by
usin
g W
HO q
ualit
y of
life
que
son
naire
No
inte
rven
on
Rea
sses
smen
t
Valid
ang
thene
ed
Poor
qua
lity
of li
fe
Good
qua
lity
of li
fe
Very
goo
d qu
ality
of l
ifeZo
ne th
erap
y ab
out 1
5min
utes
for b
oth
feet
for a
ltern
ave
day
s for
3 w
eeks
Iden
fica
onof
need
Demograph
icvaria
bles
Age
Sex
Relig
ion
Edu
caon
Occ
upa
onM
onth
ly in
com
e M
arita
l sta
tus
Type
of f
amily
Num
ber o
f ch
ildre
n Di
etar
y ha
bits
Dura
on o
f illn
ess
Follo
win
g DA
SHM
ode
of tr
eatm
ent
Expe
rimen
tal
Grou
p
N
ot in
clud
ed in
this
stud
y
Iden
tific
atio
n of
nee
d
Figu
re 1
:Mod
ified
Ern
estin
e W
iden
bach
Clin
ical
Nur
sing
Pra
ctic
e M
odel
(196
4)
Figu
re 1
: Mod
ified
Ern
estin
eW
iden
bach
Clin
ical
Nur
sing
Pra
ctic
e M
odel
(196
4)
Figu
re 1
: Mod
ified
Ern
estin
e W
iden
bach
Hel
ping
Art
of C
linic
al N
ursi
ng T
heor
y M
odel
(196
4)17

BIBLIOGRAPHY
BOOKS
1. Adrianne Dill Linton, (2007).Introduction to Medical Surgical Nursing.(5th edition).
New Delhi: Elsevier publications.
2. Aleamma, (1999).Cardiovascular Nursing.(2nd edition). New Delhi: B.I.Churchill
living Stone Private Ltd.
3. Basavanthappa, B.T. (2003).Medical Surgical Nursing.(1st edition).New Delhi: Jaypee
Brothers Medical Publications.
4. Brunner and Suddarth’s, (2011). Text book of Medical Surgical nursing.(12th edition).
New Delhi: Wolters Kluwer privateLtd.
5. Braunwald`s, (2008). A Text Book of Cardiovascular Medicine.(8th edition). New
Delhi: Elsevier Publication.
6. Churchill Livingstone, (2000).Text book of Medicine. (18th edition).London: British
Library Cataloging Publication.
7. Das, P.C. (2004). Text book of Medicine. (4th edition). Kolkata: Current book
International limited.
8. Davidson`s, (1999). Principles and Practice of Medicine.(18th edition). Philadelphia:
Harcourt Publications.
9. Dolores Saxton, F. (1998).Comprehensive Review of medicine.(15th edition).India:
Mosby Publications.
10. Jayakuruvilla, (2007). Essentials of Critical care Nursing. (1stedition). New Delhi:
Jaypee Brother’s Publication.
11. Joyce M. Black., Jane HokansonHawis., (2009).Medical surgical nursing.(8th
edition). New Delhi: Elsevier Publication.
12. Jones A. Dorothy, (1978). Medical Surgical Nursing.(1st edition). Mumbai: Gramhill
Publications.
13. Janice T. Chussil., Ellie Z. Franges., Marcia L. Geiger., (2001). Diseases.(3rd edition).
Philadelphia: Springhouse Corporation.
14. PolitDanise,(2011). Nursing Research.(9th edition). Philadelphia: J.B Lippincott
Company.
15. Sharon L Lewis, (2011). Medical Surgical Nursing.(7th edition). New Delhi: Elsevier
Publications.
16. Selwyn Taylor., G.D.,Chisolmn.,N.O. Higgins., (1984).Surgical Management. (1st
edition).London: William Heinemann Medical Books.
17. Linda S. WilliamsandTaula D. Hoppler., (2008).Understanding Medical Surgical
nursing.(1st edition). New Delhi: JaypeePublications.
18. Long C Barbara, (1993). Medical Surgical Nursing- A Nursing process approach.(3rd
edition). Chicago: Alison Milles Private ltd.
19. Park, K. (2007). Preventive and social medicine. Jabalpur:Banarsidars publications.
20. Peters, J. (2005). Evidence based Cardiology. (2nd edition). New Delhi:Lippincott
Williams & Wilkins Publications.
21. Phipps long woods, (2002). Medical Surgical Nursing.(7th edition). New Delhi: W.B
Saunders Company.
22. Phipps.J.Wilma, (1999). Medical Surgical Nursing Health & Illness Perspective.(7th
edition). Philadelphia: Mosby Publications.
23. Rick Daniels., Laura John Nosek., (2007). Contemporary Medical Surgical Nursing.
(1st edition). Haryana: Thomson publication.
24. Ross and Wilson, (2005). Anatomy and physiology in health and illness.(9th edition).
Philadelphia: Elsevier Publication.
25. Royle A Joan, (1998). Medical Surgical Nursing and Related Physiology. (4th
edition). London: W.B. Saunders Company.
26. Taylor carol, (1993). Fundamentals of Nursing.(2nd edition). Philadelphia:Lippincott
Company.
JOURNALS
27. Kearney PM., Whelton, M.(2004).Worldwide prevalence of hypertension Journal of
Hypertension.22 (1):11-19.
28. AnnetrinJytte Basler,(2011).The Journal of Alternative and Complementary Medicine
on hypertension. 17(5): 435-440
29. Anand PM, (2002). Non pharmacological management of essential hypertension. The
journal of Indian medical association, 24-26
30. Asokkar, (2003). Hypertension in the next millennium.Journal of Indian medical
association, 32-34
31.Agarwalk.k, (2001). Non pharmacological treatment of hypertension .Herald of
Health (61), 14-15
32. Dateyet.al, (2001). Zone therapy in management of hypertension. Angiology research
foundation (20), 325-330
33. GopalK.S, (2004). Effect of foot reflexology on blood pressure and pulse rate.Indian
journal of physiopharmacological therapy, 273-275

34. MohanV., Deepa M., (2007).Prevalence, awareness and control of hypertension in
Chennai representing Urban South India.Journal of Association of physician
India (55), 326-32.
35. Kannan L, (2009). An epidemiological study of hypertension. Sri
RamachandraJournal of Medicine 2(2), 1-5
36. Yadav S, (2008). Prevalence and risk factor of pre hypertension and
hypertension.Indian journal of medical research (128), 712-720
37. Karen Tu, (2008).Prevalence and incidence of hypertension.Canadian Medical
Association of Journal(11),178
38. IhabHajjar, (2006).Prevalence and incidence of hypertension.Annual Review of
Public Health (27), 465-490
39. SS. Reddy,GR.Prabhu., (2005).Prevalence and Risk Factors of Hypertension in
Tirupati.Indian journal of community medicine 30 (3), 84-86
40. Hennis A, (2002).Prevalence of hypertension.Journal of hypertension 20(12), 2363-
2369
41. SV.Joshi,(2000).Prevalence of hypertension in Mumbai.Indian journal of medical
science 54 (9), 380-383
42. Gupta R.,(2004). Trends in Hypertension Epidemiology India.Indian journal of
medical science18(2), 73-78
43. Kumar P, (1985). Hypertension and its effect.Indian heart journal 41 (5), 19 -20.
44. Ahn, Y., Lee, J., (2001).Prevalence, awareness, treatment and control of
hypertension.Journal of human hypertension. 19(9), 1523-1532

45. Ostchega Y, (2007). Trends in Hypertension.Journal of National Health and
Nutrition Examination Survey 55(7), 1056-1065.
46. Mahmood,(2011).Prevalence of Hypertension in India.National Journal of Medicine
2(1), 1-76
47. Mohamed faisallutfi, (2011).Effects of blood pressure.Khartoum medical journal
4(1), 548-553
48. Bost and wallis, (2006).Effectiveness of zone therapy.Australian journal of advanced
nursing 23(4), 1-6
WEBSITES
49. American Heart Association, (2008). High blood pressure. Retrieved from
http://www.americanheart.org
50. Indradevi, (2003). Benefits of reflexology, Retrieved from http://www.holistic.com
51. John W, (2004). Non pharmacological treatment of hypertension, Retrieved from
http://www.sciencedirect.com
52. Dana E.,King,(2006). High blood pressure.http//www.health.am/hypertension.
53. William,Bosu.,(2010). Epidemic ofhypertension http://www.biomedcentral.com
54. Richard N.,Fogaros, (2009). Complications of hypertension, Retrieved from
http://www.heartdisease.about.com/od/a/heartsymptoms.html
55. Parson s, (2006). Benefits of reflexology, Retrieved from http://www.livestrong.com
56. JC.Patel, (2000). Prevalence and incidence of hypertension
http://www.indianjmedsci.org
57. Paul, (2002). Refelexology and biofeedback in the management of hypertension,
Retrieved from http://www.NIH.com

APPENDIX – A
LETTER SEEKING AND GRANTING PERMISSION FORCONDUCTING THE STUDY
APPENDIX – B
LETTER SEEKING EXPERT’S OPINION FOR CONTENTVALIDITY
FromMrs.G.Jebakani princes,M.Sc (Nursing) II year,Sri.K.Ramachandran Naidu College of Nursing,Karivalam via, Sankarankovil.Thirunelveli District -627753.
To
Subject: Seeking Validation of tool and content validity.
Respected Sir/Madam,I am M.Sc Nursing IIyear student studying in Sri.K.Ramachandran Naidu College
of Nursing, Sankarankoil, under the Tamilnadu Dr.MGR Medical University working on
dissertation titled, “A study to assess the effectiveness of zone therapy on quality of
life among patients with hypertension in selected villages at Tirunelveli”. The
dissertation is to be submitted to the Tamilnadu Dr.MGR Medical University, as a partial
fulfillment for the requirement of M.Sc nursing degree.Hence I request you to kindly
evaluate the tool items and give your valuable opinion and suggestions for improvement
of the tool. I would be highly obliged and thankful to hear from you.
Thanking you in anticipation.
Yours sincerely,
(G.Jebakani Princes)Enclosures:1. Statement of the problem2. Research tool3. Scoring key 4. Self addressed envelop
APPENDIX – C
CONTENT VALIDITY CERTIFICATE

CONTENT VALIDITY CERTIFICATE

APPENDIX – D
LIST OF EXPERTS FOR CONTENT VALIDITY
MEDICAL EXPERT
1. Dr.T.K.SENTHIL KUMAR M.B.B.S., M.D.,
Medical Director,
Annamalai Hospital,
Railway feeder road,
Sankarankovil,Tirunelveli District.
NURSING EXPERTS
1. Prof. (Mrs).J.M.JerlinPriya M.Sc (N),
Principal
Annammal College of Nursing,
Kuzhithurai,K.K.Dist.
2. Mrs.C.Sheeba M.Sc (N),
Reader,
Christian College of Nursing,
Neyyoor,K.K.Dist-629802.
3. Prof. (Mrs).S.S.SharmilaJancy Rani M.Sc (N),
Professor,
Christian College of Nursing,
Neyyoor,K.K.Dist-629802.
4. Mrs.Tamilselvi M.Sc (N),
Reader,
Bishop College of Nursing,
Dharapuram,
Erode Dist-638656.

APPENDIX-E
CERTIFICATE OF FOOT ZONE THERAPY TRAINING

APPENDIX – F
CERTIFICATE OF ENGLISH EDITING
TO WHOMSOEVER IT MAY CONCERN
This is to certify that Mrs.G.JEBAKANI PRINCES II year M.Sc (Nursing), in
Sri.K.Ramachandran Naidu college of Nursing, Sankarankovil (Tk), Thirunelveli District
has done a dissertation studyon “A study to assess the effectiveness of zone therapy on
quality of life among patients with hypertension in selected villages at Tirunelveli” was
edited for English language appropriateness.
Signature

APPENDIX – G
CERTIFICATE OF INFORMED CONSENT
INFORMED CONSENT
Good Morning,
I, Mrs.G.Jebakani princes, M.sc Nursing II Year student of
Sri.K.Ramachandran Naidu College of Nursing, conducting a study“A study to assess
the effectiveness of zone therapyon quality of life of hypertensive patients in selected
villages at Tirunelveli”as a partial fulfillment of the requirement for the degree of M.Sc
Nursing under The Tamil Nadu Dr. M.G.R Medical University. Zone therapy was given
to the hypertensive patients 15 minutes a day on alternative days for 3 weeks.
I assure you that information obtained will be kept confidential. So, I request you
to kindly co operate with me and participate in this study by giving your frank and
voluntary consent.
Thank you.

APPENDIX – H
COPY OF THE TOOL FOR DATA COLLECTION
Section A: Demographic variables
1. Age
a. 35 – 45 years
b. 46 – 55 years
c. 56 – 65 years
d. 66 – 70 years
2. Sex
a. Male
b. Female
3. Religion
a. Hindu
b. Christian
c. Muslim
d. Others
4. Education
a. Illiterate
b. Primary education
c. Higher secondary education
d. Diploma or degree education
5. Occupation
a. Unemployed
b. coolie
c. Private employee
d. Government employee
e. Self employed
6. Monthly income
a. Below Rs.3000
b. Rs.3001 – Rs.6000

c. Rs.6001 – Rs.9000
d. Above Rs.9001
7. Marital status
a. Unmarried
b. Married
8. Type of family
a. Joint family
b. Nuclear family
9. Number of children
a. None
b. 1
c. 2
d. More than 2
10. Dietary habits
a. Vegetarian
b. Non-vegetarian
11. Duration of illness
a. 2 years
b. 3 years
c. 3 years
d. 5 years
12. Following DASH
a. Yes
b. No
13. Mode of treatment
a. Medication
b. Both Medication and Exercise

Section B: Modified WHO Quality of life questionnaire
S.No QUESTIONNAIRE
Not
A
t a
ll4
Mod
erat
e3
Very
Muc
h2 Ex
trem
ely
1
1.PHYSICAL ASPECTS:
Do you have any trouble in doing strenuous activity?2. Do you have any trouble in taking a long walk?3. Have you felt weak and tiredness often?4. Do you need to stay in bed during the day?5. Do you have any restrictions to take food as you like?
6.PHYSIOLOGICAL ASPECTS:
Have you lacked appetite?7. Did pain interfere with your daily activities?8. Have you had a trouble sleeping?9. Did you feel fatigue during physical activity?
10. Have you had disturbed in sexual activity?
11. Do you need help with eating, dressing, washing yourself?12. Do you have enough energy for everyday life?
13.
PSYCHOLOGICAL ASPECTS:
Did you feel tense and depressed about your health
condition?14. Have you had difficulty in concentrating on things like
reading a newspaper or watching television?15. Have you had difficulty in remembering things?
16.SOCIAL ASPECTS:
Has your physical condition interfered with your social
activities?17. Has your physical condition or medical treatment caused
your financial difficulties?18. How you can able to deal with a difficult situation?19. Do you have any restrictions in participating social
activities?20. How safe do you feel in daily life?21. Were you limited in pursuing your hobbies or other leisure
activities?

22. Have you enough money to meet your needs?
23. Has your physical condition interfered with your family
life?
S.No QUESTIONNAIRE
Extr
emel
y 4
Very
Muc
h3
Mod
erat
e2
Not
at a
ll1
24. Do you have enough support from your friends?
25. Satisfaction with your transport?
26. Satisfied with the conditions of your living place?
27. Satisfied with your personal relationship?
28.PHYSICAL ASPECTS:
Acceptance of your bodily appearance?29. Satisfaction with your health?30. Satisfaction with your capacity for work?
SCORING KEY
SCORE DESCRIPTION0- 60 Poor61-90 Good91-120 Very good
APPENDIX –I
STEPS OF INTERVENTION
Tell the patient to lie down in supine position in a relaxed manner. Start with a
warm up thereby preparing the feet for therapy. Start directly on the heart and lung area.
This area stretches from the diaphragm line to the base of the toes on both feet. Using a

technique called the thumb walk, work on this area thoroughly. This area helps
strengthen and regulate the heart.
Work over the diaphragm line running just below the ball of the foot using thumb
walk. This will help deepen and open breathing and bring more oxygen and ch'i or prana
to each cell.
Work on the reflex areas for chest. This area is located on top of both feet, in the
troughs between the toes. Starting in zone 1 (at the base of the big toe), work up toward
leg, about 2 inches up from the webbing. Continue working each zone, ending in zone 5
near the outside edge of foot using thumb walk.
Around the base of big toe (on the bottom of foot) is the reflex area for the thyroid
and parathyroid glands. These regulate the pulse rate and help with calcium absorption.
Work the reflex zone for the thyroid gland by thumb walk technique.
Now work on the spine reflexes. These are located on the inside edge of both feet
(zone 1), extending from the heel nearly to the top of the big toe, opposite the root of the
toenail. Work slowly up the foot and then all the way down using the thumb walk
technique.
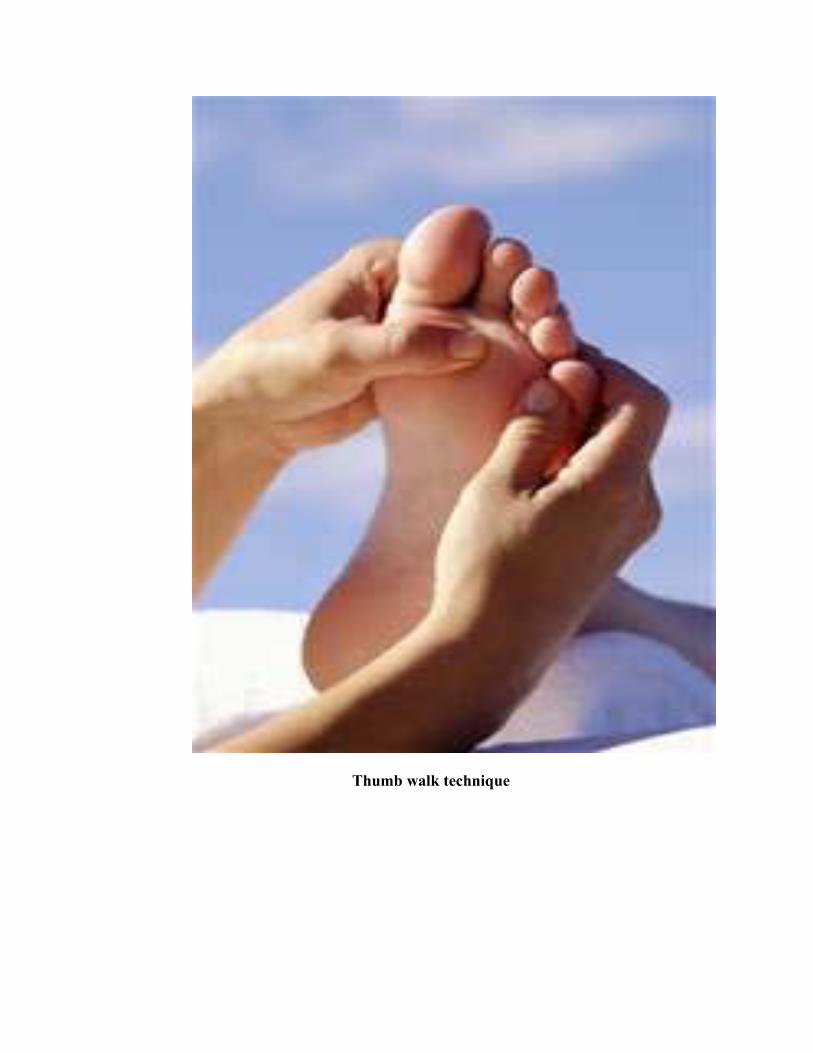
Thumb walk technique

Working on the spine reflexes nourishes the nervous system that feeds the entire
body. Now, work on the soft center of foot, from the diaphragm line down to the midline.
This will stimulate the liver, kidneys, adrenals, and other organs vital for
circulation and the regulation of water levels in the body. Thoroughly cover this area,
moving up, down, and/ or diagonally. Use the thumb walk technique. It was given 15
minutes a day on alternative days for 3 weeks.