effectiveness of reading and mathematics software products · effectiveness of reading and...
TRANSCRIPT

NCEE 2009-4042 U.S. DEPARTMENT OF EDUCATION
Executive Summary
Effectiveness of Reading and Mathematics Software Products Findings From Two Student Cohorts

Effectiveness of Reading and
Mathematics Software Products Findings From Two Student Cohorts
January 2009
Executive Summary
Larissa Campuzano Mark Dynarski Roberto Agodini Kristina Rall Mathematica Policy Research, Inc. Audrey Pendleton Project Officer Institute of Education Sciences
NCEE 2009-4042 U.S. DEPARTMENT OF EDUCATION

U.S. Department of Education Arne Duncan Secretary Institute of Education Sciences Sue Betka Acting Director National Center for Education Evaluation and Regional Assistance Phoebe Cottingham Commissioner February 2009 The report was prepared for the Institute of Education Sciences under Contract No. ED-01CO0039/0007. The project officer is Audrey Pendleton in the National Center for Education Evaluation and Regional Assistance. IES evaluation reports present objective information on the conditions of implementation and impacts of the programs being evaluated. IES evaluation reports do not include conclusions or recommendations or views with regard to actions policymakers or practitioners should take in light of the findings in the reports. This report is in the public domain. Authorization to reproduce it in whole or in part is granted. While permission to reprint this publication is not necessary, the citation should be: Campuzano, L., Dynarski, M., Agodini, R., and Rall, K. (2009). Effectiveness of Reading and Mathematics Software Products: Findings From Two Student Cohorts—Executive Summary (NCEE 2009-4042). Washington, DC: National Center for Education Evaluation and Regional Assistance, Institute of Education Sciences, U.S. Department of Education. To order copies of this report,
• Write to ED Pubs, Education Publications Center, U.S. Department of Education, P.O. Box 1398, Jessup, MD 20794-1398.
• Call in your request toll free to 1-877-4ED-Pubs. If 877 service is not yet available in your area, call 800-872-5327 (800-USA-LEARN). Those who use a telecommunications device for the deaf (TDD) or a teletypewriter (TTY) should call 800-437-0833.
• Fax your request to 301-470-1244. • Order online at www.edpubs.org.
This report also is available on the IES website at http://ies.ed.gov/ncee. Upon request, this report is available in alternate formats such as Braille, large print, audiotape, or computer diskette. For more information, please contact the Department’s Alternate Format Center at 202-260-9895 or 202-205-8113.

D i s c l o s u r e o f P o t e n t i a l C o n f l i c t s o f I n t e r e s t
he research team for this evaluation consists of a prime contractor, Mathematica Policy Research, and a major subcontractor, SRI International. Mathematica, its key staff, and its major subcontractor have no financial interests that could be affected by
findings from the study. None of the Technical Working Group members have financial interests that could be affected by findings from the study.
T

E x e c u t i v e S u m m a r y
E f f e c t i v e n e s s o f R e a d i n g a n d M a t h S o f t w a r e P r o d u c t s : F i n d i n g s f r o m
T w o S t u d e n t C o h o r t s
n the No Child Left Behind Act, Congress called for the U.S. Department of Education (ED) to conduct a rigorous study of the conditions and practices under which educational technology is effective in increasing student academic achievement. A 2003
design effort by ED working with educational technology and research experts recommended focusing the study on software products used to support reading and math instruction. The study team set up a competitive process and worked with ED to select reading products to be studied in the first and fourth grades, pre-algebra products in the sixth grade, and algebra I products in high school (or possibly in middle school). The team implemented an experimental design in which teachers in the same school were randomly assigned to use or not to use a software product, and the team collected test scores and other data to assess effectiveness of the software products.
I
A report was released in April 2007 presenting study findings for the 2004-2005 school year (Dynarski et al. 2007). The findings indicated that, after one school year, differences in student test scores were not statistically significant between classrooms that were randomly assigned to use products and those that were randomly assigned not to use products. School and teacher characteristics generally were not related to whether products were effective. The study also collected test scores and other data in the 2005-2006 school year, in which teachers who continued with the study had a new cohort of students and a year of experience using software products. Data from the second cohort enable the study to address the question of whether software products are more effective in raising test scores after teachers have a year of experience using them. The first-year report presented average effects of four groups of products on student test scores, which supported assessing whether products were effective in general. School districts and educators purchase individual products, however, and knowing whether individual products are effective is important for making decisions supported by evidence. This report presents findings on the effects of 10 products on student test scores.

xvi Study Design The second year of the study was shaped by the structure of its first year. For the first year, the study team identified 16 products for the study, as noted above, and recruited 33 school districts to implement the products. In turn, districts identified a total of 132 schools to implement the selected products, and the study randomly assigned 428 volunteering teachers in the schools to either use or not use the products in their classrooms. Students were allocated to classrooms by their schools in whatever manner schools conventionally used. Students were tested in these classrooms in both the fall and spring of the 2004-2005 school year (a total of 9,458 students). The study also observed classrooms at three points during the school year, and supplemented the test scores and observational data with data about students from school records, a questionnaire completed by teachers in the study, and school data from the Common Core of Data maintained by the National Center for Education Statistics (NCES). Collecting a second year of student data, while staying within resource constraints, required modifying the study in five ways compared to the first year. Products that had been implemented in only a few schools were dropped, classrooms were not observed in the second year, one treatment classroom and one control classroom were randomly sampled within schools that had more than one, some districts provided their test scores rather than having the study team test students, and some items were collected from school records. These changes in the data collection strategy reduced the amount of data collected in the 2005-2006 school year, and precluded the study from exploring the same range of questions it explored in the first year. The second year of the study included 10 products, 23 districts, 77 schools, 176 teachers, and 3,280 students.
The second-year study also should be understood as two different but related sub-studies. One objective of the second-year study is to assess whether the experience of a second year of use of software products increased the effects products had on student test scores. Another objective is to report on the effectiveness of individual software products in raising student test scores. Addressing the first objective requires restricting the sample to teachers who participated in both the first and second years of the study. Addressing the second objective requires data from teachers who participated in either the first or second year. Because the samples of teachers and students differ between the two substudies, estimates of sample characteristics and product effects also differ.
Collecting Achievement and Product Usage Data
The study’s analyses rely on data from student test scores. Scores came from two sources. The data collection strategy was to collect district scores to the extent they were available and were consistent with the study’s analytic approach, and for the study to administer its own tests if districts could not provide a fall or spring score (the study used the previous spring scores in place of fall scores if districts could provide them). In first, fourth, and sixth grades, if districts did not administer a standardized test with national norms in a grade level, the study administered a student test in the fall and spring of the 2005-2006 school year. It used the Stanford Achievement Test (version 9) reading battery for first graders, the Stanford Achievement Test (SAT-10) reading battery for fourth graders,
Executive Summary

xvii
and the Stanford Achievement Test (SAT-10) math battery for sixth graders. The study used the Educational Testing Services’ (ETS) End-of-Course Algebra Assessment (1997) for algebra I (which is not administered by districts in the study).
For district tests, in first grade one district provided scores on the Iowa Tests of Basic Skills for fall scores, and another district provided scores on the Stanford Achievement Test for spring scores. For fourth grade, one district provided scores on the Iowa Tests of Basic Skills as fall scores. For sixth grade, one district provided fall scores on the Iowa Tests of Basic Skills and another provided fall and spring scores on the New Mexico Standards Based Assessment. For algebra I, one district provided fall scores on the Iowa Tests of Basic Skills. With the exception of scores on the ETS algebra test, scores were converted to normal curve equivalent (NCE) units to standardize the measures across tests and cohorts. Algebra I scores for the ETS test are reported as percent correct.
Data from product records provided information about usage of the products. Eight of the 10 products included in the study used databases to track the time when each student was logged on. The usage measure reported in the study is actual student logged-on time for a school year, as reported by the product database. Usage by more than one student at a time, such as in a group activity, is counted only for the logged-on student. Time spent doing activities that are related to product use but occur when students are not logged on, such as reading materials related to a computer lesson, is not counted as usage.
Software Products
The products included in the second year are a subset of the products used in the first year. Some products that had been studied in the first year had been implemented in too few schools for individual effects to be reported on them in the second year. For two products that were just below the threshold needed for reasonable sample sizes, the study added districts and schools in the second year.
The second-year study included four reading software products for first grade, Destination Reading (Riverdeep 2008), the Waterford Early Reading Program (Pearson School 2008), Headsprout (Headsprout 2008), and Plato Focus (Plato Learning Corporation 2008). Three of the four products provided supplemental instruction and Plato Focus was used as the core reading curriculum. The second-year study also included two reading products for fourth grade, LeapTrack (LeapFrog Schoolhouse 2008) and Academy of Reading (Autoskill International 2008). These products supplemented the core reading curriculum with tutorials, practice, and assessment geared to specific reading skills.
For math, the second-year study included two math products for sixth grade, Larson Pre-Algebra (Houghton-Mifflin 2008) and Achieve Now (Plato Learning 2008). The products supplemented the core math curriculum with provided tutorial and practice opportunities and assessed student skills. The study included two algebra I products: Cognitive Tutor Algebra I (Carnegie Learning 2008) and Larson Algebra I (Houghton-Mifflin 2008). The Larson product supplemented algebra I instruction and the Cognitive Tutor product was the core algebra I curriculum. Students at a variety of high school grade levels can take algebra I, and many middle schools also teach algebra I. In the study, 9
Executive Summary

xviii percent of students were in eighth grade, 87 percent were in ninth grade, and 4 percent were in grades 10, 11, or 12.
First grade reading test: The version-9 reading battery of the Stanford Achievement Test (Pearson 1996a). Fourth grade reading test: The version-10 reading battery of the Stanford Achievement Test (Pearson 2003b). Sixth grade math test: The version-10 math battery of the Stanford Achievement Test (Pearson 2003c). Algebra test: The Educational Testing Service (ETS) End-of-Course Algebra Assessment (Educational Testing Service 1997).
Standardized Tests the Study Used to Measure Achievement Outcomes
The reading and math products supplemented the core curriculum or, as was the case for Cognitive Tutor, were the core curriculum. Products generally were for whole classes and were not implemented only to remediate skills for students who were lagging.
Findings from First Year of Study
The implementation analysis for the first-year study focused on how products were used in classrooms, their extent of usage, issues that resulted from their use, and how their use affected classroom activities. The analysis found that nearly all teachers received training on using products and believed the training prepared them adequately to use them. Technical difficulties using products mostly were minor. They included issues with students logging in, computers locking up, or hardware problems such as headphones not working. Most of the technical difficulties were easily corrected or worked around. When asked whether they would use the products again, 88 to 92 percent of teachers indicated that they would (the percentage depended on the grade level).
Comparing student test scores for treatment teachers using study products and control teachers not using study products is the study’s measure of product effectiveness. Effects on test scores were estimated using a statistical model that accounts for correlations of students within classrooms and classrooms within schools. Below we summarize the key first-year findings.
First-Year Effects of First Grade Technology Products
• Effects on Test Scores Were Not Statistically Different from Zero. Overall reading scores for students in treatment and control classrooms were 50.2 and 49.5,
Executive Summary

xix
respectively (in normal curve equivalent units).1 The difference was not statistically different from zero.
• Most School and Classroom Characteristics Were Uncorrelated with Effects. Classroom characteristics (teaching experience, teacher gender, teacher education level, whether there were problems getting access to the product, whether teachers had adequate time to prepare to use the product, whether the product was used in the classroom, and whether the teacher participated in technology professional development in the past year) were not correlated with product effects for the overall SAT-9 score. School characteristics (percentage of students eligible for free lunch, whether the school is in an urban area, percentage of students that were African American, percentage that were Hispanic) also were not correlated with product effects on the overall SAT-9 score. The one exception was the student-teacher ratio. Time of study product usage did not have a statistically significant correlation with effects for the overall score or subtest scores.
First-Year Effects of Fourth Grade Technology Products
• Differences in Test Scores Were Not Statistically Different from Zero. Overall reading scores for students in treatment and control classrooms were 42.1 and 41.7, respectively (in normal curve equivalent units). The difference was not statistically different from zero.
• Some Classroom and School Characteristics Were Correlated with Product Effects. For the overall score, a statistically significant correlation was found between product effects and product usage. For the word study skills score, statistically significant correlations were found between product effects and teaching experience, whether the product was used in the classroom, whether teachers had participated in technology professional development, and the percentage of students that were African American.
First-Year Effects of Sixth Grade Technology Products
• Effects on Test Scores Were Not Statistically Different from Zero. Overall math scores for students in treatment and control classrooms were 52.2 and 50.8, respectively (in normal curve equivalent units). The difference was not statistically different from zero.
• School and Classroom Characteristics Were Not Related to Product Effects. Time of product use and other school and classroom characteristics were uncorrelated with product effects.
1A normal curve equivalent (NCE) score converts the scaled test score into the range 1 to 99, with 50
being the average for the nationally normed sample. Unlike percentiles, NCE scores can be averaged, which makes them more appropriate for statistical analyses and estimation of product effects.
Executive Summary
xx First-Year Effects of Algebra I Technology Products
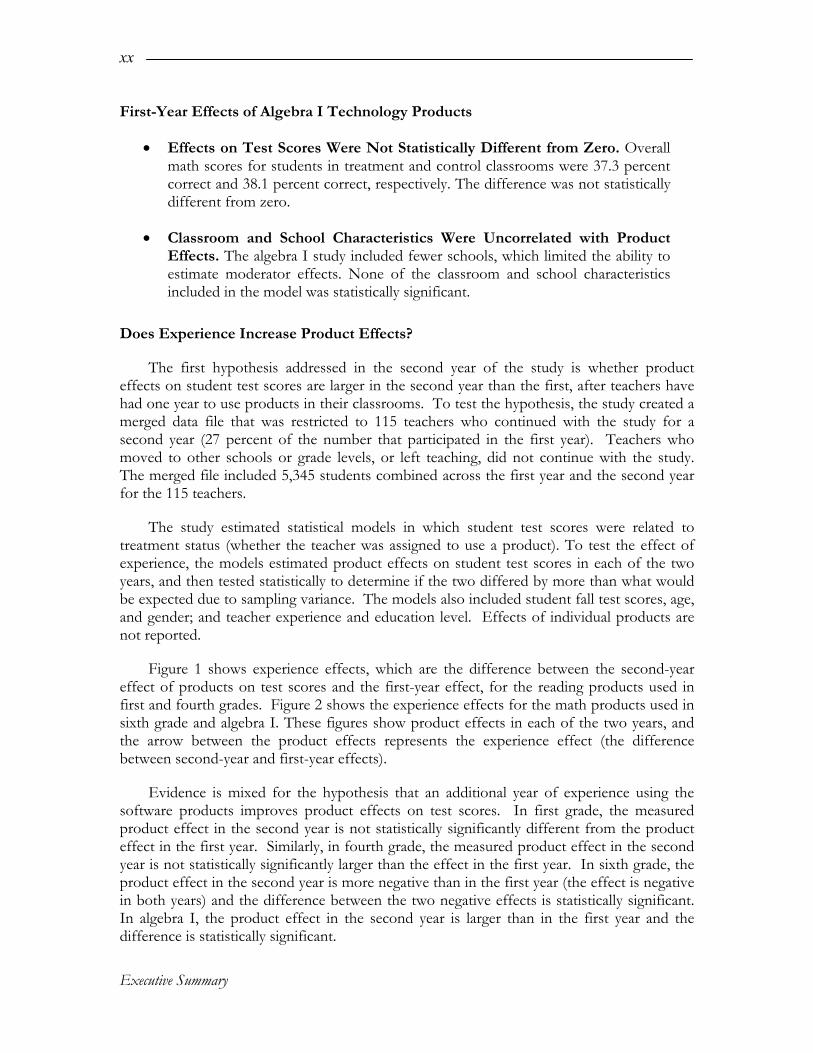
• Effects on Test Scores Were Not Statistically Different from Zero. Overall math scores for students in treatment and control classrooms were 37.3 percent correct and 38.1 percent correct, respectively. The difference was not statistically different from zero.
• Classroom and School Characteristics Were Uncorrelated with Product Effects. The algebra I study included fewer schools, which limited the ability to estimate moderator effects. None of the classroom and school characteristics included in the model was statistically significant.
Does Experience Increase Product Effects?
The first hypothesis addressed in the second year of the study is whether product effects on student test scores are larger in the second year than the first, after teachers have had one year to use products in their classrooms. To test the hypothesis, the study created a merged data file that was restricted to 115 teachers who continued with the study for a second year (27 percent of the number that participated in the first year). Teachers who moved to other schools or grade levels, or left teaching, did not continue with the study. The merged file included 5,345 students combined across the first year and the second year for the 115 teachers.
The study estimated statistical models in which student test scores were related to treatment status (whether the teacher was assigned to use a product). To test the effect of experience, the models estimated product effects on student test scores in each of the two years, and then tested statistically to determine if the two differed by more than what would be expected due to sampling variance. The models also included student fall test scores, age, and gender; and teacher experience and education level. Effects of individual products are not reported.
Figure 1 shows experience effects, which are the difference between the second-year effect of products on test scores and the first-year effect, for the reading products used in first and fourth grades. Figure 2 shows the experience effects for the math products used in sixth grade and algebra I. These figures show product effects in each of the two years, and the arrow between the product effects represents the experience effect (the difference between second-year and first-year effects).
Evidence is mixed for the hypothesis that an additional year of experience using the software products improves product effects on test scores. In first grade, the measured product effect in the second year is not statistically significantly different from the product effect in the first year. Similarly, in fourth grade, the measured product effect in the second year is not statistically significantly larger than the effect in the first year. In sixth grade, the product effect in the second year is more negative than in the first year (the effect is negative in both years) and the difference between the two negative effects is statistically significant. In algebra I, the product effect in the second year is larger than in the first year and the difference is statistically significant.
Executive Summary

xxi
Figure 1. Reading Product Effects Differences in the First and Second Years
Figure 2. Math Product Effects Differences in the First and Second Years
The study investigated the relationship between product usage and product effects in the two years. Usage data were gathered from product records and are accurate to the extent that student logged-in time represents product usage. (If students used other materials related to the product while not being logged on, the additional time is not reflected in the usage data.) Average first grade student usage went from 2,556 minutes in the first year to 1,182 minutes in the second year. Average fourth grade student usage went from 720 minutes in the first year to 936 minutes in the second year. Average sixth grade student usage went from 852 minutes in the first year to 678 minutes in the second year. Average algebra I student usage went from 1,308 minutes in the first year to 1,452 minutes in the second year. All differences between years were statistically significant. The relationship between changes in effects between the two years and changes in usage was not statistically significant.
Executive Summary

xxii
Executive Summary
Because the study did not observe classrooms or interview teachers in the second year, it has no information about how teachers may have modified their use of products from one year to the next beyond examining usage times that are captured by the products being studied. For the same reason, the study has no information about whether control group teachers modified their use of other software products in their classrooms.
Effects of Individual Products
Another objective of the study’s second year is to report effects of software products separately. As done in the analysis of experience effects, the study used statistical models to estimate product effects on student test scores that accounted for student fall test scores, age, and gender, and teacher experience and education. Data for all students, teachers, and schools who participated in the study either in the first or second year were used in the analysis. Models were estimated separately for each of the 10 products.
Figure 3 presents the results for six reading products, with the product effect displayed in the middle of its 95 percent confidence interval. The product effect in Figure 3 is the estimated difference in student test scores between classrooms using products and classrooms not using products in the two years of the study. For example, the effect shown for Destination Reading means that an average first grade student in a classroom that used Destination Reading is estimated to have a spring test score that is higher by 1.91 NCE units than if the student were in a classroom not using that product. This effect is equivalent to moving an average student from the 50th percentile on the test score to the 54th percentile. A positive and statistically significant effect was found for one of the six reading products (Leap Track, fourth grade). The remaining five product effects were not statistically significant. Of these, four were positive and one was negative.
Figure 4 presents analogous results for the four math products. None of the effects is statistically significant. Three of the estimated effects were negative and one was positive.
Presenting product effects on test scores in this way does not mean that the study results indicate that products with larger estimated effects are more desirable than products with smaller estimated effects. Characteristics of districts and schools that volunteered to implement the products differ, and these differences may relate to product effects in important ways. The findings do not adjust for differences in schools and districts that go beyond measured characteristics but may be related to outcomes.
Summary
The second year of the study examined whether an additional year of teaching experience using the software products increased the estimated effects of software products on student test scores. The evidence for this hypothesis is mixed. For reading, there were no statistically significant differences between the effects that products had on standardized student test scores in the first year and the second year. For sixth grade math, product effects on student test scores were statistically significantly lower (more negative) in the second year than in the first year, and for algebra I, effects on student test scores were statistically significantly higher in the second year than in the first year.

xxiii
Figure 3. Effects of Reading Software Products
Figure 4. Effects of Math Software Products
*
5.38
2.483.42 3.30
1.933.46
1.91
0.29 0.50 0.42 -0.16
1.97
-1.56 -1.90 -2.42 -2.46 -2.25
0.48
-8
-6
-4
-2
0
2
4
6
8
Effect onStudent
Test Scores(Normal
CurveEquivalent
Scores)
First Grade: Destination
Reading
First Grade: Headsprout
Early Reading
First Grade: PLATO Focus
First Grade: Waterford
Fourth Grade: Academy of
Reading
Fourth Grade: LeapTrack
*
Note: Vertical lines represent 95 percent confidence intervals.
*The effect is statistically significant at the 5 percent level.
Note: Vertical lines represent 95 percent confidence intervals.
Test ores are normal curve equivalent units for sixth grade and percent correct units for algebra. sc
2.42
5.60
2.111.06
-0.58
2.37
-0.10-1.28
-2.31-3.62
-8
0
2
4
6
8
Effect onStudent
Test Scores
Sixth Grade: PLATO/
Achieve Now
Sixth Grade: Larson Pre-Algebra I
Algebra I: Larson
Algebra I
Algebra I: Cognitive
Tutor
-3.58
-0.86
-6
-4
-2
Executive Summary

xxiv
The study also tested whether using any of the 10 software products increased student test scores. One product had a positive and statistically significant effect. Nine did not have statistically significant effects on test scores. Five of the insignificant effects were negative and four were positive.
The study’s findings should be interpreted in the context of its design and objectives. It examined a range of reading and math software products in a range of diverse school districts and schools. But it did not study many forms of educational technology and it did not include many types of software products. How much information the findings provide about the effectiveness of products that are not in the study is an open question. Products in the study also were implemented in a specific set of districts and schools, and other districts and schools may have different experiences with the products. The findings should be viewed as one element within a larger set of research studies that have explored the effectiveness of software products.
Executive Summary

R e f e r e n c e s
Autoskill International, Inc. Academy of Reading 3.2, copyright 2003. Product information accessed on November 24, 2008 at http://www.autoskill.com/products/reading/index.php.
Carnegie Learning Corporation, Cognitive Tutor Algebra I,
http://www.carnegielearning.com/software_features.cfm (accessed November 20, 2008).
Dynarski, M., R. Agodini, S. Heaviside, T. Novak, N. Carey, L. Campuzano. “Effectiveness
of Reading and Mathematics Software Products: Findings from the First Student Cohort.” Report to Congress. Publication NCEE 2007-4005. Washington, DC: U.S. Department of Education, March 2007.
Educational Testing Service. End-of-Course Algebra Assessment Administrator’s Manual.
Princeton, NJ: ETS, 1997. Headsprout. Headsprout Early Reading. Product information accessed on November 24, 2008
at http://www.headsprout.com. Houghton-Mifflin. Larson’s Pre-Algebra Version 2.1, copyright 2004. Product information
accessed on November 24, 2008 at http://www.larsonmath.com. Houghton-Mifflin. Larson’s Algebra1 Version 1.1, copyright 2004. Product information
accessed on November 24, 2008 at http://www.larsonmath.com. LeapFrog SchoolHouse, LeapTrack, Version 3, Product information accessed on November
24, 2008 at http://www.leapfrogschoolhouse.com. Pearson Education, Inc. Stanford Early School Achievement Test (SESAT), Level 2: Directions for
Administering (DFA). San Antonio, TX: Author, 1996a Pearson Education, Inc. Stanford Achievement Test, Tenth Edition (SAT-10), Intermediate 1:
Directions for Administering (DFA). San Antonio, TX: Author, 2003b.
xxvi
References
Pearson Education, Inc. Stanford Achievement Test, Tenth Edition (SAT-10), Intermediate 2: Directions for Administering (DFA). San Antonio, TX: Author, 2003c.
Pearson Education, Inc. Waterford Early Reading Program Version 3.x, copyright 2005. Product
information accessed on November 24, 2008 at http://www.pearondigital.com/waterford/.
PLATO Learning Corporation. PLATO Focus Reading and Language Program Version 1.3,
copyright 2003 Product information accessed on November 24, 2008 at http://www.plato.com/Products/PLATO-Focus-Reading-and-Language-Program.aspx.
PLATO Learning Corporation., PLATO Achieve Now Mathematics Series 3, Product
information accessed on November 24, 2008 at http://www.plato.com/Elementary-Solutions/Elementary-Mathematics/PLATO-Achieve-Now-Mathematics.aspx.
Riverdeep. Destination Reading Course 1. Product information accessed on November 24,
2008 at http://hmlt.hmco.com/DR-EL.php.