effectiveness and accountability report: · pdf fileeffectiveness and accountability report:...
TRANSCRIPT

1 | P a g e Updated April 2015
College of Education and Human Services
Effectiveness and Accountability Report: 2014 2009-2010, 2010-2011, 2011-2012, and 2012-2013
An Executive Summary
Megan Schramm-Possinger, Director of Assessment and Research
2009-2012 Data and Corresponding Text Provided by Claire Torres-Lugo
“Educating Professionals Who Impact the Lives of Children and Adults”

2 | P a g e Updated April 2015
Index
Section 1 COEHS Summary Data Florida Licensure Exam: 2009-2010, 2010-2011, 2011-2012, 2012-2013, & 2013-2014
Section 2 COEHS Pass Rates Florida Teacher Certification Exam (FTCE) by Subject Area
Exam: 2011-2012, 2012-2013, & 2013-2014 Section 3 University of North Florida’s State Report Card-Title II Report: Data with
State Comparisons
Section 4 COEHS Program Completers’ First Year Employment Data (2009-2010 thru
2011-2013) Section 5 Satisfaction Survey Results for all COEHS Teacher Education Programs
Completers (2012-2013) Section 6 Employers’ Satisfaction of Beginning Teachers Graduated from COEHS in 2009-
2010, 2010-2011, & 2012- 2013 Section 7 COEHS Average Entrance and Exit GPAs for Candidates and Completers of
Teacher Preparation Programs and Advanced Programs 2010-2011, 2011-2012, 2012-2013, & 2013-2014
Section 8 Graduation Rates for Students Admitted and Enrolled in COEHS Programs Section 9 Employment Retention Rates of COEHS Program Completers Section 10 P-12 Impact Data: Florida’s Value-Added Model (VAM) Scores
Introduction
The College of Education and Human Services is committed to the preparation of educators and administrators who will impact student learning and achievement. This report summarizes data used in important decision-making processes including program effectiveness, curricular changes, and the quality of UNF’s graduates while enrolled in COEHS teacher preparation programs and in the years following graduation. For questions about this report, contact Dr. Megan Schramm-Possinger, at [email protected] Sincerely, Marsha Lupi Interim Dean, College of Education and Human Services

3 | P a g e Updated April 2015
Section 1 COEHS Summary Data for the Florida Licensure Exam: 2009-2010, 2010-2011, 2011-2012, 2012-2013, & 2013-2014 Section 1 and Section 2 Overview: Candidates in UNF teacher education programs leading to initial certification are required to pass all sections of the Florida Teacher Certification Exam (FTCE) prior to graduation. Upon admission to a teacher education program in the College, candidates are required to demonstrate competency in the areas of Mathematics, Reading, Writing, and English Language Skills by submitting passing scores on all portions of the General Knowledge (GK) test. Prior to graduation, a program evaluation review is conducted to determine if a candidate has successfully completed all program requirements. These exit reviews include passing scores on the Professional Education (PED) and Subject Area Exams (SAE) of the FTCE. As shown in 1.1 and 1.2 below, UNF has had a 100% institutional pass rate for completers in all programs. Data are also disaggregated by program as shown in section 2.
1.1 Summary of Program Completers Initial Teacher Preparation Programs*
Year Program
Completers # Taking the Exam
# Passing the Exam
% Passing the Exam
2013-2014 278 278 278 100
2012-2013 304 304 302 100
2011-2012 265 265 265 100
2010-2011 337 337 337 100
2009-2010 332 332 332 100
Source: Florida Department of Education. *Art K-12, Biology 6-12, Chemistry 6-12, Elementary Education/ESOL K-6, English 6-12/ESOL, Exceptional Student Education ESOL K-12, Hearing Impaired K-12, Mathematics 6-12, MG Math/MG Science 5-9, Music K-12, PreK-Primary Education/ESOL, Physical Education K-12, Physics, Social Science 6-12, and the Educator Preparation Institute (EPI).
1.2 Summary of Program Completers for Other School Professional** Degrees (2009-2010, 2010-2011, 2011-2012, 2012-2013, & 2013-2014)
Year
Program Completers
# Taking the Exam
# Passing the Exam
% Passing the Exam
2013-2014 29 298 29 100
2012-2013 30 30 30 100
2011-2012 42 42 42 100
2010-2011 43 43 43 100
2009-2010 48 48 48 100
Source: Florida Department of Education. **Educational Leadership and Guidance and Counseling PK-12.

4 | P a g e Updated April 2015
Section 2 COEHS Pass Rates Florida Teacher Certification Exam (FTCE) per Subject Area Exam: 2013-2014
Initial Teacher Preparation
Programs-Title II
Name of Licensure Test
(Content)
# of Test
Takers
% Passing State
Licensure Test
Art K-12 Art K-12 2 100%
Biology 6-12 Biology 6-12
Chemistry 6-12 Chemistry 6-12
Elementary Education/ESOL K-6 Elementary Education K-6 121 100%
English 6-12/ESOL English 6-12 12 100%
Exceptional Student Education ESOLK-12
Exceptional Student Education K-12 (Bachelor and Master’s Level)
24 100%
Hearing Impaired K-12
Hearing Impaired K-12 (Master’s Level)
5 100%
Mathematics 6-12 Mathematics 6-12 5 100%
MG Math/MG Science 5-9 Middle Grades General Science 5-9
11 100%
Music K-12 Music K-12 3 100%
PreK-Primary Education/ESOL Age 3-Gr. 3
Prekindergarten/Primary PK-3 23 100%
Physical Education K-12 Physical Education 9 100%
Physics Physics 6-12
Social Science 6-12 Social Science 6-12 23 100%
Educator Preparation Institute Professional Education 40 100%
Subtotal Pass Rate for Initial Preparation Title II Programs
278 100%
Note: Data provided by the FDOE (Title II Report and Standard Reports). All candidates are required to pass the
Professional Education (PED) and the General Knowledge (GK) exams of the FTCE in order to be considered for graduation and a program completer.
Non-Title II Programs
Name of Licensure Test
(Content)
# of Test
Takers
% Passing State
Licensure Test
Educational Leadership Florida Educational Leadership Exam
16 100%
Guidance and Counseling PK-12 Guidance and Counseling PK-12 13 100%
Subtotal Pass Rate for Non-Title II Programs
29 100%
Total Unit Overall Pass Rate 307 100%
Note: Data provided by the FDOE (Title II and Standard Reports).

5 | P a g e Updated April 2015
Section 2 COEHS Pass Rates Florida Teacher Certification Exam (FTCE) per Subject Area Exam: 2012-2013
Initial Teacher Preparation
Programs-Title II
Name of Licensure Test
(Content)
# of Test
Takers
% Passing State
Licensure Test
Art K-12 Art K-12 3 100%
Biology 6-12 Biology 6-12 2 100%
Chemistry 6-12 Chemistry 6-12
Elementary Education/ESOL K-6 Elementary Education K-6 167 100%
English 6-12/ESOL English 6-12 13 100%
Exceptional Student Education ESOLK-12
Exceptional Student Education K-12 (Bachelor and Master’s Level)
20 100%
Hearing Impaired K-12
Hearing Impaired K-12 (Master’s Level)
10 100%
Mathematics 6-12 Mathematics 6-12 11 100%
MG Math/MG Science 5-9 Middle Grades General Science 5-9
9 100%
Music K-12 Music K-12 1 100%
PreK-Primary Education/ESOL Age 3-Gr. 3
Prekindergarten/Primary PK-3 10 100%
Physical Education K-12 Physical Education 10 100%
Physics Physics 6-12
Social Science 6-12 Social Science 6-12 13 100%
Educator Preparation Institute Professional Education 20 100%
Subtotal Pass Rate for Initial Preparation Title II Programs
289 100%
Note: Data provided by the FDOE (Title II Report and Standard Reports). All candidates are required to pass the
Professional Education (PED) and the General Knowledge (GK) exams of the FTCE in order to be considered for graduation and a program completer.
Non-Title II Programs
Name of Licensure Test
(Content)
# of Test
Takers
% Passing State
Licensure Test
Educational Leadership Florida Educational Leadership Exam
15 100%
Guidance and Counseling PK-12 Guidance and Counseling PK-12 15 100%
Subtotal Pass Rate for Non-Title II Programs
30 100%
Total Unit Overall Pass Rate 319 100%
Note: Data provided by the FDOE (Title II and Standard Reports).

6 | P a g e Updated April 2015
Section 2 COEHS Pass Rates Florida Teacher Certification Exam (FTCE) per Subject Area Exam: 2011-2012
Initial Teacher Preparation
Programs-Title II
Name of Licensure Test
(Content)
# of Test
Takers
% Passing State
Licensure Test
Art K-12 Art K-12 3 100%
Biology 6-12 Biology 6-12 1 100%
Chemistry 6-12 Chemistry 6-12
Elementary Education/ESOL K-6 Elementary Education K-6 148 100%
English 6-12/ESOL English 6-12 6 100%
Exceptional Student Education ESOLK-12
Exceptional Student Education K-12 (Bachelor and Master’s Level)
21 100%
Hearing Impaired K-12
Hearing Impaired K-12 4 100%
Mathematics 6-12 Mathematics 6-12 7 100%
MG Math/MG Science 5-9 Middle Grades General Science 5-9
5 100%
Music K-12 Music K-12 5 100%
PreK-Primary Education/ESOL Age 3-Gr. 3
Prekindergarten/Primary PK-3 21 100%
Physical Education K-12 Physical Education 11 100%
Physics Physics 6-12
Social Science 6-12 Social Science 6-12 15 100%
Educator Preparation Institute Professional Education 18 100%
Subtotal Pass Rate for Initial Preparation Title II Programs
265 100%
Note: Data provided by the FDOE (Title II Report and Standard Reports). All candidates are required to pass the
Professional Education (PED) and the General Knowledge (GK) exams of the FTCE in order to be considered for graduation and a program completer.
Non-Title II Programs
Name of Licensure Test
(Content)
# of Test
Takers
% Passing State
Licensure Test
Educational Leadership Florida Educational Leadership Exam
24 100%
Guidance and Counseling PK-12 Guidance and Counseling PK-12 18 100%
Subtotal Pass Rate for Non-Title II Programs
42 100%
Total Unit Overall Pass Rate 307 100%
Note: Data provided by the FDOE (Title II and Standard Reports).

7 | P a g e Updated April 2015
Section 3 University of North Florida’s State Report Card-Title II Report:
Data with State Comparisons
Section 3 Overview: In addition to collecting data for program completers as
summarized in Sections 1 and 2, the College collects data on passing FTCE scores for
students enrolled in courses other than the student internship or the final “capstone
course.” The data below summarizes passing rates for students in UNF’s teacher
preparation programs who took the test during the 2012-2013 year as “other enrolled.”
The results of the “other enrolled” students indicates that passing rates for these
students, who are not yet considered program completers, are close if not higher than
the Florida statewide average pass rate (see 3.1 below).
3.1 FLDOE Comprehensive Assessment Data for All Sections in the Florida Teacher Certification Exam (FTCE) for “Other Enrolled” Students 2012-2013
Number
Taking Test
Number
Passing Test
COEHS
Pass Rate
Statewide Average
Pass Rate
Basic Skills or General Knowledge Test (GK)
496
483
97.4%
97%
Professional Education Test
114
110
96.5%
93.8%
Subject Area Exams
85
77
90.6%
92.4%
FTCE (All Sections)
509
485
95.3%
92.9%
Note: “Other enrolled” students include the number of students enrolled in teacher preparation programs taking the FTCE prior to enrolling in an internship course or capstone course.

8 | P a g e Updated April 2015
Data quantifying the results of “other enrolled” students in the Educator Preparation
Institute (EPI), a state approved alternative certification route at UNF, indicate that the
passing rates of UNF’s EPI candidates are closely aligned with other Florida EPI
statewide passing rates (see 3.2 below). The Subject Area Exam was the strongest
area for the 2012-2013 cohort, with 96.7% passing rate exceeding the statewide
average pass rate of 91.1%.
3.2 FLDOE Comprehensive Assessment Data for All Sections in the Florida Teacher Certification Exam (FTCE) for “Other Enrolled” Students 2012-2013
Number
Taking Test
Number
Passing Test
COEHS
Pass Rate
Statewide Average
Pass Rate
Basic Skills or General Knowledge Test (GK)
72 68 94.4% 84.8%
Professional Education Test
81 76 93.8% 85.8%
Subject Area Exams 90 87 96.7% 91.1%
FTCE (All Sections) 107 96 89.7% 79.4%
Note: “Other enrolled” students include the number of students enrolled in Educator Preparation Institute (EPI) who took the FTCE prior to program completion.

9 | P a g e Updated April 2015
Section 4 COEHS First Year Employment Data (2009-2010 through 2013-2014) Section 4 Overview: Once a year, the state identifies program completers and
matches them to employers. These data are used as part of the College’s continuous
improvement efforts as evidenced in UNF’s Institutional Program Evaluation Plans
(IPEPs), institutional strategic plans, institutional reports, departmental program
reviews, and other uses as deemed appropriate. FDOE data indicates that in 2012-2014
58% of UNF’s completers from initial teacher certification programs, including Educator
Preparation graduates, were hired in a public school in the state of Florida. These data
exclude UNF program completers hired in private and/or out of state schools.
4.1 Initial Teacher Preparation Programs* and Educator Preparation Institute # of Program Completers
2012-2013 # of Program Completers
Hired in 2013-2014 (%) Program Completers
Hired in 2013-2014
319 186 58
# of Program Completers 2011-2012
# of Program Completers Hired in 2012-2013
(%) Program Completers Hired in 2012-2013
265 139 52
# of Program Completers 2010-2011
# of Program Completers Hired in 2011-2012
(%) Program Completers Hired in 2011-2012
337 135 40
# of Program Completers 2009-2010
# of Program Completers Hired in 2010-2011
(%) Program Completers Hired in 2010-2011
332 189 56 Source: Florida Department of Education Title II Data. *Art K-12, Biology 6-12, Chemistry 6-12, Elementary Education/ESOL K-6, English 6-12/ESOL, Exceptional Student Education ESOL K-12, Hearing Impaired K-12, Mathematics 6-12, MG Math/MG Science 5-9, Music K-12, PreK-Primary Education/ESOL, Physical Education K-12, Physics, Social Science 6-12, and the Educator Preparation Institute (EPI).
4.2 Other School Professional Degrees* # of Program Completers
2012-2013 # of Program Completers
Hired in 2013-2014 (%) Program Completers
Hired in 2013-2014 29 21 72
# of Program Completers 2011-2012
# of Program Completers Hired in 2012-2013
(%) Program Completers Hired in 2012-2013
69 62 89
# of Program Completers 2010-2011
# of Program Completers Hired in 2011-2012
(%) Program Completers Hired in 2011-2012
43 36 83
# of Program Completers 2009-2010
# of Program Completers Hired in 2010-2011
(%) Program Completers Hired in 2010-2011
48 37 77 Source: Florida Department of Education. *Educational Leadership and Guidance and Counseling PK-12. UNF’s
program completer employment data are provided yearly by the Florida Department of Education (FDOE).

10 | P a g e Updated April 2015
Section 5 Satisfaction Survey Results for all COEHS Teacher Education Program
Completers (2012-2013)
Section 5 Overview: The College tracks completers’ perceptions of their professional competency in the areas listed below. Those surveyed have been employed in public schools in the state of Florida from approximately September 2012 to April and/or May of 2013. Following is a summary of these data for 2012 graduates.
*Multiple modes exist, smallest ones shown. Scale: 1=Highly Effective, 2 = Effective, 3=Developing or Needs Improvement, 4=Unsatisfactory
Measures of Central Tendency N=33 Mean Median Mode Std.
Deviation
q3_rb Overall, how effective do you feel as a teacher? 2.00 2.00 2 .612
q4a_rb How effective was your teacher preparation program in
preparing you to do the following? Align instruction with state-
adopted standards at the appropriate level of rigor
1.64 2.00 2 .603
q4b_rb Sequence concepts and lessons linked to prior knowledge
to ensure coherence
1.67 2.00 2 .645
q4c_rb Design instruction for students to achieve mastery 1.76 2.00 2 .614
q4d_rb Select appropriate formative assessments to monitor
learning
1.88 2.00 2 .781
q4e_rb Use diagnostic student data to plan lessons 1.97 2.00 2 .770
q4f_rb Develop developmentally appropriate learning experiences
that require students to demonstrate a variety of applicable skills
and competencies
1.70 2.00 2 .684
q5a_rb Organize and manage the resources of time and space to
support student learning
1.76 2.00 2 .708
q5b_rb Manage individual and class behaviors through a well-
planned management system
1.94 2.00 2 .747
q5c_rb Convey high expectations to all students 1.55 2.00 1a .564
q5d_rb Respect students’ differing needs and diversity 1.52 1.00 1 .619
q5e_rb Model clear oral communication skills 1.67 2.00 2 .645
q5f_rb Model clear written communication skills 1.64 2.00 2 .603
q5g_rb Maintain a climate of openness, fairness and support 1.42 1.00 1 .561
q5h_rb Develop a climate that fosters inquiry 1.48 1.00 1 .566
q5i_rb Integrate appropriate and available information technologies
that foster student inquiry
1.67 2.00 1 .692
q5j_rb Integrate appropriate and available communication
technologies
1.73 2.00 2 .674
q5k_rb Adapt the learning environment to accommodate the
differing needs and diversity of students
1.70 2.00 2 .637
q5l_rb Utilize appropriate assistive technologies that enable
students to achieve their educational goals
1.88 2.00 2 .740
q6a_rb Deliver engaging and challenging lessons 1.72 2.00 2 .683
q6b_rb Teach literacy strategies across the curriculum through
explicit instruction
1.79 2.00 1 .781
q6c_rb Identify gaps in students’ subject matter knowledge 2.00 2.00 2 .791
q6d_rb Modify instruction to respond to student needs (e.g., gaps in
knowledge, preconceptions or misconceptions)
1.91 2.00 2 .723
q6e_rb Relate and integrate the subject matter with other
disciplines and/or life experiences
1.73 2.00 2 .626

11 | P a g e Updated April 2015
*Multiple modes exist, smallest ones shown. Scale: 1=Highly Effective, 2 = Effective, 3=Developing or Needs Improvement, 4=Unsatisfactory
q6f_rb Employ higher-order questioning techniques 1.76 2.00 1 .792
q6g_rb Teach for student understanding using varied and
appropriate strategies and resources
1.64 2.00 2 .549
q6h_rb Differentiate instruction based on an assessment of
differing needs and diversity of students
1.73 2.00 1a .719
q6i_rb Encourage and provide immediate and specific feedback to
promote student achievement
1.70 2.00 2 .637
q6j_rb Utilize student feedback to monitor and support instructional
needs and to adjust instruction
1.79 2.00 2 .650
q7a_rb Analyze and apply data from multiple assessments and
measures to diagnose students’ learning needs
2.12 2.00 2 .857
q7b_rb Analyze and apply data from multiple assessments and
measures to inform instruction based on those needs
2.06 2.00 2 .827
q7c_rb Analyze and apply data from multiple assessments and
measures to drive the learning process
2.09 2.00 2a .805
q7d_rb Design and align formative assessments that match
learning objectives
1.88 2.00 2 .696
q7e_rb Design and align summative assessments to determine
mastery of learning objectives
1.82 2.00 2 .727
q7f_rb Use a variety of assessment tools to monitor student
progress
1.76 2.00 2 .663
q7g_rb Modify assessments and testing conditions to
accommodate learning styles and varying skill levels
1.81 2.00 2 .693
q7h_rb Share the outcomes and implications of student
assessment data with the student and the student’s
parent/caregiver(s)
1.94 2.00 2 .788
q7i_rb Utilize technology to organize and integrate assessment
data
1.94 2.00 1 .827
q8a_rb Design professional goals based on students’ instructional
needs
1.70 2.00 1 .770
q8b_rb Use research to improve instruction and student
achievement
1.85 2.00 1 .795

12 | P a g e Updated April 2015
*Multiple modes exist, smallest ones shown. Scale: 1=Highly Effective, 2 = Effective, 3=Developing or Needs Improvement, 4=Unsatisfactory
q8c_rb Review data with colleagues to evaluate learning outcomes
and plan effective lessons
1.73 2.00 1 .801
q8d_rb Collaborate with stakeholders to support student learning 1.88 2.00 2 .781
q8e_rb Collaborate with stakeholders to support continuous
professional growth
1.88 2.00 2 .781
q8f_rb Engage in professional growth opportunities 1.58 2.00 1 .614
q8g_rb Engage in ongoing reflective practice 1.45 1.00 1 .617
q8h_rb Accept constructive feedback 1.45 1.00 1 .564
q8i_rb Apply knowledge and skills learned in professional
development in the teaching and learning process
1.44 1.00 1 .564
q9a_rb Apply the Code of Ethics and Principles of Professional
Conduct to professional and personal situations
1.33 1.00 1 .540
q9b_rb Apply knowledge of rights, legal responsibilities, and
procedures for reporting incidences of abuse or neglect
1.38 1.00 1 .554
q9c_rb Apply policies and procedures for the appropriate use of
technology in the classroom
1.36 1.00 1 .549
q9d_rb Apply policies and procedures for the ethical use of
technology in the classroom
1.36 1.00 1 .549
q9e_rb Appropriately use and maintain student information and
records
1.48 1.00 1 .667

13 | P a g e Updated April 2015
0.00 0.50 1.00 1.50 2.00 2.50
1
2
3
4
5
6
7
8
9
10
11
12
13
14
15
16
17
18
19
20
21
22
23
24
25
26
27
28
29
30
31
32
33
34
35
36
37
38
39
40
41
42
43
44
45
46
47
48
49
50
51
52
Corre
spon
ding Q
uesti
on
Mean
Median
Mode
Measures of Central Tendency for Each of the Questions Above, Scale from 1-4,
One being Highly Effective and Four Unsatisfactory

14 | P a g e Updated April 2015
0
10
20
30
40
50
60
70
(2012-13) Percentage of Completers Who Believe They Are...
Highlyeffective
Effective
Developing
NeedsImprovement
How well did your teacher ed. program prepare you to...?

15 | P a g e Updated April 2015
0
10
20
30
40
50
60
70
Percentage of Completers Who Feel Prepared to...
Highlyeffective
Effective
Developing
NeedsImprovement
Unsatisfactory

16 | P a g e Updated April 2015
0
10
20
30
40
50
60
Percentage of Completers Who Feel Prepared To...
Highly effective
Effective
Developing
Needs Improvement

17 | P a g e Updated April 2015
0
5
10
15
20
25
30
35
40
45
50
Percentage of Completers Who Feel Prepared To...
Highlyeffective
Effective
Developing
NeedsImprovement

18 | P a g e Updated April 2015

19 | P a g e Updated April 2015
0
10
20
30
40
50
60
Percentage of Completers Who Feel Able To...
Highlyeffective
Effective
Developing
NeedsImprovement
Unsatisfactory

20 | P a g e Updated April 2015
As evidenced above, graduates’ self-reported effectiveness in designing inquiry-based
lessons, establishing high expectations of all learners, and maintaining a climate of
openness, fairness and support, illustrates the constellation of core competencies pre-
service teachers at UNF have cultivated. This was mirrored by an open-ended response
0
10
20
30
40
50
60
70
Percentage of Completers Who Feel Prepared To...
Highlyeffective
Effective
Developing
NeedsImprovement
Unsatisfactory

21 | P a g e Updated April 2015
provided by one completer, which said, “Overall I feel like my teacher preparation
program was highly effective in preparing me for my first year of teaching.”
In 2012-2013, the lowest ranked items pertained to completers’ perceived ability to
“Utilize appropriate assistive technologies that enable students to achieve their
educational goals”; “Analyze and apply data from multiple assessments and measures
to diagnose students’ learning needs”; and, “Utilize technology to organize and integrate
assessment data.” Completers’ self-reported ability to analyze student data and use this
information to diagnose their students’ learning needs was not highly ranked among the
2009-2010 cohorts either. These findings, which will be used by UNF faculty to guide
course planning and curricular development, are nonetheless, not surprising as these
skills take time to cultivate and are, to some degree, context-specific – e.g., the
assessment data school’s use depends upon the pedagogical tools they use.

22 | P a g e Updated April 2015
Section 6 Employers’ Satisfaction of Beginning Teachers Graduated from COEHS in 2009-2010 and 2010-2011
Section 6 Overview: Sixty completers from either the Educational Leadership or Guidance Programs and 150 completers from the Teacher Preparation Program were evaluated by school staff in 2011-2012. Of the 210 total completers evaluated, 86% were deemed to be highly effective or effective in their professional roles. Ten percent were not evaluated, and only four percent were deemed “in need of improvement” by their superiors.
0 10 20 30 40 50 60 70 80
The admin or teacher was deemed highlyeffective in his or her professional role
The admin or teacher was deemed effectivein his or her professional role
The instructional staff member - in firstthree years of employment - needs
improvement
The instructional staff member or schooladministrator was not evaluated.
2011-2012 Completers, Evaluated by School Leaders (N= 210; 60 Completers: Educational Leadership Program or Guidance Programs;
150 Completers: Teacher Preparation Program at UNF

23 | P a g e Updated April 2015
In previous years, the state’s employment database enabled us to garner detailed feedback from candidates and employers. Following is a summary of data for employers of COEHS program completers in the 2009-2010 and 2010-2011 programs.
Employers’ Satisfaction with COEHS Program Completers
2009-2010 2010-2011
To what degree do UNF beginning teachers compare to other beginning teachers in their ability to:
n
M
SD
n
M
SD
1. . . .use assessment strategies (traditional
and alternative) to assist the continuous development of learners.
126
3.7
.86
76 3.7 .75
2. . . .use effective communication
techniques with students and all other stakeholders.
126 3.8 .84 76 3.7 .74
3. . . .engage in continuous improvement
for self and school. 126 3.9 .80 76 3.7 .75
4. . . .use appropriate techniques and
strategies to promote and enhance critical, creative, and evaluative thinking capabilities of students.
126 3.8 .88 76 3.8 .86
5. . . .use teaching and learning strategies
that reflect students’ culture, learning styles, special needs, and socioeconomic backgrounds.
126 3.8 .88 76 3.8 .79
6. . . .adhere to the code of ethics and
principles of professional conduct of the education profession in Florida.
126 4.0 .87 76 3.9 .87
7. . . .use an understanding of learning and
human development to provide a positive learning environment which supports the intellectual, personal, and social development of all students.
126 3.9 .89 76 3.9 .78
8. . . .demonstrate knowledge and
understanding of subject matter. 126 3.9 .89 76 3.9 .80
9. … create and maintain positive learning
environments in which students are actively engaged in learning, social interaction, cooperative learning and self-motivation.
126 4.0 .89 76 4.0 .83
10. … plan, implement, and evaluate effective instruction in a variety of learning environments.
126 3.9 .85 76 3.9 .89
11. . . .work with various education
professionals, parents, and other stakeholders in the continuous improvement of the educational experiences of students.
126 3.9 .86 76 3.7 .81

24 | P a g e Updated April 2015
12. . . .use and integrate appropriate
technology in teaching and learning processes.
126
3.8
.91
76
3.7
.86
13. . . .write and speak in a logical and
understandable style with appropriate grammar.
126 3.9 .84 76 4.0 .77
14. . . .recognize signs of students’ difficulty
with reading and computational processes.
126 3.7 .86 76 3.7 .83
15. . . .apply appropriate measures to
improve students’ reading and computational processes.
126 3.7 .89 76 3.8 .87
16. . . .demonstrate knowledge and
understanding of the Sunshine State Standards.
126 3.8 .89 76 3.8 .83
17. . . .maintain an orderly and disciplined classroom conducive to student learning.
126 3.9 .90 76 3.8 .89
18. ….use performance data to facilitate and impact student learning.
126 3.8 .92 76 3.8 .81
19. Overall, how satisfied are you with UNF’s first-year teachers’ performance as compared to other beginning teachers in your school?
126 4.1 .72 76 4.1 .88
Note: All ratings were on a five-point scale. 1: Much Weaker; 2: Weaker; 3: About the Same; 4: Stronger; 5:
Much Stronger (Reported by Claire Torres-Lugo)
.
Employers’ perceptions of satisfaction with UNF’s first year teachers’ performance when compared with other first year beginning teachers were rated in a positive way, 4.1 on a 5 point scale for both the 2009-2010 and 2010-2011 academic years (see item 19). Data from employers from 2009-2010 and 2010-2011 showed that the strongest area for the COEHS graduates was their “ability to create and maintain positive learning environments in which students are actively engaged in learning, social interaction, cooperative learning and self-motivation” (item 9) and “ethics and principles of professional conduct” (see item 7). In 2009-2010, three items were perceived to be in need of improvement based on a 5-point scale. These items were item, or the “use of assessment strategies to assist in the continuous development of learners”, item 14, teachers’ ability to “recognize signs of students’ difficulty with reading and computational processes,” and item 15 the application of “appropriate measures to improve students’ reading and computational processes.” In 2010-2011, the lowest ranked items using a 5-point scale were item 1 or “use of assessment strategies to assist in the continuous development of learners”, item 2 or the “use of effective communication techniques”, item 3 “continuous improvement”, item 11 “collaboration with education professionals, parents, and other stakeholders”, item item 12 the ability to “use and integrate appropriate technology in teaching and learning processes,” and item 14 or their ability to recognize signs of student difficulty with reading and computational processes.”

Section 7 COEHS Average GPA for Completers of Teacher Preparation Programs and Advanced Programs 2010-2011, 2011-2012, 2012-2013, and 2013-2014
Section 7 Overview: All applicants seeking admission to the College’s initial teacher
certification programs, at the undergraduate and graduate levels, must first be admitted to
the institution in accordance with the University of North Florida’s established admission
requirements and policies.
Once admitted to UNF, applicants interested in initial teacher preparation or other
school professional programs in the Unit must meet the state’s minimum GPA criteria for
admissions. Criteria for admissions are governed by Florida’s Board of Education (BOE)
rule and statute, 6A-5.066 and F.S. 1004.04(4)(b)(1)(2), respectively. The aforementioned
state statute and rule not only determine minimum admission criteria for applicants but also
specify processes and procedures to maintain continued program approval across all
institutions with initial teacher preparation programs in the State of Florida. The minimum
state required GPA for admission to and exit from teacher preparation programs in the
College is 2.5. Data for two academic years indicate that the average entry and exit GPAs
for completers of COEHS teacher education and advanced programs exceeded the
minimum set by the state.
COEHS Entry and Exit Average GPA for of Teacher Education Programs and Candidates and
Other School Professional Programs*
Academic Year Average Entry GPA Average Exit GPA
2013-2014 3.25 3.61
2012-2013
3.10 3.64
2011-2012
3.25
3.58
2010-2011
3.22
3.61
Source: Teacher Education File managed by the Office of Institutional Research at UNF. The following programs were
included in the calculations: Art K-12, Biology 6-12, Chemistry 6-12, Elementary Education K-6, English 6-12/ESOL, Exceptional Student Education ESOL K-12, Hearing Impaired K-12, Mathematics 6-12, MG Math/MG Science 5-9, Music K-12, PreK-Primary Education/ESOL, Physical Education K-12, Physics, Social Science 6-12, and the Educator Preparation Institute (EPI), School Leadership and Guidance and Counseling K-12.

26 | P a g e
Updated April 2015
Section 8 Graduation Rates for Students Admitted and Enrolled in COEHS Programs Section 8 Overview: This section summarizes the graduation rate of COEHS admits during the 2009-2010 academic year. One important consideration when analyzing this table is to recognize the significant differences between the cohort sizes of the various programs of study. Of most significance is the Elementary Education program which was comprised of a cohort of 121. Approximately 92 of the 121 (76%) students originally identified as Elementary Education majors graduated from the College but not necessarily from the same major or track they started with, in this case Elementary Education. 83 of 121 (69%) graduated from the original major and track. 102 of 240 graduated from the University but not necessarily from the same college, major or track they started with, in this case, Elementary Education.
Section 8 COEHS Graduation for a Cohort of Admits and Enrolled in the 2009-2010
DOE CODE
Program by Major and Track Deg. Level
Cohort Size n
Grad. At Univ. Level(*)
R Grad. At Coll. Level(**)
R Grad. At Major Level (***)
R Grad. At Track Level (****)
R
114 Art Education: Art Education K-12
B 3 33% 67% 33% 33 % 33% 33% 33% 33%
285 Educational Leadership: School Leadership M 54 76% 86% 76% 85 % 76% 85% 76% 85%
287 Math Education: Math 6-12 B 11 36% 55% 27% 45% 9% 18% 9% 18%
288 Science Education: Biology 6-12 B 3 0% 67% 0% 100% 0% 100% 0% 100%
289 Science Education: Chemistry 6-12 B 15 87% 87% 73% 73% 73% 73% 73% 73%
297 Special Education: Deaf Education+
M 6 67% 67% 67% 67% 67% 67% 67% 67%
304 Counselor Education: School Counseling M 17 82% 82% 82% 82% 76% 88% 76% 88%
365
Middle School Education: Math and Science 5-9
B 1 0% 100% 0% 100% 0% 100% 0% 100%
387 PreK-Primary Education B 18 94% 94% 89% 89% 83% 83% 83% 83%
398 English Education: English 6-12 B 8 63% 75% 13% 25% 13% 25% 13% 25%
424 Physical Education: Physical Education K-12
B 7 86% 100 % 57% 71% 14% 14% 14% 14%
430 Special Education: ESE B 17 76% 100% 76% 100% 65% 82% 59% 76%
430 Special Education: ESE M 1 0% 100% 0% 100% 0% 100% 0% 100%
444 Elementary Education: Elementary Education K-6
B 121 84% 88% 76% 79% 69% 71% 69% 71%
Source: Office of Institutional Research and Assessment. Graduation is based on the number of students in year 1 that were retained and graduated in year 4. The “R” to the right of each column represents the retention rates for each of the 4 categories (i.e., the University Level, the College Level, the Major Level and the Track Level). (*) University Level: COEHS students that graduated from UNF but not necessarily from the same college, major or track they started with. (**) College Level: Students graduated from COEHS but not necessarily from the same major or track they started with. (***) Major Level: Students graduated from COEHS but not necessarily from the same track they started with. (****)Track Level: Students retained in COEHS and in the same major and track they started with. + This is a 5 year program.
- - Current data reflects students retained and graduated in year 4 of their program of study. Students taking longer than 4 years to complete their program of study are not accounted for in this table.
- -

27 | P a g e
Updated April 2015
Section 9 Employment Retention Rates of COEHS Program Completers
Section 9 Overview: Based upon FLDOE employment data, the graphs below
depict the number of completers in the 2006-2007, 2007-2008, 2008-2009,
2009-2010, and 2011-2012 cohorts who have been continuously employed at
a public school in the state of Florida, -- with no break in service -- as of 2012.
Graduates hired as substitute teachers, paraprofessionals, school
administrators, administrative-level curriculum developers, and district office
employees were not included in the data presented below.
The first set of graphs indicate the number of completers from each cohort
group who were employed prior to their graduation, the year of their
graduation, or sometime thereafter. Also examined was the same information
disaggregated by discipline, so that trends regarding employment by major,
and at specific times, could be identified.

28 | P a g e
Updated April 2015
Section 9.1
0%
10%
20%
30%
40%
50%
60%
70%
7% of completers hiredbetween 1992 and 2005
were continuouslyemployed in 2012-2013
13% of completershired in 2006 were
continuously employedin 2012-2013
61% of completers hiredin 2007 were
continuously employedin 2012-2013
19% of completers hiredbetween the years
2009-2012 werecontinuously employed
in 2012-2013
2006-2007 Graduates Still Employed in 2012-2013
percent of graduates employed from a total of 168
These data indicate that the majority of completers in the 2006-2007 cohort groups were employed in 2007. Completers from this cohort group employed between 1992 and 2005 were largely guidance counselors (N=10), with a smaller number from Exceptional Student Education (ESE) (N=2). The largest numbers of completers in 2006 were those who studied Elementary Education K-6/ESOL Endorsement (N = 17), and the same trend continued in 2007 (N =64). Pre-kindergarten certified teachers (N=14) followed by those who studied Exceptional Student Education K/12 ESOL represent the largest number of teachers hired and in the field. Little variation between disciplines was evident among those hired from this cohort group in 2008, with teachers from one discipline in the field more than others: Elementary Education K-6/ESOL.

29 | P a g e
Updated April 2015
Section 9.2
0%
5%
10%
15%
20%
25%
30%
35%
40%
45%
50%
17% ofcompleters
hired between1980 and 2006
are stillemployed in2011-2012
6% ofcompleters
hired in 2007are still
employed in2011-2012
47% ofcompleters
hired in 2008are still
employed in2011-2012
31% ofcompleters
hired betweenthe years 2009-
2012 are stillemployed in2011-2012
Completer Retention Rates 2007-2008
Number of Completers in2007-2008 from a Total of198
The same trends emerged among those who graduated in 2007-2008, however, the largest number of completers hired between 1980 and 2006 (for this cohort group) were in Elementary Education (N = 16) and Prekindergarten Primary Education (N =6). A somewhat higher proportion of students in the guidance program – from this cohort group -- were hired after their graduation (N=6), and the pattern of students in the guidance program being employed either years before or years after their graduation was a consistent trend among all cohort groups whose data were available. The largest number of completers hired in 2007, 2008, and 2009-2012 were Elementary Education majors, Pre-kindergarten majors, and interestingly (in 2008), Exceptional Student Education K-12 ESOL majors. This is not surprising among Elementary Education and Pre-kindergarten majors, as UNF graduates the highest numbers of students from both of these programs with in the College of Education and Human Services.

30 | P a g e
Updated April 2015
Section 9.3
8%
4%
49%
16%
24%
8% ofcompleters
hired between1991 and 2007
werecontinuouslyemployed in2012-2013
4% ofcompleters
hired in 2008were
continuouslyemployed in2012-2013
49% ofcompleters
hired in 2009were
continuouslyemployed in2012-2013
16% ofcompletes hired
in 2010 werecontinuouslyemployed in2012-2013
24% ofcompleters
hired between2011-2012 were
continuouslyemployed in2012-2013
Completer Retention Rates, 2008-2009
A total of 185 completers graduated in 2008-2009
Much like data from the 2006-2007 cohort group, the largest number of completers hired prior to their graduation were those in Guidance and Counseling (N=5), and the second largest number hired after their graduation in 2010 were from the same discipline (N=7). In addition, the number of students in Social Science (N=4) hired in 2010 was equivalent to the number of students in Prekindergarten Primary Education (N=4) hired the same year. The same was true among this cohort in 2012, with 3 students from the Prekindergarten Program and 3 students in the Social Science Program 6-12, hired that year.

31 | P a g e
Updated April 2015
Section 9.4
0%
10%
20%
30%
40%
50%
60%
3% of completershired between2003 and 2007
were continuouslyemployed in 2012-
2013
4% of completershired in 2009 were
continuouslyemployed in 2012-
2013
49% of completershired in 2010 were
continuouslyemployed in 2012-
2013
16% of completeshired in 2011 were
continuouslyemployed in 2012-
2013
24% of completershired in 2012 were
continuouslyemployed in 2012-
2013
Retention Rates Among Completers in 2009-2010
%ages below are derived from a total of 169 completers
Much like trends observed among the past three cohorts, the largest number of students hired prior to their graduation was those in Guidance and Counseling. Surprisingly, a total of 17 completers from the English 6-12 and ESE Programs were hired in 2011 and a total of 9 were hired in 2011, and 2012. Although these variations emerged, general trends regarding the large number of completers from Elementary Ed and Pre-K Primary remain the same, most likely due to the higher percentage of students graduating from these disciplines as compared to others.

32 | P a g e
Updated April 2015
Section 9.5
0%
10%
20%
30%
40%
50%
60%
70%
7% who werehired in 1999-
2008 wereretained until
2012-2013
3% who werehired in 2010were retained
until 2012-2013
60% whowere hired in
2011 wereretained until
2012-2013
30% who werehired in 2012were retained
until 2012-2013
Retention Rates from 189 Completers, 2010-2011 Cohort
Percentage of Completersfrom 2010-2011 Cohort
Trends regarding hiring and retention rates among completers for this cohort were consistent with past years with the exception of those hired in 2012: More students in the ESE Program (N=12) were hired and retained as compared to those in the PreK-Primary (N=11); nine students in Social Science (6-12) were hired and seven from Physical Education were hired, which is consistent with the ten Guidance and Counseling Students hired a year after their graduation. These data – showing an expansion in graduation and hiring among those in disciplines other than Elementary Education – is an interesting, positive change.

33 | P a g e
Updated April 2015
Section 9.6
0%
20%
40%
60%
80%
100%
120%
3% hired between2003-2009 were
retained until2012-2013
3% who were hiredin 2011 wereretained until
2012-2013
96% who werehired in 2012 were
retained until2012-2013
Retention Rates, 2011-2012 Cohort, %ages based on a total of 151 Completers
Percentage of Completersfrom 2010-2011 Cohort
Data from the past three cohorts indicates an increase in hiring for completers throughout the 2012 timeframe, and this is represented in the graph above.

34 | P a g e
Updated April 2015
Section 9.7: The next set of graphs depicts the total number of completers from each
discipline within each cohort group who have been continuously employed. Please see
below.
2 4
97
5 10
13
3 3 5 4
18
4 0
20
40
60
80
100
120
# of Completers who Graduated in 2006-2007 and are Still Employed
# of Completers whoGraduated in 2006-2007and are Still Employed

35 | P a g e
Updated April 2015
Section 9.8
2 1 1 3
105
4
17 15
4 3 6 1 1
28
6
# of Completers from 2007-2008 Who are Currently Employed
# of Completers from 2007-2008 Who are Currently Employed

36 | P a g e
Updated April 2015
Section 9.9
4 2
97
11 7 24
1 1 4 2 6 18
8
# of Completers, 2008-2009 Cohort Group, Continuously Employed
# of Completers, 2008-2009 Cohort Group, Continuously Employed
2 2
80
9 10 12 3 2 5 1 5
28
10
# of Completers, Cohort 2009-2010, Still Employed
# of Completers, Cohort 2009-2010, Still Employed

37 | P a g e
Updated April 2015
High retention rates among those in Elementary Ed and Pre-K primary are positive findings
for the UNF College of Education and Human Services.
1
113
9 14 9 2 4 6 2 2 18
9
# of Completers, Cohort 2010-2011, Still Employed
# of Completers, Cohort 2010-2011, Still Employed
1
80
3 13 13
1 6 3 2 7 11 11
# of Completers, 2011-2012 Cohort, Still Employed
# of Completers, 2011-2012 Cohort, Still Employed
38 | P a g e
Updated April 2015
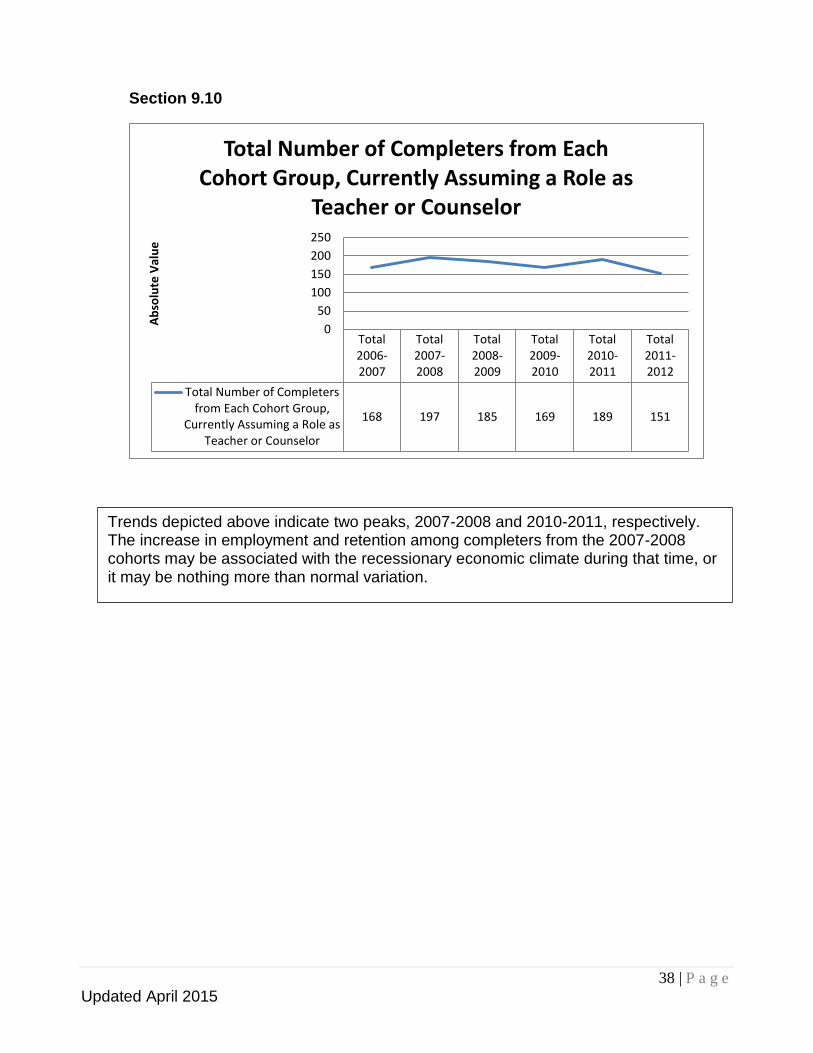
Section 9.10
Section 10 Impact Data: Florida’s Value-Added Model Scores
Total2006-2007
Total2007-2008
Total2008-2009
Total2009-2010
Total2010-2011
Total2011-2012
Total Number of Completersfrom Each Cohort Group,
Currently Assuming a Role asTeacher or Counselor
168 197 185 169 189 151
0
50
100
150
200
250
Ab
solu
te V
alu
e
Total Number of Completers from Each Cohort Group, Currently Assuming a Role as
Teacher or Counselor
Trends depicted above indicate two peaks, 2007-2008 and 2010-2011, respectively. The increase in employment and retention among completers from the 2007-2008 cohorts may be associated with the recessionary economic climate during that time, or it may be nothing more than normal variation.

39 | P a g e
Updated April 2015
Section 9.11 The institution collects and analyzes employer data on a yearly basis based
on FDOE employment reports. In the 2012-2013 Academic Year, UNF graduated 319
candidates. Of these graduates, 20 were completers from the EPI (Education Preparation
Institute); 299 were completers from the TCP (i.e., Initial Teacher Preparation Program).
One hundred ninety eight, that is approximately 66% of those who graduated from the TCP,
sought and obtained employment in a Florida Public School. The employment data do not
include UNF program completers hired in private and/or out of state schools. The
employment data provided by the state are used as part of COEHS continuous
improvement efforts as evidenced in UNF’s Institutional Program Evaluation Plans (IPEPs),
institutional strategic plans, institutional reports, and departmental program reviews, as
appropriate. The numbers used herein were calculated by the state.
Subject Areas Either Absolute Value or % of Completers Employed in Each Subject
Area (N = 198) Teacher: Dropout Prevention N=1
Music teacher N=1
Reading Resource 1%
Physical Education 2%
Middle School Math 2%
Art Teacher (Elementary or Secondary) 2%
High School Math 3%
Science (Elementary, Middle or High School) 3%
"Other" (i.e., 1 teacher self-contained sixth grade; 1 teacher “ungraded” elementary; 1 teacher, senior high school classroom; 1
teacher, “other” classroom; 1 teacher, Chapter 1, elementary)
3%
High School ELA 4%
Middle School Foreign Language or ELA 4%
Social Studies (Middle or High School) 4%
Self-contained 4th
Grade 5%
Counselor (Elementary, Middle, or High School)
7%
Self-contained 5th
Grade 8%
Self-contained 1st
Grade 9%
Self-contained 2nd
Grade 9%
Self-contained 3rd
Grade 10%
Teacher of Exceptional Learners (i.e., gifted, autistic, hearing impaired, mentally
handicapped, or classes in which students are emotionally disturbed)
12%
Self-contained Kindergarten 13%

40 | P a g e
Updated April 2015
As per the attached report, these data are relatively consistent with trends exhibited
since 2006; however, by aggregating teachers of gifted, autistic, hearing impaired and the
like, the number of "ESE" completers is relatively high. Finally, the higher representation of
students in elementary education is consistent with the patterns exhibited over the past
several years.
# of Completers, 199 Employed Years of Experience
150 0
22 1
7 2
4 3
6 4
0 5
5 6
2 7
1 8
1 9
1 unknown

41 | P a g e
Updated April 2015
Please see counties in which completers were employed (in absolute
values):
County Number of (2012-2013) Completers Employed in Each County
ALACHUA 1
BAKER 1
BRADFORD 2
BREVARD 2
BROWARD 1
CLAY 23
DADE 1
DUVAL 125
FL VIRTUAL 1
ESCAMBIA 2
FLAGLER 1
HENDRY 1
HIGHLANDS 1
HILLSBOROUGH 4
LAKE 1
LEE 1
NASSAU 5
ORANGE 4
PALM BEACH 1
PASCO 1
PUTNAM 1
SEMINOLE 2
ST JOHNS 15
VOLUSIA 1
The distribution of teachers in the counties above is consistent with commensurate data
from previous years.

42 | P a g e
Updated April 2015
Overview Section 10: Value-Added: VAM Scores, 2012-2013
VAM scores1 were reported for seventeen percent of 2012-2013 COEHS completers
from the Teacher Educator Program (TEP) at UNF (i.e., 17% of the 299 completers from
UNF’s TEP equals and N of 50). Among UNF TEP program completers, VAM scores, on
average, were slightly below “0.” This indicates that, on average, students of completers
from UNF performed neither better nor worse than expected after controlling for all the
factors in the model (please see below). In other words, students of completers from UNF
grew at a rate that was roughly equivalent to that of the state average.
Average Teacher Education Completer VAM Scores, 2012-2013
Reading Score Math Score
X = -0.06453 (6th
hundredths of a point lower
than predicted performance
as per the VAM model.)
X = -0.08521 (8 hundredths
of a point lower than
predicted performance as
per the VAM model.)
As evidenced above, VAM scores for COEHS program completers who teach Math
and Reading were made available by the FLDOE. The mean of all 50 scores in both
Reading and Math was calculated (see table). In addition, 22% and 42% of 2012-2013
completers had VAM scores of “0” in Reading and Math, respectively, indicating this
percentage of students scored as the VAM model would have predicted (i.e., average
performance -- typical of this student population). Thirty-four percent and 32% of 2012-2013
program completers had VAM Reading and Math scores above “0,” respectively. This
indicates that the average students’ of UNF completers performed better than the VAM
model predicted after controlling for factors in the model.
Also noteworthy are the “Average VAM Score of Completers,” which indicate, for
specific disciplines the percentage above or below students of completers’ performance
1 See Appendix A for brief description.

43 | P a g e
Updated April 2015
varied from the state average. To the right of this is the “Clustered Standard Error” or the
standard error of the mean VAM score among completers from UNF. The Standard Error
(SE) indicates the range of scores that are likely to be above or below the Average VAM
Score for Completers.
Discipline %age Above or Below An Average Year’s Growth SE
All -4% .02086
All 7% .02496
All -2% .08428
All -3% .01522
Math 3% .01225
Math -7% .07418
Math -5% .02831
Math 4% .02099
Math -8% .10978
Math -4% .01256
Math 1% .01164
Math -6% .05596
Math 2% .02625
Math 3% .02689
Math 2% .15176
Math -4% .02547
MathProg 8% .02066
MathProg -9% .17218
MathProg -3% .04016
Reading .4% .03282
Reading -3% .26163
Reading -1% .01756
Reading 4% .01564
Reading -10% .11076
Reading -7% .06281
Reading -.3% .04507
Reading -14% .05558
Reading -7% .03347
Reading -9% .02727
Reading -1% .02857
Reading -7% .09191
Reading -3% .01472
ReadProg 1% .0115
ReadProg -1% .06937
ReadProg -5% .03104
All -1% .02224
All -5% .12781
All -6% .01443
All -.1% .01246
All -5% .06566
Math -.01% .04683
Math .5% .01818

44 | P a g e
Updated April 2015
Math -.2% .03478
Math .1% .01893 Rows that did not contain these data were not included in the table above.
Due to the relatively small proportions representing an “average year’s growth,” in
light of the similar quantities of standard error, make it important for readers to interpret
VAM scores from 2012-2013 information cautiously. In addition, the relatively small
percentage of VAM data available for this cohort group precludes the reader from assuming
these data are reliable (even if the reliability ratios for this VAM model show sufficient levels
of discriminant validity [for teachers within the entire State of Florida]).

45 | P a g e
Updated April 2015
Appendix A
The VAM model used in the State of Florida is a “covariate adjustment model,” which
takes students’ observed characteristics (as covariates) and prior test scores to compute “a
conditional expectation for student i based on how other students with similar” -- i.e.,
equivalent school, classroom and student – “measured characteristics and prior test scores
have performed, given the predicted value, ̂ ” (this information comes from
Florida Comprehensive Assessment Test (FCAT) 2.0 Value-Added Model Technical Report
2012-13 November 2013 [authors request the report not be cited]). Although this model is
far more complex than that which is being described here, in essence, data from the VAM
model indicates whether or not the students’ -- of specific teachers -- scores are higher,
lower or the same as their actual scores on the FCAT 2.0 in Reading and Math. (Again,
conditional expectations or the “predicted score” is derived, in part, by computing a weighted
mean of the student level residuals among students with “similar” characteristics.)
Additionally, the magnitude of this difference is indicated by the VAM model as well, with
negative scores representative of students’ standardized test performance, on average, “x”
number of points below that which the model predicted; a score of zero equivalent to that
which the model predicted; and, positive scores representative of students’ standardized
test performance, on average, “x” number of points above that which the model predicted.
For example, a VAM score of +10.0 in Reading indicates that the students’ performance for
a specific teacher in Reading was, on average, 10 points more than what the model
predicted for students whose metrics (characteristics and prior test scores) are similar.