effective powerpoint presentations · tips for an effective powerpoint presentation ... slides read...
TRANSCRIPT
7.06.2013

Shimrit Maman
Tips for an Effective PowerPoint presentation towards the IGA meeting 2015
שימוש בכלים לוויינים במחקר אקדמי
בוחן מחקרים סביבתיים במרכז אסיה כמקרה
ר שמרית ממן"ד המחלקה לגאוגרפיה ופיתוח סביבתי
אוניברסיטת בן גוריון בנגב
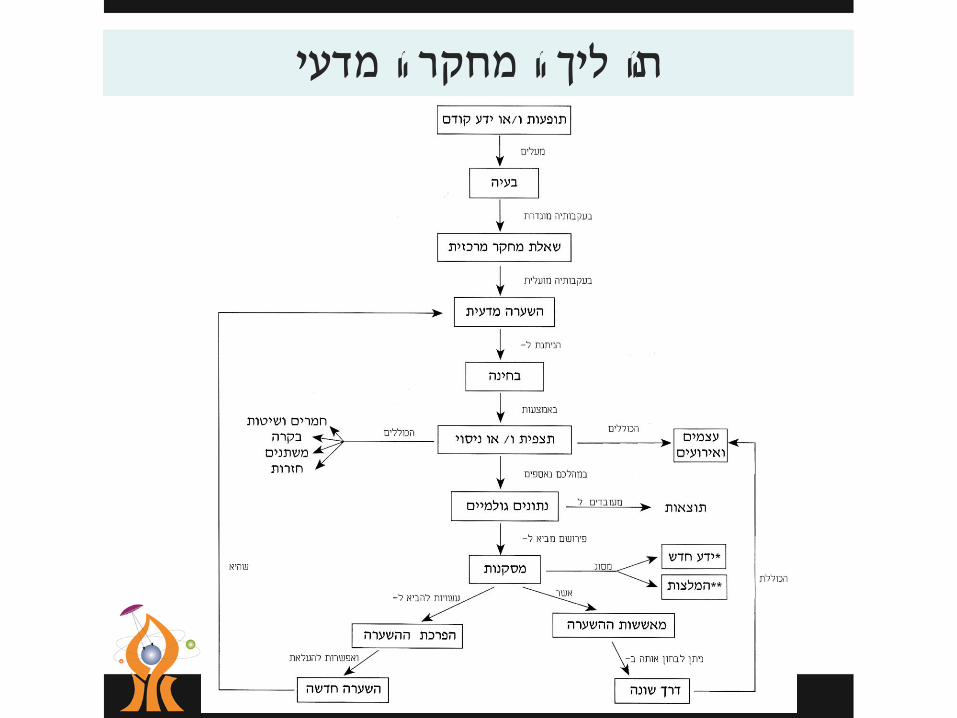
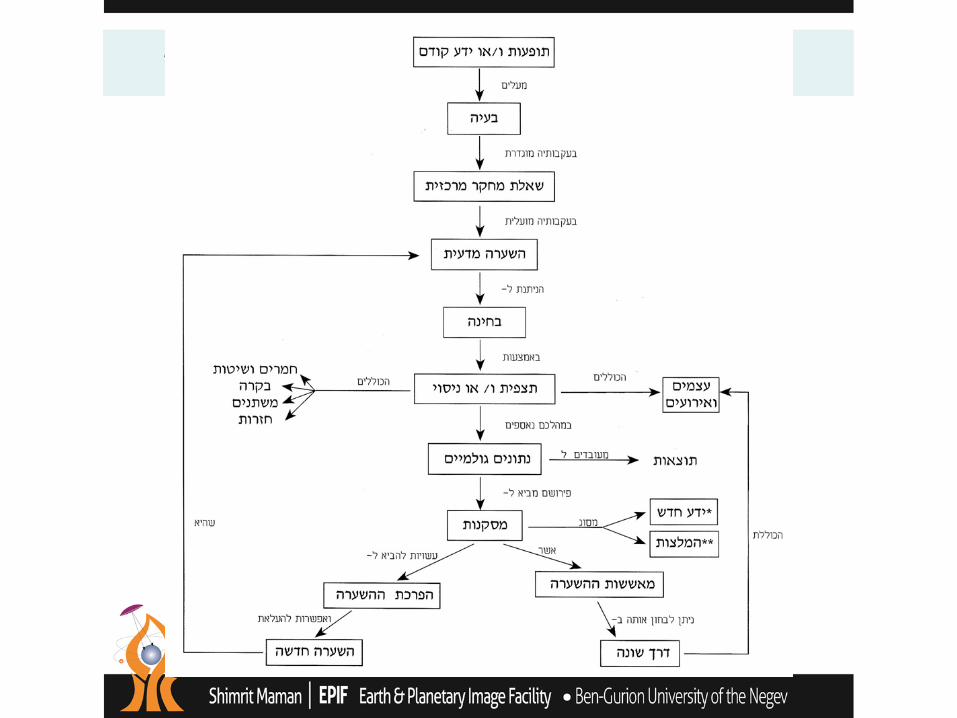
תהליך המחקר המדעי
15 minutes to talk about my work!
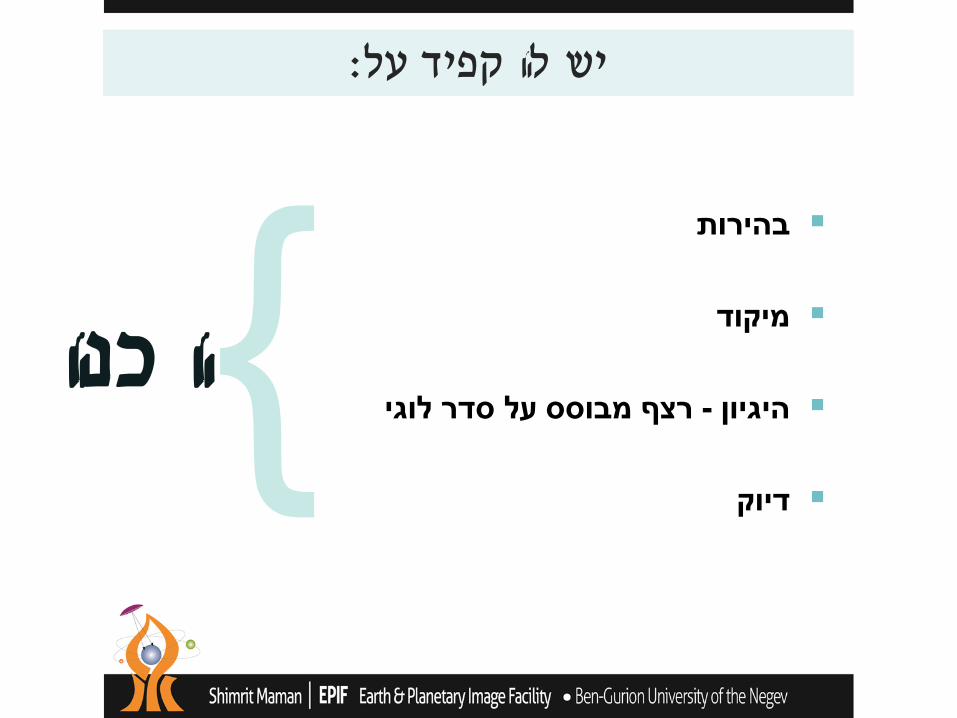
:יש להקפיד על
בהירות
מיקוד
רצף מבוסס על סדר לוגי -היגיון
דיוק
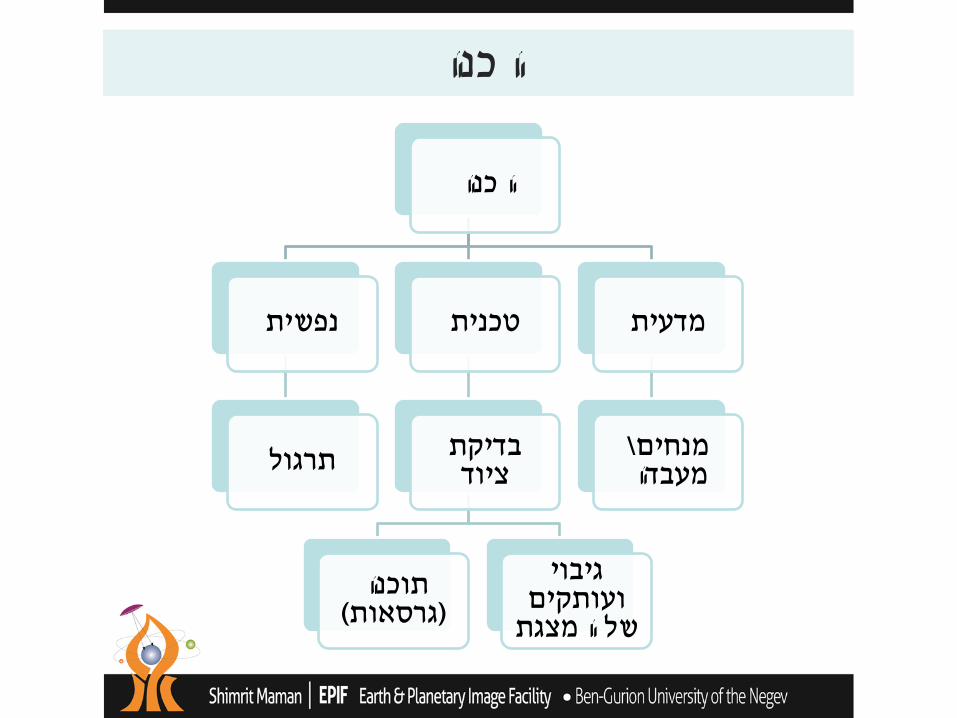
הכנה
הכנה
נפשית
תרגול
טכנית
בדיקת ציוד
תוכנה (גרסאות)
גיבוי ועותקים של המצגת
מדעית
\מנחים מעבדה
הכנה
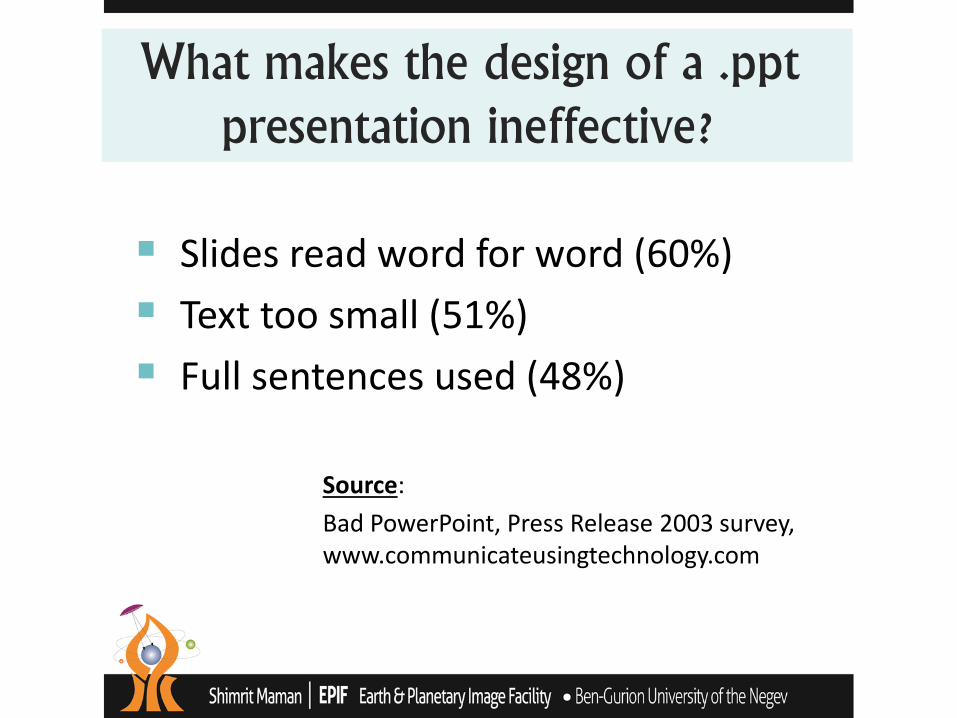
What makes the design of a .ppt presentation ineffective?
Slides read word for word (60%)
Text too small (51%)
Full sentences used (48%)
Source:
Bad PowerPoint, Press Release 2003 survey, www.communicateusingtechnology.com
“The purpose of using visual aids is to enhance your presentation, not upstage it.”
Lenny Laskowski (PowerPointers.com)
Before we begin: Slide Master
Have only the minimum required text on each slide.
Tip #1
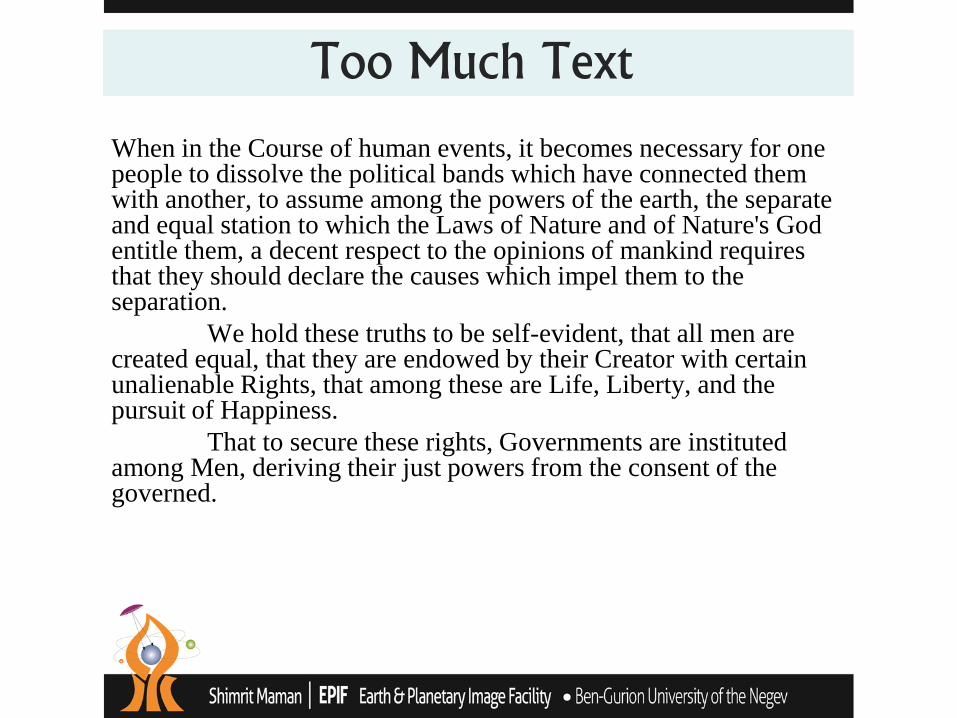
When in the Course of human events, it becomes necessary for one people to dissolve the political bands which have connected them with another, to assume among the powers of the earth, the separate and equal station to which the Laws of Nature and of Nature's God entitle them, a decent respect to the opinions of mankind requires that they should declare the causes which impel them to the separation.
We hold these truths to be self-evident, that all men are created equal, that they are endowed by their Creator with certain unalienable Rights, that among these are Life, Liberty, and the pursuit of Happiness.
That to secure these rights, Governments are instituted among Men, deriving their just powers from the consent of the governed.
Too Much Text
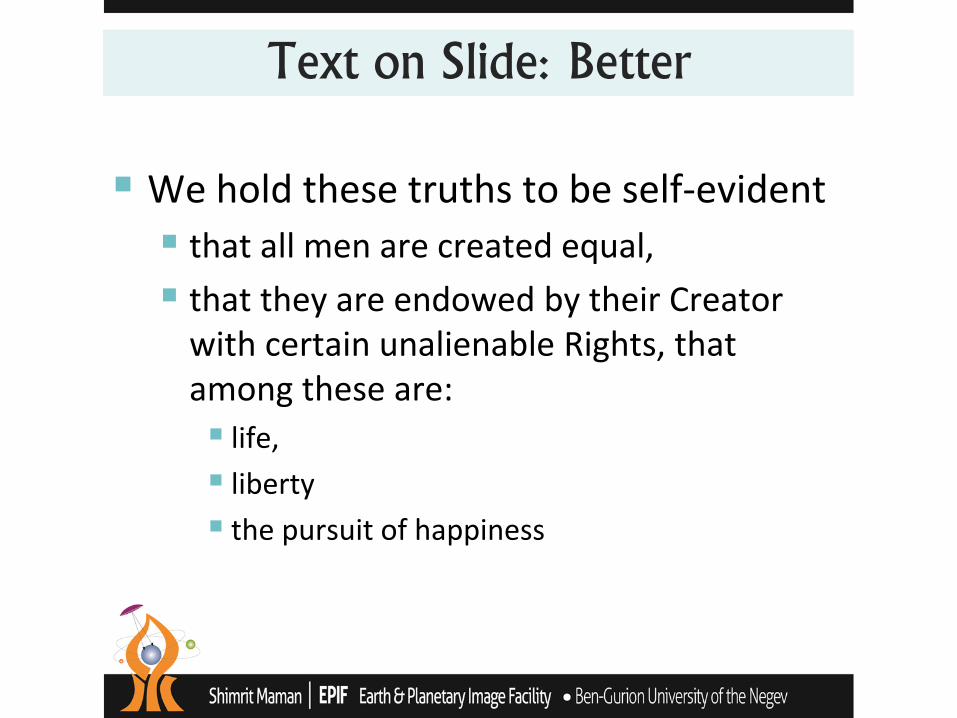
We hold these truths to be self-evident
that all men are created equal,
that they are endowed by their Creator with certain unalienable Rights, that among these are:
life,
liberty
the pursuit of happiness
Text on Slide: Better
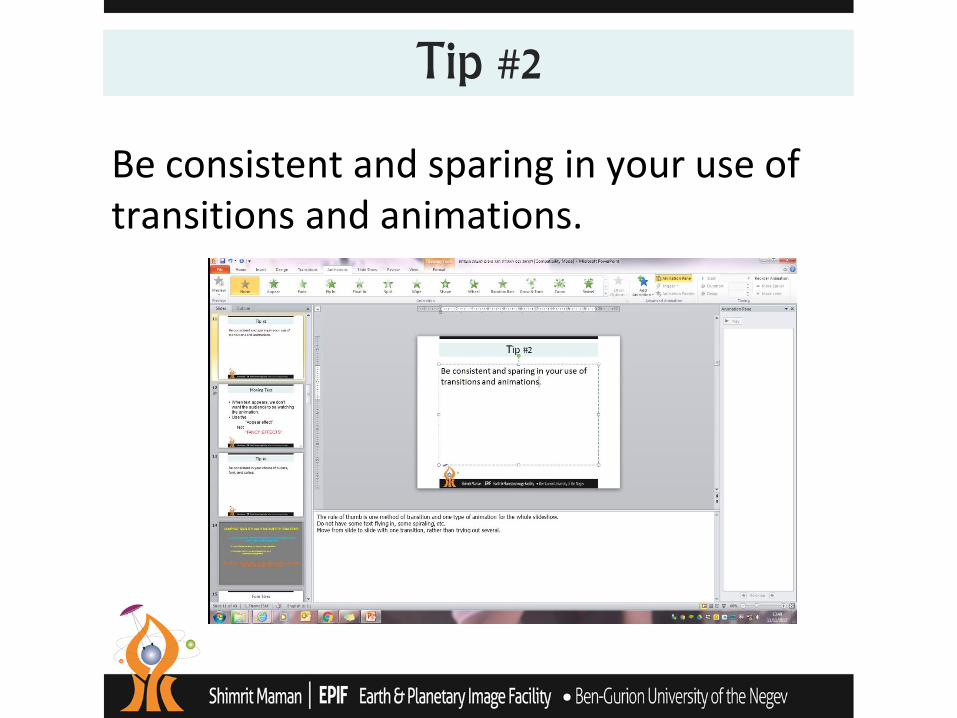
Be consistent and sparing in your use of transitions and animations.
Tip #2
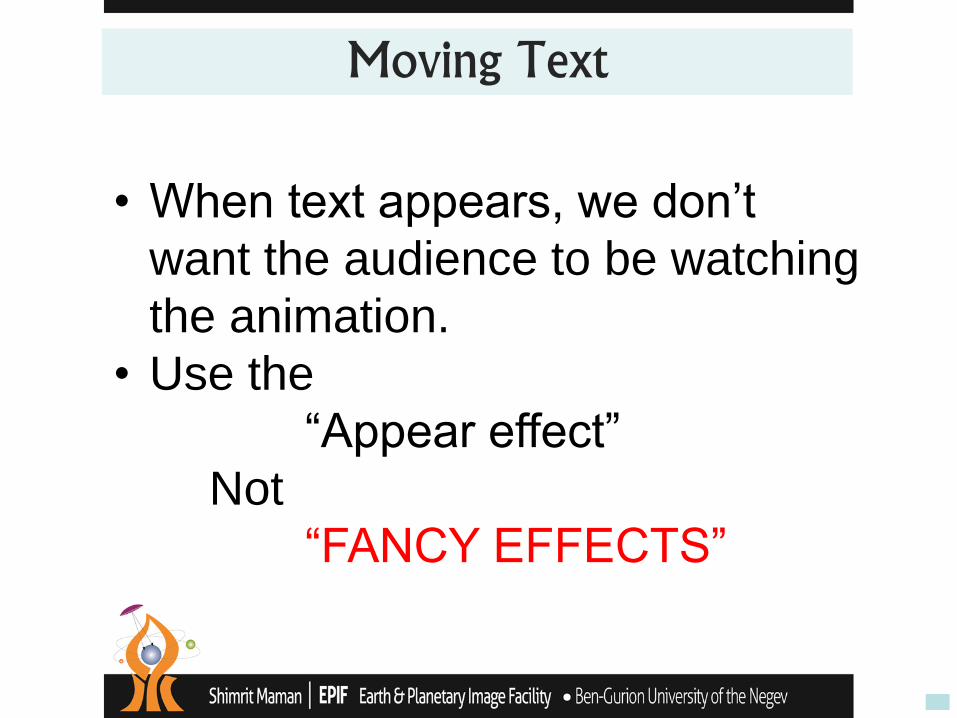
Moving Text
• When text appears, we don’t
want the audience to be watching
the animation.
• Use the
“Appear effect”
Not
“FANCY EFFECTS”
Be consistent in your choice of bullets, font, and colors.
Tip #3
Reveal the KEY IDEA only
A bullet point is a short summation of all you know about the idea
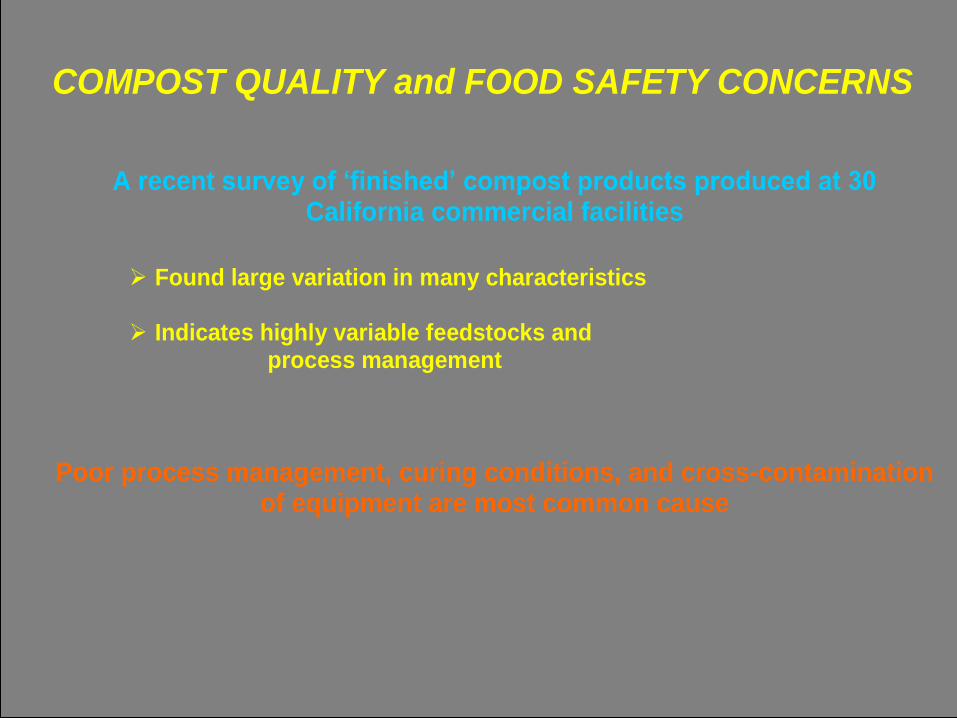
COMPOST QUALITY and FOOD SAFETY CONCERNS
A recent survey of ‘finished’ compost products produced at 30 California commercial facilities
Found large variation in many characteristics
Indicates highly variable feedstocks and process management
Poor process management, curing conditions, and cross-contamination of equipment are most common cause
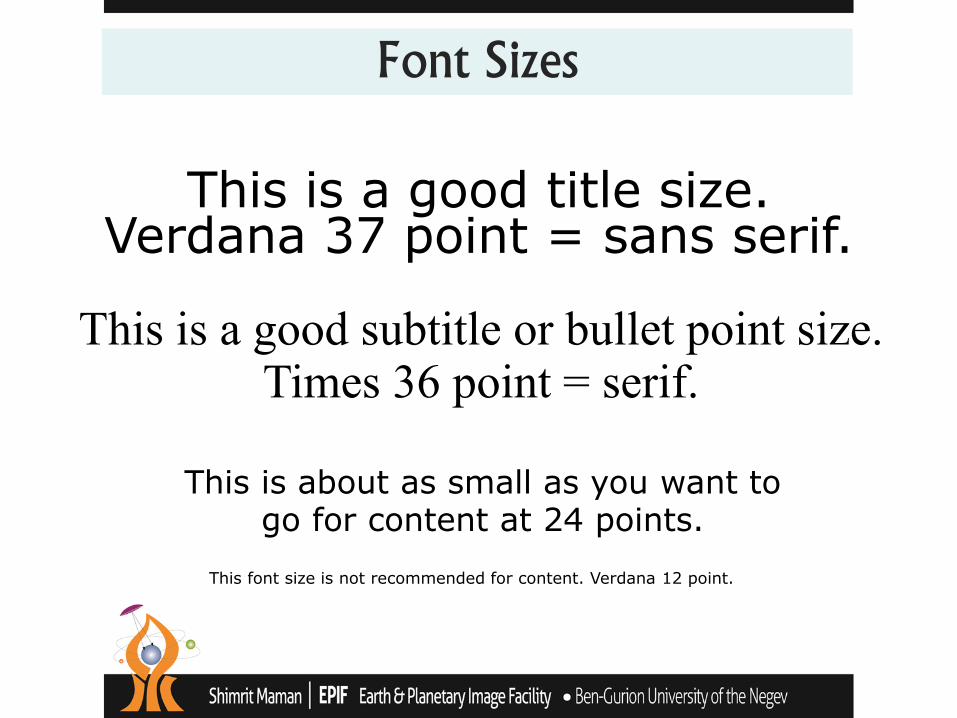
This is a good title size. Verdana 37 point = sans serif.
This is a good subtitle or bullet point size. Times 36 point = serif.
This is about as small as you want to go for content at 24 points.
This font size is not recommended for content. Verdana 12 point.
Font Sizes
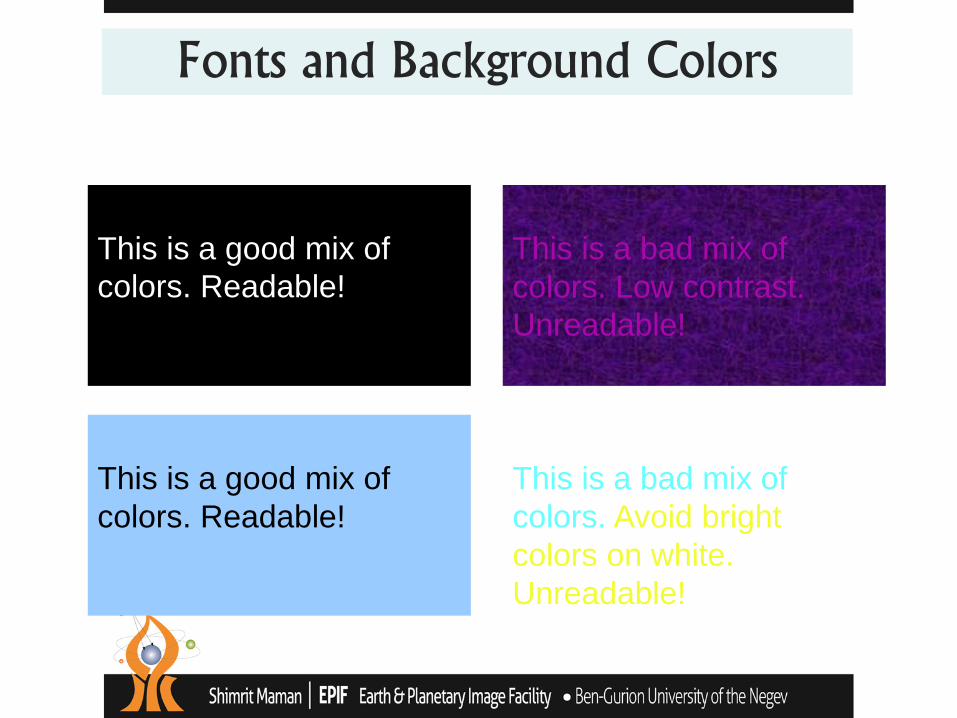
This is a good mix of
colors. Readable!
This is a bad mix of
colors. Low contrast.
Unreadable!
This is a good mix of
colors. Readable!
This is a bad mix of
colors. Avoid bright
colors on white.
Unreadable!
Fonts and Background Colors
Tip #4
Create graphics (such as tables and charts) appropriately.
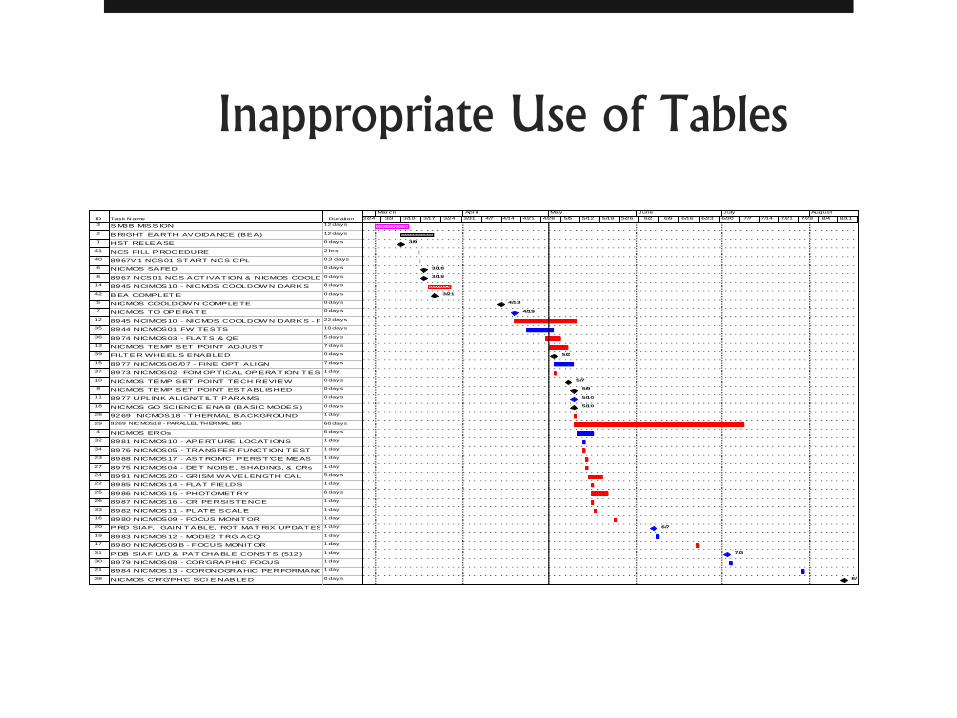
Inappropriate Use of Tables
ID Task Name Duration
3 SM3B MISSION 12 days
2 BRIGHT EARTH AVOIDANCE (BEA) 12 days
1 HST RELEASE 0 days
41 NCS FILL PROCEDURE 2 hrs
40 8967V1 NCS01 ST ART NCS CPL 0.3 days
6 NICMOS SAFED 0 days
8 8967 NCS01 NCS ACT IVAT ION & NICMOS COOLDOW N0 days
14 8945 NCIMOS10 - NICMOS COOLDOW N DARKS 8 days
42 BEA COMPLET E 0 days
5 NICMOS COOLDOW N COMPLETE 0 days
7 NICMOS TO OPERAT E 0 days
12 8945 NCIMOS10 - NICMOS COOLDOW N DARKS - PART II22 days
35 8944 NICMOS01 FW TESTS 10 days
36 8974 NICMOS03 - FLAT S & QE 5 days
13 NICMOS TEMP SET POINT ADJUST 7 days
39 FILT ER WHEELS ENABLED 0 days
15 8977 NICMOS06/07 - FINE OPT ALIGN 7 days
37 8973 NICMOS02 FOM OPTICAL OPERAT ION T EST1 day
10 NICMOS TEMP SET POINT TECH REVIEW 0 days
9 NICMOS TEMP SET POINT EST ABLISHED 0 days
11 8977 UPLINK ALIGN/T ILT PARAMS 0 days
18 NICMOS GO SCIENCE ENAB (BASIC MODES) 0 days
28 9269 NICMOS18 - T HERMAL BACKGROUND 1 day
29 9269 NICMOS18 - PARALLEL THERMAL B/G 60 days
4 NICMOS EROs 6 days
32 8981 NICMOS10 - APERT URE LOCAT IONS 1 day
34 8976 NICMOS05 - TRANSFER FUNCT ION T EST 1 day
23 8988 NICMOS17 - AST ROM'C PERS'T 'CE MEAS 1 day
27 8975 NICMOS04 - DET NOISE, SHADING, & CRs 1 day
24 8991 NICMOS20 - GRISM WAVELENGTH CAL 5 days
22 8985 NICMOS14 - FLAT FIELDS 1 day
25 8986 NICMOS15 - PHOTOMET RY 6 days
26 8987 NICMOS16 - CR PERSISTENCE 1 day
33 8982 NICMOS11 - PLAT E SCALE 1 day
16 8980 NICMOS09 - FOCUS MONIT OR 1 day
20 PRD SIAF, GAIN T ABLE, ROT MAT RIX UPDAT ES 1 day
19 8983 NICMOS12 - MODE2 T RG ACQ 1 day
17 8980 NICMOS09B - FOCUS MONIT OR 1 day
31 PDB SIAF U/D & PAT CHABLE CONST S (512) 1 day
30 8979 NICMOS08 - COR'GRAPHIC FOCUS 1 day
21 8984 NICMOS13 - CORONOGRAHIC PERFORMANCE1 day
38 NICMOS C'R'G'PH'C SCI ENABLED 0 days
3/9
3/18
3/18
3/21
4/13
4/19
5/2
5/7
5/9
5/10
5/10
6/7
7/3
8/
2/24 3/3 3/10 3/17 3/24 3/31 4/7 4/14 4/21 4/28 5/5 5/12 5/19 5/26 6/2 6/9 6/16 6/23 6/30 7/7 7/14 7/21 7/28 8/4 8/11
March April May June July August
Appropriate use: Tables & Figures
Emphasize key parts so that your points are stronger.
Animate the graph or table elements
Use drawing tools to highlight a portion of the table or graph
Use strong contrasting color for drawing element
Use callout box drawing tool
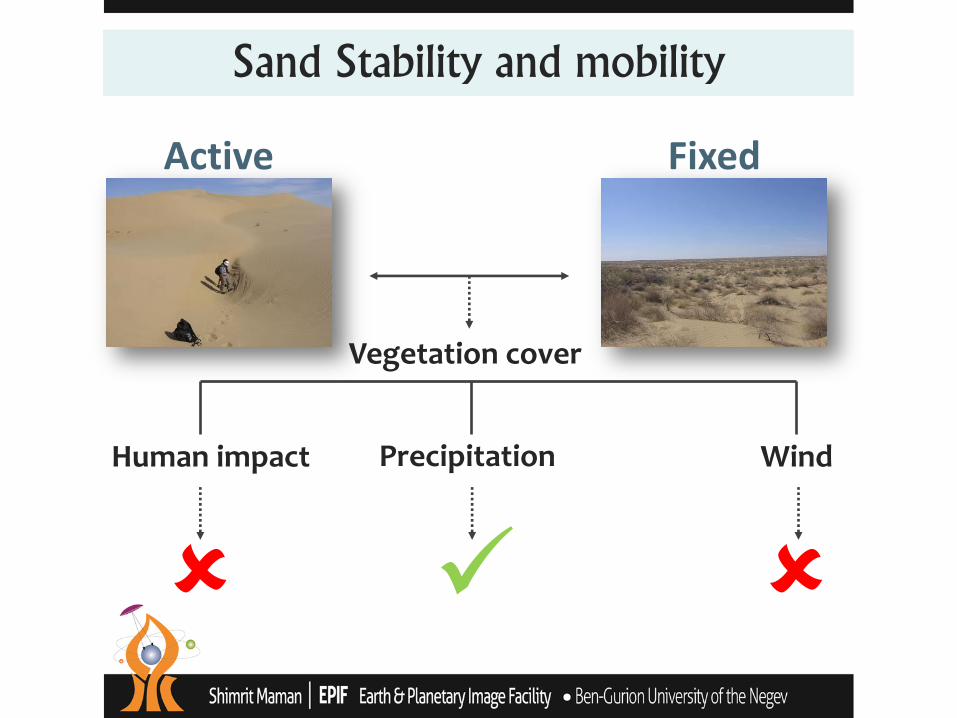
Sand Stability and mobility
Active Fixed
Wind Precipitation
Vegetation cover
Human impact
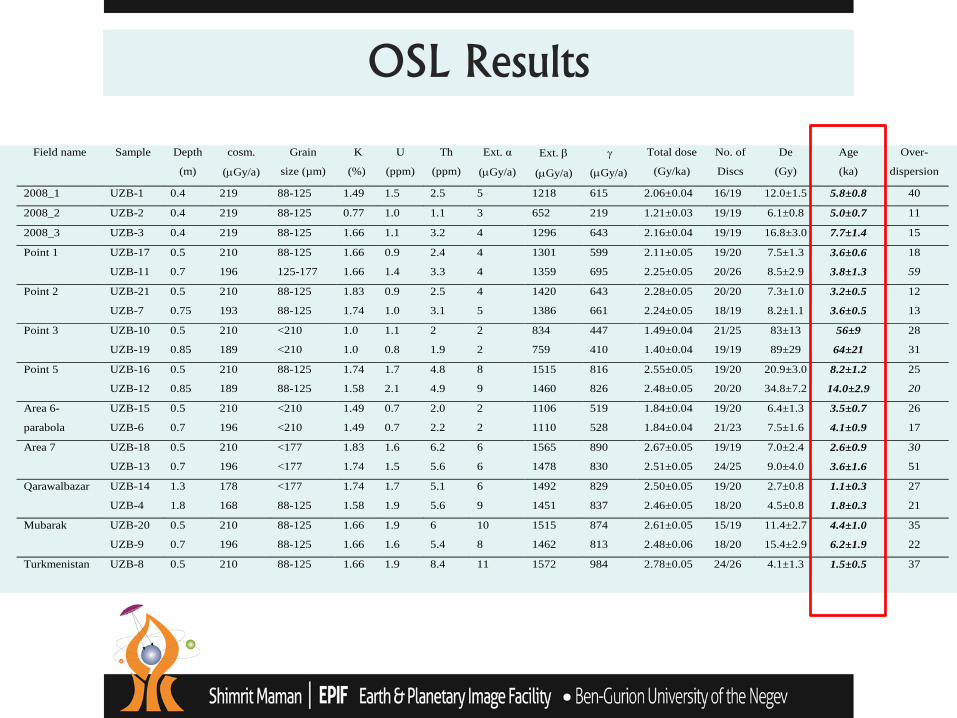
Field name Sample Depth
(m)
cosm.
(Gy/a)
Grain
size (µm)
K
(%)
U
(ppm)
Th
(ppm)
Ext. α
(Gy/a)
Ext.
(Gy/a)
(Gy/a)
Total dose
(Gy/ka)
No. of
Discs
De
(Gy)
Age
(ka)
Over-
dispersion
2008_1 UZB-1 0.4 219 88-125 1.49 1.5 2.5 5 1218 615 2.06±0.04 16/19 12.0±1.5 5.8±0.8 40
2008_2 UZB-2 0.4 219 88-125 0.77 1.0 1.1 3 652 219 1.21±0.03 19/19 6.1±0.8 5.0±0.7 11
2008_3 UZB-3 0.4 219 88-125 1.66 1.1 3.2 4 1296 643 2.16±0.04 19/19 16.8±3.0 7.7±1.4 15
Point 1 UZB-17 0.5 210 88-125 1.66 0.9 2.4 4 1301 599 2.11±0.05 19/20 7.5±1.3 3.6±0.6 18
UZB-11 0.7 196 125-177 1.66 1.4 3.3 4 1359 695 2.25±0.05 20/26 8.5±2.9 3.8±1.3 59
Point 2 UZB-21 0.5 210 88-125 1.83 0.9 2.5 4 1420 643 2.28±0.05 20/20 7.3±1.0 3.2±0.5 12
UZB-7 0.75 193 88-125 1.74 1.0 3.1 5 1386 661 2.24±0.05 18/19 8.2±1.1 3.6±0.5 13
Point 3 UZB-10 0.5 210 <210 1.0 1.1 2 2 834 447 1.49±0.04 21/25 83±13 56±9 28
UZB-19 0.85 189 <210 1.0 0.8 1.9 2 759 410 1.40±0.04 19/19 89±29 64±21 31
Point 5 UZB-16 0.5 210 88-125 1.74 1.7 4.8 8 1515 816 2.55±0.05 19/20 20.9±3.0 8.2±1.2 25
UZB-12 0.85 189 88-125 1.58 2.1 4.9 9 1460 826 2.48±0.05 20/20 34.8±7.2 14.0±2.9 20
Area 6- UZB-15 0.5 210 <210 1.49 0.7 2.0 2 1106 519 1.84±0.04 19/20 6.4±1.3 3.5±0.7 26
parabola UZB-6 0.7 196 <210 1.49 0.7 2.2 2 1110 528 1.84±0.04 21/23 7.5±1.6 4.1±0.9 17
Area 7 UZB-18 0.5 210 <177 1.83 1.6 6.2 6 1565 890 2.67±0.05 19/19 7.0±2.4 2.6±0.9 30
UZB-13 0.7 196 <177 1.74 1.5 5.6 6 1478 830 2.51±0.05 24/25 9.0±4.0 3.6±1.6 51
Qarawalbazar UZB-14 1.3 178 <177 1.74 1.7 5.1 6 1492 829 2.50±0.05 19/20 2.7±0.8 1.1±0.3 27
UZB-4 1.8 168 88-125 1.58 1.9 5.6 9 1451 837 2.46±0.05 18/20 4.5±0.8 1.8±0.3 21
Mubarak UZB-20 0.5 210 88-125 1.66 1.9 6 10 1515 874 2.61±0.05 15/19 11.4±2.7 4.4±1.0 35
UZB-9 0.7 196 88-125 1.66 1.6 5.4 8 1462 813 2.48±0.06 18/20 15.4±2.9 6.2±1.9 22
Turkmenistan UZB-8 0.5 210 88-125 1.66 1.9 8.4 11 1572 984 2.78±0.05 24/26 4.1±1.3 1.5±0.5 37
OSL Results
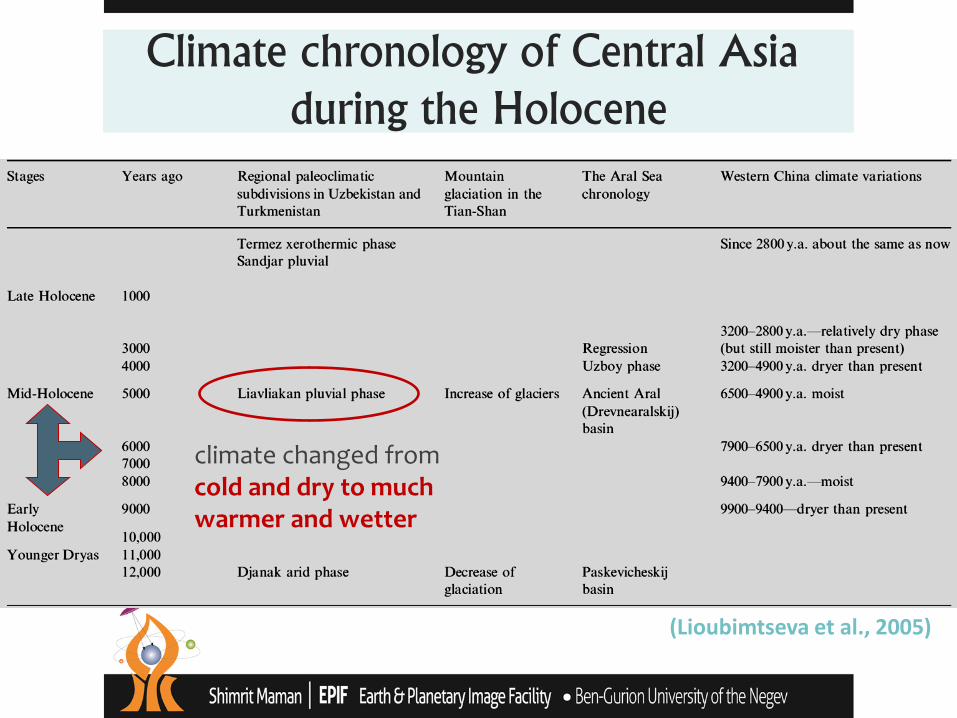
Climate chronology of Central Asia during the Holocene
(Lioubimtseva et al., 2005)
climate changed from cold and dry to much warmer and wetter
White space is our friend.
Tip #5
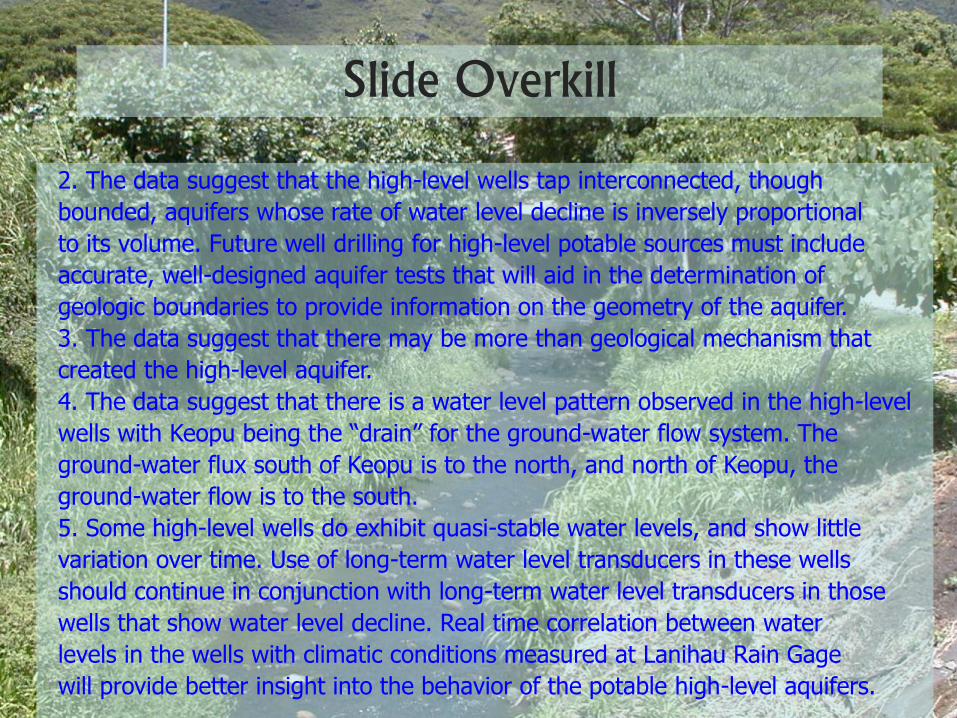
2. The data suggest that the high-level wells tap interconnected, though
bounded, aquifers whose rate of water level decline is inversely proportional
to its volume. Future well drilling for high-level potable sources must include
accurate, well-designed aquifer tests that will aid in the determination of
geologic boundaries to provide information on the geometry of the aquifer.
3. The data suggest that there may be more than geological mechanism that
created the high-level aquifer.
4. The data suggest that there is a water level pattern observed in the high-level
wells with Keopu being the “drain” for the ground-water flow system. The
ground-water flux south of Keopu is to the north, and north of Keopu, the
ground-water flow is to the south.
5. Some high-level wells do exhibit quasi-stable water levels, and show little
variation over time. Use of long-term water level transducers in these wells
should continue in conjunction with long-term water level transducers in those
wells that show water level decline. Real time correlation between water
levels in the wells with climatic conditions measured at Lanihau Rain Gage
will provide better insight into the behavior of the potable high-level aquifers.
Slide Overkill
Washout Picture 1. Insert a Picture by choosing
Insert>Picture>From File
2. Resize it to completely fill the frame
3. Keeping the picture selected, choose Format>Picture>Image Control
4. Under Color, choose Washout
Methods
Results
Background
Objectives
Outline
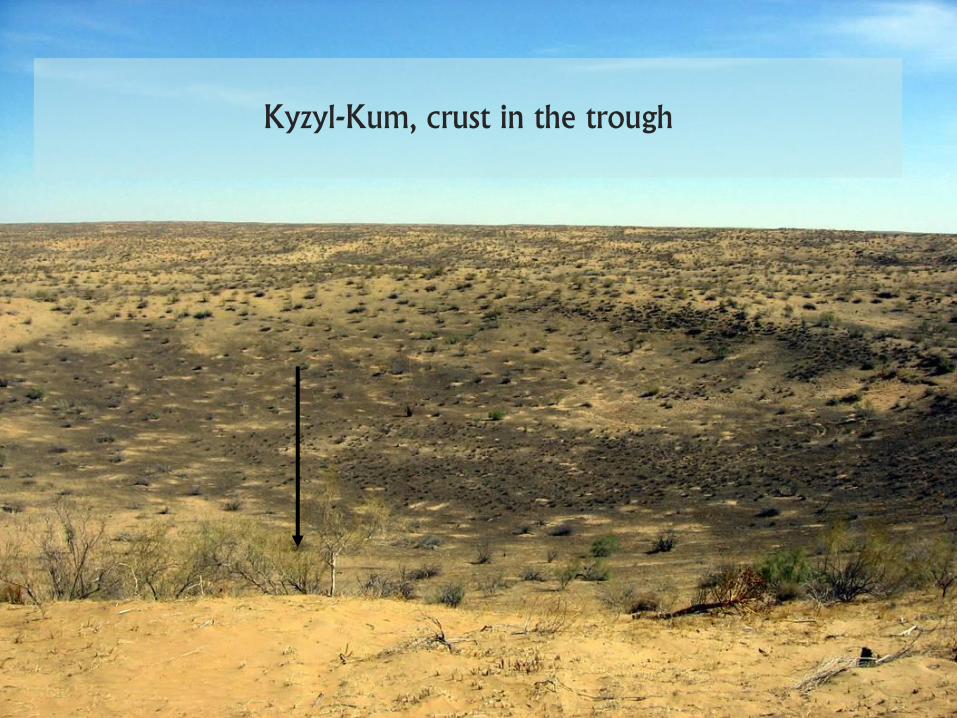
Kyzyl-Kum, crust in the trough
Maps
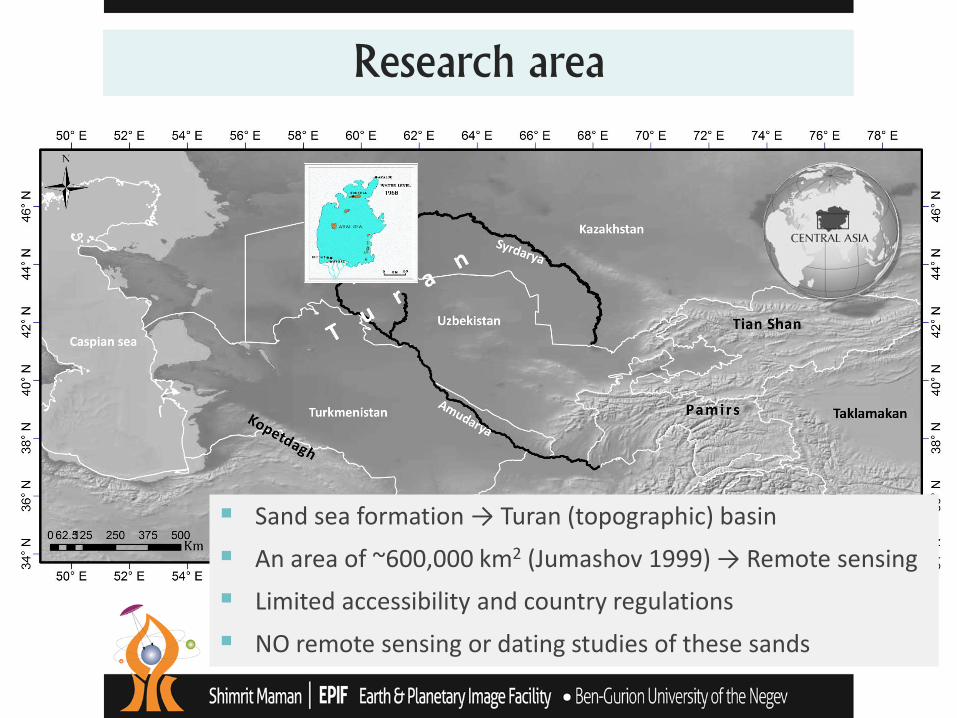
Research area
Sand sea formation → Turan (topographic) basin
An area of ~600,000 km2 (Jumashov 1999) → Remote sensing
Limited accessibility and country regulations
NO remote sensing or dating studies of these sands
Remember that you are the show --not the PowerPoint slideshow.
Tip #6
Do use some graphics in your slideshow. Nothing is more boring than an all-text slideshow.
Choose them carefully, though.
Tip #7
• ???או שאלה....!!! סימני קריאה
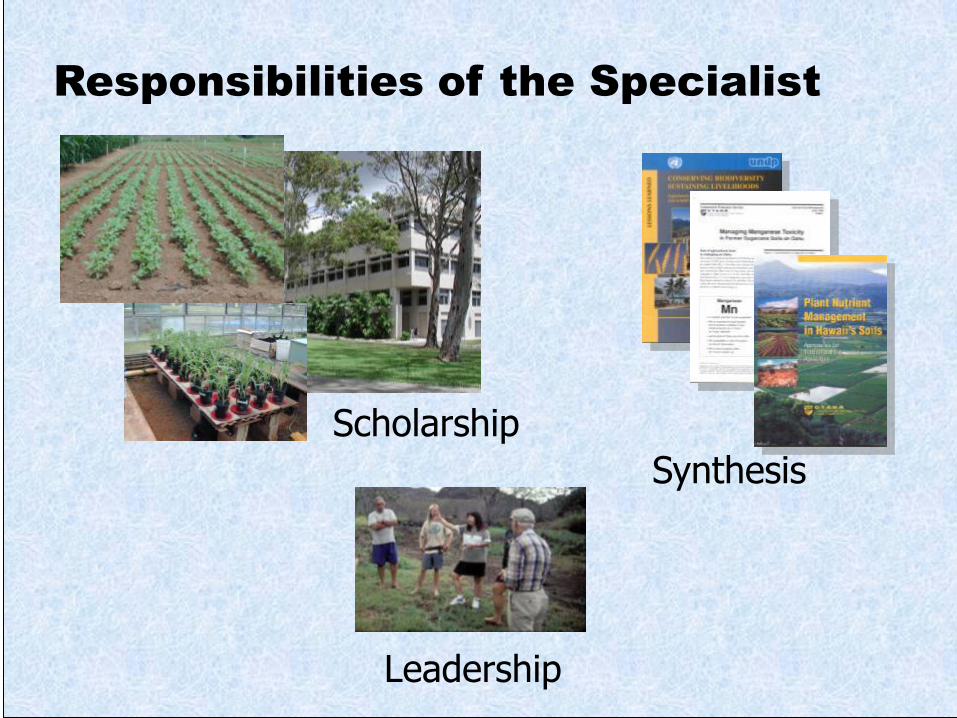
Appropriate Use of Images Responsibilities of the Specialist
Synthesis
Leadership
Scholarship
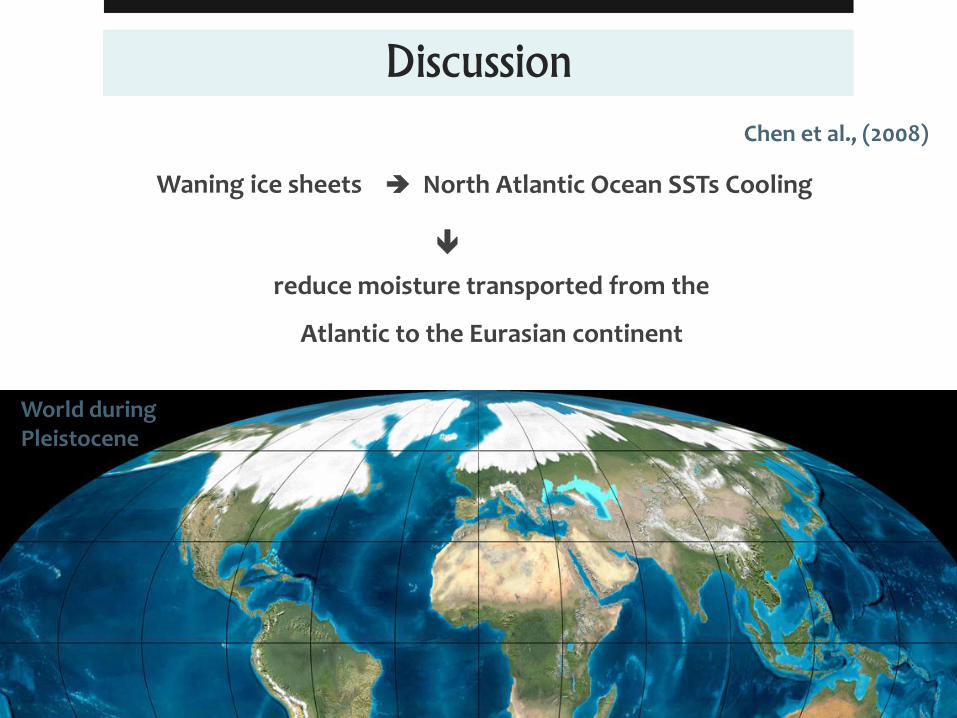
Discussion
Chen et al., (2008)
reduce moisture transported from the
Atlantic to the Eurasian continent
World during Pleistocene
Waning ice sheets North Atlantic Ocean SSTs Cooling
GIF Examples
TIFF Example
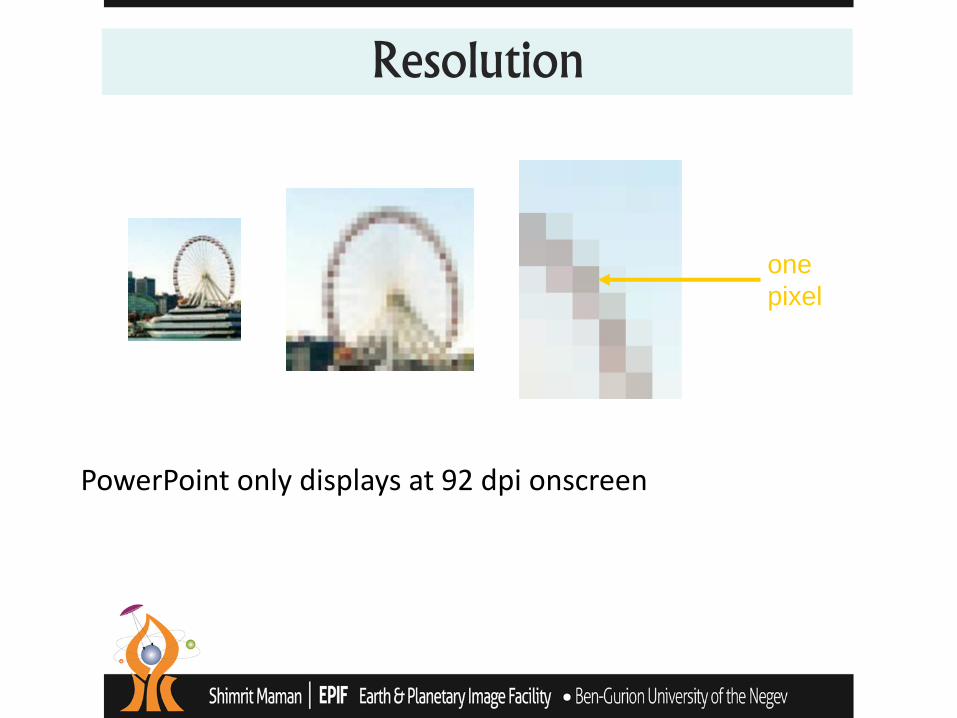
one
pixel
PowerPoint only displays at 92 dpi onscreen
Resolution
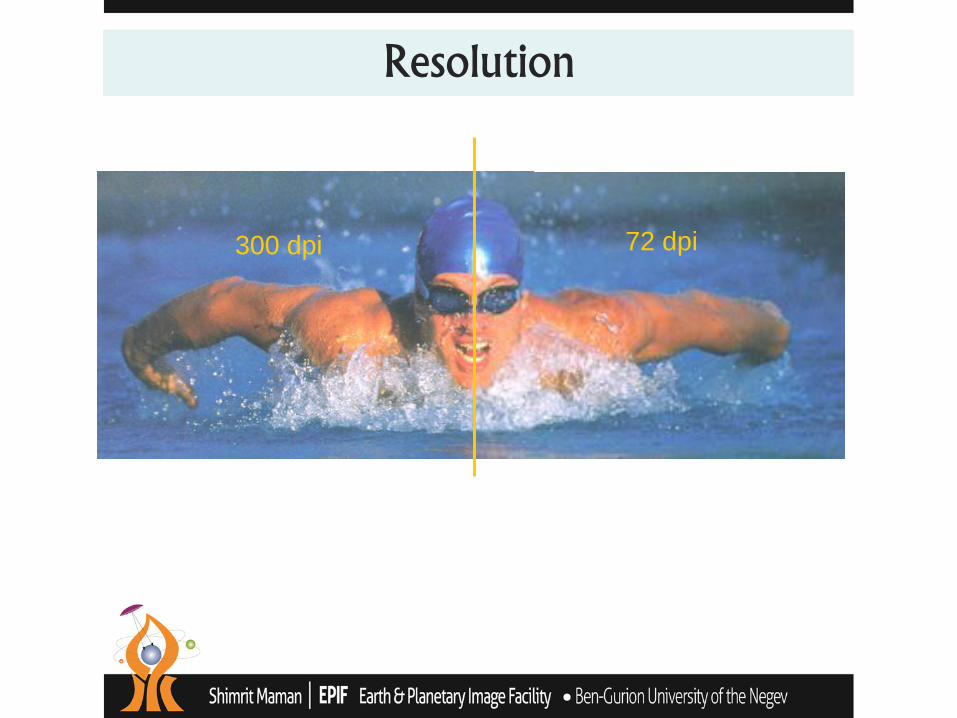
Resolution
300 dpi 72 dpi
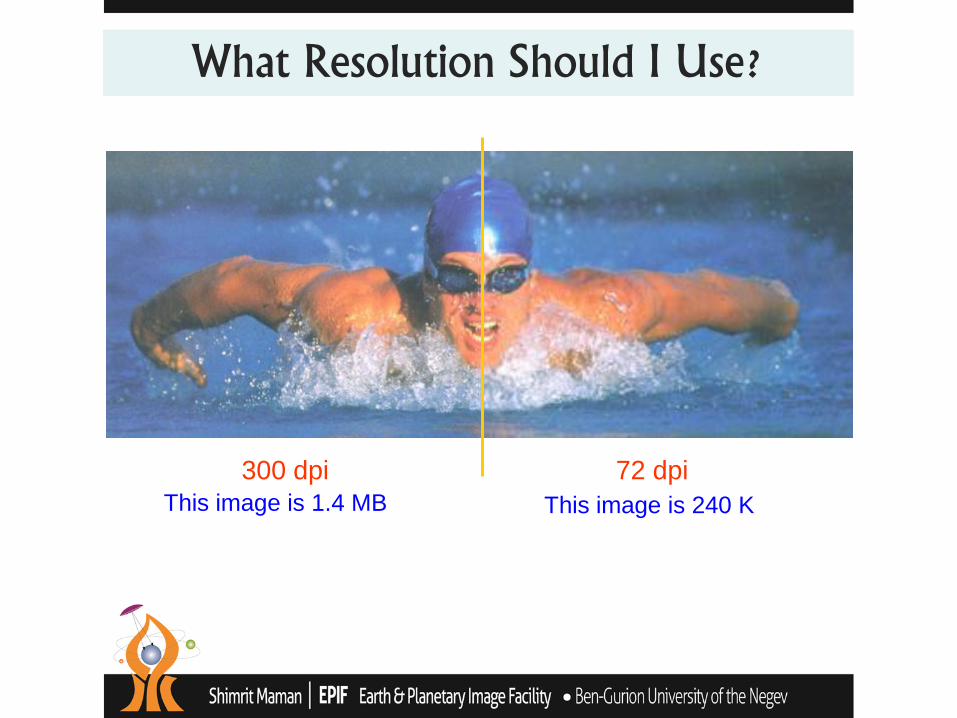
What Resolution Should I Use?
300 dpi 72 dpi
This image is 1.4 MB This image is 240 K
Tip#9 Interactive ppt
Be able to jump to any slide
Blank the screen
Draw on the screen
Screen Shots
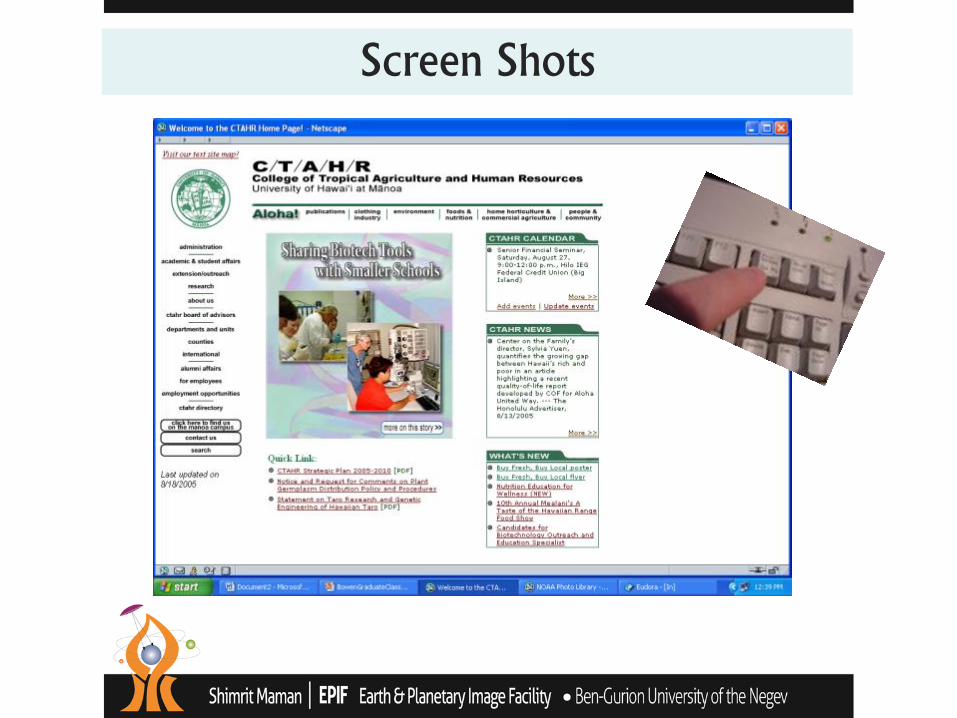
Screen Shots
Tip #10
Proof read!
Special resolution
Summery VS. Summary
For example
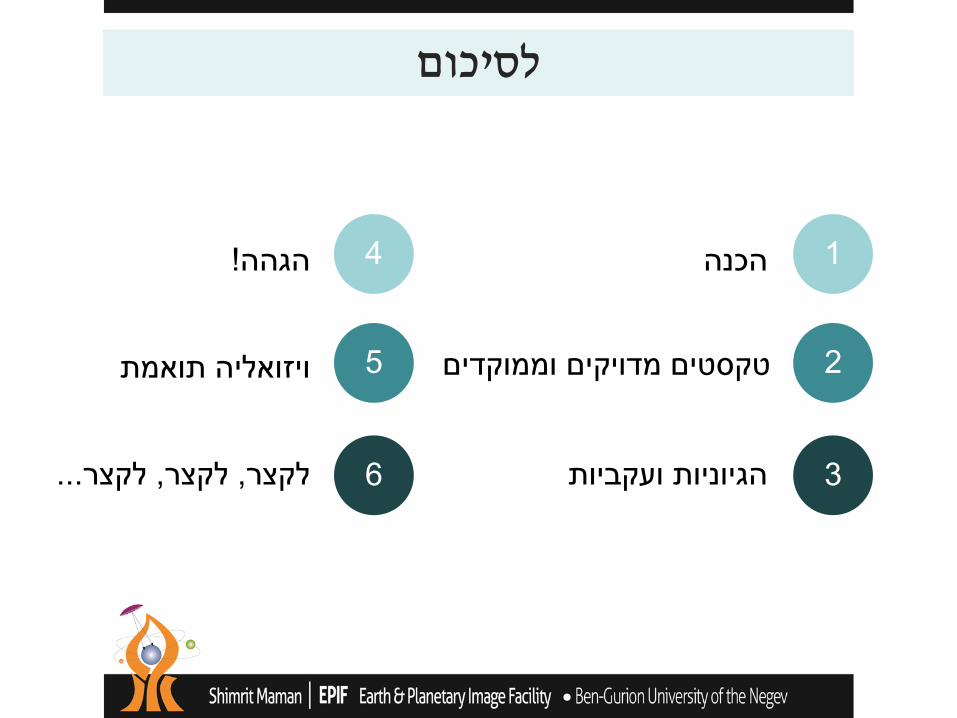
לסיכום
1
2
3
הכנה
טקסטים מדויקים וממוקדים
הגיוניות ועקביות
!הגהה
ויזואליה תואמת
...לקצר, לקצר, לקצר
4
5
6
?שאלות
RDD Formation
Models
Reanalysis Indices
SRTM
Classification Vegetation Sand patches
Spectra
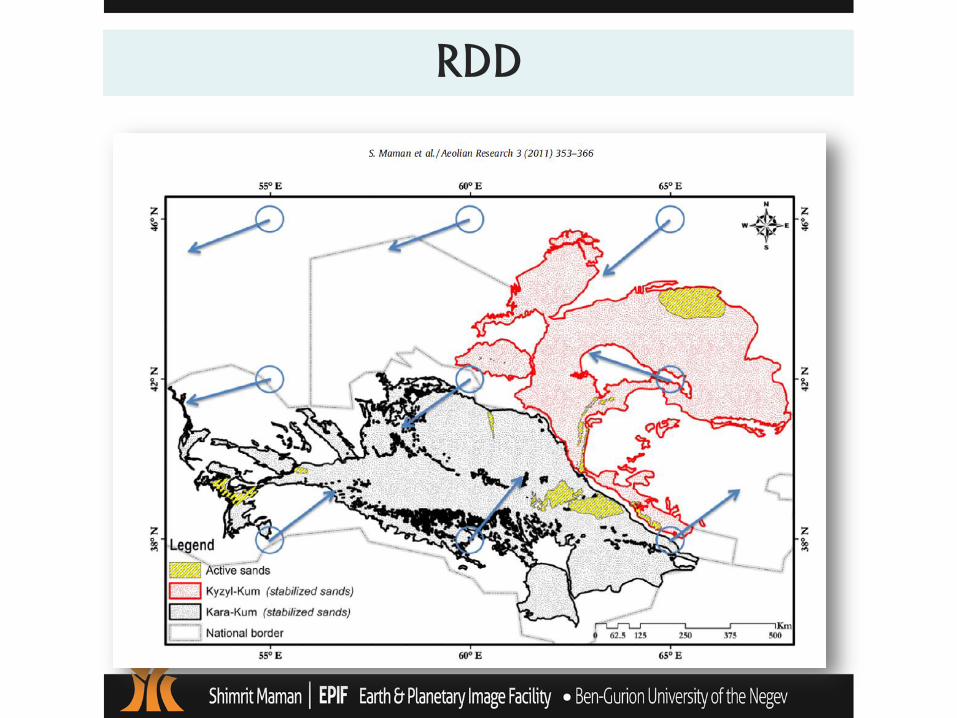
RDD
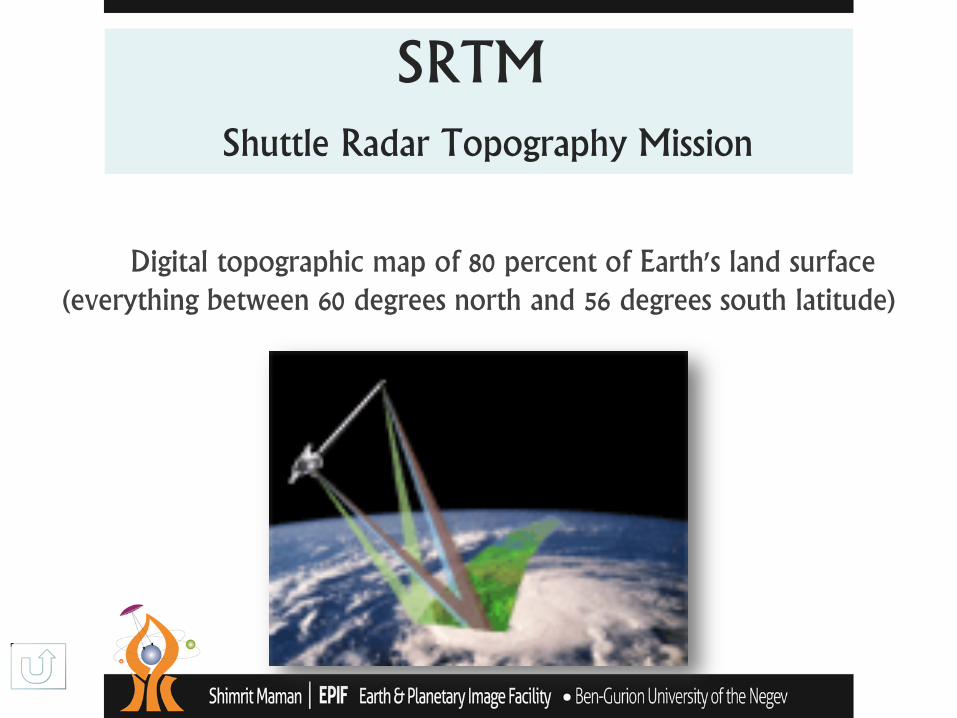
SRTM Shuttle Radar Topography Mission
Digital topographic map of 80 percent of Earth's land surface (everything between 60 degrees north and 56 degrees south latitude)
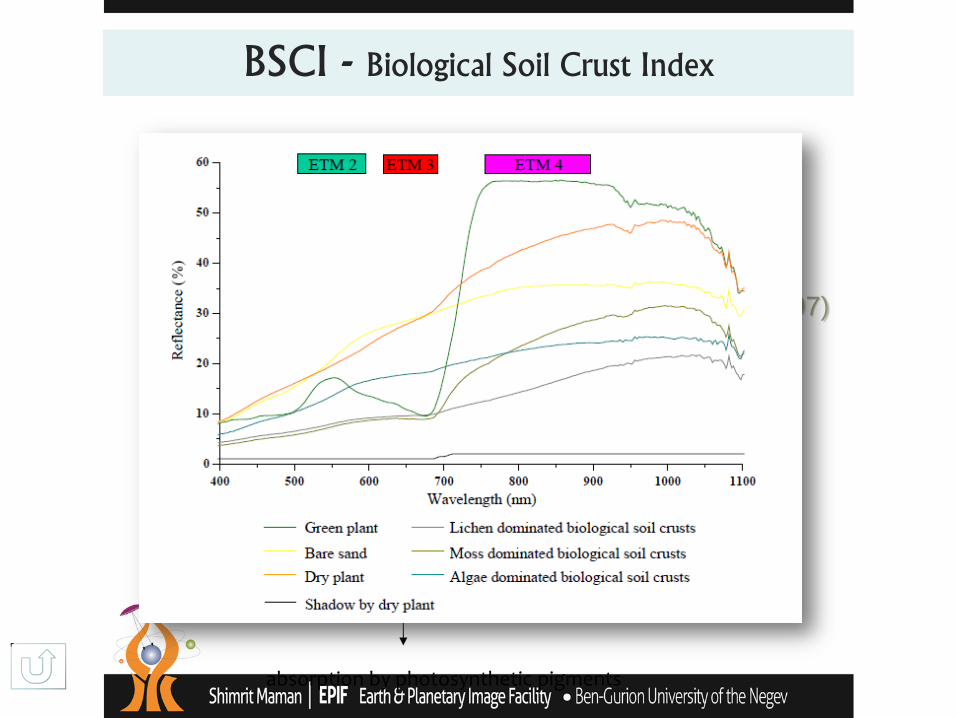
BSCI - Biological Soil Crust Index
absorption by photosynthetic pigments
CI=1−(RED−BLUE)/(RED+BLUE)
Karnieli (1997)
mean
GRNIR
greenred
R
RRLBSCI
1
Chen et. al (2005)
!בהצלחה