effective moisture diffusivity in porous materials as a function of temperature and moisture content
TRANSCRIPT
Biotechnol. Prog. 1990, 6, 67-75 67
Effective Moisture Diffusivity in Porous Materials as a Function of Temperature and Moisture Contentt
C. H. Tong and D. B. Lund* Department of Food Science, Cook College, Rutgers University, P.O. Box 231, New Brunswick, New Jersey 08903
Regular regime theory was used to evaluate the effective moisture diffusivity of a commercial white bread, plain sheet muffin, and baking powder biscuit as a function of moisture content based on desorption experiments. Volume shrinkage during dry- ing was also monitored. The existence of regular regime periods in desorption pro- cesses for porous baked products was experimentally verified. Effective moisture dif- fusivity a t temperatures between 20 and 100 “C ranged from 2.5 X cm2/s in the moisture range of 0.1-0.7 g of H,O/g of solid for bread, 9.35 X lo4 to 9.7 X lo-* cm2/s in the moisture range of 0.1-0.65 g of H,O/g of solid for biscuit, and 8.4 X lo4 t o 1.54 X cm2/s in the moisture range of 0.1-0.9 g of H,O/g of solid for muffin. The effect of temperature on effective moisture diffusivity was adequately modeled by the Arrhenius relationship. Activation energies for bread, biscuit, and muffin were found to be independent of moisture content and were 51, 51, and 55 kJ/mol, respectively. Mathematical models to relate the effective moisture diffusiv- ity to temperature and moisture content were developed.
to 5.5 X
Introduction Knowledge of the effective moisture diffusivity of a
food system is essential for mathematical modeling of the drying or adsorption process. However, determina- tion of the diffusion coefficient, and especially its con- centration dependence, is usually a rather cumbersome and laborious task. Reviews on measuring techniques and data analyses were presented by Crank (1) and Crank and Park (2).
Schoeber and colleagues (3-5) developed a regular regime method to determine the concentration-dependent dif- fusion coefficient for systems in which the moisture dif- fusivity decreases with decreasing moisture content below the critical moisture content or for cases where the dry- ing rate is governed by mass transfer inside the drying specimen. “Regular regime” was first introduced in English by Luikov (6) for heat transfer but can be applied to mass transfer equally. The whole process of drying may be divided into three stages. In the first stage, the main role is played by the initial moisture distribution. Any irregularity in the initial distribution affects the mois- ture distribution in the following moments. This period is also called the penetration period. The second stage is referred to as the regular regime. The moisture dis- tribution inside the body does not depend on the initial distribution. The third stage corresponds to a steady state in which the moisture content a t all points is equal to the ambient moisture content (6). The existence of the regular regime period for systems with a constant diffu- sion coefficient can be shown analytically from the solu- tions of Fick’s diffusion equation. However, this phe- nomenon has also been found in systems with a strong concentration-dependent diffusion coefficient (3, 7).
A requirement for the application of this technique is knowledge of the regular regime curve, which has been determined experimentally at the desired temperature for the case of constant surface concentration. A com-
+ Paper Number D-10209-4-89 in the N.J. Agricultural Experi- ment Station.
plete description of this method and data analyses was given by Luyben et al. (7).
Unlike the method developed by Crank and Park (81, the concentration-dependent De, at one temperature can be calculated from one sorption experiment by the reg- ular regime method. Another advantage of the regular regime method is that this technique can be applied to systems with any degree of shrinkage since a reference- component mass-centered coordinate is used (3, 5, 9, 10). The regular regime method has been successfully applied to measure a number of liquid and solid foods with reasonable accuracy (7, 10, 11).
Generally, temperature dependence of the diffusion coef- ficient can be described by the Arrhenius equation (3,5, 7, 12-18), which takes the form
D,ff = Do exp(-EdRT) (1) E, has been found to be independent of moisture con- tent (12, 14, 16-18), a linear function of moisture con- tent (15), or an exponential function of moisture content (7), depending on the properties of the material.
The purpose of this work was to verify the existence of the regular regime period for some porous baked dough products and to develop mathematical models to relate the effective moisture diffusivity of these products as a function of temperature and moisture content.
Materials and Methods Effective moisture diffusivities were determined for an
unsliced, commercial white bread (Master Bread, Metz Baking Co., Sioux City, IA), plain sheet muffin, and bak- ing powder biscuit. Materials were stored at -20 OC for 0-4 months before using. Muffin and biscuit samples were stored in plastic freezer bags inside a polystyrene- lined shipping box. Loaves of bread were wrapped in low-density polyethylene bread bags and stored inside large plastic freezer bags in a polystyrene-lined shipping box. No physical deterioration was observed during fro- zen storage.
The experimental apparatus is shown in Figure 1. The
8756-7938/90/3006-0067$02.50/0 0 1990 American Chemical Society and American Institute of Chemical Engineers

Biotechnol. Prog., 1990, Vol. 6, No. 1
S l d r view
Figure 1. Schematic diagram of apparatus for measuring mois- ture diffusivity during dehumidification of solid foods.
basic features of this setup were as follows: (1) An air supply filter (Dayton Electron MFG. Co.,
Chicago, IL) removed any particles and water droplets greater than 5 pm.
(2) A needle valve along with a rotameter (Gilmont Instrument, Inc., Great Neck, NY) controlled the air flow rate.
(3) Two 50-foot sections of thin-walled copper tubing immersed in two water baths (Blue M Electric Co., Blue Island, IL) at the desired temperature heated the air.
(4) A double-pipe drying column (4.4-cm i.d. X 110- cm length) filled with 6-mesh anhydrous calcium sulfate (W. A. Hammond Drierite Co., Xenia, OH) was used to dry the air.
(5) A cone-shaped stainless steel base with an angle of 15' (Figure 2) minimized air turbulence around the sam- ple. The base weighed 11 grams and provided the nec- essary weight to minimize vibrations induced by air flow. The sample was placed vertically on the base and then suspended a t the top of a double-pipe drying column (3.2- cm i.d. X 120-cm length). The air velocity in the column was always greater than 100 cm/s.
(6) A constant-temperature circulator water bath (HAAKE, Germany) controlled the temperature of the columns.
(7) A Mettler Model AE-160 (Mettler Instrument Corp., Hightstown, NJ) digital analytical balance was used to monitor the sample weight as a function of drying time. An IBM PC/AT was used to record the time-weight data through an RS-232 interface card.
(8) Points numbered on Figure 1 were type T thermo- couple wires connected to an ISAAC Model 41A (Cyborg Corp., Newton, MA) APPLE IIe data acquisition system for temperature measurements. Thermocouple number 5 was used to measure the dry-bulb temperature and ther- mocouple 6 was used to measure the wet-bulb tempera- ture. The relative humidity of the air was calculated from the readings of these two thermocouples to make sure that the air was dry enough to give Mi = 0.
Another experiment was conducted using a CEM Model AVC-80 (CEM Corp., Indian Trail, NC) microwave solid analyzer with a built-in analytical balance. The oven was set at 40% power level for bread and 45% power level for biscuit and muffin. Unlike a home microwave oven that cycles power on-off to control power levels, a CEM microwave solid analyzer delivers a constant electric field strength a t a corresponding power level. The time and
Top v i m
t 2.5
c
Figure 2. Schematic of device used to minimize air turbu- lence around sample during convective drying.
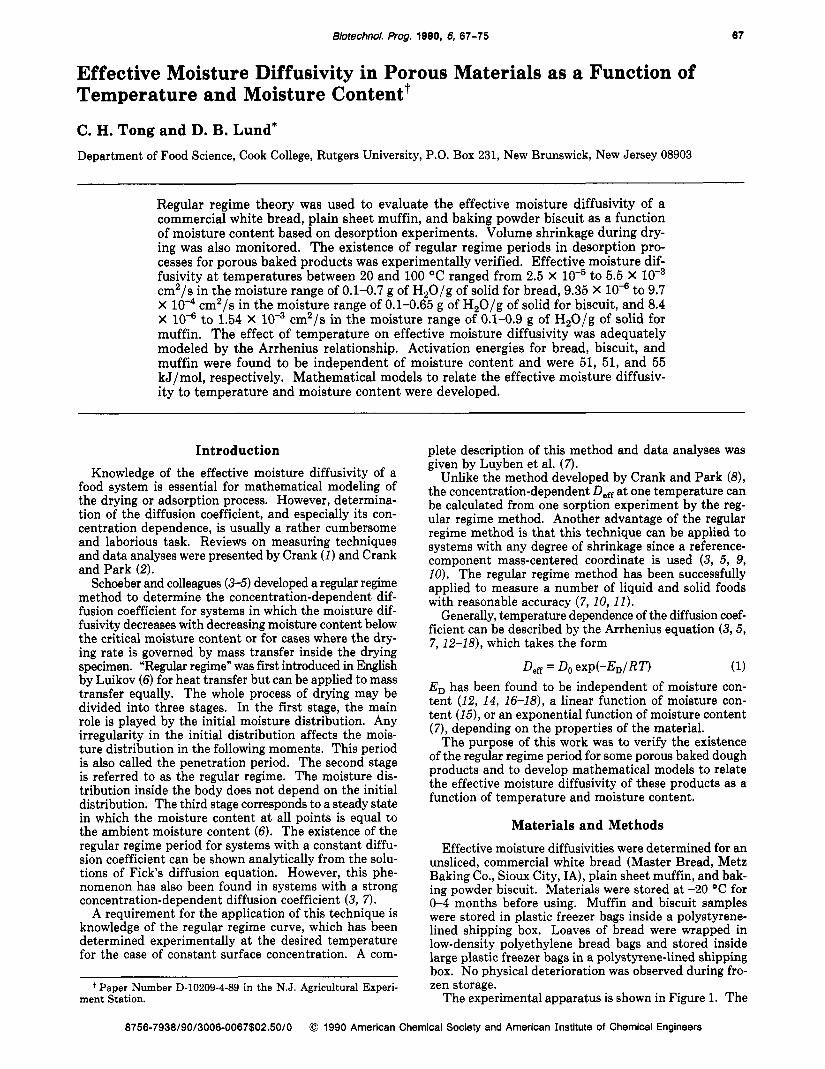
temperature relationships of bread heated in a micro- wave oven a t four different locations measured by a Lux- tron fluoroptic thermometry system (Luxtron Corp., Moun- tainview, CA) are shown in Figure 3. The time required for the sample to reach 100 "C is dependent on the elec- tric field strength and the material's properties. Tem- perature gradients from the center to the surface existed in the period because of evaporative cooling. However, once the sample temperature reached 100 O C , it main- tained an almost constant value and there were no sig- nificant temperature gradients. Similar situations were also found in biscuit and muffin when the temperatures were measured at the center and a location close to the surface (19). This observation agreed with those reported by Lyons et al. (20) and Perkin (21) while measuring tem- perature distributions in cotton samples and beech- wood, respectively, during microwave heating and pro- vided the basis to study the effective moisture diffusiv- ity a t 100 OC for either an infinite slab or an infinite cylinder.
Cylindrical samples (1.2-cm diameter X 8.5-cm length for bread, 1.2 cm X 3 cm for biscuit, and 1.2 cm X 4 cm for muffin for convective drying experiments; 1.7 cm X 4 cm for bread, 1.4 cm X 2.5 cm for biscuit, and 1.4 cm X 3.5 cm for muffin for microwave drying experiments) were used in this study. For microwave heating studies, it was important to keep the sample size small enough to avoid uneven heating due to the uneven distribution of the electric field strength. Samples were cut by a cylin- drical cutter while they were frozen to prevent smash- ing. Both ends of the samples were sealed with epoxy
Biotechnol. Prog., 1990, Vol. 6, No. 1
110
loo
90
80
70
0
50
40
30
20
t3 CENTER
0 2/3 L
+ 1/3 L
A SURFACE
0 10 20 30 TIME (Second)
68
1
40
Figure 3. Temperature distribution of a bread sample during microwave heating.
(Bordon Inc., Columbus, OH) to obtain one-dimensional moisture transfer. Samples were equilibrated at con- trolled temperatures and relative humidities to give the desired initial moisture content (0.8 g of H20/g of solid for bread, 0.58 g of H20/g of solid for biscuit, and 0.92 g of H20/g of solid for muffin). More effort was spent on bread because it was chosen to be the system to study the existence of the regular regime period in baked prod- ucts. Time-weight data were collected in triplicate for bread and in duplicate for biscuit and muffin for each temperature studied. At the end of each experiment, the dry weight of the samples was measured by the vacuum oven method (22), and the radius and length were mea- sured by a vernier caliper to calculate the density of dry solid.
Four low temperatures (20, 27.5, 31.5, and 38.5 OC for bread) and two temperatures (20 and 45 OC for biscuit and 20 and 40 "C for muffin) were chosen in the convec- tive drying experiments to avoid significant tempera- ture profiles in the sample and 100 "C for all three sam- ples in the microwave drying experiments.
The diameter and length of the samples were mea- sured as a function of sample weight by a vernier caliper under the same conditions as the convective and micro- wave experiments to complete dryness.
Results and Discussion Procedures outlined by Luyben et al. (7) were used for
Water flux (jw) relative to the moving interface was data analysis:
calculated as
. -w,dM ' " = A ( M ) d t
The derivative was evaluated by cubic spline approxima- tion. The moisture content decreased exponentially (r2 2 0.99) with respect to time at each temperature for all three samples.
I t was found that the sample volume decreased dur- ing the desorption process for bread, biscuit, and muf-
fin. Therefore, the interfacial area had to be correlated to moisture content. The interfacial area was also found to depend on drying mode as microwave-dried samples shrunk faster than air-dried samples. This phenome- non may have been caused by a flow process of the solid matrix due to the high sample temperature. The nor- malized interfacial area of moisture transfer is defined as
interfacial area at moisture content M, (3) initial interfacial area at moisture content Mo
The normalized interfacial area of air-dried samples as a function of moisture content and air temperature is shown in Figure 4. The degree of shrinkage was found to be independent of temperature for the range studied for all three samples. This finding is consistent with that reported by Karel and Flink (23) in a study of the reduc- tion in surface area of a cellulose slab at different dry- bulb temperatures. For microwave drying, the normal- ized area as a function of moisture content is shown in Figure 5.
Flux parameter (F) was calculated when J, was known:
(4)
where Dops2 = 1. The driving force for a desorption pro- cess with a constant surface concentration was expressed as the average moisture content of the sample at any time minus the interfacial moisture content. Since dry air was used in the study, the interfacial moisture content was zero. Therefore, the driving force was simply equal to the average moisture content.
Drying curves for samples were constructed by express- ing the logarithm of the flux parameter as a function of driving force. In the determination of effective mois- ture diffusivity as a function of moisture content using regular regime theory, one important assumption is the existence of the regular regime period in baked products during the desorption process. If the regular regime period

70 Biotechnol. Prog., 1990, Vol. 6, No. 1
1
0.98
0.96
0.94 tu 4) 0.92
4 0.9
; 0.82
0.88
4) 0.86
.I 0.84
W
N (I
L 0.0
2 0.78
0.76
0.74
0.72
0.7 0 0.2 0.4 0.6 0.8 1
Moisture Content (g water& solid) Figure 4. Normalized interfacial area of air-dried bread, biscuit, and muffin samples as a function of moisture content and tem- perature.
1
0.95
0.9
0.85
0.8
0.75
0.7
0.65
0.6
0.55
0.5
0 Bread; Run 1 Bread; Run 2 - Bread; Average
A B i s c u i t ; Run 1 A B i s c u i t ; Run 2 --- B i s c u i t ; Average
0 M u f f i n ; Run 1 M u f f i n ; Run 1 --- M u f f i n ; Average
0 0.2 0.4 0.6 0.8 1
Moisture Content (g water& solid) Figure 5. Normalized interfacial area of microwave-dried bread, biscuit, and muffin samples as a function of moisture content a t 100 "C.
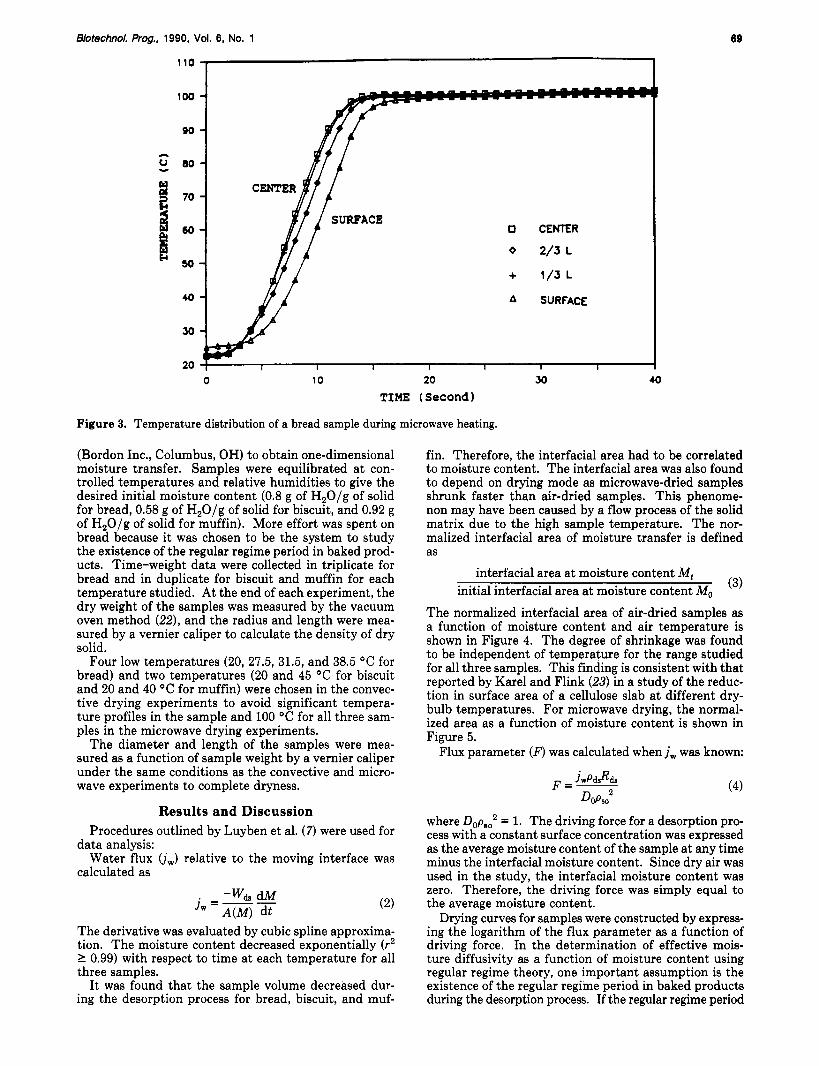
does exist, all drying curves for the same material, a t one temperature, for the same geometry merge into one curve (regular regime curve) regardless of initial moisture con- tent.
The two drying curves for bread shown in Figure 6, a t 31.5 "C and initial moisture contents of 0.865 g of H,O/ g of solid and 0.97 g of H,O/g of solid, virtually col-
lapsed into one curve within experimental error. There- fore, it is possible to conclude that the regular regime period does exist in bread in the moisture range of 0- 0.86 g of H,O/g of solid. Although no verifications were performed on biscuit and muffin, it is believed that reg- ular regime periods also exist because of the similarity between these products.
Biotechnol. Prog., 1990, Vol. 6, No. 1
2.OE-06
L - 4)
1.OE-06 tu L tu X s
L h
n - 5.OE-07
pr
i 0 0.2 0.4 0.6 0.8 1 .o
Moisture Content (g/g) Figure 6. Drying curves of bread at 31.5 "C with two different initial moisture contents.
T 1 .OE-03
I 100 c
l.0E-07 i/' -+se- Bread - Blrcult - Muffin
1.OE-OS -1
0 0.2 0.4 0.6 0.8 1
Moisture Content (g/g) Figure 7. Regular regime curves for bread, biscuit, and muf- fin during dehumidification a t various temperatures.
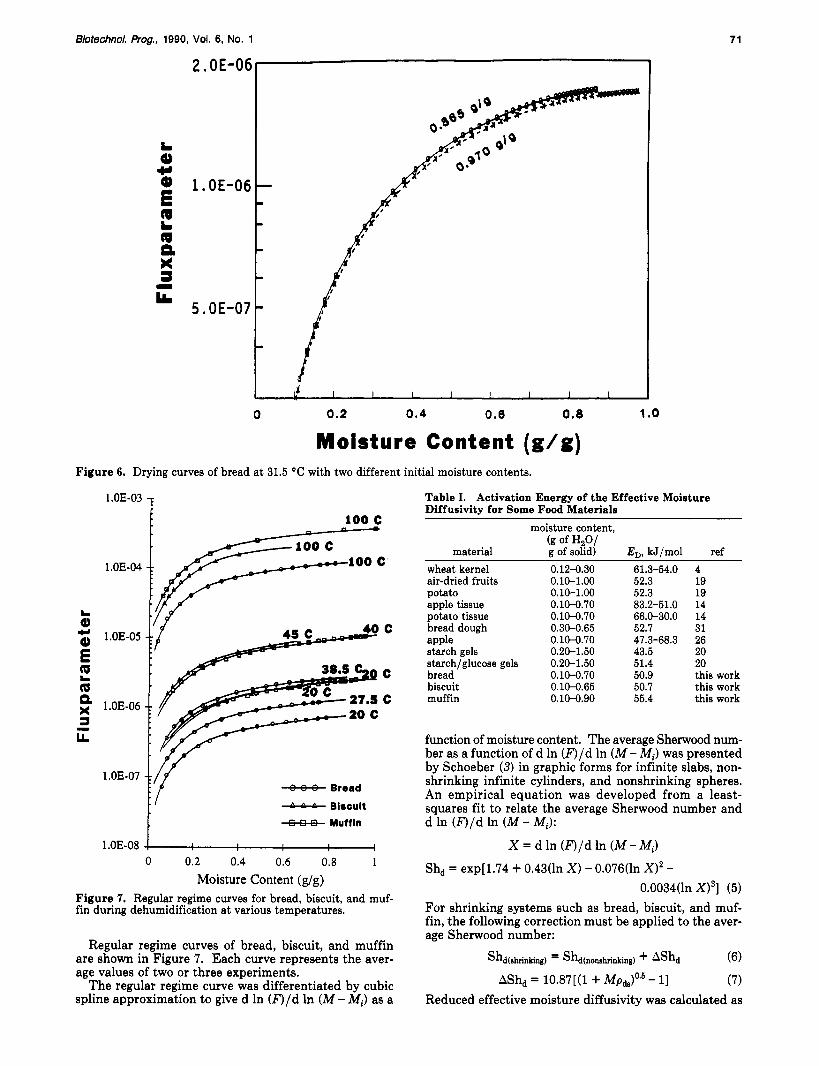
Regular regime curves of bread, biscuit, and muffin are shown in Figure 7. Each curve represents the aver- age values of two or three experiments.
The regular regime curve was differentiated by cubic spline approximation to give d In (F)/d In ( M - Mi) as a
Table I. Activation Energy of the Effective Moisture Diffusivity for Some Food Materials
71
moisture content,
material wheat kernel air-dried fruits potato apple tissue potato tissue bread dough
starch gels starch/glucose gels bread biscuit muffin
apple
(g of b o / g of solid) 0.12-0.30 0.10-1.00 0.10-1.00 0.10-0.70 0.10-0.70 0.30-0.65 0.10-0.70 0.20-1.50 0.20-1.50 0.10-0.70 0.10-0.65 0.10-0.90
ED, kJ / mol 61.3-54.0 52.3 52.3 83.2-51.0 66.0-30.0 52.7 47.3-68.3 43.5 51.4 50.9 50.7 55.4
ref 4 19 19 14 14 31 26 20 20 this work this work this work
function of moisture content. The average Sherwood num- ber as a function of d In (F)/d In ( M - Mi) was presented by Schoeber (3) in graphic forms for infinite slabs, non- shrinking infinite cylinders, and nonshrinking spheres. An empirical equation was developed from a least- squares fit to relate the average Sherwood number and d In (F)/d In ( M - Mi):
X = d In (F)/d In ( M - Mi)
Shd = exp[1.74 + 0.43(ln X) - 0.076(ln X ) 2 - 0.0034(ln X ) 3 ] (5)
For shrinking systems such as bread, biscuit, and muf- fin, the following correction must be applied to the aver- age Sherwood number:
Shd(shrinking) = Shd(nonshrinking) + AShd (6)
(7) Reduced effective moisture diffusivity was calculated as
AShd = 10.87[(1 + k f p ~ ) ' ' ~ - 11
72 Biotechnol. Prog., 1990, Vol. 6, No. 1
t 1. oE-03b- Model
0 Experimental data
t I O v “ I I I I I I I
0 0.15 0.30 0.45 0.80 0.75
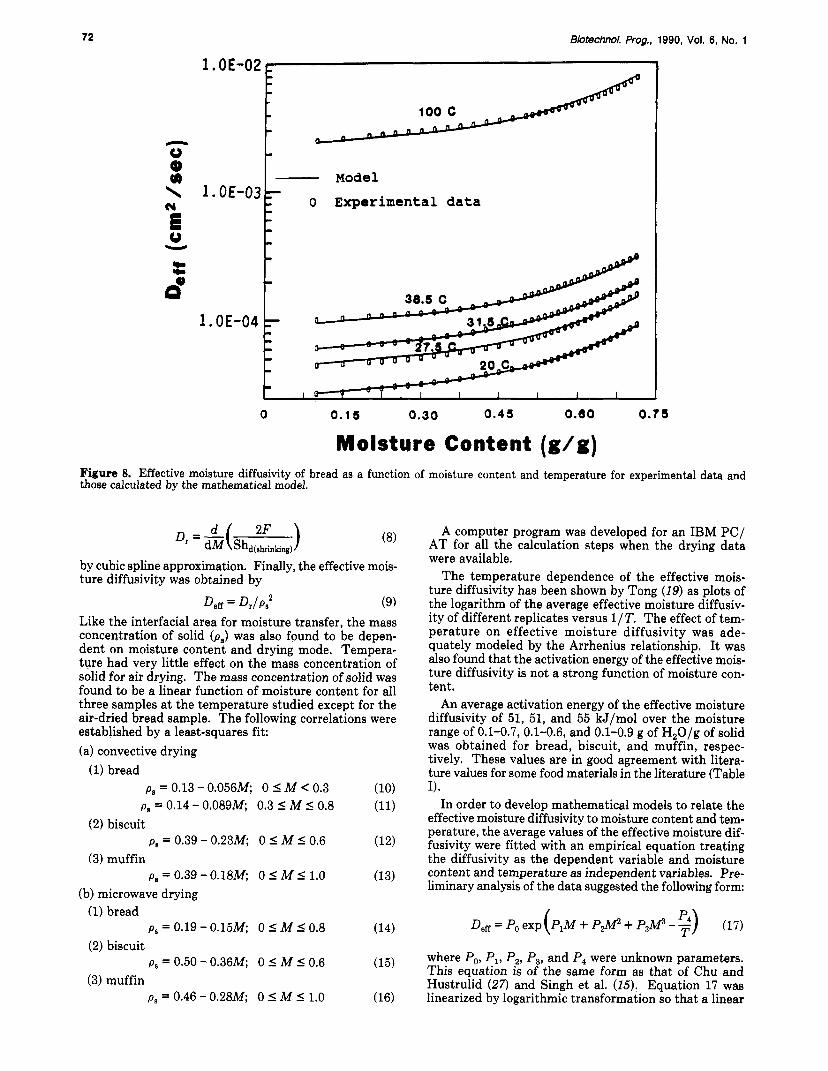
Moisture Content (g/g) Figure 8. Effective moisture diffusivity of bread as a function of moisture content and temperature for experimental data and those calculated by the mathematical model.
by cubic spline approximation. Finally, the effective mois- ture diffusivity was obtained by
Like the interfacial area for moisture transfer, the mass concentration of solid (p , ) was also found to be depen- dent on moisture content and drying mode. Tempera- ture had very little effect on the mass concentration of solid for air drying. The mass concentration of solid was found to be a linear function of moisture content for all three samples a t the temperature studied except for the air-dried bread sample. The following correlations were established by a least-squares fit: (a) convective drying
Deff = D h , 2 (9)
(1) bread ps = 0.13 - 0.056M, 0 I M < 0.3
ps = 0.14 - 0.089M 0.3 I M 5 0.8 (10) (11)
p s = 0.39 - 0.23M; 0 I M 50.6 (12)
pa = 0.39 - 0.18M, 0 5 M I 1.0 (13)
(2) biscuit
(3) muffin
(b) microwave drying (1) bread
(2) biscuit
(3) muffin
ps = 0.19 - 0.15M; 0 I M 50.8 (14)
p s = 0.50 - 0.36M 0 I M I 0.6 (15)
ps = 0.46 - 0.28M 0 I M I 1.0 (16)
A computer program was developed for an IBM PC/ AT for all the calculation steps when the drying data were available.
The temperature dependence of the effective mois- ture diffusivity has been shown by Tong (19) as plots of the logarithm of the average effective moisture diffusiv- ity of different replicates versus 1/T. The effect of tem- perature on effective moisture diffusivity was ade- quately modeled by the Arrhenius relationship. I t was also found that the activation energy of the effective mois- ture diffusivity is not a strong function of moisture con- tent.
An average activation energy of the effective moisture diffusivity of 51, 51, and 55 kJ/mol over the moisture range of 0.1-0.7, 0.1-0.6, and 0.1-0.9 g of H,O/g of solid was obtained for bread, biscuit, and muffin, respec- tively. These values are in good agreement with litera- ture values for some food materials in the literature (Table I).
In order to develop mathematical models to relate the effective moisture diffusivity to moisture content and tem- perature, the average values of the effective moisture dif- fusivity were fitted with an empirical equation treating the diffusivity as the dependent variable and moisture content and temperature as independent variables. Pre- liminary analysis of the data suggested the following form:
(1 7)
where Po, PI, P2, P3, and P4 were unknown parameters. This equation is of the same form as that of Chu and Hustrulid (27) and Singh et al. (15). Equation 17 was linearized by logarithmic transformation so that a linear
Deff = Po exp (P,M + P2M + P3@ - p4 T )
Biotechnol. Prog., 1990, Vol. 6, No. 1 73
0
3:
U
d i ,O E -0 5
0 20 c + 45 c 0 100 c
MODEL
+#+WH-i+ -+++++++ + + + + + + + + + ++ttttte*
I I I I I I I I I I I
Om05 Om15 Om25 Om35 Om45 OmSS
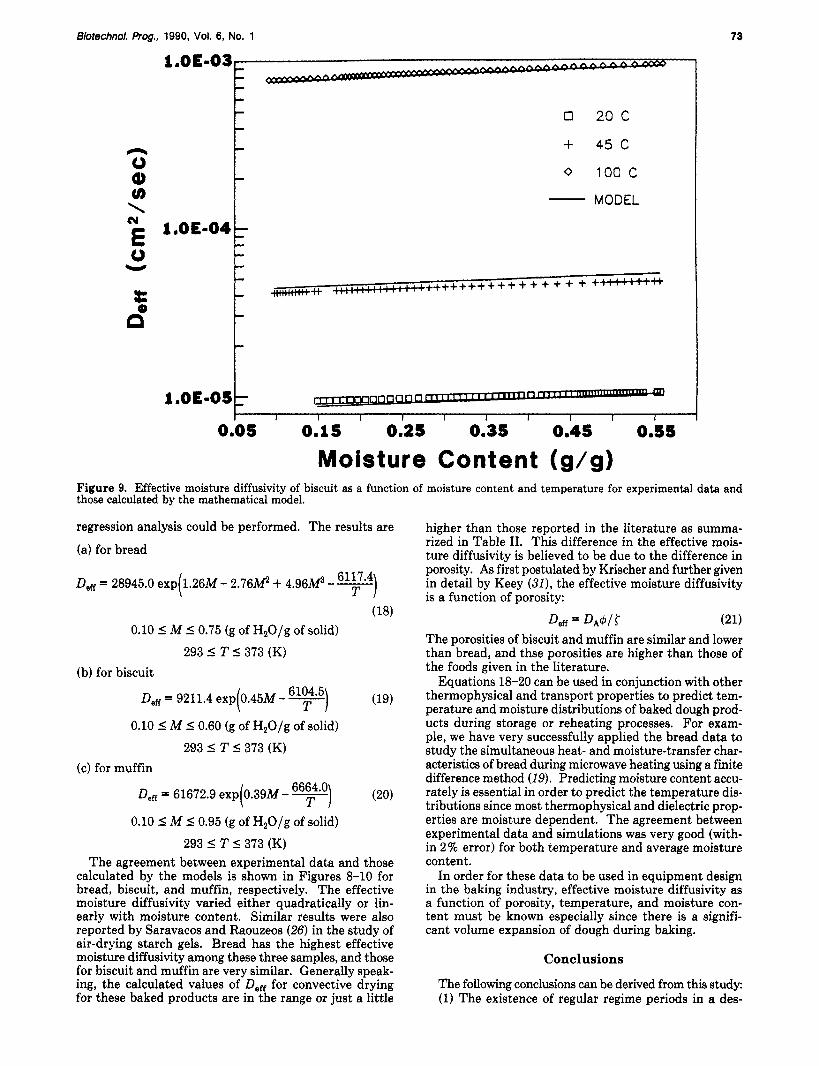
Moisture Content (g/g) Figure 9. Effective moisture diffusivity of biscuit as a function of moisture content and temperature for experimental data and those calculated by the mathematical model.
regression analysis could be performed. The results are
(a) for bread
Deff = 28945.0 exp( 1.26M - 2 . 7 6 p + 4.96M -
0.10 I M I 0.75 (g of H,O/g of solid)
293 I T I 373 (K)
Deff = 9211.4 exp 0.45M - - 61oT4.5)
0.10 I M 50.60 (g of H,O/g of solid)
293 I T I 373 (K)
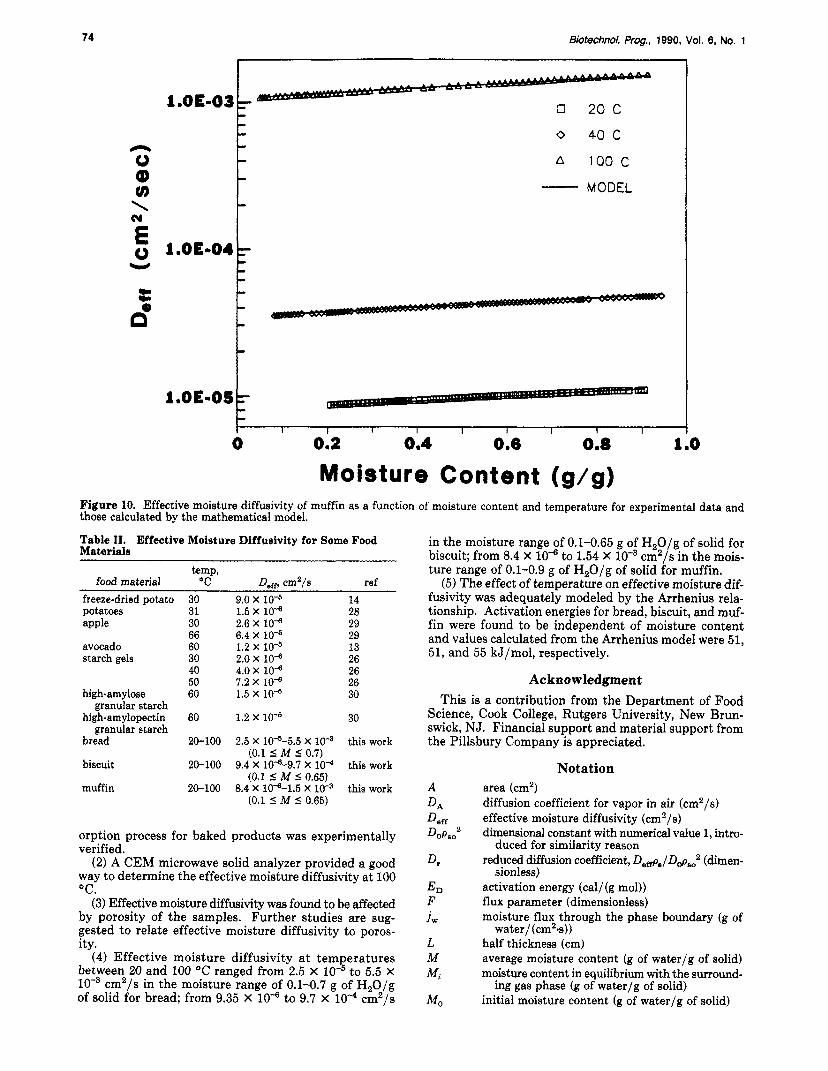
Deff = 61672.9 exp 0.39M - - 6 6 y )
0.10 I M I 0.95 (g of H,O/g of solid)
(18)
(b) for biscuit
(19) (
( (c) for muffin
(20)
293 I T I 373 (K) The agreement between experimental data and those
calculated by the models is shown in Figures 8-10 for bread, biscuit, and muffin, respectively. The effective moisture diffusivity varied either quadratically or lin- early with moisture content. Similar results were also reported by Saravacos and Raouzeos (26) in the study of air-drying starch gels. Bread has the highest effective moisture diffusivity among these three samples, and those for biscuit and muffin are very similar. Generally speak- ing, the calculated values of De, for convective drying for these baked products are in the range or just a little
higher than those reported in the literature as summa- rized in Table 11. This difference in the effective mois- ture diffusivity is believed to be due to the difference in porosity. As first postulated by Krischer and further given in detail by Keey ( 3 3 , the effective moisture diffusivity is a function of porosity:
De€f= DA$/C (21) The porosities of biscuit and muffin are similar and lower than bread, and thse porosities are higher than those of the foods given in the literature.
Equations 18-20 can be used in conjunction with other thermophysical and transport properties to predict tem- perature and moisture distributions of baked dough prod- ucts during storage or reheating processes. For exam- ple, we have very successfully applied the bread data to study the simultaneous heat- and moisture-transfer char- acteristics of bread during microwave heating using a finite difference method (19). Predicting moisture content accu- rately is essential in order to predict the temperature dis- tributions since most thermophysical and dielectric prop- erties are moisture dependent. The agreement between experimental data and simulations was very good (with- in 2% error) for both temperature and average moisture content.
In order for these data to be used in equipment design in the baking industry, effective moisture diffusivity as a function of porosity, temperature, and moisture con- tent must be known especially since there is a signifi- cant volume expansion of dough during baking.
Conclusions
The following conclusions can be derived from this study: (1) The existence of regular regime periods in a des-
74 Biotechnol. Prog., 1990, Vol. 6, No. 1
1 SO€-03 L
~
1 .OE-04
t t
0 20 c 0 40 C
A 100 C
MODEL
I I I I I I I I 1 I
0 0.2 0.4 0.6 0.8 1 .o Moisture Content ( g i g )
Figure 10. Effective moisture diffusivity of muffin as a function of moisture content and temperature for experimental data and those calculated by the mathematical model.
Table 11. Effective Moisture Diffusivity for Some Food Materials
temp, food material "C D.ch cm2/s ref
freeze-dried potato potatoes apple
avocado starch gels
high-amylose granular starch
high-amylopectin granular starch
bread
biscuit
muffin
30 31 30 66 60 30 40 50 60
60
20-100
20-100
20-100
9.0 x 10⁻⁵
6.4 x 10⁻⁵
1.5 X 10* 2.6 X lo4
1.2 x 10⁻⁶ 2.0 x 10⁻⁸ 4.0 X 10" 7.2 X 10- 1.5 x 10⁻⁵
1.2 x 10⁻⁵
2.5 X 10⁻⁶-5.5 X (0.1 5 M 50.7)
(0.1 5 M 50.65)
(0.1 5 M 5 0.65)
9.4 X 10*-9.7 X lo4
8.4 X l0*-1.5 X
14 28 29 29 13 26 26 26 30
30
this work
this work
this work
orption process for baked products was experimentally verified.
(2) A CEM microwave solid analyzer provided a good way to determine the effective moisture diffusivity at 100 "C.
(3) Effective moisture diffusivity was found to be affected by porosity of the samples. Further studies are sug- gested to relate effective moisture diffusivity to poros- ity.
(4) Effective moisture diffusivity a t temperatures between 20 and 100 "C ranged from 2.5 x to 5.5 x
cm2/s in the moisture range of 0.1-0.7 g of H,O/g of solid for bread; from 9.35 X lo4 to 9.7 x cm2/s
in the moisture range of 0.1-0.65 g of H20/g of solid for biscuit; from 8.4 X lo4 to 1.54 X cmz/s in the mois- ture range of 0.1-0.9 g of H20/g of solid for muffin,
(5) The effect of temperature on effective moisture dif- fusivity was adequately modeled by the Arrhenius rela- tionship. Activation energies for bread, biscuit, and muf- fin were found to be independent of moisture content and values calculated from the Arrhenius model were 51, 51, and 55 kJ/mol, respectively.
Acknowledgment This is a contribution from the Department of Food
Science, Cook College, Rutgers University, New Brun- swick, NJ. Financial support and material support from the Pillsbury Company is appreciated.
Notation area (cm2) diffusion coefficient for vapor in air (cmz/s) effective moisture diffusivity (cm2/s) dimensional constant with numerical value 1, intro-
reduced diffusion coefficient, D,@JDopSo2 (dimen-
activation energy (cal/(g mol)) flux parameter (dimensionless) moisture flux through the phase boundary (g of
water/ (cm2.s)) half thickness (cm) average moisture content (g of water/g of solid) moisture content in equilibrium with the surround-
initial moisture content (g of water/g of solid)
duced for similarity reason
sionless)
ing gas phase (g of water/g of solid)
Biotechnol. Prog., 1990, Vol. 6, No. 1
of solid) average moisture content at time t (g of water/g
radius of dry solid (cm) average Sherwood number for the disperse phase
Mt
Rds
Shd
T temperature (K) t time ( s ) Wd, pds
p ,
r tortuosity (dimensionless) 4J porosity (dimensionless)
(dimensionless)
weight of dry solid (9) density of dry solid sample (g of solid/cm3 of dry
mass concentration of solid (g of solid/cm3 of sam- solid sample)
d e )
Literature Cited 1. Crank, J. The Mathematics of Diffusion; 2nd ed.; Oxford
University Press: London, 1975. 2. Crank, J.; Park, G. S. Diffusion i n Polymers; Academic Press:
London, 1968. 3. Schoeber, W. J. A. H. Regular Regimes in Sorption Pro-
cesses. Ph.D. Thesis, Eindhoven University of Technology, The Netherlands, 1976.
4. Schoeber, W. J. A. H. In Proceedings of The First Znterna- tional Symposium on Drying; Mujumdar, A. S., Ed.; Science Press: Princeton, NJ, 1978; pp 1-9.
5. Schoeber, W. J. A. H.; Thijssen, H. A. C. AZChE Symp . Ser.
6. Luikov, A. V. Analytical Heat Diffusion Theory; Academic Press: New York, NY, 1968.
7. Luyben, K. Ch. A. M.; Olieman, J. J.; Bruin, S. In Drying '80; Mujumdar, A. S., Ed.; Hemisphere: New York, NY, 1980; Vol. 2, pp 233-243.
8. Crank, J.; Park, G. S. Trans. Faraday SOC. 1949, 45, 240- 249.
9. Coumans, W. J.; Thijssen, H. A. C. In Drying '86; Mujum- dar, A. S., Ed.; Hemisphere: New York, NY, 1986; Vol. 1, pp
10. Sano, Y.; Yamamoto, S. In Drying '86; Mujumdar, A. S., Ed.; Hemisphere: New York, NY, 1986; Vol. 1, pp 85-93.
11. Singh, R. K.; Kinetics and Computer Simulation of Storage Stability in Intermediate Moisture Foods. Ph.D. Thesis, Uni- versity of Wisconsin-Madison, 1983.
1977, 73, 12-24.
49-56.
75
12. Aguerre, R.; Suarez, C.; Viollaz, P. E. J . Food Technol.
13. Alzamora, S.; Chirife, J. J . Food Sci. 1980, 45, 1649-1657. 14. Saravacos, G. D.; Charm, S. E. Food Technol. 1962,16 ( l ) ,
15. Singh, R. K.; Lund, D. B.; Buelow, F. H. In Engineering and Food; McKenna, B. M., Ed.; Elsevier Applied Science: London, 1984; Vol. 1, pp 415-423.
16. Suarez, C.; Viollaz, P.; Chirife, J. J . Food Technol. 1980,15 ( 5 ) , 523-531.
17. Vaccarezza, L. M.; Chirife, J. J. Food Sci. 1978, 43, 236- 238.
18. Vaccarezza, L. M.; Lambardi, J. L.; Chirife, J. J. Food Technol. 1974,9, 317-327.
19. Tong, C H. Microwave Heating of Baked Dough Products with Simultaneous Heat and Moisture Transfer. Ph.D. The- sis, University of Wisconsin-Madison, 1988.
20. Lyons, D. W.; Hatcher, J. D.; Sunderland, J. E. Znt. J. Heat Mass Transfer 1972,15, 897-905.
21. Perkin, R. M. J. Sep. Process Technol. 1979, 1, 14-23. 22. Official Methods of Analysis, 14th ed.; Association of Offi-
cial Analytical Chemists: Washington, DC, 1984. 23. Karel, M.; Flink, J. M. In Advances i n Drying; Mujumdar,
A. S., Ed.; Hemisphere: New York, 1983; Vol. 2, pp 103-153. 24. Becker, H. A.; Sallans, H. R. Cereal Chem. 1955, 32, 212-
226. 25. Yoon, J. Heat and Moisture Transfer during Bread Baking.
M.S. Thesis, University of Minnesota, St. Paul, 1985. 26. Saravacos, G. D.; Raouzeou, G. S. In Engineering and
Food; McKenna, B. M., Ed.; Elsevier Applied Science: Lon- don, 1984; Vol. 1, pp 499-507.
21. Chu, S. T.; Hustrulid, A. Trans. A S A E 1968, 11, 705-708. 28. Lawrence, J. G.; Scott, R. P. W. Nature 1966,210,301-303. 29. Rotstein, E.; Laura, P. A.; Cemborain, M. E. J. Food Sci.
30. Saravacos, G. D.; Drouzas, A.; Marousis, S.; Kostaropoulos, A. Paper presented in the 6th International Drying Sympo- sium, Paris, 1988.
31. Keey, R. B. Drying Principles and Practice; Pergamon Press: New York, NY, 1972.
1982,17,679-686.
78-81.
1974,39,627-631.
Accepted October 10, 1989.
Registry No. H,O, 7732-18-5.