effective energy from waste for smart · pdf fileeffective energy from waste for smart city...
TRANSCRIPT

1
Moving Towards ASEAN Smart Cities
Transforming Plastics Scrap to Smart Plastics
& Smart Factory
7th
June 2017
Kian Seah
Managing Director
www.henghiap.com
Effective Energy from Waste for Smart City
Heng Hiap Industries Sdn Bhd
2
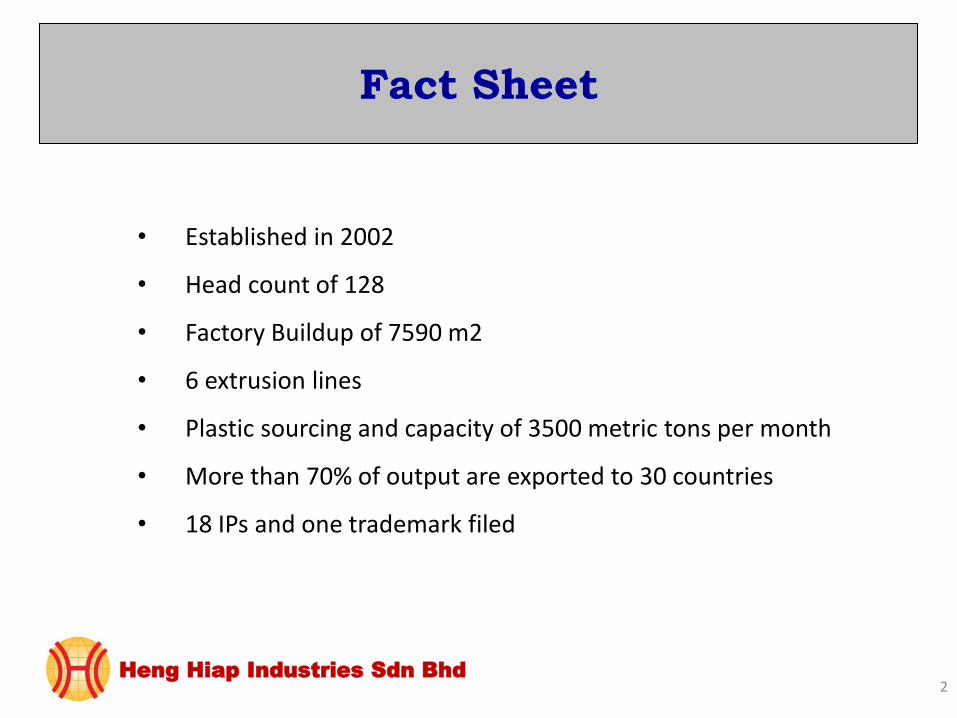
• Established in 2002
• Head count of 128
• Factory Buildup of 7590 m2
• 6 extrusion lines
• Plastic sourcing and capacity of 3500 metric tons per month
• More than 70% of output are exported to 30 countries
• 18 IPs and one trademark filed
Fact Sheet
Heng Hiap Industries Sdn Bhd

3
• ISO 9001 and ISO 14001
• Product Excellence Award by MITI 2011
• Enterprise 50
• Green Building Index (Gold Level)
• Green Label Singapore
• Plastic Innovation Award by Society of Plastic Engineer (SPE) in USA
• Ten Outstanding Young Persons (TOYP) under Environmental Leadership of JCI, Brazil 2013
Certifications and Recognitions
Heng Hiap Industries Sdn Bhd

collectors
store
transportation sorting packing loading transportation
unloading
crushing forklift storage forklift forklift washing
forklift mix color matching forklift transportation transportation extrusion
transportation
Confronting Inherited Industrial Weaknesses
4 Heng Hiap Industries Sdn Bhd

collection Automatic Sorter Crusher Washing and Treatment System
Automated Filling and Blending System Customization Extrusion System Packing Silo Metal Separator
5
INTEGRATED SUPPLY CHAIN
Heng Hiap Industries Sdn Bhd

6
•Fast Cycle Polypropylene which reduces 50% cycle time from 10 seconds to 5 seconds •Anti Bacteria Polypropylene which reduces surface bacteria count by > 90% •Protein Induced Polypropylene which leverages on micro organism mechanism to bio degrade completely within 655 days •Fire Retardant Polypropylene which prevents finished parts from catching fire and fulfil European UL V0 standard •Electric Conductive Polypropylene which is enabled by Nanotechnology
Uniqueness of Smart Plastics
Heng Hiap Industries Sdn Bhd

7
Waste to Value Vision
Thermal Recycling
Chemical Recycling
Responsible Innovation
Heng Hiap Industries Sdn Bhd
Mechanical
Recycling
Waste to Value Vision

8
Waste to Value Products
New Coal
New Oil
Responsible Innovation
Heng Hiap Industries Sdn Bhd
Smart Plastics
Waste to Value Products

9
Waste to Value Vision
Plastic Scrap
New Coal New Oil
Smart Plastic
Waste to Value Products

Effective Energy from Waste for Smart City

The
propose
d site

The
propose
d site

PERCENTAGE FREQUENCY OF VARIOUS
DIRECTIONS AND SPEEDS
SPE
ED
M/S
STATION : SENAI
PERIOD : 2001 - 2010 TIME : ALL 24 HOURS
ANNUAL
N NE E SE S SW W NW
CAL
M
TOT
AL
<
0.3 - - - - - - - - 26.6 26.6
0.3 -
1.5 11.1 4.1 2.9 1.7 2.8 2.1 4.5 7.4 - 36.6
1.6 -
3.3 6.0 2.9 1.7 2.0 4.9 2.2 2.7 2.9 - 25.3
3.4 -
5.4 3.4 2.1 0.4 0.4 1.4 0.3 0.5 0.3 - 8.8
5.5 -
7.9 0.6 0.4 0.0 0.0 0.0 0.0 0.0 0.0 - 1.0
8.0 -
10.7 0.0 0.0 0.0 0.0 0.0 0.0 0.0 0.0 - 0.0
>
10.7 0.0 0.0 0.0 0.0 0.0 0.0 0.0 0.0 - 0.0
TOT
AL 21.1 9.5 5.0 4.1 9.1 4.6 7.7 10.6 26.6 98.3
Prevailing winds 2001-2010 average Scource: Malaysis Meteorological Department

GREEN - DAYLIGHT PERFORMANCE
conventional buildings = 20-40% daylight green buildings = 75% daylight
(daylight is measured at 250 lux and above)
Part 1: Energy Efficiency

1. Correct Building Orientation - Front Elevation – South - Rear Elevation – North - Right Elevation – South - Left Elevation – North
High reflective glass Aluminum Cladding Brick Wall
Glazing Specification - Glass Type 1 @ U-Value & SC Value: 2.8 & 0.23 - Glass Type 2@ U-Value & SC Value: 5.8 & 0.55 - Correction Factor = 0.90(North), 0.92 (South), 0.94 (West), 1.23(East)
OTTV = 40.41 W/m2 RTTV @U Value = 0.32 W/m2.K
OTTV Thermal Performance of Building Envelope

.
NATURAL VENTILATION AND MECHANICAL VENTILATION
Encourage building that facilitates good natural ventilation. Encourage energy efficient mechanical ventilation system as the preferred ventilation mode to air-conditioning in buildings.
Non Air-Conditioned Building Areas (with an aggregate non air-conditioned areas > 10% of total floor area excluding carparks and common areas) for Natural Ventilation.
- achieving natural ventilation for production

Artificial Lighting
Encourage the use of energy efficient lighting to minimize energy consumption from lighting usage
Current Lighting Consumption Estimation
Proposed Lighting Consumption ( Improvement)
Description Areas, sqm
Light Fitting
Power Consumption per
fitting ( W)
Ballast Loss (W)
No. of Fitting Total power
consumption based on fitting type ( W)
Production 6294 LED 150
N/A
100 15,000.0
Office 1145 LED 18 120 2,160.0
Lobby 151.2 LED 20 20 400.0
Staircase 103.6 LED 2.5 15 37.5
Restroom 175.1 LED 8 12 96.0
Description Areas, sqm
Total power consumption based on fitting type ( W)
Design Light Power, W/m2
Reference Total Power Consumption (by area)(W)
Production 6294 15,000.0 10 62940
Office 1145 2,160.0 15 17175 Lobby 151.2 400.0 20 3024
Staircase 103.6 37.5 10 1036
Restroom 175.1 96.0 15 2626.5
17,693.5 86801.5

Artificial Lighting
Encourage the use of energy efficient lighting to minimize energy consumption from lighting usage
Percentage of improvement in the lighting power budget. That is: = (86801.5 kW – 17,693.5kW ) / 86801.5 kwh x 100% =79.62%

Part 2: Water Efficiency

WATER MONITORING
Promote the use of sub-metering and leak detection system for better control and monitoring of water usage
1. To monitor the water consumption on a monthly basis. 2. Provision of private-meters for major water uses a) Cooling tower b) Rainwater Harvesting, c) Recycling Water and tenant usage

Water Efficiency Improvement Plans
1. To further improve the water to cover 100% of irrigation usage 2. Separated water meter for irrigation, office Building area used 3. Rain water harvesting tank had covered >30% of total water
usage
To show intent, measures and implementation strategies of water efficiency improvement plans over the next three years
Irrigation System and Landscaping
Reduce potable water consumption by provision of rainwater harvesting systems that utilize rainwater for landscape irrigation.
1. Use of water efficient irrigation system 2. Use of drought tolerant plants that require minimal irrigation.

Part 3: Sustainable Operation &
Management

Building Operation & Maintenance
Encourage the adoption of environmental friendly practices during construction and building operation.
1. Building Owner to commit to an environmental policy that reflects the sustainable goals and continuous efforts towards more sustainable path
2. Provision of a green guide to the occupants of the Building Green Labels ( Energy Saving/ Water Saving Tips) Summary of Green Features CASBEE
3. Appointed Green Building Consultant

.
SUSTAINABLE PRODUCTS
To promote use of environmentally friendly products that are certified by approved local certification body and are applicable to non-structural and architectural related building components.
Greenery
Encourage greater use of greenery and restoration of existing trees reduce heat island effect.
1. Waterproofing for all units’ toilets 2. Wooden doors & Flush Timber Door 3. Roof Water Proofing
(A) (B) (C) (A)x(B)x(C ) Category Name Sub category LAI Canopy Qty/Planted Leaf Area
Trees
Baphia Nitira Open Canopy 2.5 60 4 600
Hibiscus Intermediate Canopy 3 60 166 29880
Main Tree & Palm Cinnammum Intermediate Canopy 2.5 60 455 68250
Turf m2 Turf 2 1 2048 4096 Total LAI 102826
Site Area,m2 20234 Ratio of LAI/SA 5.1

Part 4: Indoor Environmental
Quality

Indoor Air Quality Performance
To promote a healthy indoor environment for occupant
1. Implementation of effective IAQ management plan to ensure building ventilation systems are frequently
INDOOR AIR POLUTANTS
Minimise airborne contaminants, mainly from inside sources to promote a healthy indoor environment.
1. Use of low volatile organic compounds (VOC) paints certified under local/international certification body for at least 90% of the internal wall areas.
2. Use adhesives certified under local/international certification body in all composite wood products used for the development

LIGHTING QUALITY
To encourage good workplace lighting quality to promote productivity and occupants comfort
INTERNAL NOISE LEVEL
Recognize buildings that are designed to control and keep the background noise in occupied spaces at levels appropriate to the intended use of the spaces.
1. The lighting level comply with MS 1525:2007 2. 90% of the occupants are able to adjust lighting to suit their need and
preference. ( By Switches) 3. All applicable areas in the entire building are served with LED Lighting >80%
1. Ensuring internal noise levels are maintained at an appropriate level and to comply with The Planning Guidelines for Environmental Noise Limits and Controls (Department of Environmental Malaysia).

Part 6: Carbon Emissions of Development
Part 5 : Green Features & Innovation

Green Features & Innovation
Encourage the use of green features which are innovative and have positive environmental impact on water efficiency, environmental protection and indoor environmental quality of the buildings.
1. Stormwater management Plan 2. Vertical Green Walls 3. Production of Bio- Diesel to cover the own consumption ( Forklift and etc.) 4. Waste Composting
Carbon Emissions of Development
To calculate the carbon emission resulted from the associated energy used during operational phase of a development. Assumption: Part One – Energy Resources Current Pre estimated building energy intensity(BEI) = 248 kWh/m2.yr Predicted building energy intensity (BEI) < 0Wh/m2.yr % of Electricity Reduction (average) @ RM0.50/kWh = 100% Estimated Carbon dioxide emission Reduction annually = ±100 tonnes CO2 Emission
Part Two – Generation of Waste Implementation & promotion of solid waste minimization & recycling campaign (paper, aluminium cans, etc.) % of Waste Generation Reduction (average) = ±15% Estimated Carbon dioxide emission Reduction annually = ±3.8 tonnes CO2 Emission
Part Three – Materials & Resources @ Water Resources Implementation of Rainwater Harvesting System, selection of drought type native vegetation, selection of water efficient fixtures % of Water Usage Reduction (average) = ±100% Estimated Carbon dioxide emission Reduction annually = ±0.6tonnes CO2 Emission

GBI
Green Building Index

Thank You
CSR with Excelsior International School