effect of waste foundry sand on durability properties of concrete
TRANSCRIPT

Effect of Waste Foundry Sand on Durability
Properties of Concrete
Guided By:
Dr. Urmil V. Dave
Prof. Tejas M. Joshi
By:
Tirth N. Doshi
33 National Convention of Civil Engineers
Institute of Engineers India

Flow of Presentation
• Introduction
• Literature Review
• Experimental Work
• Results & Discussion
• Conclusions
• References

Introduction
Waste foundry sand is the by product of ferrous and nonferrous metal casting
industries, Where sand has been used as molding material.
After certain numbers of cycles, sand is not possible to further reuse in foundries
which is removed and termed as waste foundry sand.
Categorized based on the type of binder used
• Green sand
• Molasses Sand
• CO2 Sand

Manufacturing Process of Molasses Sand
River Sand
+
Molasses
(10-12)%
Used Sand
Mixing for
2 min.
Molasses SandMolding Process
Waste Molasses Sand
Used in
molding
After number of
cycles
Reuse

Manufacturing Process of Green Sand
Used Sand
Mixing for
2 min.
Green SandMolding Process
Waste Green Sand
Used in
molding
After number of
cycles
Reuse
River Sand
+
Bentonite (4-6)%
+
Water 4%

Manufacturing Process of CO2 Sand
Mixing for
2 min.
Molding Process
Waste CO2 Sand
Used in
moldingWashed Sand
+
Sodium Silicate (4-6)%
+
CO2 Gas
CO2 Sand

Varying dosage of WFS sand
Considered concrete grade M25.
SAND% Replacement of various sand
CC Mix- A Mix- B
River Sand 100% 80% 60%
Molasses Sand 0% 20% 30%
Green Sand 0% 0% 5%
CO2 Sand 0% 0% 5%
Mix Specification
CC Control Concrete
Mix- A Concrete made with 80% river sand and 20% Molasses sand.
Mix- B Concrete made with 60% river sand, 30% Molasses sand, 5% of Green sand CO2 sand.
Mix Specification

CC Mix-A
M25 Grade of concrete
Mix-B
Durability Properties
1. Acid Attack
2. Sulphate Attack
3. Accelerated Carbonation
4. Water Impermeability
5. Rapid Chloride Penetration Test
Scope of the Work

Literature Review
Title Author Journal Work Carried Out
Comparative
investigation on
the influence of
SFS as partial
replacement of FA
on the properties
of two grade of
concrete [1]
Rafat Siddique,
Gurpreet Singh,
Rafik Belarbi,
Karime Ait-
Mokhtar, Kunal
Construction and
building
materials, Vol.
83, Pp. 216-222,
2015
Authors evaluated the influence of SFS as partial
replacement of FA on two grade of concrete up to 20%
in interval at an interval of 5%.
Replacement of FA by SFS upto 15% showed
improved effect on mechanical properties as compare
to higher dosage of SFS on both grade of concrete.
Effect of used-
foundry sand on
the mechanical
properties of
concrete [2]
Rafat Siddique,
Greet de
Schutter, Albert
Noumowe
Construction and
building
materials, Vol.
23, Pp. 976-980,
2009
Authors investigate the mechanical properties of
concrete mixtures in which fine aggregate was
partially replaced with UFS. Fine aggregate was
replaced with three percentages (10%, 20%, and 30%)
of UFS by weight.
Test results indicated that the mechanical properties
increase with the increase in foundry sand content.

Literature Review
Title Author Journal Work Carried Out
Effects of foundry
sand as a fine
aggregate in
concrete
production [3]
G. Ganesh
Prabhu, Jung
Hyun, Yun
Young Kim
Construction
and building
materials,
Vol. 70, Pp.
514-521,
2014
Authors evaluated the potential of using WFS as a
replacement of river sand. Replacement up to 50% at an
interval of 10%.
Authors had concluded that a substitution up to 20% of WFS
can be effectively used in good concrete production.
Effect of waste
foundry sand
(WFS) as partial
replacement of
sand on the
strength, ultrasonic
pulse velocity and
permeability of
concrete [4]
Gurpreeet
Sing, Rafat
Siddique
Construction
and building
materials,
Vol. 26, Pp.
416-422,
2012
Authors investigated the effect of WFS on the mechanical
and durability properties for concrete. Replacement of WFS
to sand up to 20% at an interval of 5%.
Authors had concluded that Partial replacement of sand with
WFS (up to 15%) increases the strength properties, increases
the USPV values and decreased the chloride ion penetration
in concrete. which indicates that concrete has become denser
and impermeable.

Material Properties
Material Properties
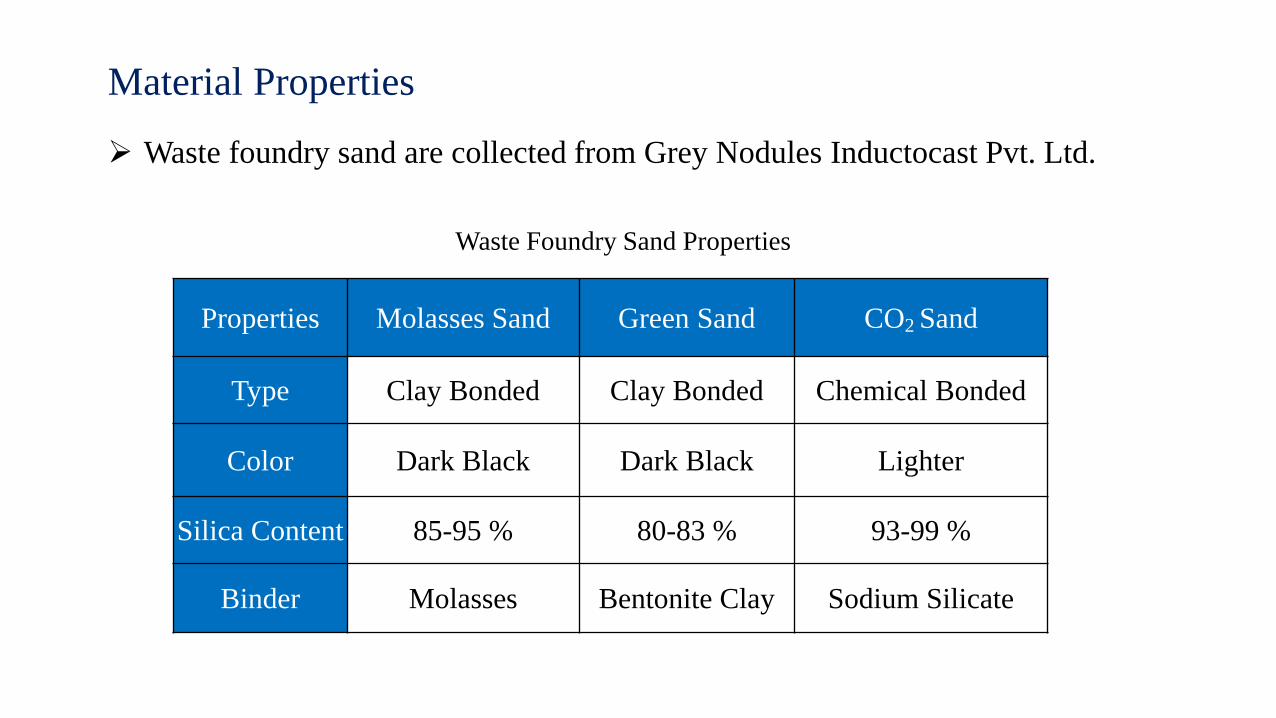
Properties Molasses Sand Green Sand CO2 Sand
Type Clay Bonded Clay Bonded Chemical Bonded
Color Dark Black Dark Black Lighter
Silica Content 85-95 % 80-83 % 93-99 %
Binder Molasses Bentonite Clay Sodium Silicate
Waste Foundry Sand Properties
Waste foundry sand are collected from Grey Nodules Inductocast Pvt. Ltd.

Properties Result Obtained Specification in IS:12269
Compressive Strength (MPa)
a) 3 Day 29.17 27(Min)
b) 7 Day 40.02 37 (Min)
c) 28 Day 55.19 53 (Min)
Fineness (m2/kg) 309 225 (Min)
Setting Time (Minute)
a) Initial Setting Time 125 30 (Min)
b) Final Setting Time 218 600 (Max)
Soundness
a) Le-Chatelier (mm) 1 10 (Max)
b) Autoclave (%) 0.13 0.8 (Max)
53 grade Ordinary Portland Cement is used for experimental work.
Physical properties of OPC-53 Grade
Material Properties (Continue…)

Material Properties (Continue…)
Physical properties of Aggregates
Properties UnitsCoarse Aggregates Fine Aggregates
20 mm 10 mm River Sand Molasses Sand Green Sand CO2 Sand
Specific
Gravity- 2.85 2.79 2.55 2.98 3.41 2.84
Water
Absorption% 1.37 1.37 1.83 1.38 26.69 0.6
Loose Bulk
Densitykg/m3 1440 1410 1531 1384 1168 1421
Compacted
Bulk Densitykg/m3 1630 1513 1681 1533 1315 1558
Free Moisture % 0.9 0.9 3.03 0.4 1.6 0.7

Chemical properties of Aggregates
ParametersMolasses Sand
(%)by mass
Co2 Sand
(%)by mass
Green Sand
(%)by mass
Reaction as per
pozzolonic material
I.R (Insoluble Residue) 81.87 91.88 87.19 -
So3 0.45 0.34 0 Max 3.0 %
LOI (Loss on Ignition) 4.73 2.38 6.23 Max 5.0 %
Sio2 76.46 88.35 78.3 -
Fe2o3 1.1 0.6 2.6 -
R2o3 (Al2o3+Fe2o3) 7.83 5.95 5.03 -
Cao 7.65 1.71 5.48 -
Mgo 0.6 0.16 0.19 Max 6.0 %
Cl2 0.18 0.1 0.15 Max 0.10 %
Al2o3 6.73 5.35 2.43 -
Chemical properties of sand tested By SGS Laboratery.
Material Properties (Continue…)
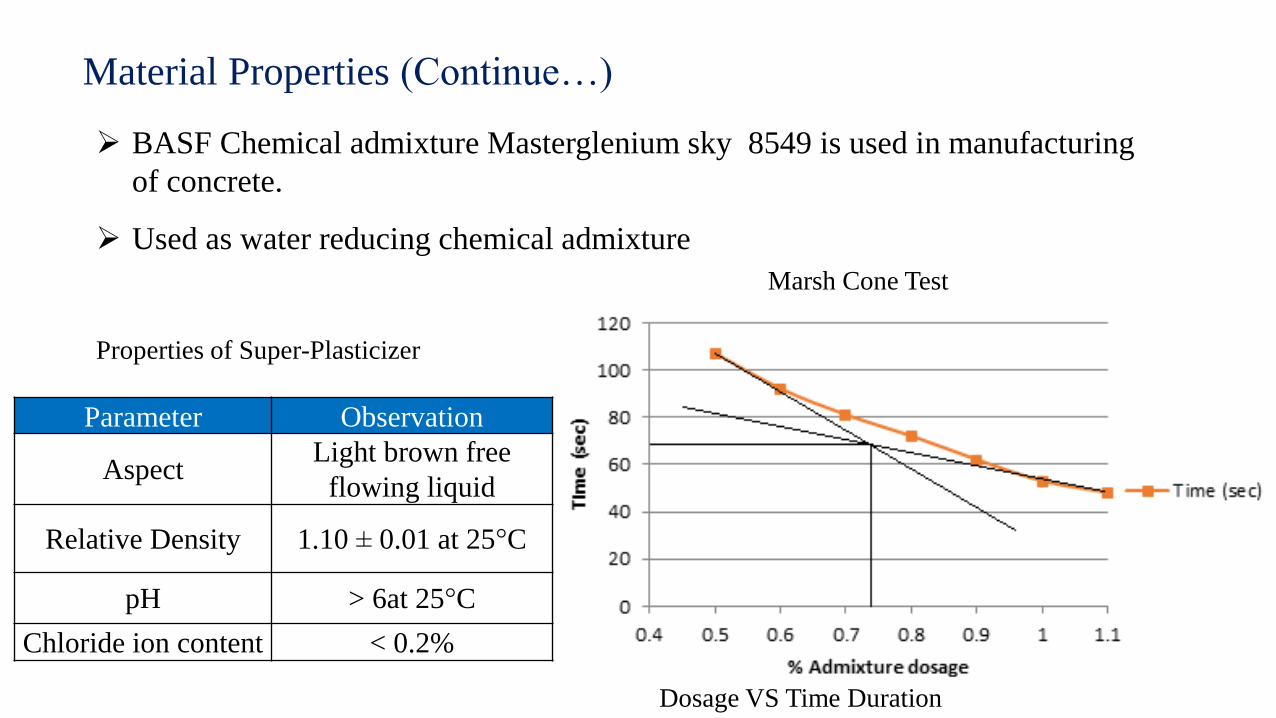
Parameter Observation
AspectLight brown free
flowing liquid
Relative Density 1.10 ± 0.01 at 25°C
pH > 6at 25°C
Chloride ion content < 0.2%
Properties of Super-Plasticizer
Dosage VS Time Duration
BASF Chemical admixture Masterglenium sky 8549 is used in manufacturing
of concrete.
Used as water reducing chemical admixture
Marsh Cone Test

Material Properties (Continue…)
Sieve
size(mm)
Mass
Retained
(gm)
% of Mass Retained Cumulative % of
Mass Retained
Cumulative % of
Pass
80 mm 0 0 0 100
40 mm 0 0 0 100
20 mm 0 0 0 100
10 mm 0 0 0 100
4.75 mm 39 3.9 3.9 96.1
2.36 mm 75 7.5 11.4 88.6
1.18 mm 102 10.2 21.6 78.4
600 micron 378 37.8 59.4 40.6
300 micron 353 35.3 94.7 5.3
150 micron 29 2.9 97.6 2.4
Lower than
150 micron24 2.4 0
Total 1000 100 288.6
Fineness Modulus=( 288.60/100.00 ) = 2.89 Zone - II
Sieve Analysis of Natural River Sand

Material Properties (Continue…)
Sieve
size(mm)
Mass Retained
(gm)% of Mass Retained
Cumulative % of Mass
Retained
Cumulative %
of Pass
80 mm 0 0 0 100
40 mm 0 0 0 100
20 mm 0 0 0 100
10 mm 0 0 0 100
4.75 mm 7 0.7 0.7 99.3
2.36 mm 5 0.5 1.2 98.8
1.18 mm 13 1.3 2.5 97.5
600 micron 18 1.8 4.3 95.7
300 micron 158 15.8 20.1 79.9
150 micron 681 68.1 88.2 11.8
Lower than
150 micron118 11.8 0
Total 1000 100 117
Fineness Modulus= ( 117.00/100.00 ) = 1.17 Zone - III
Sieve Analysis of Molasses Sand

Material Properties (Continue…)
Sieve Analysis of Green Sand
Sieve
size(mm)
Mass Retained
(gm)% of Mass Retained
Cumulative % of Mass
Retained
Cumulative % of
Pass
80 mm 0 0 0 100
40 mm 0 0 0 100
20 mm 0 0 0 100
10 mm 0 0 0 100
4.75 mm 3 0.3 0.3 99.7
2.36 mm 8 0.8 1.1 98.9
1.18 mm 62 6.2 7.3 92.7
600 micron 189 18.9 26.2 73.8
300 micron 436 43.6 69.8 30.2
150 micron 259 25.9 95.7 4.3
Lower than
150 microns43 4.3 0
Total 1000 100 200.4
Fineness Modulus= ( 200.40/100.00 ) = 2.00 Zone - IV
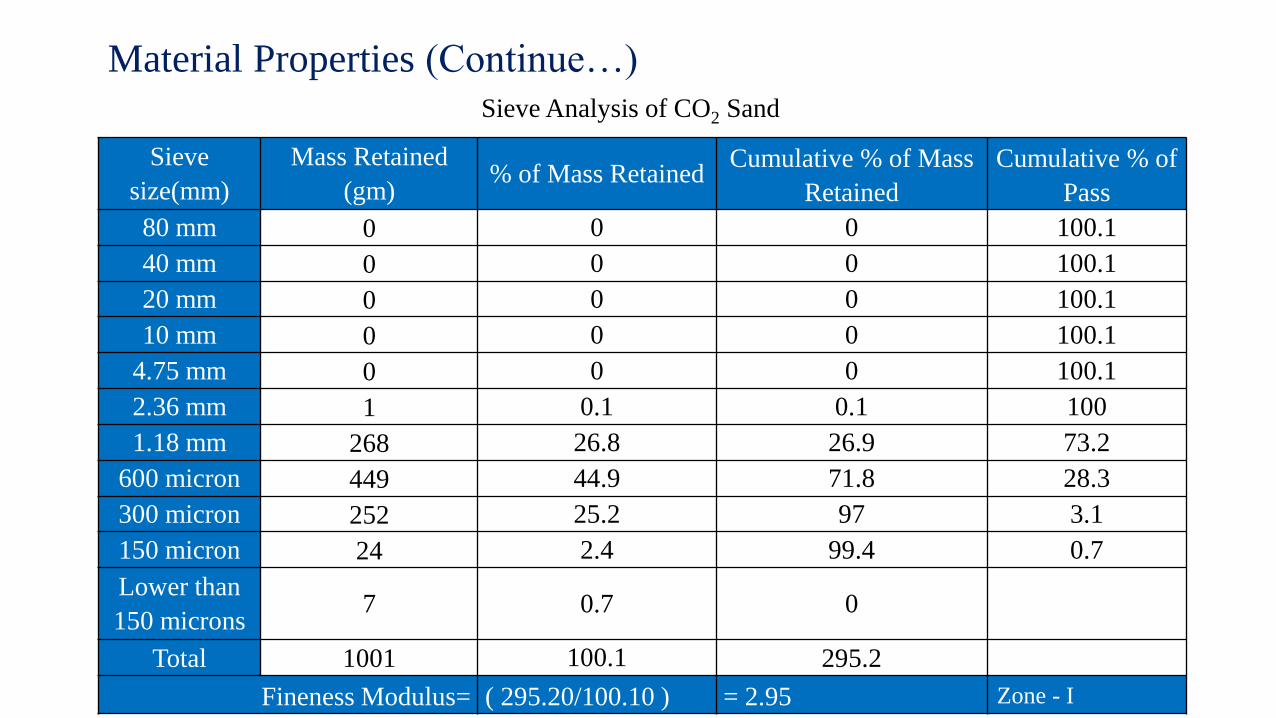
Material Properties (Continue…)Sieve Analysis of CO2 Sand
Sieve
size(mm)
Mass Retained
(gm)% of Mass Retained
Cumulative % of Mass
Retained
Cumulative % of
Pass
80 mm 0 0 0 100.1
40 mm 0 0 0 100.1
20 mm 0 0 0 100.1
10 mm 0 0 0 100.1
4.75 mm 0 0 0 100.1
2.36 mm 1 0.1 0.1 100
1.18 mm 268 26.8 26.9 73.2
600 micron 449 44.9 71.8 28.3
300 micron 252 25.2 97 3.1
150 micron 24 2.4 99.4 0.7
Lower than
150 microns7 0.7 0
Total 1001 100.1 295.2
Fineness Modulus= ( 295.20/100.10 ) = 2.95 Zone - I
Material Properties (Continue…)
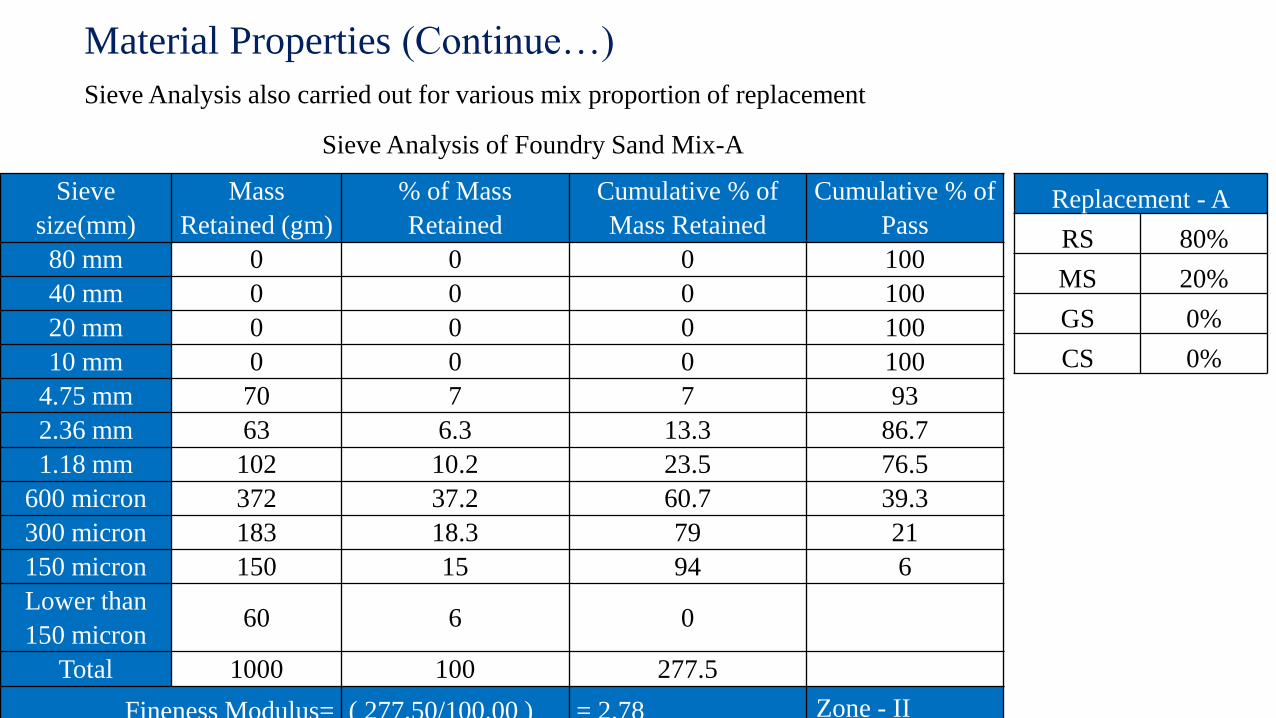
Sieve Analysis of Foundry Sand Mix-A
Sieve Analysis also carried out for various mix proportion of replacement
Sieve
size(mm)
Mass
Retained (gm)
% of Mass
Retained
Cumulative % of
Mass Retained
Cumulative % of
Pass
80 mm 0 0 0 100
40 mm 0 0 0 100
20 mm 0 0 0 100
10 mm 0 0 0 100
4.75 mm 70 7 7 93
2.36 mm 63 6.3 13.3 86.7
1.18 mm 102 10.2 23.5 76.5
600 micron 372 37.2 60.7 39.3
300 micron 183 18.3 79 21
150 micron 150 15 94 6
Lower than
150 micron60 6 0
Total 1000 100 277.5
Fineness Modulus= ( 277.50/100.00 ) = 2.78 Zone - II
Replacement - A
RS 80%
MS 20%
GS 0%
CS 0%

Material Properties (Continue…)
Sieve Analysis of Foundry Sand Mix-B
Sieve
size(mm)
Mass Retained
(gm)
% of Mass
Retained
Cumulative % of
Mass Retained
Cumulative % of
Pass
80 mm 0 0 0 100
40 mm 0 0 0 100
20 mm 0 0 0 100
10 mm 0 0 0 100
4.75 mm 31 3.1 3.1 96.9
2.36 mm 63 6.3 9.4 90.6
1.18 mm 94 9.4 18.8 81.2
600 micron 339 33.9 52.7 47.3
300 micron 198 19.8 72.5 27.5
150 micron 213 21.3 93.8 6.2
Lower than
150 micron62 6.2 0
Total 1000 100 250.3
Fineness Modulus= ( 250.30/100.00 ) = 2.50 Zone - II
Replacement- B
RS 60%
MS 30%
GS 5%
CS 5%

Material Properties (Continue…)
Sieve Analysis of Foundry Sand Mix-C
Sieve
size(mm)
Mass Retained
(gm)
% of Mass
Retained
Cumulative % of
Mass Retained
Cumulative % of
Pass
80 mm 0 0 0 100
40 mm 0 0 0 100
20 mm 0 0 0 100
10 mm 0 0 0 100
4.75 mm 11 1.1 1.1 98.9
2.36 mm 23 2.3 3.4 96.6
1.18 mm 72 7.2 10.6 89.4
600 micron 376 37.6 48.2 51.8
300 micron 223 22.3 70.5 29.5
150 micron 226 22.6 93.1 6.9
Lower than
150 micron69 6.9 0
Total 1000 100 226.9
Fineness Modulus= ( 226.90/100.00 ) = 2.27 Zone - II
Replacement – C
RS 45%
MS 35%
GS 5%
CS 15%

Experimental Programme

2. Test data for materials
• Specific gravity of cement – 3.15
• Specific gravity of coarse aggregate – 2.82
• Specific gravity of fine aggregate – 2.55
• Specific gravity of chemical admixture – 1.1
• Fine aggregate zone -II
• Use 1.2% chemical admixtures.
1. Grade designation - M25
• Type of cement – OPC 53 grade
• Maximum nominal size of aggregate – 20mm
• Minimum cement content – 300 kg/m3
• Maximum w/c Ratio – 0.5
• Workability – 100 mm slump
• Exposure condition – Moderate (RCC)
• Method of concreting – Manual
• Type of aggregate – Crushed angular aggregate
• Degree of supervision – good
• Maximum cement content - 450 kg/m3
• Chemical admixture – Super plasticizer
Parameters of M25 Grade of Concrete
MD

Mix Design
Mix design of various concrete content
Material Units CC Mix-A Mix-B
Cement
kg/m3
315.46 315.46 315.46
Water 155.21 158.82 173.13
Coarse
Aggregate
20mm 781.89 781.89 781.89
10mm 510.29 510.29 510.29
River Sand 726.63 581.30 435.98
Molasses Sand - 166.17 249.26
Green Sand - - 35.96
Co2 Sand - - 40.02
Admixture Dosage lit/m3 1.15 1.15 1.15
Density kg/m3 2490.63 2514.84 2543.14
w/c Ratio - 0.50 0.50 0.50
Volume m3 1 1 1
w/c Obtained - 0.49 0.50 0.55
Slump mm 100 105 110
RS Content 726.45
Sand RS MS
% 80 20
Specific Gravity 2.55 2.98
Formula 726.45×80% 726.45/2.55×20%×2.98
Sand Content 581.30 166.17
By volume Calculation of various sands of Mix-A
RS Content = 726.45
Sand RS MS GS CS
% 60 30 5 5
Specific
Gravity2.55 2.98 3.41 2.84
Formula726.45×6
0%
726.45/2.55×3
0%×2.98
726.45/2.55×5
%×3.41
726.45/2.55×5
%×2.84
Sand
Content435.30 249.26 35.96 40.02
By volume Calculation of various sands of Mix-B

Durability Properties
Test schedule of durability properties
Durability Properties of
ConcreteSpecimen Size of Specimens
Age in DaysStandard
6 28 56
Acid Attack Cube 150mm × 150mm × 150mm - 3 3 IS 4456
sulphate Attack Cube 150mm × 150mm × 150mm - 3 3 IS 4456
Accelerated carbonation Cylinder 100mm dia.× 200mm 3 - - CEN12390
Water Impermeability Cube 150mm × 150mm × 150mm - 3 - DIN 1048
Rapid chloride
penetration Test Cylinder 100mm × dia. × 50mm
-3
-ASTM C1202

Acid Resistance (IS: 4456)
• The concrete specimen size 150 × 150 × 150 mm is casted for evaluating changein compressive strength and change in mass, respectively.
• The acid resistance of concrete is determined by measuring the residualcompressive strength and change in mass after acid exposure at 28 and 56 daysof time intervals.
• After 28 days of water curing cubes are immersed in 5% sulfuric acid solutionwith pH maintained at 3.

Mix
28 days 56 days
Before
Exposure
After
Exposure
Before
Exposure
After
Exposure
CC
8.80 8.46 8.51 7.96
8.51 8.12 8.30 7.75
8.67 8.18 8.86 8.29
Average 8.66 8.25 8.56 8.00
Mix-A
8.63 8.19 8.56 7.91
8.57 8.05 8.53 7.93
8.69 8.23 8.42 7.79
Average 8.63 8.16 8.50 7.88
Mix-B
8.43 7.85 8.57 7.79
8.94 8.31 8.45 7.64
8.59 8.04 8.52 7.75
Average 8.65 8.07 8.51 7.73
Weight loss for Acid ExposureAcid Resistance

4.70
6.51
5.48
7.376.78
9.24
0.00
1.00
2.00
3.00
4.00
5.00
6.00
7.00
8.00
9.00
10.00
28 days 56 days
Perc
enta
ge
CC Mix-A Mix-B
% Weight loss for Acid Exposure
Acid Resistance

Mix
Avg. Comp
Strength
Before
Exposure
Avg. Comp
strength
After Exposure
28
days
56
days
28
days
56
days
CC 30.59 35.56 25.77 27.23
Mix-A 32.22 39.78 28.01 30.10
Mix-B 25.85 33.33 19.69 22.99
% Variation in compressive strength of concrete mixes
15.75%
23.43%
13.06%
24.33%
28.83%31.02%
0.00%
5.00%
10.00%
15.00%
20.00%
25.00%
30.00%
35.00%
28 days 56 days
Per
centa
ge
CC Mix-A Mix-B
Acid Resistance

Sulphate Resistance (IS: 4456)
• The concrete specimen size 150 × 150 × 150 mm is casted for evaluating changein compressive strength and change in mass, respectively.
• The Sulphate resistance of both grade of concrete is determined by measuringthe residual compressive strength and change in mass after sulphate exposure at28 and 56 days of time intervals.
• After 28 days of water curing cubes are immersed in 5% sodium nitrate solutionwith pH maintained at 8.

Sulphate Resistance
Mix
28 days 56 days
Before
Exposure
After
Exposure
Before
Exposure
After
Exposure
CC
8.73 8.75 8.34 8.37
8.46 8.49 8.72 8.75
8.80 8.83 8.60 8.64
Average 8.66 8.69 8.55 8.59
Mix-A
8.52 8.57 8.43 8.51
8.40 8.44 8.71 8.78
8.71 8.75 8.68 8.75
Average 8.54 8.59 8.61 8.68
Mix-B
8.43 8.50 8.35 8.43
8.56 8.61 8.37 8.47
8.57 8.65 8.48 8.58
Average 8.52 8.59 8.40 8.49
Weight gain in concrete specimens for sulphate exposure

0.27% 0.32%
0.70% 0.74%
0.97%1.06%
0.00%
0.20%
0.40%
0.60%
0.80%
1.00%
1.20%
28 days 56 days
Per
centa
ge
(%)
% Weight gain for sulphate exposure
CC Mix-A Mix-B
Sulphate Resistance

• 3 cylinders of 100 mm diameter and 200 mm height for each mixes is casted and
placed in the carbonation chamber.
• Carbon dioxide gas is supplied from a standard industrial cylinder fitted with a
regulator. The temperature of the system is controlled by keeping it in a room at a
28 °C and a CO2 concentration of 4% with 60% humidity.
• At completion of test, the specimens is taken out of the chamber and the depth of
carbonation is measured by treating the surface of a freshly sliced specimen with a
pH indicator that was 1% solution of phenolphthalein in water.
• This test is carried out for 6 days.
Accelerated Carbonation Test (CEN 12390)

Mix
Avg. Comp
strength before
Avg. Comp
strength after
28 days56
days
28
days
56
days
CC 31.20 35.56 30.09 33.84
Mix-A 33.15 39.78 31.13 38.48
Mix-B 26.00 33.33 24.55 31.95
Sulphate Resistance
% Variation in compressive strength of concrete mixes for sulphate exposure
3.57%
4.83%
6.08%
3.26%
5.58%
4.14%
0.00%
1.00%
2.00%
3.00%
4.00%
5.00%
6.00%
7.00%
28 days 56 daysP
erce
nta
ge
(%)
Days
CC Mix-A Mix-B

Equipment capacity
Max. Temperature : 60°C
Humidity range : 40% to 80%
Max. CO2 concentration: 4.5%
Test parameters
Temperature : 28°C
Humidity : 60%
CO2 concentration: 4%
Accelerated Carbonation Test

Split Cylinder SideCarbonation depth (mm) Avg. carbonation
depth (mm)Near top Near middle Near bottom
13.05 4 3.12
3.523.59 3.9 3.52
23.7 3.78 3.16
3.65 3.53 3.22
Table: 18 Sample results taken from average of all side
Accelerated Carbonation Test
• Based on the carbonation depth values carbonation coefficient is calculated using following
formula :
X = C × √t
X = Carbonation depth in mm,
C = Carbonation coefficient
t = exposure time in days

MixCarbonation
depth (mm)
Rate of
carbonation
(mm/day0.5)
Avg. rate of
carbonation
(mm/day0.5)
CC
3.52 1.33
1.434.05 1.53
3.80 1.44
Mix- A
4.27 1.61
1.644.56 1.72
4.19 1.58
Mix- B
7.54 2.85
2.857.60 2.87
7.49 2.83
Results of carbonation depth
Accelerated Carbonation Test

• To perform this test specimen is treated under wet and dry cycles.
• To represent sea water condition, 3.5% NaCl solution water tank is made (3.5% NaCl
concentration is generally found in sea water) and specimens is submerged for wet cycle
in this tank for 24 hours and then it is taken out for dry cycle of 24 hours at outer
atmosphere. These 48 hours will be 1 dry-wet cycle.
• No. of cycles performed on specimens are 15, 30 W-D cycles (28, 56 days)
• Then the specimens are tested for Impermeability test. It is performed according to
German standard DIN-1048 part-5.
• During this test three concrete specimen are kept as shown in fig. 3.9. Water pressure is
maintained at 5 kg/sq.cm. by compressor attached to the impermeability test setup. After
3 days of exposure to pressurized water the specimen are removed from the test setup.
Cubes are then split in to two half and penetration depth is measured.
Water Impermeability Test (DIN 1048)

Water Impermeability Test
Water Impermeability Test Set-up
Splitting of specimen
Depth Measurement of tested Specimens

Split Cube SideWater penetration depth (mm)
Avg. water penetration depth (mm)Near left end Near middle Near right side
1 20.7 22.4 21.821.68
2 20.9 22.2 22.1
Sample results taken from average of all side
Mix Penetration depth (mm) Avg. rate of Penetration
CC
21.68
20.6919.95
20.45
Mix- A
19.89
19.2218.55
19.21
Mix- B
4.13
4.074.25
3.82
Water penetration results taken from average of all Specimens

• Specimens of 100 mm diameter and
50 mm length is submerged in the 5%
Sodium Chloride solution in a tank,
after 28 days of curing period for a 28
and 56 days exposure.
• Then specimens is tested as per
standard procedure of (ASTM
C1202-97) for 6 hrs.
Rapid Chloride Penetrations Test (ASTM C 1202)

Rapid Chloride Penetrations Test
• This test method consists of monitoring the amount of electrical current passed through
100 mm nominal diameter cylinders during a 6-h period.
• A potential difference of 60 V DC is maintained across the ends of the specimen, one of
which is immersed in a sodium chloride(NaCl) solution, the other in a sodium
hydroxide(NaOH) solution.
• The total charge passed, in coulombs, has been found to be related to the resistance of the
specimen to chloride ion penetration.
Charge Passed (coulombs) Chloride Ion Penetrability
>4000 High
2000 – 4000 Moderate
1000 – 2000 Low
100 – 1000 Very low
<100 Negligible
Chloride Ion Penetrability Based on Charge Passed

Rapid Chloride Penetrations Test
Time (min)Current in amp
CC Mix-A Mix-B
0 0 0 0
30 0.002 0.007 0.009
60 0.011 0.016 0.017
90 0.028 0.027 0.03
120 0.045 0.041 0.049
150 0.053 0.051 0.064
180 0.066 0.062 0.07
210 0.087 0.083 0.086
240 0.111 0.109 0.125
270 0.1375 0.129 0.164
300 0.175 0.163 0.209
330 0.2125 0.209 0.246
360 0.25 0.232 0.284
Cumulative current 2.2334 2.145 2.561
Charge passed 2010.06 1930.5 2304.9
Current passing through specimens during test
Area under the curve of current versus time duration is
the total charge passing through the respective concrete
specimens which can be calculate by trapezoidal rule as
mentioned in Equation 1.
Q = 900 (I0 + 2I30 + …. + 2I300 + 2I330 + 2I360)
(Eq. 1)
Where Q = charge passed (Coulombs)
I0 = current (Ampere) immediately after voltage is
applied
It = current (Ampere) at t minute after voltage is
applied.

0
0.05
0.1
0.15
0.2
0.25
0.3
0 30 60 90 120 150 180 210 240 270 300 330 360
Cu
rren
t (A
mp
)
Time (min)
Chloride Ion Penetrability
CC
Mix-A
Mix-B
Rapid Chloride Penetrations Test

Conclusions
• Gradation of Fine aggregate it is observed that more then 20% replacement of waste
foundry sand with river sand is not suitable.
• The compressive strength of waste foundry sand concrete increases upto 20%
replacement of river sand by the waste foundry sand in concrete for better protection
against the acid exposure. More than 20% replacement of river sand by the waste
foundry sand in concrete reduces the compressive strength and increases the damage
during the acid exposure.
• Sulphate resistance of waste foundry sand concrete increases with replacement of river
sand up to 20% by the waster foundry sand. More than 20% replacement of the waste
foundry sand in concrete results into reduction of the sulphate resistance of concrete.

• It has been observed that the rate of carbonation depth is marginally more as compared
to that for control concrete for upto 20% replacement of river sand by the waste
foundry sand in concrete. More than 20% replacement of river sand by the waste
foundry sand in concrete is not suitable for protection against carbonation.
• Depth of water penetration is marginally more as compared to that of control concrete
for upto 20% replacement of river sand by the waste foundry sand in concrete. More
than 20% replacement of river sand by the waste foundry sand in concrete results into
large depth of water penetration and hence, is not suitable.
• The concrete mix with provision upto 20% replacement of river sand by the waste
foundry sand is likely to offer better protection in rapid chloride penetration test as
compared to that of control concrete as well as the concrete with 40% replacement of
river sand by the waste foundry sand.
Conclusions

References[1] Rafat Siddique, Gurpreet Singh, Rafik Belarbi, Karim Ait-Mokhtar, Kunal,
"Comparative investigation on the influence of spent foundry sand as partial
replacement of fine aggregates on the properties of two grades of concrete",
Construction and Building Materials, Vol. 83, (2015), pp. 216-222.
[2] ] Rafat Siddique, Greet de Schutter, Albert Noumowe, “Effect of used-foundry sand
on the mechanical properties of concrete”, Construction and building materials, Vol. 23,
Pp. 976-980, 2009.
[3] G. Ganesh Prabhu, Jung Hyun, Yun Young Kim. “Effects of foundry sand as a fine
aggregate in concrete production”, Construction and building materials, Vol. 70, Pp.
514-521, 2014.
[4] Gurpreet Singh, Rafat Siddique. “Eeffct of waste foundry sand (WFS) as partial
replacement of sand on the strength, ultrasonic pulse velocity and permeability of
concrete”, Construction and Building Materials, Vol. 26, (2012), pp. 416-422.

[5] IS: 383-1970, (1970), "Specification for Coarse and fine aggregate from natural
sources for concrete", Bureau of Indian Standards, New Delhi.
[6] IS: 10262-2009, "Concrete mix proportioning-guidelines", Bureau of Indian
Standards", New Delhi.
[7] IS: 4456-1987, “Method of Test for Chemical Resistant Mortar", Bureau of Indian
Standards", New Delhi.
[8] CEN 12390 (Part-12)-2010, “Euro Standard for Determination of the Potential
Carbonation Resistance of Concrete.
[9] DIN 1048 (Part-5)-1991, "German Standard for Determination of Permeability of
Concrete”.: Testing hardened concrete - Part 12: Determination of the potential
carbonation resistance of concrete: Accelerated carbonation method.
[10] ASTM 1202C-1997 Standard Test Method for Electrical Indication of Concrete's
Ability to Resist Chloride Ion Penetration.
References (Continue…)

Thank You