effect of value chain management practices on …
TRANSCRIPT

EFFECT OF VALUE CHAIN MANAGEMENT PRACTICES ON
PEFORMANCE OF MEDIUM AND LARGE SCALE RETAIL OUTLETS IN
NAKURU COUNTY, KENYA
NAOMI WANGARI THUKU
A Research Project Submitted to Graduate School in Partial Fulfillment of the
Requirements for the Award of the Degree of Master of Business Administration
of Egerton University.
EGERTON UNIVERSITY
MAY 2019

ii
DECLARATION AND RECOMMENDATION
Declaration
I declare that this research project is my original work and has not been submitted for
examination in this or any other institution.
Signed: .......................................................... Date: ............................................
Thuku Naomi Wangari
CM11/0626/10
Recommendation
This research project has been submitted for examination with my approval as the University
Supervisor.
Signed: ....................................................... Date: ................................................
Dr. Henry K. Kombo
Department of Business Administration
Egerton University

iii
COPYRIGHT
©2019 Naomi W. Thuku
All rights reserved. No part of this Thesis may be reproduced, stored in a retrieval system, or
transmitted in any form or by any means, electronic, photocopying, mechanical, recording or
otherwise, or translated in any language, without the prior written permission of the author or
Egerton University.

iv
DEDICATION
I dedicate this work to my mother, Mariam Wangui, who despite her advanced age has
tirelessly encouraged me in my quest for higher education; and my friend Chrispine who has
always given me continuous motivation and support in the development of this research
project.

v
ACKNOWLEDGEMENT
I am indebted to a number of people who made this research project a success. First, I thank
the almighty God for the gift of life, insight, strength and perseverance to complete this study.
. I am grateful to Egerton University for providing a suitable environment to carry out my
study. Secondly, I thank my supervisor Dr. Henry Kombo for his invaluable guidance,
scholarly assistance, sacrifice, patience and prompt feedback during the entire period of
developing this project. Thirdly, I thank all my lecturers whose academic insights and
inspirations have been relentless and incomparable. Fourthly, I sincerely thank my family for
their support, love and prayers. Fifthly, I thank my employer, Kenya Power and Lighting
Company Limited for giving me time to sit for my exams and attend to other academic
assignments. Finally, it is my great pleasure to acknowledge all those people whose names
may not appear in this report. Their efforts, hard work, cooperation, friendship and
understanding were the backbone of my successful completion of this work. God bless you
all.

vi
ABSTRACT
The Kenyan retail outlets sector operates in a dynamic environment faced with intense
competition. This calls for organizations to employ an efficient and effective value chain and
this is achieved through coordinating operations in a manner that ensures the involved
companies are able to create more consumer satisfaction than their competitors. However,
past empirical studies have not focused on the effect of value chain management practices
and organizational performance, particularly in retail outlet sector. The overall objective of
this study was to determine the effect of value chain management practices on performance
of medium and large scale retail outlets in Nakuru County. The specific objectives of the
study were to: determine the effect of firm’s supplier relationship on performance, determine
the effect of internal value chain activities on performance, determine the effect of customer
relationship on performance and establish the joint effect of firm supplier relationship,
internal value chain activities and customer relationship on organizational performance. The
study was based on the resource-based view theory. The study employed explanatory
research design. The population of the study was 43 medium and large scale retail outlets.
Census study was carried out among 43 medium and large scale retail outlets in Nakuru
County. Primary data was collected using close- ended questionnaires. The questionnaires
were administered through drop and pick method. Data collected was summarized using
descriptive statistics such as percentages, means and standard deviations. To examine the
relationship between value chain management practices and organizational performance,
Pearson’s correlation analysis was used. To examine the effect of value chain management
practices on organizational performance, multiple regression analysis was used. The results
revealed a positive significant relationship between supplier relationship and organizational
performance. The findings also revealed a higher positive significant relationship between
internal value chain activities and organizational performance. The results also revealed a
positive significant relationship between customer relationship and organizational
performance. Further, the results demonstrated that the joint effect of supplier relationship,
internal value chain activities, and customer relationship explained a greater variance in
organizational performance, than the variance explained by internal value chain activities
alone. The study recommended that while internal value chain activities need to be the key
vision of value chain management practices in firms, all value chain management practices
dimensions should be combined for a greater increase in organizational performance. There is
also need to cover other factors (scale, capacity utilization, vertical integration, learning,
policy decisions and government regulations) related to value chain management practices
that can impact on organizational performance to a larger extent since the factors used in this
study explained 77.7% of the increase in performance. To minimize the effect of single
respondent bias, future research can use multiple respondents including executive officers
and middle managers.

vii
TABLE OF CONTENTS
DECLARATION AND RECOMMENDATION .................................................................. ii
COPYRIGHT .......................................................................................................................... iii
DEDICATION......................................................................................................................... iv
ACKNOWLEDGEMENT ....................................................................................................... v
LIST OF TABLES ................................................................................................................... x
LIST OF FIGURES ................................................................................................................ xi
ABBREVIATIONS AND ACRONYMS .............................................................................. xii
CHAPTER ONE ...................................................................................................................... 1
INTRODUCTION.................................................................................................................... 1
1.1 Background of the Study ..................................................................................................... 1
1.1.1 Value Chain Management Practices .......................................................................... 3
1.1.2 Organizational Performance ...................................................................................... 4
1.1.3 Retail Sector in Kenya ............................................................................................... 6
1.2 Statement of the Problem ..................................................................................................... 8
1.3 Objectives of the Study ........................................................................................................ 9
1.4 Research Hypotheses ........................................................................................................... 9
1.5 Significance of the Study ..................................................................................................... 9
1.6 Scope and Limitations of the Study ................................................................................... 10
1.7 Operational Definition of Terms ........................................................................................ 11
CHAPTER TWO ................................................................................................................... 12
LITERATURE REVIEW ..................................................................................................... 12
2.1 Introduction ........................................................................................................................ 12
2.2 Theoretical Perspective ...................................................................................................... 12
2.3 Value Chain Management Practices .................................................................................. 15
2.3.1 Supplier Relationship Management......................................................................... 17
2.3.2 Internal Value Chain Activities ............................................................................... 19
2.3.3 Customer Relationship Management....................................................................... 20
2.4 Organizational Performance .............................................................................................. 22
2.5 Value Chain Management Practices and Organizational Performance ............................. 26
2.5.1 Supplier Relationship Management and Organizational Performance .................... 27
2.5.2 Internal Value Chain Activities and Organizational Performance .......................... 30
2.5.3 Customer Relationship Management and Organizational Performance .................. 33

viii
2.6 Summary of the Literature Review and Knowledge Gaps ................................................ 36
2.7 Conceptual Framework ...................................................................................................... 38
CHAPTER THREE ............................................................................................................... 41
RESEARCH METHODOLOGY ......................................................................................... 41
3.1 Introduction ........................................................................................................................ 41
3.2 Research Design................................................................................................................. 41
3.3 Target Population ............................................................................................................... 41
3.4 Data Collection .................................................................................................................. 41
3.5 Measurement of Variables ................................................................................................. 42
3.6 Validity and Reliability of Research Instrument ............................................................... 42
3.6.1 Validity .................................................................................................................... 42
3.6.2 Reliability ................................................................................................................ 42
3.7 Data Analysis ..................................................................................................................... 43
CHAPTER FOUR .................................................................................................................. 45
RESULTS AND DISCUSSION ............................................................................................ 45
4.1 Introduction ........................................................................................................................ 45
4.2 Descriptive Statistics .......................................................................................................... 45
4.2.1 Response Rate.......................................................................................................... 45
4.2.2 Profile of Organization ............................................................................................ 45
4.2.3. Supplier Relationship Management........................................................................ 47
4.2.4 Internal Value Chain Activities ............................................................................... 48
4.2.5 Customer Relationship Management....................................................................... 49
4.2.6 Organizational Performance .................................................................................... 50
4.3 Correlation Analysis .......................................................................................................... 51
4.4 Test of Hypotheses ............................................................................................................. 52
4.4.1 Supplier Relationship Management and Organizational Performance ........................... 52
4.4.2 Internal Value Chain Activities and Organizational Performance .......................... 53
4.4.3 Customer Relationship Management and Organizational Performance .................. 55
4.5 Supplier Relationship Management, Internal Value Chain Activities, Customer
Relationship Management and Organizational Performance .................................................. 56
CHAPTER FIVE ................................................................................................................... 59
SUMMARY OF FINDINGS, CONCLUSION AND RECOMMENDATIONS .............. 59
5.1 Introduction ........................................................................................................................ 59
5.2 Summary of Findings ......................................................................................................... 59

ix
5.3 Conclusion ........................................................................................................................ 60
5.4 Recommendations of the Study ......................................................................................... 61
5.4.1 Recommendations for Management Policy and Practice ........................................ 61
5.4.2 Recommendations for Further Research ................................................................. 62
REFERENCES ....................................................................................................................... 63
APPENDICES ........................................................................................................................ 73
Appendix I : Questionnaire ................................................................................................... 73
Appendix II: Medium and Large Scale Retail Outlets in Nakuru County ...................... 76

x
LIST OF TABLES
Table 3.1: Reliability Statistics ................................................................................................ 43
Table 4.1: Profile of Organization ........................................................................................... 46
Table 4.2: Supplier Relationship Management ........................................................................ 47
Table 4.3: Internal Value Chain Activities .............................................................................. 48
Table 4.4: Customer Relationship Management ...................................................................... 49
Table 4.5: Organizational Performance ................................................................................... 50
Table 4.6: Correlation Matrix for Supplier Relationship Management, Internal Value Chain
Activities, Customer Relationship Management and Organizational Performance ........ 51
Table 4.7: Simple Regression Results for Effect of Supplier Relationship Management on
Organizational Performance ............................................................................................ 52
Table 4.8: Simple Regression Results for Effect of Internal Value Chain Activities .............. 53
on Organizational Performance ............................................................................................... 53
Table 4.9: Simple Regression Results for Effect of Customer Relationship Management on
Organizational Performance ............................................................................................ 55
Table 5.0: Multiple Regression Results for Effect of Supplier Relationship Management,
Internal Value Chain Activities and Customer Relationship Management on
Organizational Performance ............................................................................................ 57

xi
LIST OF FIGURES
Figure 2. 1: Relationship between value chain management practices, contextual factors and
organizational performance: ............................................................................................ 38

xii
ABBREVIATIONS AND ACRONYMS
CODP Customer Order Decoupling Point
CRM Customer Relationship Management
RBV Resource Based View of the firm
SCM Supply Chain Management
SRM Supplier Relationship Management
VCM Value Chain Management
VRIO Valuable Rarity Imitability Organization

1
CHAPTER ONE
INTRODUCTION
1.1 Background of the Study
There is increased sophistication in the shopping pattern of consumers, which has resulted in
big retail chains coming up in the international arena. Global players like Wal-Mart and
Tesco have set pace in the way retailing is done to meet the ever changing consumer taste and
preferences. Kenya and the rest of the world have not been left behind. The retail growth is
being driven by changes in lifestyle, surge in income and the advent of devolution, which is
supported by favourable demographic patterns (Liedholm, 2001).
Increasing risk of error, costly mistakes and even economic ruin are causing professional
managers in 21st century to take strategic management seriously in order to keep their
organizations competitive in an increasingly volatile environment (Hunger & Wheelen,
2006). This has forced businesses to look into their activities that are performed to design,
produce, market, deliver and support their products. Thus, some organizations have employed
value chain management to integrate communication and increase cooperation between
production chain members in order to decrease delivery times, reduce inventories and
increase customer satisfaction.
Value systems integrate supply chain activities, from determination of customer needs
through product/service development, production/operations and distribution, including first,
second and third-tier suppliers. The objective of value systems is to position organizations in
the supply chain to achieve the highest levels of customer satisfaction and value while
effectively exploiting the competencies of all organizations in the chain (Hitt, Ireland, &
Hoskisson, 2007).
Understanding why organizations can create value and whether it can continue to it in the
future is a vital step in diagnosing a firm’s potential for achieving a competitive advantage in
the marketplace (Hitt, Ireland, & Hoskisson, 2007). The overall goal is to provide customers
with superior value products and services which in turn translate to better financial
organizational performance. Hence, it is essential to understand how firms create value and
then look for ways to add more value to it.
Moreover, as buyer-value relationship competition increases, the challenges associated with
producing a product and service to the right place at the right time at the lowest cost

2
increases. Organizations begin to realize that it is not enough to improve efficiencies within
an organization, but their whole value chain has to be made competitive. Value chain analysis
becomes an important tool to measure value creating processes of a company (Porter, 1985).
This research gives emphasis on the impact of value chain management practices on
organization performance and firm competitiveness.
Porter (1985) divided internal value chain activities, one of the components of value chain
management practices into primary and support activities. The primary activities include
inbound logistics, operations, outbound logistics, marketing and sales and services. The
support activities include procurement, technology development, human resource
management and firm infrastructure. Hence there should be value creating processes from the
beginning of purchasing raw materials to the end customer.
Kaplinksy and Morris (2001) explained that primary activities represent functionality of the
value chain, while support activities represent the strength of the value chain. In order to
survive in the industry, the company has to gain competitive advantage by delivering a
customer value. This is where value chain management practices comes in. As mentioned by
Gereffi (1994), firm competitiveness is determined by competitiveness of the value chain.
Hence, the investigation of the value chain management practices on firm competitiveness
and performance is highly effective.
Guided by the resource based view (RBV), it was postulated in this study that both the
internal value chain activities and the various buyer – supplier relationships and the linkages
between them are core resources that enhance competitive advantage and performance. As
suggested by RBV, it was expected that medium and large scale retail outlets practice value
chain management practices to enhance competitive advantage and superior performance.
Retail outlets perform specific activities such as anticipating consumers’ wants, developing
assortments of products, acquiring market information, and financing (Neville, 2007).
However, medium and large scale retail outlets in Kenya have for years faced challenges
such as depressed domestic demand, inflation and transport costs. In fact 50 % of retail
outlets in Kenya as established in a study by Liedholm (2001), closed within the first three
years of operation depicting a high mortality rate. Over the last decade, the retail industry has
experienced major transitions. The growth of e-commerce has created both new competition

3
and a new selling channel for retailers hence increased need for effective and efficient
management of value chain management practices (Kumar, 2005).
1.1.1 Value Chain Management Practices
The concept of value chain management practices was first introduced by Porter (1985) and
has now become an integral part of strategic management for many businesses in 21st
century. Firms use value chain management practices as a tool to create and sustain
competitive advantage. Primary and support activities are vital in developing competitive
advantage. For example, in the retail outlet sector, the activities which are critical in
distribution of goods and services from the manufacturer to the consumer must be well
optimized and coordinated. Hence, managers should optimize on the linkages between the
activities in order to enjoy the benefits of cost and differentiation advantages (Henry, 2011).
Value chain management practices are broken down into three main components namely,
supplier relationship management, internal value chain activities and customer relationship
management which are found to compare with best practices globally (Kaplinksy & Morris,
2001). Supplier relationship management involves strategically planning for and managing
all interactions with third party organizations that supply goods and / or service to an
organization to maximize value of those interactions (Chen, Paulraj, & Lado, 2004). Internal
value chain activities are interdependent building blocks by which firms deliver products to
the customer, earn profit/ margins as well as develop advantages over rivals (Porter, 1985).
Finally, customer relationship management entails managing customer interactions with a
view to identifying the most valuable customers, trying to personalize activities to their needs
and then establish and maintain long-term and profitable relationships (Dawes & Swailes,
1999).
The concept of value chain management practices emerged from the realization that
appreciable, continual improvements in system design and organizational performance occurs
when businesses seek closer coordination and integration with suppliers and customers than
traditional transactional buyer-seller relationships allow (Sparling, 2007; Gruen, 1997;
Wilson, 1995). By developing closer strategic relationships with customers and suppliers,
businesses can learn and adapt more effectively thus improving and sustaining organizational
performance.

4
According to Leopoldo and Daniel (2012), value chain is a business system that creates end-
user satisfaction and realizes the objectives of other member stakeholders and therefore need
for value chain management practices to facilitate the realization of these objectives. Value
chain management practices has the potential to dramatically reduce time-to-market and to
match the increasing expectations of customers and consumers. Firms use the value chain
management practices approach to better understand which segments, distribution channels,
price points, product differentiation, selling propositions and value chain configurations will
yield them the greatest competitive advantage.
In the face of cut throat competition and the ever increasing needs of customers in the 21st
century, value chain analysis allows for an assessment of the linkages and interrelationships
between and amongst productive activities; thus providing a framework to analyze the nature
and determinants of competitiveness in a business. Linkages are relationships between the
way one value activity is performed and the cost or performance of another. In value system,
suppliers have value chains that create and deliver the input to be used in a firm. Then firm’s
products or services pass through the value chains of distributors (channels) to the buyer.
Distributors perform additional activities that affect the buyer as well as influence the firm’s
activities. At last, a firm’s product becomes part of its buyer’s value chain determining buyer
needs (Nguyen & Kira, 2001).
1.1.2 Organizational Performance
Organizations have an important role in our daily lives and therefore, successful
organizations represent a key ingredient for developing nations (Lynch, 2006). Thus, many
economists consider organizations and institutions similar to an engine in determining the
economic, social and political progress. Organizational performance comprises the actual
output or results of an organization as measured against its intended outputs/goals and
objectives. According to Porter (2013), organizational performance encompasses three
specific areas of firm outcomes: financial performance (profits, return on assets, return on
investment); product market performance (sale, market share) and shareholder return (total
shareholder return, economic value added).
On the other hand, Inayatullah and Amar (2012) pointed out that overall organizational
performance can be divided in to three parts: financial performance, product performance and
operational performance. Financial performance of organization includes: market share,
return on investment, profit margin, inventory turnover rate, and productivity. Product

5
performance includes: functionality, service, operating expenses, comfort, and ease of use.
Higher product performance enhances the customer and employee satisfaction. Operational
performance includes: product/service quality, lead time/service completion time, product
development time, utilization of resources, responsiveness to customer demand, and
operational cost.
Many organizations have also attempted to manage organizational performance using the
balanced scorecard methodology where performance is tracked and measured in multiple
dimensions to align business activities to the vision and strategy of the organization, improve
internal and external communications and monitor organization performance against strategic
goals. It is a performance management method that maps an organization’s strategic
objectives into performance metrics in four perspectives, that is: financial, customers, internal
main processes, learning and growth. It added strategic non-financial performance measures
to traditional financial metrics to give managers a more ‘balanced’ view of organizational
performance (Kaplan & Norton, 1992).
The performance measurement system employed in an organization must therefore measure
the performance of all assets including the human ones. When fully deployed, the balance
scorecard transforms strategic planning from an academic exercise into the nerve centre of an
enterprise. The Balance Scorecard includes both financial measures that tell the results of
actions already taken, and operational measures that are the drivers of future financial
performance (Kaplan & Norton, 2006).
A broader conceptualization and more effective business performance should include
indicators of operational performance in addition to those of financial performance. There are
many advantages of using non-financial measures, including the fact that nonfinancial
measures are more timely than financial ones, they are more measurable and precise, they are
consistent with company goals and strategies, and non-financial measures change and vary
over time as market needs change and thus tend to be flexible (Medori & Steeple, 2000).
Hooley, Greenley, Fahy and Cadogan (2004) noted that using financial measures alone
overlooks the fact that what enables a company to achieve or deliver better financial results
from its operations is the achievement of strategic objectives that improve its competitiveness
and market strength. Non-financial measures include innovativeness and market standing.
Performance is therefore measured by both financial and non-financial measures.

6
The choice of key performance indicators is strongly company-specific and depends on the
state, orientation, and positioning of the organization on the market, its mission statement and
vision. These will define a preference for some performance indicators as more important
than others. For example, cost efficiency and profit might be central for an organization,
others might include customer satisfaction (if the success of its operations depends strongly
on retaining customers), employees’ motivation (if a sufficiently qualified personnel is
difficult to recruit), environmental impact, growth, market share, among others (Viara &
Alexei, 2010). In this study, Managers were not willing to disclose their financial statements
to the researcher due to exposing confidentiality. Hence, this study has mainly borrowed from
perceptual measures where the market performance (sales growth, market share) was the
performance indicator.
1.1.3 Retail Sector in Kenya
Retail outlet refers to any business enterprise whose sale volumes comes primarily from
availing goods and services to the customer. These are the business entities in a distribution
channel that links manufacturers to customers. Manufacturers typically make products and
sell them to retailers or wholesalers. Wholesalers resell these products to the retailers and
finally, retailers resell these products to the consumers. However, recent approaches have
demonstrated that any organization selling to customers whether a manufacturer, wholesaler
or retailer is doing retailing (International Journal of Business and Commerce, 2013).
There are two categories of retail outlets, that is, store and non-store outlets. Store retail
outlets operate at fixed point of sale locations, are located and designed to attract a high
volume of walk-in customers unlike non-stores outlets, for example, independent stores like
hardware and bookshops. Other categories of store retail outlets are chain stores, for instance,
Naivas and Tuskys supermarkets, conventional supermarkets like Society stores and service
stores like hotels. There are two types of retailing; goods and service retailing. The main
differences between the two are on account of intangibility, simultaneous production and
consumption, perishability and inconsistency. This study focused on goods and service
retailing because the medium and large retail outlets offer goods/ products and services
(Kotler & Armstrong, 2006).
The outlook for the retail sector is strong and Kenya is starting to be seen as an ideal point of
entry for launching retail outlets and consumer goods distribution into East and Central
Africa. Only about 16.8% of the Kenyan population currently falls into the middle class, but

7
that should grow strongly. Kenya’s retail market comprises a mixture of modern retail outlets
that supply consumer goods from major international firms and informal traders or family-run
concerns that sell more basic goods. The country’s Vision 2030 includes plans to improve the
efficiency of the retail market and once the formal retail expands, there should be significant
opportunities for logistics service providers (Price waterhouse Coopers Kenya, 2013).
The retail trade sector has evolved significantly, with firms becoming more concentrated over
the last few decades. This is manifested in closer linkages between manufacturers,
wholesalers and retailers. Traditional shops selling basic products are facing stiff competition
from medium and large chain stores, supermarkets, exhibition centres and shopping malls.
Besides, there is a general reduction in the role of traditional wholesalers, with firms
integrating to provide a wider variety of value chain from manufacturer to retailer. This is
reflected in retail outlets such as Nakumatt, Tuskys, Naivas, among others, which provide
space for manufacturers in their outlets and offer a myriad of goods including fruits,
vegetables, furniture, clothing and food items (Kenya Institute for Public Policy Research and
Analysis, 2016).
Medium and large retail outlets have spread their operations in several urban centres
especially with the advent of devolution in various counties in Kenya and Nakuru County is
no exception. In a report by New York Stock Exchange research firm Nielsen, Kenya was
ranked second in terms of the degree of modernization of its retail services, behind South
Africa, in a survey targeting five Sub-Saharan economies (Nielsen, 2015). Medium and large
scale retail outlets in Kenya act as the main outlet for Kenyans to get products.
The growth of medium and large retail outlets in Nakuru County continues to face numerous
challenges that limit their growth and in some instances contributes to their eventual closure.
Though mushrooming everywhere the small retail outlets are the most affected since they are
difficult to track measure and analyze, a fact that has necessitated this research to focus on
medium and large retail outlets. Customers are attracted towards the medium and large retail
outlets because they provide all the facilities including the leading brands that they require
since they are fairly established and with formal system in place as compared to the small
ones (Liedholm, 2001).
Retail outlets must be ahead in the race for reaching and gaining of customer’s confidence by
creating a one stop shop for their businesses. Thus, there is need for management of a value

8
stream which would result in improved service, growth in market share, suppliers and
distribution channels and provides invaluable analytics for continuous improvement (Neville,
2007).
1.2 Statement of the Problem
Strategic management literature suggests that firms make strategic choices regarding the
focus of their core resources on internal value chain activities and the various buyer –
supplier relationships and the linkages between them that enhance competitive advantage
and performance (Newbert, 2007). Globally, most retail outlets face competition and a few
of them have managed to beat the same through cost reduction in their value chain
management practices and timely delivery of products and services to customers. This leads
to increased performance and competitive advantage (Agarwal & Audretsch, 2001).
In Kenya, retail outlets have faced challenges such as depressed domestic demand, inflation
and transport costs. This has exerted pressure on retail outlets to initiate various approaches
to enhance their competitiveness. A few studies have been conducted on value chain
management practices and organizational performance. A study by Ghonar (2015) on
influence of value chain activities in the performance of Safaricom Limited, Kenya
demonstrated that organizations that carry out value chain management practices enjoys
improved performance in terms of higher profits, better responsiveness in the market and
long-term market dominance which leads to enhanced performance. The study however
narrowed to recommendations that revolved around the product alone, without
encompassing the other ingredients of the value chain management practices.
Another study by Aguko (2014) on value chain performance of beer brewing industries in
Kenya recommended that value chain professionals should embrace collaborative
relationships with their suppliers to reduce value chain costs and embrace technology to
streamline operations of the value chain. The study focused on supplier relationship
management and use of technology to enhance value chain operations with little emphasis on
internal value chain activities and customer relationship management. However, the above
studies have not focused on the linkages in value chain management practices and their
contribution to organizational performance, particularly on the retail outlet sector. Therefore,
this study sought to examine the effect of value chain management practices on performance
of medium and large scale retail outlets in Nakuru County, Kenya.

9
1.3 Objectives of the Study
The overall objective of this study was to determine the effect of value chain management
practices on performance of medium and large scale retail outlets in Nakuru County. The
specific objectives were to:
i. Determine the effect of firm supplier relationship management on organizational
performance.
ii. Determine the effect of internal value chain activities on organizational performance.
iii. Determine the effect of customer relationship management on organizational
performance.
iv. Establish the joint effect of firm supplier relationship management, internal value
chain activities and customer relationship management on organizational
performance.
1.4 Research Hypotheses
The study sought to test the following hypotheses:
HA1 Supplier relationship management had a positive effect on organizational
performance.
HA2 Internal value chain activities had a positive effect on organizational performance.
HA3 Customer relationship management had a positive effect on organizational
performance.
HA4 Supplier relationship management, internal value chain activities and customer
relationship management jointly had a positive effect on organizational performance.
1.5 Significance of the Study
This study was important to management policy and practice. It sought to reveal the
management approaches that the industry players in the medium and large scale retail
businesses should adopt in order to enhance performance and create advantaged positions that
improve their profitability. The findings and recommendations of this research was to provide
some insights that will help medium and large scale retail businesses counter challenges
experienced in organizational operations. To policy makers and the government who shoulder
the responsibility of promoting sustainable development to the public, the study will help in
improving service delivery by ensuring effectiveness and efficiency of retail outlets.

10
Finally, the study will contribute to the body of knowledge in strategic management and
enrich literature for scholars. It will act as a source of reference material and stimulate further
research for future studies in business management.
1.6 Scope and Limitations of the Study
The study targeted 43 medium and large scale retail outlets in Nakuru County. It focused on
the effect of value chain management practices on performance of the medium and large
retail outlets. The study was conducted within a period of three months. The main limitation
of the study was lack of assurance that the respondents would return all the questionnaires
duly completed.

11
1.7 Operational Definition of Terms
Value Chain Management refers to approaches applied in managing integration and
Practices coordination of supplier relationship management, internal value
chain activities, customer relationship management and
linkages between them to enhance organization performance.
Organizational refers to the attainment of organizational goals in retail
Performance outlets by using resources in an efficient and effective
manner.
Supplier Relationship refers to a critical component of value chain management
Management practices that involve strategically planning for and managing
all interactions with third party organizations that supply goods
and / or service to retail outlets in order to reap maximize value
of those interactions.
Internal Value Chain these are interdependent building blocks by which retail
Activities outlets deliver products to the customer, earn profit/margins as
well as develop advantages over rivals.
Customer Relationship process of managing customer interactions with a view to
Management identifying the most valuable customers, trying to personalize
internal value chain activities according to their needs and then
establish and maintain long-term and profitable relationships.
Contextual Factors refers to economic conditions, legal factors and company laws
which are described as environmental, organizational and
individual characteristics of a firm’s external and internal
environment.
Medium Retail Outlets these are conventional supermarkets, service stores,
independent and chain stores whose sales volume involves
availing goods and services to the customer and employs
between fifty one and one hundred employees.
Large Retail Outlets these are conventional supermarkets, service stores,
independent and chain stores whose sales volume involves
availing goods and services to the customer and employs above
one hundred employees.

12
CHAPTER TWO
LITERATURE REVIEW
2.1 Introduction
This chapter reviews the theoretical perspective of the concept of value chain management
and examines past research relevant to the study. The study is guided by the resource-based
view of the firm theory. It further presents an in-depth analysis of value chain management
practices on organizational performance. It discusses the nature of these interrelationships
among variables, focusing on how value chain management affects organizational
performance and presents a conceptual framework.
2.2 Theoretical Perspective
The resource based view (RBV) of the firm theory is one of the most widely accepted
theoretical perspectives in the field of strategic management in explaining organizational
performance (Barney, 1991; Priem & Butler, 2001). Intellectual foundations for modern
resource-based theory dates back to Penrose (1959), where she emphasized that “a firm is
more than an administrative unit; it is also a collection of productive resources at the disposal
between different users and over time is determined by administrative decision”.
Moreover, Wernerfelt (1984) stated that “for the firm, resources and products are two sides of
the same coin”, directing strategy schools toward resources as important antecedents to
products. His article works as a reminder that “managers often fail to recognize that bundle of
assets, rather than the particular product market combination chosen for its development, lies
at the heart of their firm’s competitive position and improved performance.
Resource based view is a model that perceives organizational internal factors which are
responsible for generating firm sustainable competitive advantage and superior performance.
Based on these assumptions, scholars have theorized that when a firm has resources that are
valuable, rare, imitable and organization (VRIO) attributes, the resource enables the firm to
gain and sustain competitive advantage (Barney, 1991). These resources can be perceived as
bundles of tangible and intangible assets, such as a firm’s management skills, its
organizational processes and routines, and the information and knowledge under its control
(Barney, Wright, & Ketchen, 2001).
Firm resources are valuable if they enable a firm to develop and implement strategies that
have the effect of lowering a firm’s net costs and/or increase a firm’s net revenues beyond

13
what would have been the case, without these resources (Barney & Arikan, 2001). In the
parlance of a traditional strength, weakness, opportunity, threat (SWOT) framework,
resources are valuable if they enable the firm to exploit an external opportunity and/or
neutralize an external threat (Barney & Hesterly, 2012).
A rare resource means that it is controlled by a small number of competing firms. If a
resource is valuable but not rare, exploiting it will result in competitive parity, because other
firms that possess the resource also have the capability of exploiting it. A resource is
imperfectly imitable if it is substantially costly to obtain or develop for competing firms
(Barney & Hesterly, 2012). Imperfectly imitable resources suggest that firms without that
resource cannot obtain it through direct duplication or substitution. If a resource is valuable
and rare but not costly to imitate, then exploiting it will result in a temporary competitive
advantage for the firm. Once other competing firms obtain and exploit this resource (at a
minimal cost disadvantage), any competitive advantage dissipates. However, if a resource is
valuable, rare, and imperfectly imitable, exploiting it should result in sustained competitive
advantage and eventually, improved performance.
According to Barney and Clark (2007), resources may be imperfectly imitable due to unique
historical conditions, causal ambiguity or social complexity. The last condition of a resource
pertains to the organization. Even if a resource is valuable, rare, and imperfectly imitable, a
firm must be organized to exploit the full competitive potential of its resources and
capabilities. That is, poor organizational processes, policies and procedures may undermine a
resource’s potential competitive advantage. Thus, the organization acts as an adjustment
factor that either enables or prevents a firm from fully realizing the benefits embodied in its
valuable, rare and costly to imitate resources (Barney & Clark, 2007). The firm infrastructure
is a support activity that augers well with this last condition.
Resource based view theory, identifies how firm performance and its sustainability depend on
the uniqueness, rareness, and non-imitability of its resources. However, it does not adequately
explain performance differences between firms that have the same levels of uniqueness,
rareness, non-imitability and isolation of their resources (Cool, Dierickx, & Martens, 1994).
For example, in an industry, several firms may have developed core competences in
marketing and others in research and development. These core competences are idiosyncratic
to each firm and can be equally rare, non-imitable and difficult to substitute across firms. In

14
such a situation, the RBV theory cannot predict which firm would have a superior
performance.
On the other hand, Cool, Almeida and Dierickx (2002) emphasized that the firm’s resources
are the fundamental determinants of competitive advantage and performance. Resource based
view theory adopts two assumptions in analyzing this. First, this model assumes that firms
within an industry (or within a strategic group) may be heterogeneous with respect to the
bundle of resources that they control. Secondly, it assumes that resource heterogeneity may
persist over time because the resources used to implement firms’ strategies are not perfectly
mobile across firms. Resource heterogeneity (or uniqueness) is considered a necessary
condition for a resource bundle to contribute to a competitive advantage. Hence, if all firms
in a market have the same stock of resources, no strategy is available to one firm that would
also not be available to all other firms in the market.
Foss (1998) stated that the resource based view theory perspective does not escape the
general problem of finding the appropriate unit of analysis. Most contributions within this
theory take the individual resource as the relevant unit of analysis to study competitive
advantage. However, this choice may only be legitimated if the relevant resources are
sufficiently well-defined and free-standing. If, in contrast, there are strong relations of
complementarity and specialization among resources, it is the way resources are clustered
and how they interplay and fit into the system that is important to the understanding of
competitive advantage. Foss (1998) recognized that the concepts ‘capabilities’ and
‘competences’ aim perhaps at grabbing this clustering and interplay. The conceptual
framework takes this problem into account by relating competitive advantage to strategy
rather than to individual resources.
More recently, three approaches have emerged to extend the resource based view
theoretically. First, the Dynamic capabilities theory of the firm (Helfat, 2000) focuses on the
resource side of the firm. This resource-based view incorporates the notion central to
dynamic capabilities that resources and capabilities are continually adapted, integrated,
and/or reconfigured into other resources and capabilities (Teece, Pisano, & Shuen, 1997).
Secondly, attention shifted to the relationship between resources and strategy implementation
(Hitt, Bierman, Shimizu, & Kochhar, 2001). The realization of the potential value of
resources is dependent on the strategy of the firm and how the strategy is implemented and
resources are utilized (Newbert, 2007).

15
Finally, Wiggins and Ruefli (2005), demonstrated that the internal resources of a firm rather
than the external environment around the firm are possibly the primary source of improved
organizational performance differences among firms. This result has brought a growing
number of researchers to the RBV of strategic management to explain the differences by
focusing their attention on resource heterogeneity in an industry and the source of sustainable
competitive advantage of the firms. A firm is said to have a competitive advantage when it
can produce more economically and/or better satisfy customer needs, and thus enjoy superior
performance relative to its competitors. Hence, this study adopted resource based view theory
because both the internal value chain activities and the various buyer–supplier relationships
and the linkages between them are core resources that enhance competitive advantage and
performance.
2.3 Value Chain Management Practices
Hardacre and Collins (2008); Gabriel (2006) defined value chain management practices as
approaches applied in managing integration and coordination of supplier relationship
management, internal value chain activities, customer relationship management and linkages
between them to enhance organization performance. Value chain management practices are
broken down into three main components namely, supplier relationship management, internal
value chain activities and customer relationship management which are found to compare
with best practices globally.
Developing closer strategic relationships with customers and suppliers enables organizations
to learn and adapt more effectively than if operating unilaterally. According to Marete
(2010), the purpose of a value chain is to achieve whole and seamless interaction among
stakeholders to create a win-win situation. Comprehending these relationships and their
various impact to the value of an organization’s products and services is a vital component to
the success of the organization.
Porter (1985) developed a general-purpose value chain that organizations can use to examine
all of their internal value chain activities and how they’re connected. The value chain
activities of an organization determine the costs, thus affects the profits. The main idea then
was to use it as an analysis tool for strategic planning. Value chain focuses on systems and
how business inputs are changed into business outputs purchased by customers. Porter
described the value chain framework as an interdependent system or network of activities,

16
connected through linkages which, if managed well, could be a relevant source of good
performance (Pathania-Jain, 2001).
Porter (1998) analyzed the value chain in five steps; First, Porter identified the various
distinct internal value chain activities that the organization undertakes and categorized them
as either primary or support activities; he then grouped these activities by type, for example
whether direct , indirect or quality assurance. Porter then sought to establish the linkages of
these activities within the value chain. Next, he carried out an assessment of the distinct
activities or combinations of activities that have the potential to add value to the customer.
Finally, he developed a strategy to apply changes to those activities that contribute to
performance, which leads to competitive advantage of the firm. Porter concluded that the
various internal value chain activities performed by an organization contribute to its overall
performance.
Shank and Govindarajan (1993) stated that the value chain management practices for any
organization is the value-creating activities from the beginning (supplier’s basic raw material
sources) to end (final product delivered to the final consumer) of the chain. The organization
value chain commences with the value-creating processes of suppliers, who offer the raw
materials and components. It then continues with the value-creating processes of various
classes of consumers and culminates in the disposal and recycling of materials. This
description views the organization as part of an overall chain of value-creating processes.
Kaplinsky and Morris (2001) summarized the elements of the value chain as design,
production, marketing, distribution and support to get the product to the final user. The
activities that comprise a value chain may be contained within a single firm or may be
embraced in many firms. They can be limited to a single country or stretch across national
boundaries. Firms can be embedded in horizontal or vertical linkages depending on the type
of relationships between them.
Bonney et al (2007) demonstrated value chain management practices as a more intergrated
and cross functional decision making approach that sees organization use their
complementary capabilities and knowledge to jointly develop the resources necessary to
deliver superior value to customers. This leads to ability to produce, process, deliver and
market products more effectively and efficiently. In addition, they pointed out factors that
impact business costs and relate to value chain management practices namely scale, learning,

17
capacity utilization, vertical integration, interrelationships, linkages, location, timing, policy
decisions and government regulations.
Value chain management practices have been modified and the application of ideas to
development issues incorporated with increased modernization and globalization. As Gereffi
and Korzeniewicz (1994) put it, attention is now shifting to global commodity chain (GCC).
Subsequent approaches have focused predominantly on the value network of Porter in terms
of the relationships and linkages between firms, rather than solely at value creating functions
within a firm. These relationships and linkages, that is, supplier relationship management,
customer relationship management and internal value chain activities form the basis of value
chain management practices (Kaplinksy & Morris, 2001).
2.3.1 Supplier Relationship Management
Supplier relationship management (SRM) is the discipline of strategically planning for and
managing all interactions with third party organizations that supply goods and / or service to
an organization to maximize value of those interactions. An effective supplier relationship
management is a critical component of value chain management practices in that suppliers
will participate early in the product design thus offer more cost effective design choices, help
select the best components and technologies, and help in design assessment. Hence, both
retailers and customers will gain satisfaction as a result of quality products going at
reasonable prices (Chen, Paulraj, & Lado, 2004).
Bresnen and Marshall (2000) postulated that in many fundamental ways, supplier relationship
management is analogous to customer relationship management. Just as organizations have
multiple interactions over time with their customers, so do they also interact with suppliers
when negotiating contracts, purchasing, managing logistics and during delivery. The genesis
for defining SRM is a recognition that these various interactions with suppliers are not
discrete and independent instead they are accurately and usefully thought of as comprising a
relationship, one which can and should be managed in a coordinated fashion across functional
and business units and throughout the relationship lifecycle.
Flynn, Huo and Zhao (2010) revealed that SRM necessitates a consistency of approach and a
defined set of behaviors that foster trust over time. Effective supplier relationship
management requires not only institutionalizing new ways of collaborating with key

18
suppliers, but also actively dismantling existing policies and practices that can impede
collaboration and limit the potential value that can be derived from key supplier relationships.
At the same time, SRM should entail reciprocal changes in processes and policies at
suppliers. The degree in which relationship continuity is perceived by a trading partner
conditions the trading partner’s anticipation of prolonging of the relationship in the future. In
the early days of the relationship both partners are willing to invest in the relationship in
order to benefit from the advantages that are associated with close collaboration and
relationship continuity.
According to Goffin, Lemke and Szwejczewski (2006), maintaining a strong successful
relationship between buyer and supplier becomes essential to both parties. Hence, care should
be taken while choosing the supplier to make sure that they have the required capabilities and
resources to fulfill the needs. From the buyer’s perspective, the benefits of close relationship
with suppliers at operational level are given as improved quality of products or services,
reduced cost and lead-time or service completion time. At the strategic level, the benefits are
obtained in the form of enhanced competitiveness, increased market share and innovation.
Wilson (1995) proposed that buyer-seller relationships advance through various phases of
development. In each phase, he proposed that different relationship variables would have
varying levels of importance. Trust, satisfaction, power and comparison level of alternatives
were proposed to be important during partner selection and defining purpose of the
relationship. Commitment was important to the relationship when the goal was to create
value and maintain the relationship. Other constructs were also proposed to have varying
degrees of importance throughout the relationship life cycle.
In value chain management practices, relationships are key if the objectives of a business are
to be met. Suppliers are often treated in an adversarial manner by buyers since the kind of
relationship between the two is viewed as a win-lose situation. However, most forward
looking firms have found it more effective to work collaboratively with their suppliers to
ensure the satisfaction of the ultimate customer. Terms such as alliances, partnerships,
collaborative relationships and boundary-less organizations have been used to describe these
new buyer-supplier relationships (Corsten & Felde, 2005).
Moreover, competition is no longer company against company, but rather supply chain
against supply chain (Fawcett & Magnan, 2002). Accordingly, supplier as the critical

19
determinant of superior quality and lead time plays more and more fundamental role in the
value chain. Thus, helping suppliers to control their quality of input material and processing
variability and also reduce their cost could in turn, enhance the firms performance and
competitiveness (Prajogo, McDermott, & Goh, 2008).
Finally, long-term collaborative relationships with a few trusted suppliers have been
described as representing a general trend over the past decade. There is said to be ‘growing
evidence that to be competitive firms are moving away from the traditional approach of
adversarial relationships with a multitude of suppliers to one of forging longer term
relationships with a selected few suppliers’ (Kalwani & Narayandas, 1995).
2.3.2 Internal Value Chain Activities
The concept of value chain was based on the premise that every company is a collection of
activities that are performed to design, produce, market, deliver and support its product. The
relevant “value” activities are defined as the physically and technologically distinct activities
that a firm performs to achieve its objectives. In addition, the profitability of a retail outlet
relies upon how effectively and efficiently it manages the internal value chain activities; price
that the customer is willing to pay for the retail products and services exceeds the relative
cost of the internal value chain activities (Anandarajan & Arinze, 1998).
Internal value chain activities are related by linkages within the value chain. Linkages can
lead to competitive advantage through optimization and coordination. Linkages often reflect
tradeoffs among the activities to achieve the same overall result, for example, a more costly
product design may reduce service costs. A firm must optimize such linkages reflecting its
strategy in order to achieve competitive advantage. Another way to competitive advantage in
linkages is to coordinate the activities. The ability to coordinate linkages often reduces cost or
enhances differentiation (Porter, 1998).
Porter (2013) derives the concept of “margin” which is the difference between total value and
the collective cost of performing the value activities. Porter’s value chain is developed mainly
for an item or product manufacturing businesses and focuses on the added value that each
activity contributes within a process. He divided the activities into two groups: primary
activities which were typically directly involved in the logistic product flow and the support
activities which dealt with more indirect activities.

20
According to Porter (1998), competitive advantage starts with the premise that competitive
advantage can arise from many sources, and show how all advantages can be connected to
specific activities and the way that activities relate to each other, to suppliers, and to customer
activities. The fact is that most robust competitive positions often cumulate from any
activities. Advantage resting on a few activities is easier to diagnose and often easier to
imitate.
Porter (1998) explained that cost leadership is based upon exploiting some aspects of internal
organizational processes that can be executed at a cost significantly lower than the
competition. There are various sources of this cost advantage. These include lower input
costs, lower in-plant productions and lower delivery costs brought about by the proximity of
key markets. However, porter (1998) stressed that focused and overall market cost leadership
represents a “low scale advantage” because it is frequently the case that eventually a
company’s advantage is eroded by rising costs. The generic alternative of differentiation is
based upon offering superior performance.
2.3.3 Customer Relationship Management
It is worth noting that the concept of customer relationship management (CRM) can be
defined in numerous ways. It also means different things to different people; depending on
the work environment it has been used in (Dimitriadis & Stevens, 2008). However, to enrich
the CRM literature, this study defined it as a process of managing customer interactions with
a view to identifying the most valuable customers, trying to personalize activities according
to their needs and then establish and maintain long-term and profitable relationships (Dawes
& Swailes, 1999).
According to Suhong, Nathan, Nathan and Rao (2004), CRM is an important component of
value chain management practices in that committed relationships have the most sustainable
advantage because of their inherent barriers to competition. The growth of mass
customization and personalized service is leading to an era in which relationship management
with customers is becoming crucial for corporate survival. Moreover, close customer
relationship allows each retailer to differentiate its products from competitors, sustain
customer loyalty and dramatically extend the value it provides to its customers.
There are important issues in achieving CRM success such as strategic, organizational and
technological issues. Even though technology, business processes and top management

21
support are critical to CRM implementation, successful organizations view technology as a
tool to aid build profitable customer relationships while recognizing that individual
employees are the building blocks (Kennedy, Kelleher, & Quigley, 2006). The critical
success factors required for the effective implementation of the CRM system considered are
information quality, system quality, service quality, top management support, and
technological readiness.
The life cycle of customer relationship management can be divided into four phases:
obtaining, capturing, increasing and maintaining the relationship. Each phase has their
individual attributes, which are to be kept in mind when planning practices and objectives of
the relationship. Maintaining the relationship is vital. Often suppliers become too comfortable
once they have created a seemingly steady relationship with the customer, and they forget to
actively promote further services. Marketing is still important at this stage since the customer
is more likely buy a service they need from a company they are already in business with than
to look for another supplier. However that assumption requires that the client is happy with
their current supplier’s delivery (Mäntyneva, 2001).
In buyer-supplier relationship, time and resources that have been used to capture and increase
the customer relationship would be wasted if the customer decided to take their business
elsewhere. There are financial profits to be gained from long-term relationships with
customers. However, even a loyal customer is not necessarily a profitable customer
immediately due to the resources that are used to capture client and increase the relationship.
The cost to manage the customer relationship decreases over time when the supplier has more
information about the customer and is able to serve the client more efficiently based on that
information. Thus, a satisfied customer is often willing to pay the price of the quality services
they receive (Ylikoski, 2000).
Wulf, Odekerken and Iacobucci (2001) suggested that different levels of relationship duration
would result in different levels of consumption experience which produce different outcomes.
This also infers different relationship marketing tactics will produce different levels of
satisfaction and loyalty. Relationship marketing helps organizations to retain customers for
the long term and show the customer that the organization cares for its existing customers as
much as the new ones and that satisfaction of the customers over the long run are of critical
importance.

22
The organization must be responsive to the customers and also provide them not only with
what they need, want, value and desire but also anticipate the same. Customers are an
organization’s central resource without which the organization cannot function for all intents
and purposes. CRM is therefore a continuous learning process which aims to increase the
organization’s knowledge and understanding of its customers, hence transforming customer
culture in the organization, depending on what is the starting point and how deeply the
organization engages in it (Masoomeh, Reza, & Kambiz, 2015).
2.4 Organizational Performance
Performance forms the basis of strategic management literature and research studies. Many
organizational performance systems utilize some of the recent approaches namely; total
quality management (TQM), balanced scorecard, business process re-engineering or
benchmarking. Definitions of organization performance vary, but practitioners are
converging on a common understanding with frequent reference to how effectively and
efficiently organization resources are utilized in generating economic outcomes and attaining
organizational goals. Performance measures are concerned with input aspects, mainly
financial resources (Platt, Hertenstein, & Brown, 2001).
Different researchers have proposed different variables as being the fundamental variables
that ensure good buyer-supplier relationships. Performance, a quality of any company, is
achieved by valuable outcomes such as higher returns, level of competitiveness and brand
presence. It can also be measured by the levels of operational efficiency and this can be
analyzed by a variety of methods, such as the parametric (stochastic frontier analysis) and
non-parametric (data envelopment analysis). The management of any company would like to
identify and eliminate the underlying causes of inefficiencies, thus helping their firms to gain
and attain sustainable competitive advantage, or at least, withstand the challenges from others
(Yang, Wang, & Su, 2006).
Mahapatro (2010) defines organizational performance as the ability of an organization to
fulfill its mission through sound management, strong governance and a persistent
rededication to achieving results. Effective nonprofits are mission-driven, adaptable,
customer-focused, entrepreneurial, outcomes oriented and sustainable. Measurement of
organizational performance continues to be a contentious subject among organizational
researchers, both in terms of definition and measurements because of its multifaceted and
23
multidimensional nature (Ongeti, 2014). However despite this argument, organizations with
defined measurable performance indicators perform better than those without.
Olsen and Ell ram (1997) postulate that the reason why organizations always need to measure
the performance is to support better managerial decisions and effectively adjust the
relationship to their goals. Moreover, performance measurement also underlines the needs for
personnel training and helps to provide suppliers with feedback in order to prevent or correct
any problems that might arise. Most importantly, the measurement results can stimulate and
direct action as well as behavior of suppliers. Fogg (2009) indicates that purchasing
organizations measure because they want to make sure the performance goes in line with
what has been agreed, to identify any possibility for process improvements as well as to
indicate any drawbacks from both sides.
According to Lusine, Alfons and Olaf van Kooten (2007), there are four performance
measures used to assess the success of value chains in a firm. These are efficiency, degree of
responsiveness, flexibility and quality. Efficiency is measured in terms of production costs,
profit, return on investment and level of inventory; Degree of responsiveness is measured
through fill rate, product lateness, customer response time, lead-time, shipping errors and
customer complaints. Flexibility is measured through customer satisfaction and the flexibility
in volume and lost sales. Quality is measured through product safety and health, shelf-life,
product reliability and convenience, characteristics of production and marketing systems.
Moreover, the complexity of performance is perhaps the major factor contributing to the
debate. Despite such debate there is general agreement among organization scholars that
objective measures of performance are preferable to subjective measures based on manager
perceptions (Beal, 2000). However, objective data on the performance of small and medium
enterprises is usually not available because most small and medium enterprises are privately
held and the owners are neither required by law to publish financial results nor are they
usually willing to reveal such information voluntarily to outsiders.
When financial statements and accounting data are available, they may be inaccurate because
they are usually unaudited. On the other hand, chief executive officers or owners of small and
medium enterprises are inclined to provide subjective evaluations of their firms’
performance. For example, Chandler and Hanks (1994) used such perceptual performance
measure by asking on six items. Three items were used to measure growth: perceived growth

24
in market share, perceived change in cash flow and sales growth. Three items also were used
to measure business volume: sales, earnings and net worth.
The correct performance measures might be influenced by the size of the firm and the
ambition of the management/entrepreneur. There is evidence in the literature that many small
and medium retail outlets establish businesses for reasons other than wealth creation. The
entrepreneur often starts a business with the declared intention of becoming independent and
(then) maintains independence by keeping operational control (Gray, 1997). This is supported
by an EIM study in which most entrepreneurs responded that the most important objective is
perpetuation or survival, the second most objective is independence. Growth comes in third
place (Meijaard et al., 2002).
Measures of profitability (cash flow) may not be the first objective of the entrepreneur and
thus not measure success (defined as achieving the objectives) adequately. Moreover,
sometimes in small and medium retail outlets subjective goals can be considered more
important than objective measures of performance. On the other hand, a certain level of
profitability is required to remain independent and/or for the continuation of the firm. As a
result, Postma and Zwart (2001) argue that in order to measure the multidimensional
performance construct, both objective and subjective measures should be included in the
measurement instrument.
In 21st century business environment, retail outlets like any other organizations, can no longer
be measured solely on past financial performance which is an excellent indicator of future
results, but it cannot be the single most base for measurement. Thus one has to balance all
business areas, through focusing on financial outcomes, sales, market share, number of
customers and stock level (Darroch, 2005).
Many organizations have also attempted to manage organizational performance using the
balanced scorecard, where performance is measured in multiple dimensions. It maps an
organization’s strategic objectives in four perspectives – financial, customer, internal
processes and learning and growth. A balanced scorecard offers a comprehensive view of a
business, which in turn aids organizations to act in their best long-term interests since it
added strategic non-financial performance measures to the traditional financial metrics to
give managers a more balanced view of organizational performance (Kaplan & Norton,
1992).
25
Kaplan and Norton (1992) listed various methods to measure the overall organizational
performance which are; accounting measures (profitability measures, growth measures,
leverage, liquidity and cash flow measures), operational performance (market share, changes
in intangible assets such as patents or human resources, customer satisfaction and stakeholder
performance market based measures (return on shareholder performance), market based
measures (return on shareholder, market value added, holding period returns, Jensens alpha
and Tobins Q), survival measures (takes time horizons of five years and less) and economic
value measures (residual income, economics value added and cash flow return on
investment).
The work of Simons (2000) suggests that financial (accounting) measures can facilitate the
innovation process when we consider how these measures are used. While financial measures
used in a diagnostic (monitoring) manner may curb the innovation process, financial
measures used in an interactive (opportunity seeking, learning) manner may enhance the
innovation process fundamental to differentiation strategies. Firms pursuing a differentiation
strategic focus are likely to use both financial and non-financial performance measures, and
therefore, it is important to examine whether financial and non-financial performance
measures are associated with different aspects of organization performance.
According to Yeo (2005), differentiating firms will use financial performance measures to
evaluate their financial performance (that is how well they have extracted profits from the
market), and concurrently use non-financial performance measures to provide additional
insight into their non-financial performance (that is, to measure how well they have created
value for their customers). By monitoring their financial and non-financial measures,
differentiating firms are more likely to achieve sustained competitive advantage in relation to
both financial and non-financial dimensions of organization performance.
Organizational performance therefore guides the business on the direction it is headed and
not only where it has been; this can be done through performance measurement which
demonstrates various benefits to organizations namely how an organization performs, how
well an organization does, how much progress an organization makes over time in attaining
goals and aids the organization in managing change (Yeo, 2005). Kaplan and Norton (1996)
capture all this in one statement; “if you can’t measure it, you can’t manage it”.

26
2.5 Value Chain Management Practices and Organizational Performance
Value chain management practices is one of the most systematic approaches to examining the
performance of firms. In all retail outlets in the 21st century, the growing integration of the
economy has offered the opportunity for substantial performance and increased profitability.
Retail outlets are realizing that they no longer have complete control over their market
success since they rely heavily on the performance of their supply chain. For retail outlets to
survive, they must supply what clients want to purchase, and they must survive competition.
Ghonar (2015) carried out a study on value chain activities on organizational performance of
Safaricom Limited, Kenya and concluded that organizations that carry out value chain
management practices in their organizations often enjoy improved performance in terms of
higher profits, better responsiveness in the market, long-term market dominance and long-
term competitive advantage. The study was based on resource-based view theory and
dynamic capability models.
Porter (1985) pointed out factors that impact organizational performance and value chain
management activities in organizations. They include linkages, interrelationships, location
and timing. Value chain is not a collection of independent activities, but rather interconnected
value chain activities through linkages and interrelationships which are the primary means of
achieving competitive advantage. Medium and large scale retail outlets must optimize the
linkages in the value chain in order to achieve competitive advantage and sustained
performance. They not only undertake activities in supplying goods and services to the
customer but they also impact those in marketing, and vice versa.
Loko and Opusunju (2016) studied the relationship between value chain and performance in
agro allied small and medium scale enterprise in Sokoto, Nigeria. They alluded that the
ability of management to co-ordinate linkages often reduces cost or enhances differentiation.
Co-ordination of linkages implies that a firm’s cost or differentiation can result from the way
linkages are managed as well as the efforts to reduce cost or improve performance in each
value activity individually. They also recommended that agro SMEs should continue to
improve on value chain activities since it contributes significantly to the performance of the
agro SMEs in Sokoto, Nigeria.
Olhager (2012) investigated the role of decoupling points in value chain management
practices and found that there is one dominant customer order decoupling point (CODP)
along the material flow of the value chain. From a company perspective, the CODP can be

27
positioned inside their manufacturing operations or it can be positioned at the suppliers (first
tier or even further upstream in the value chain), at the interface with the supplier (raw
material inventory), at the border towards the customers (at some finished goods inventory)
or even further downstream in the supply chain.
Timing also plays a vital role in value creation. Opportunities created in the present, which
will be realized in the future are valued in the present but are based upon individual
assumptions about future actions and conditions. These assumptions about future outcomes
vary based upon the observer perceptions. In a study on value chain analysis and
organizational performance of beer manufacturing companies in Kenya, Aguko (2014)
demonstrated that an ideal measure must take into account information on both historical
organization performance and future organization performance expectations which depend on
the actions recently to create strategic alternatives and opportunities. Therefore, the value of
the opportunities created relates to past actions and, accordingly, this value should be
included in a performance measure as the risk adjusted present value of the opportunities.
A study by Schiebel (2005) on value chain analysis and competitive advantage in
telecommunication firms in the United Kingdom indicated that the value chain analysis does
not only reveal cost advantages but also brings attention to several sources of differentiation
advantage relative to competitors. It equally identifies those activities that are critical to buyer
satisfaction and market success. This enables the firm to achieve above-average customer
satisfaction that breeds customer loyalty, increased market share and higher profit margin.
The study was based on value chain model.
2.5.1 Supplier Relationship Management and Organizational Performance
In market economies, retail outlets are confronted with competition when selling to
customers and they use the market competition when purchasing from suppliers. On the other
hand, market constellations can change, when many customers compete for limited resources
or raw materials provided by few large suppliers. In these situations, prices, values as well as
ensured profitability within each company are decisive for the sustainable survival of the
business performance (Corsten & Felde, 2005).
Michel, Philippart, Verstraete and Wynen (2008) explained that, technology plays a critical
role in supplier relationship management. Organizations with similar level of technology can
adopt SRM since it is easy to detect when an organization is out of stock through integrating

28
systems thus reduce prolonged cycle times and consequently improve organization
performance. However, lack of advanced technology is a challenge in supplier relationship
management in that, two organizations which have different technologies may find it difficult
to develop SRM since the supply chain network may be broken down due to incompatibility
between the two companies making it difficult to operate.
In supplier relationship management, the biggest responsibility lies with the supplier. The
success of a buyer to supplier relationship is determined by the supplier. If the supplier is
reliable, the organization is likely to improve efficiency on its supply chain channels and
organizational performance. The proximity between the supplier and the organization is
important to consider in SRM. An organization should find a supplier who is within reach in
times of need as this helps in cutting transportation costs and reduced cycle times leading to
increased organizational performance (Khalfan, McDermott, & Swan, 2007).
In addition, the strategic management of buyer-supplier relationships is central to the success
of value chain management in firms. Particularly, strategic relationships with critical
suppliers must be well construed in order to optimize on value creation in retail outlets.
Studies have shown that successful management of these relationships contributes to firm
performance. Chen, Paulraj and Lado (2004) argued that strategic supplier relationship plays
an important role in earning a competitive advantage for a firm and for this purpose; it needs
to strengthen its ties with various suppliers in order to reap long term rewards.
Wagner (2010) stressed the fact that strong cords with suppliers help in enhancing creativity
and quality products. Suppliers should be encouraged to improve on quality of their products
or services rather than reducing prices since the benefits accrued from the former are far
much enormous than the latter. Narain and Sigh (2012) further suggests that trust and
communication can make or destroy the strategic supplier relationships and should thus be
guarded jealously if performance is to be achieved and sustained. Many organizations have
recognized that their competitiveness is based to a large extent on the ability to establish a
high level of trust and co-operation with suppliers (Buono, 1997). Therefore, organizations
must choose the suppliers that enable them to increase competitiveness and performance,
with emphasis to quality.
Buyer-supplier relationships have increasingly become strategic and the process of relation
development is accelerated as organizations strive to create relationships to achieve their

29
goals. At this stage, trust becomes the leading actor to govern the buyer-supplier relationship.
A sincere desire is required for organizations to proceed in trust building activities. An
essential phenomenon related to these relationships is that many buyers are developing single
source suppliers because of the pressure to increase quality, reduce inventory, develop just-
in-time systems, and decrease time to market. The ultimate goal in developing these
capabilities is to reduce costs hence improve organization performance (Kannan & Tan,
2005).
A close examination into previous studies on supplier relationship management and
organizational performance has been conducted. The studies below were based on
collaborative relationships (partnerships) supplier management model. Wachira (2013)
carried out a study on supplier relationship management and organizational performance on
alcoholic beverage industry in Kenya and alluded that by adopting collaboration relationships
with suppliers positively contribute to competitive advantage, value creation and
performance. The study utilized descriptive and multiple regression analysis to determine the
relationship between Supplier Relationship Management and Supply Chain Performance. A
study by Ratemo (2011) on supplier relationship management of procurement performance
revealed that companies that failed to maintain good relationships with suppliers lead to poor
performance.
A study by Lahiri, Kedia and Mukherjee (2011) identified that higher partnership quality
between the buyer and the supplier leads to increased performance benefit and management
capability of the firms. Close relationship means risks and rewards should be shared by the
channel members. They also should be willing to sustain the relationship for a long period of
time. Another study by Mwirigi (2011) sought to establish the role of supply chain
relationships in the growth of small firms in Kenya. The findings of this study indicated that a
strong sustainable relationship between an enterprise, customers and its suppliers have a
bearing on the speed of growth in transactions and profitability of organizations.
Tangus (2015) studied the effect of supplier relationship management practices on
performance of manufacturing firms in Kisumu County, Kenya. The study found out that
trust is a critical factor fostering commitment among supply chain partners. In addition, the
presence of trust improves measurably the chance of successful organization performance. A
lack of trust among supply chain partners often results in inefficient and ineffective
30
performance as the transaction costs (verification, inspections and certifications of their
trading partners) mount.
2.5.2 Internal Value Chain Activities and Organizational Performance
Internal value chain activities of the firm are building blocks by which firms deliver products
to the customer, earn profit/margins as well as develop advantages over rivals. These
activities do not operate in isolation but in a cohesive manner as an interdependent system
which is related to each other through linkages. Internal value chain activities and linkages
together lead to the competitive advantage and sustained performance through optimization
and coordination. This reduces cost or enhances differentiation (Porter, 1985).
Linkages are numerous, but the most obvious are those between support activities and
primary activities. More subtle linkages are those between primary linkages. Linkages exist
not only within a firm’s value chain. There are also so called vertical linkages between a
firm’s value chain and the value chains of supplier and channels. These linkages are similar
to linkages within the firm’s value chain. The way supplier or channel activities are
performed affects the cost or performance of firm’s activities and vice versa (Porter, 1998).
The linkages between suppliers’ and channels’ value chains and a firm’s value chain provide
opportunities for the firm to enhance its competitive advantage. It is often possible to benefit
both the firm and suppliers or channels by influencing the configuration of suppliers’ or
channels’ value chains to jointly optimize the performance of activities or by improving
coordination between a firm’s and suppliers’ or channels’ chains (Porter, 1998).
Venu (2001) demonstrated that the performance of an organization depends heavily on cost
leadership as one of the strategies that can be employed by organizations to ensure that they
improve and sustain their performance. This strategy involves the firm winning market share
by appealing to cost-conscious or price-sensitive customers. It is achieved by having the
lowest prices in the target market segment, or at least the lowest price to value ratio (price
compared to what customers receive). To succeed at offering the lowest price while still
achieving profitability and a high return on investment, the firm must be able to operate at a
lower cost than its rivals.
According to Pollitt and Bouckaert (2000), a company that succeeds in using the
differentiation strategy will no doubt enjoy a competitive edge over rivals. Such a positioning
for the firm does have an implication on the performance of such a company because once

31
there is a perceived superiority of a company’s products over others in the market or just
some element of uniqueness, customers will go for the product. In the event that this occurs,
the sales volumes of the company shall soar. The implication of this is improved financial
performance for the company.
In order to enjoy the benefits accrued from value chain, Porter (1985) identified nine value
chain primary and support activities within an organization and linked them to the
competitive strength of the organization. He argued that the ability to perform these activities
and manage the linkages between them is a source of competitive advantage and general
corporate success. For instance, if the marketing and sales function delivers sales forecasts
for the next period to all other departments in time and in reliable accuracy that procurement
will then be able to order the necessary material for the correct date.
Again, if procurement does a good job and forwards order information to inbound logistics
then the operations will be able to schedule production in a way that guarantees the delivery
of products in a timely and efficient manner as pre-determined by marketing. The synergy
and seamless cooperation and well coordinated information flow between the value chain
activities eventually contributes significantly to organizational performance (Porter, 1985).
According to Porter (1998), each of the internal value chain activities can be vital to
competitive advantage depending on the industry. In any firm, however, all the primary
activity categories will be present to some degree (as seen in the retail sector outlets) and play
some role in organizational performance. Support activities aid the primary activities and
among each other and therefore help to improve effectiveness or efficiency of the primary
activities. A number of researchers have opined that the customers of service firms do not
buy tangible products or even tangible service products but they buy a result. This end result
can only be positive if the internal value chain activities are well managed and linked to
enable organizations realize a profit margin. This means that the organization is able to
deliver a product or service for which the customer is willing to pay more than the sum of the
costs of all activities in the value chain. The support activities that are the major contributors
to organizational performance in the retail outlets have been discussed in detail in this study.
The main objective of every firm is to secure the lowest cost for purchases of the highest
possible quality. Therefore, procurement costs, if not well managed, may account for a
significant portion of the total cost of production. Porter (1998) asserts that improved
purchasing practices can strongly and positively affect the cost and quality of purchased

32
inputs. When well implemented, procurement practices in an organization, forms an efficient,
quick and accurate management tool that reduces cycle time and builds reliability thereby
impacting positively on an organizational performance. Procurement best practice will seek
to lead to improvement in quality and reduction in cost as it improves proper allocation of
firm resources, high quality and timely procurement and budgetary saving and increase
profitability in the organization.
Technology development refers to the optimal use of technology to improve products,
services and their delivery to customers. Technology therefore cuts across both primary and
support value chain activities. If well managed, technology can be a powerful source of
sustainable performance in the organization. Winter (1995) notes that well managed
technology can simultaneously deliver both low cost and high quality goods and services.
Information system technology is particularly pervasive in the value chain, since every value
activity involves creating, processing and the communication of information. Information
technology not only affect the sales side of the organization but also has the potential to
influence all primary and support value activities, eventually improving performance if well
managed (Porter, 2001).
According to Rayport and Sviokla (1995), managers must continue to oversee a physical
value chain, but they must also build and exploit a virtual value chain. To succeed in this new
economic environment, management must understand the differences between value creation
and extraction in the physical and virtual world: they must manage both effectively and in
concert. There are three stages to virtual value chain. The first stage is whereby the managers
use large-scale information technology systems to coordinate activities in their physical value
chains and in the process lay the foundation for a virtual value chain. In the second stage,
companies begin to create a parallel value chain. Lastly, managers draw on the flow of
information in their virtual value chain to deliver value to customers in new ways.
Human resource development is another vital support activity that transcends all other
activities of the value chain. It is an integral linkage that employs all the primary and support
activities to effectively and efficiently attain a stellar performance for the organization. A firm
may pursue the differentiation strategy based on innovativeness of its human resource capital.
Capon (2008), further notes that the human resource function is concerned with recruiting,
managing, training, developing and rewarding staff in a manner that helps the firm achieve

33
the highest form of competence and enhance performance. Human resource activities impact
on motivation, attitude and staff turnover, aspects that are critical to any firm.
A study carried out by Reichheld (1993) proved that a few percent reduction in employee
turnover rate may have as a result an increase in profitability by 50%. Pinar and Girard
(2008) conducted a survey examining the effect of employee’s satisfaction and dedication to
the firm on organizational performance. Respondents were asked to agree on a number of
statements designed to highlight the employee’s satisfaction and dedication of employees to
the firm. The results revealed that employee’s satisfaction and dedication to the firm lead to
improved organizational performance. The above studies were based on value chain model.
Firm infrastructures are activities that are required to perform the value added activities
efficiently to drive the organization forward to meet the strategic plan and the objectives. A
firm operating in a turbulent environment will require a flexible structure to facilitate
development of a value chain good enough to provide a strategic match between the
organization and its environment. Firm infrastructure includes the structure, culture and
systems. Contrary to the popular belief that infrastructure is basically an overhead, Porter
(1998) asserts that it can as well be a powerful source of competitive advantage especially in
service sectors where image and business relationships cannot be wished away. Issues of the
firms culture, quality control, legal issues and the extent to which the top management is in
touch with the customer, are strategic issues.
Urbig (2003) conducted a pilot study to investigate “the implications of the value chain for
firm and industry analysis”, among selected companies in Berlin. The study revealed that the
value chain management practices enables companies’ executives to control cost drivers
better than the competitors and thus creating above average performance in operational
efficiency, profitability, market share, customers’ satisfaction, innovations, quality and assets
utilization. The study was based on value chain model.
2.5.3 Customer Relationship Management and Organizational Performance
Customers have become crucial for every organization due to the competitive environment,
that business operate in. Different buyer-supplier relationships offer different benefits to buyer-
firms. Moreover, buyer-supplier relationships change while they develop. Just as a company
needs to develop relationships with its supplier, it also needs to foster relationship with its

34
customers. The desired outcome is a win-win relationship where both parties benefit; leading
to increased organization performance (Dawes & Swailes, 1999).
Customer relationship management (CRM) capability is a valuable and relatively difficult to
imitate asset for achieving superior performance of the business because it requires a lot of
time in developing, managing and upgrading them (Hooley, Greenlay, Cadogan, & Fahy,
2005). The business world is spending huge amount of money for building CRM capabilities
but majority of time they fail to attain the desired performance. This is because organizations
are unable to use CRM resources to build the capabilities and gain a sustainable competitive
edge. As a result there is an intense need to develop capabilities of CRM in order to survive
in competition.
The nature of managing successful strategic customer relationships requires both buyer and
supplier staff to collaborate on developing ideas that will ultimately grow into innovation and
proactivity. It’s not simply about the supplier delivering hard tangibles to the requirements of
the customer. By disregarding measurement of the qualitative component in the relationship,
buyers lose the ability to gain a meaningful competitive advantage. Hence, the customer
remains as one of the key component of performance measurement using the Balanced
Scorecard Model (Kaplan & Norton, 1992).
To reinforce customer orientation on a day to day basis, a growing number of organizations
choose customer satisfaction as their main performance indicator. By using this indicator
organizations modify their goods and services as per the preferences of the customers.
Customer satisfaction leads to customer retention that ensures business growth and
profitability. A satisfied customer: stays loyal longer, buys more as the retailer introduces
new products and upgrades existing brands, talks favorably about the retailer and its
merchandise, pays less attention to competing brands and advertising and is less sensitive to
price. Hence, retailers should pay considerable attention to customer relationship to enhance
performance (Kotler & Armstrong, 2006).
The collaborative efforts of value chain members should result in greater trust, commitment,
channel efficiency and the achievement of goals, thus leading to higher levels of customer
satisfaction. However, situations may exist where the supplier or buyer is forced to
collaborate with the other party, despite a lack of trust and/ or commitment. For example,
Jeevananda (2011), argue that dissatisfied buyers may remain loyal due to high switching

35
costs. The costs could lead to dissatisfaction, but if the outcomes of the relationship are good,
the parties may still be satisfied with the relationship.
Walter, Muller, Helfert and Ritter (2003) believed that collaboration, adaptation, trust and
commitment increase satisfaction for the customer, building loyalty and improve supplier
retention through repeated purchases. The decision by customers to re-purchase from the
same service provider depends on their past experiences, their perceptions of value from
previous service encounters, expectations of the future business relationship and
improvements in benefits which will result in increased customer satisfaction and enhanced
organization performance.
Dawes and Swailes (1999) stated the need for sustaining long-term relationships between
customers and suppliers due to the recent global markets and fierce competition among
organizations which force them to adapt and implement new strategies and solutions for the
current continuous challenges. Successful customer retention lowers the need for seeking new
and potentially risky customers and allows organizations to focus more accurately on the
needs of the existing customers by building relationships.
The focus is on creating value for the customer and the organization over the longer term.
The benefits of increasing and retaining customers to the organization are higher sales,
increased market share and increased stock levels. Moreover, strong relationships between
business and customers foster increased profit, improved communication, and an increase in
satisfaction, creating loyalty. Thus, organizations that apply CRM enjoy increased length of
interaction with customers, decreased time of delivering services to customers and this in turn
leads to a decrease in marketing and sales cost (Kim, Suh, & Wang, 2003).
From time immemorial, the importance of customer orientation and its impact on
organizational performance has been highlighted in numerous studies. The studies below
were based on CRM value chain model. A study conducted by Brady, Cronin and Brand
(2002) demonstrated that customer orientation is linked indirectly with organizational quality
customer satisfaction and performance of the organization. Another study that had the same
objective was conducted by Pinar and Girard (2008) on Turkish companies and found out that
there were significant differences between firms characterized by greater orientation towards
customers and firms characterized by lower customer orientation. The former category of
firms showed higher performance than the latter.

36
A study by Matt, Tim and John (2007), on how banks retain customers and boost top-line
growth demonstrated that banks long-term growth and profitability hinge on their ability
to attract and retain loyal customers and key disciplines which they need to master over to
become customer-led organizations. The study revealed that the best-performing banks
garner the highest marks across the entire spectrum of managing the customer
relationship.
2.6 Summary of the Literature Review and Knowledge Gaps
The overall view in the literature review illustrated that well managed supplier and customer
relationships, procurement costs, optimal use of technology, effective execution of HR
activities and efficient firm infrastructure leads to effective and efficient organizational
performance measured in terms of profitability and competitive advantage over a firm’s
competitors (Kaplinksy & Morris, 2001).
Most of the literature on value chain management practices and organizational performance
were mainly theoretical. Firms seeking to have a better cost performance in the industry
must strive to cut costs associated with value chain activities, while the ones which wishes to
outperform its competitors through quality will have to perform its value chain activities
better than them (Capon, 2008). However, a few studies had attempted to examine the
linkages in value chain management practices and their contribution to organizational
performance.
A study by Rana, Osman and Islam (2014) emphasized more on customer relationship
management with a little emphasis on the other key players in the value chain. Another study
by Aguko (2014) focused on supplier relationship management and use of technology to
enhance value chain operations with little focus on internal value chain activities and
customer relationship management. Further the above studies have not focused on the
linkages in value chain management practices and their contribution to organizational
performance, particularly on the retail outlet sector.
In addition, little research has been undertaken to interrogate the extent to which firms
particularly medium and large scale retail outlets in Kenya align their organizational
performance to the value chain management practices. This had repercussions for the
robustness of the conclusions that can be drawn from the aforementioned literature. This
study therefore sought to bridge this knowledge gap by interrogating all the linkages in value

37
chain management practices and how they influence the organizational performance in the
rather neglected service sector of retail outlets. This study will therefore expand the body of
knowledge and create an avenue for further research.

38
2.7 Conceptual Framework
In this study, the independent variable was value chain management practices while the
dependent variable was organizational performance. These variables were related as shown in
Figure 2.1.
Figure 2. 1: Relationship between Value Chain Management Practices, Contextual
Factors and Organizational Performance:
As shown in Figure 2.1, it is expected that efficient value chain management practices in
terms of supplier relationship management, internal value chain activities, and customer
relationship management would result in high organizational performance in terms of sales
growth and market share.
However, these variables are affected by contextual factors such as economic conditions,
legal factors and company laws. Value chain management practices namely supplier
relationship management, internal value chain activities and customer relationship
Value chain management practices
Supplier relationship management
- - Manufacturer and supplier
- - Supplier and retail outlet
Internal value chain activities
- - Primary and support activities
- - value chain of firm and supplier
channels
Customer relationship management
- - Retail outlet and customer
Independent variable
Organizational performance
Market Performance
- Sales growth
- Market share
Dependent variable
Contextual factors
- Economic conditions
- Legal factors
- Company laws/policies
Moderating variable

39
management had a direct effect on organization performance, which can affect organization
performance positively. Relationships in value chains, that is, customer relationship
management and supplier relationship management are characterized by transactions, a vast
exchange of information, knowledge, skills and various embedded services for example after
sale services. Hence, understanding relationships between members are crucial to enhance
organizational performance. For example, how entry barriers are created and how gain and
risks are distributed directly impacts performance (United Nations International Labor
Organization, 2009).
Urbig (2003) conducted a pilot study to investigate “the implications of the value chain for
firm and industry analysis”, among selected companies in Berlin. The study revealed that the
value chain management practices enables companies’ executives to control cost drivers
better than the competitors and thus creating above average performance in operational
efficiency, profitability, market share, customers’ satisfaction, innovations, quality and assets
utilization.
Contextual factors namely legal factors, economic conditions and company laws can limit the
opportunities for organizations to benefit from adopting a value chain management business
approach, hence, limit the competitiveness of individual businesses (Marston, 2008).
Countries have legal bodies that ensure the value chain players adhere to legal laws within
which the companies operate to achieve their objectives and sustained organization
performance. In Kenya for instance, Consumer Federation of Kenya (COFEK) defends,
promotes, develops and regulates consumer rights as guided by the Kenyan constitution and
makes it possible for the consumer to get the value for money. One of the most cited studies
belongs to Gompers, Ishi and Metrick (2003). They built an index for measuring legal laws
using a sample of 1,500 US firms in the 90s. The study demonstrated the existence of a
positive relationship between the quality of legal laws and firm performance.
Organization performance indicator, that is, market performance (sales growth, market share)
was affected by the prevailing economic conditions. The state of the economy of a country
(expansion or contraction) determines the setting of the prices of goods and services (low or
high), which in turn affects organization performance (Narain & Singh, 2012). Finally,
company law and policies assists participants in the value chain to fulfill required rules and
regulations. In Japan, Bauer et al. (2008) using the database provided by GMI, showed that
companies operating under favorable economic conditions, legal factors and better company

40
laws and policies are more efficient than those operating in harsh economic conditions, legal
factors and weaker company laws and policies by upto 50% annually.

41
CHAPTER THREE
RESEARCH METHODOLOGY
3.1 Introduction
This chapter provides insight into the research design adopted, the target population studied,
the sample size used, data collection methods employed and data analysis techniques or tools
used when organizing and analyzing the data.
3.2 Research Design
The study employed explanatory research design. The design was useful because it was used
to determine cause and effect relationships between variables and make predictions about the
variables under study. The study adopted a cross-sectional census survey in that data was
collected over a short period from the entire population (Mugenda & Mugenda, 2003).
3.3 Target Population
The population of the study comprised of 43 medium and large scale retail outlets in Nakuru
County, Kenya. According to Kibera (2007), the criteria used to determine the size of a firm
are capital, sales turnover or number of employees but recommends the use of number of
employees’ criteria as it was information which was readily available to researchers.
According to Kibera (2007), the sizes of firms in Kenyan context were classified as micro
firms (below 10 employees), small firms (11-50 employees), medium firms (51-100
employees) and large firms (above 100 employees). Therefore, the population of this study
comprised of retail outlets which employed above 51 employees.
There are 43 medium and large scale retail outlets in Nakuru County (County Government of
Nakuru, 2017). Given their small number, all the retail outlets were studied through a census.
This focused on the managers of the retail outlets (Appendix II). The list of the firms in the
study was identified from the County Government of Nakuru because the Ministry of Finance
and Economic Planning maintains records of all businesses in the county.
3.4 Data Collection
The study used primary data. Primary data consists of original data gathered by the researcher
for the specific purpose of the study at hand (Mugenda & Mugenda, 2003). The data was
collected by use of a structured questionnaire that was administered by drop and pick method.
The close-ended questions provided more structured response to facilitate tangible
recommendations. The questionnaire was in the form of Likert scale of 1 to 5. The unit of

42
analysis was the firm and data was collected at the firm level. For each firm, one respondent
filled in a questionnaire. The respondent was the manager of the retail outlets conversant with
the organization’s value chain management practices and performance.
3.5 Measurement of Variables
In this study, the independent variable was value chain management practices while the
dependent variable was organizational performance. Borrowing from literature review
(Porter, 1985), value chain management practices was measured in terms of supplier
relationship management, internal value chain activities and customer relationship
management as conceptualized by (Suhong, Nathan, Nathan, & Rao, 2004). A five point
Likert scale ranging from strongly disagree (1), disagree (2), neutral (3), agree (4) and
strongly agree (5) was used to measure the independent variable. A five point Likert scale
ranging from very much decreased (1), decreased (2), not changed (3), increased (4) and very
much increased (5) was used to measure the dependent variable. Organization performance
was measured in terms of sales growth and market share. These were also be borrowed from
(Suhong, Nathan, Nathan, & Rao, 2004).
3.6 Validity and Reliability of Research Instrument
3.6.1 Validity
Somekh and Cathy (2005) argue that validity refers to the degree by which the sample of test
items represents the content the test is designed to measure. If such data is a real reflection of
the variables, then the inferences based on the data is accurate and meaningful. The normal
procedure in assessing the content validity of a measure is to use a professional in a specific
field (Mugenda & Mugenda, 2003). Content validity of the instrument was assessed with the
help of the experts in the Faculty of Commerce, Egerton University. This facilitated the
necessary revision and modification of the research instrument thereby increasing reliability.
3.6.2 Reliability
Devellis (1991) defines reliability as the extent to which the measurement is random error-
free and produces similar results on repeated trials. It also refers to consistency of scores
attained through the same test on various occasions, or with various sets of equivalent items
or under other variables examining conditions. Cronbach reliability coefficient was used for
this study because it aided to establish the internal consistency of the responses. It was also
used to ascertain the reliability of factors extracted from the Likert scale in the questionnaire
because it determined the internal consistency or average correlation in a survey instrument.

43
Cronbach alpha is a coefficient of internal consistency used as an estimate of reliability and it
ranges in values from 0-1. If Cronbach alpha coefficient is above 0.7, then the instrument is
considered to be reliable (Nunnaly, 1978).
Table 3.1: Reliability Statistics
Overall Reliability Statistics
Cronbach's Alpha Number of Items
.797 19
Cronbach’s Alpha Coefficients for the Measurement Scales for the Constructs
Variable Number of items Alpha (α)
Internal value chain activities
Supplier relationship management
Customer relationship management
Organizational performance
4
6
5
4
0.755
0.760
0.763
0.794
As shown in Table 3.1, all the research constructs had alpha coefficients of above 0.7. The
overall Cronbach's Alpha coefficient was 0.797. Overall, the instrument met the
recommended threshold of 0.7 (Nunnaly & Bernstein, 1994) and thus was considered
reliable.
3.7 Data Analysis
The data was collected from the field, edited and coded to ensure completeness and accuracy.
The data was entered using Statistical Package for Social Sciences (SPSS version 17). Data
that was obtained from the research questionnaire was summarized using descriptive statistics
such as percentages, mean and standard deviation. Before testing the hypotheses, correlation
analysis between supplier relationship management, internal value chain activities, customer
relationship management and organizational performance. To test hypothesis HA1, HA2 and
HA3 simple regression model was used.
To test hypothesis HA1, simple regression model was used:
Y = a +X1 +
Where:
Y = dependent variable (organizational performance)
a = constant
X1 = supplier relationship management
regression coefficient
= error term
To test hypothesis HA2, simple regression model was used:
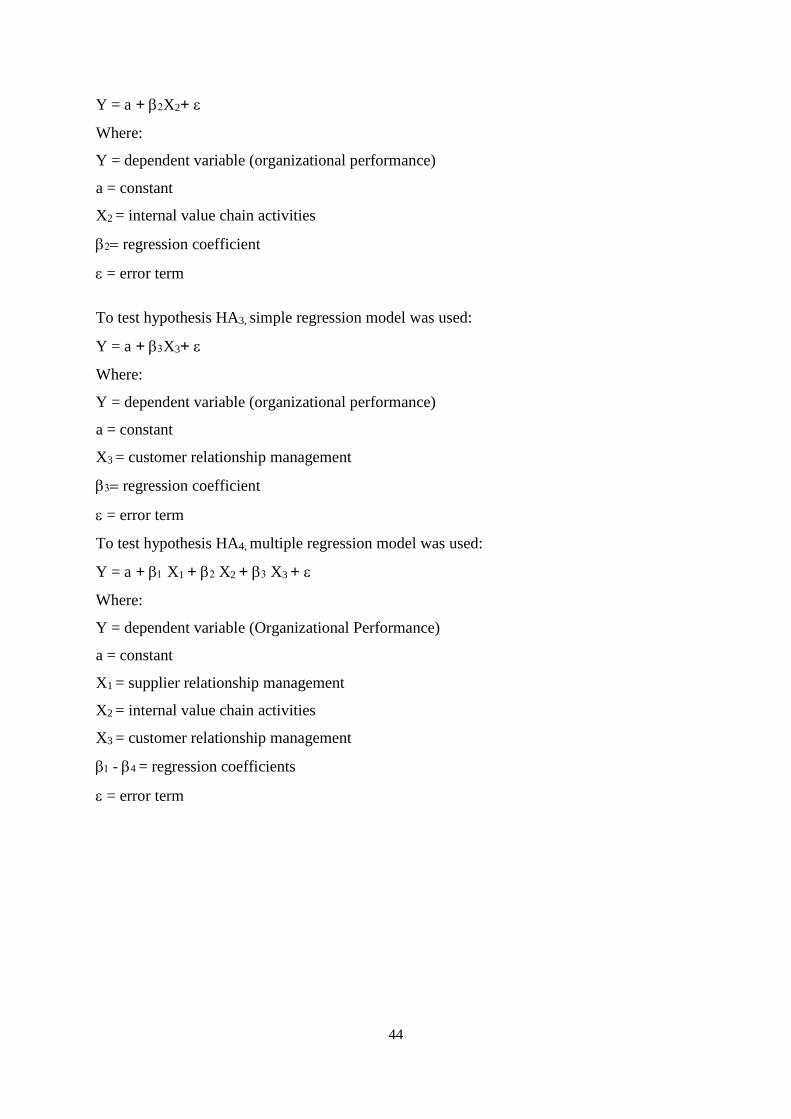
44
Y = a +X2+
Where:
Y = dependent variable (organizational performance)
a = constant
X2 = internal value chain activities
regression coefficient
= error term
To test hypothesis HA3, simple regression model was used:
Y = a +X3+
Where:
Y = dependent variable (organizational performance)
a = constant
X3 = customer relationship management
regression coefficient
= error term
To test hypothesis HA4, multiple regression model was used:
Y = a + X1 + X2 + X3 +
Where:
Y = dependent variable (Organizational Performance)
a = constant
X1 = supplier relationship management
X2 = internal value chain activities
X3 = customer relationship management
- = regression coefficients
= error term

45
CHAPTER FOUR
RESULTS AND DISCUSSION
4.1 Introduction
This chapter presents results and discussion of findings as set out in the research
methodology. It expounds on the findings of the researcher after employment of an interview
guide, questionnaires, review of publications and reports to collect and evaluate data based on
objectives of the study.
4.2 Descriptive Statistics
This section presents and discusses results of response rate and profile of organizations. It
also presents the analysis of the results of the study variables.
4.2.1 Response Rate
To collect the required data for the research a total of 43 research questionnaires were sent
out; Out of which 38 were returned. The response rate for the questioners was 88% whereby
38 out of the 43 had been correctly filled and the researcher deemed it fit to use them since
they were adequate in realization of the study objectives. According to Mugenda and
Mugenda (1993) a response rate of more than 80% is sufficient for the study.
In addition, data collected from the field had been sorted and analyzed using statistical
package for social sciences (SPSS) software. Results had been presented in tables and figures
to highlight major findings. Results had been presented sequentially according to research
questions of the study. Mean scores, standard deviations and regression analyses had been
used to analyze data collected. Finally, raw data had been coded, evaluated and tabulated to
depict clearly the results.
4.2.2 Profile of Organization
The demographic information obtained from the retail outlets included the duration of
operation in Nakuru County, the number of employees in the company and the area (market
served) of operation. The demographics were well represented in the Table 4.1.

46
Table 4.1: Profile of Organization
Number of years in operation Years Frequency Percentage Less than 5 years 8 21.1
5 to 10 years 11 28.9 11 to 15 years 10 26.3 16 to 20 years 9 23.7
Total 38 100.0
Number of employees in Firm
Retail Outlets Frequency Percentage Medium 28 73.7
Large 10 26.3
Total 38 100.0
Market Served by Organization
Frequency Percentage Local(Nakuru County) 14 36.8 National 22 57.9 International 2 5.3 Total 38 100.0
Number of years in operation aided the researcher to know how long the companies had
participated in value chain activities; thus, determined how effective and vast the companies
would provide relevant information about the study. According to Table 4.1, most
organizations had been in operation in the county for more than 5 years. The study showed
that 21.1% of the organizations had been in the county for less than 5 years. The number of
organizations that had been in the county between 5 to 10 years is 28.9%, while 26.3% of
organizations had been in Nakuru County between 11 to 15 years. 23.7% of the organizations
had been operating in the county for 16 years and above. The above findings indicated that
majority of the companies had been in operation for a considerable period of time to
effectively measure the value chain activities and their effects in organization performance.
Number of employees in the company aided the researcher categorize the company that was
either medium or large retail outlet: which was directly proportional to the complexity of
value chain activities in the company. From Table 4.1 it was evident that most organizations
had employed between 51 to 100 employees. More than 73.7% of the organizations in the
study had employed between 51 to 100 employees hence medium retail outlets while only
26.3% of the organizations had more than 100 employees hence large retail outlets. The
above findings indicated that majority of the companies in Nakuru County were medium
retail outlets.

47
Markets served aided the researcher know the area of operation of the company. In relation to
Table 4.1 most organizations served both the county and operated nationally. It was evident
that 94.7% of the organizations operate in the country whereby 36.8% serve Nakuru County
exclusively. The study also showed that only 5.3% of the organizations serve international
markets. The above findings indicated that majority of the companies operated nationally.
4.2.3. Supplier Relationship Management
The study examined supplier relationship management in the companies. The respondents
were asked to rate the extent to which supplier relationship fits the situation in their
companies using a likert scale, where 1 = strongly disagree, 2 = disagree, 3 = neutral, 4 =
agree, 5 = strongly agree. Table 4.2 showed the research findings.
Table 4.2: Supplier Relationship Management
Supplier Relationship Management Items N Mean Std.
deviation
We regularly solve problems jointly with our customers
We consider quality as number one criterion in selecting suppliers
We have a continuous improvement programs that include our key suppliers
Actively involve our key suppliers in new product developments
Include key suppliers in our planning and goal setting activities
We regularly measure our suppliers contributions to our profitability
Valid N (listwise)
38
38
38
38
38
38
38
4.13
4.26
3.76
3.34
3.68
4.47
.77707
.44626
.67521
.66886
.52532
.50601
According to Table 4.2, the respondents indicated that they regularly solved problems jointly
with suppliers. The mean of agreement with the statement was 4.13, this showed that the
highest number of respondents agreed and strongly agreed with the statement. It was evident
from the results that no respondent disagreed with the statement. The mean for quality as the
main criteria in selecting suppliers was 4.26 indicating that all the respondents either agreed
or strongly agreed that quality was key in selecting suppliers.
The respondents indicated that they had continuous improvement programs that included
their key suppliers. The mean of agreement was 3.76; which showed that no respondent
disagreed with the statement. In terms of including supplier in product development, the
results showed that the level of agreement was high whereby mean was 3.34. The
respondents agreed that they include key suppliers in planning and goal setting activities
whereby mean was 3.68. According to the results, no respondent disagreed with including
suppliers in goal creating although some of the respondents were neutral. A high number of

48
respondents strongly agreed in regularly measuring supplier’s contribution to the
organizations profitability.
The results showed that the organizations regularly solved problems jointly with the
suppliers. Solving problems that arose in the organization that impacted on the suppliers or
caused by suppliers was important in any organization that minded the wellbeing of the
business. Quality was a very important aspect in any organization. The results showed that
the outlets always looked at the quality of services or products from the suppliers before
selecting them.
It was evident from the results that the outlets included suppliers in a continuous
improvement programs. Since product development was important, the respondents agreed in
including suppliers in the process. The results also showed that the outlets included their
suppliers in goal creation. Supplier contribution in the organization’s profit had been
measured in the organizations to ensure they meet their desired targets.
4.2.4 Internal Value Chain Activities
The study examined internal value chain activities in the companies. The respondents were
asked to rate the extent to which internal value chain activities fits the situation in their
companies using a likert scale, where 1 = strongly disagree, 2 = disagree, 3 = neutral, 4 =
agree, 5 = strongly agree. Table 4.3 showed the research findings.
Table 4.3: Internal Value Chain Activities
Internal Value Chain Activities Items N Mean Std.
deviation
We strive to differentiate our value chain activities
We explore opportunities of employing new technologies in value chain
activities
We have a continuous improvement programs that include our key suppliers
Actively involve our key suppliers in new product developments
Valid N (listwise)
38
38
38
38
38
4.05
4.08
4.61
4.11
.77110
.68928
.47408
.63616
As shown in Table 4.3, the outlets strived to differentiate internal value chain activities
whereby mean was 4.05. The results further showed that the outlets explored opportunities of
employing new technologies in value chain activities whereby mean was 4.08. The outlets
strived to minimize cost in the internal value chain activities whereby mean was 4.61.

49
Ultimately, the results indicated that internal value chain activities were linked and mean was
4.11.
According to the results, it can be concluded that the outlets always strived in differentiating
their value chain activities from the competition and incorporated the activities that are
essential for the outlets. The organizations always explore opportunities of employing new
technologies in value chain management practices. It was evident that the outlets strived to
minimize cost in internal value chain activities. It was important for an organization to
4.2.5 Customer Relationship Management
The study examined customer relationship management in the companies. The respondents
were asked to rate the extent to which customer relationship management fits the situation in
their companies using a likert scale, where 1 = strongly disagree, 2 = disagree, 3 = neutral, 4
= agree, 5 = strongly agree. The table below showed the research findings.
Table 4.4: Customer Relationship Management
Customer Relationship Items N Mean Std.
deviation
We frequently measure and evaluate customers satisfaction
We promptly respond to customers problems suggestions and complaints
We have different marketing patterns for target customers
We offer after sale service to our customers
We actively provide discount for loyal customers
Valid N (listwise)
38
38
38
38
38
38
4.00
3.89
4.21
4.03
4.18
.77110
.68928
.47408
.63616
.60873
According to Table 4.4, the respondents frequently measured and evaluated customers’
satisfaction and mean was 4.00. The results showed that the outlets promptly responded to
customers’ problems, suggestions and complaints whereby mean was 3.89. The organizations
had different marketing patterns for target customers and mean was 4.21. The outlets offered
after sale service to their customer whereby mean was 4.03. The results showed that the
organizations actively provided discount for loyal customers and mean was 4.18.

50
4.2.6 Organizational Performance
The study examined organization performance aspect change in the companies for the last
three years. The respondents were asked to rate the extent to which organization performance
aspect change in their companies using likert scale, where 1 = very much decreased, 2 =
decreased, 3 = no change, 4 = increased, 5 = very much increased.
Table 4.5: Organizational Performance
Organization Performance Items N Mean Std. deviation
Sales Growth
Market Share
Valid N (listwise)
38
38
38
4.11
4.29
.55941
.69391
According to Table 4.5 the respondents indicated that the number of sales had gone up
whereby mean was 4.11. The mean indicated that most of the retail stores had increased the
number of sales it their retail outlets. The market share of most of the retail outlets had
increased significantly, whereby mean was 4.29. It is evident that the market share of most
retail outlets in the last three years had increased.
In relation with the results, it can be concluded that the number of sales of most of the retail
outlets in the county had increased. Most of the respondents were confident that the number
of sales made in the last three years had increased. The market share of the retail outlets had
increased in the last three years whereby most of the outlets serve the people of the county
and the nation at large.

51
4.3 Correlation Analysis
Before testing hypotheses, the study sought to examine how the variables of the study:
supplier relationship management, internal value chain activities, customer relationship
management and organizational performance were related. The analysis was done using
Pearson’s correlation matrix. The results of the analysis are presented in Table 4.6.
Table 4.6: Correlation Matrix for Supplier Relationship Management, Internal Value
Chain Activities, Customer Relationship Management and Organizational Performance
Supplier
Relationship
Management
Internal
Value Chain
Activities
Customer
Relationship
Management
Organizational
Performance
Supplier
Relationship
Management
Pearson
Correlation
1 .653** .267** .779**
Sig.(1 Tailed) .000 .002 .000
N 38 38 38 38
Internal Value
Chain Activities
Pearson
Correlation
.653** 1 .412** .855**
Sig.(1 Tailed) .000 .001 .000
N 38 38 38 38
Customer
Relationship
Management
Pearson
Correlation
.267** .412** 1 .843**
Sig.(1 Tailed) .002 .001 .000
N 38 38 38 38
Organizational
Performance
Pearson
Correlation
.779** .855** .843** 1
Sig.(1 Tailed) .000 .000 .000
N 38 38 38 38
**. Correlation is significant at the 0.05 level (1-tailed).
The results in Table 4.6 indicated that there was a positive significant relationship between
supplier relationship management and organizational performance (r = 0.779, p < 0.05). The
results also show that there was a positive significant relationship between internal value
chain activities and organizational performance (r = 0.855, p < 0.05). Further, the results in
Table 4.6 indicated that there was a positive significant relationship between customer
relationship management and organizational performance (r = 0.843, p < 0.05).

52
4.4 Test of Hypotheses
4.4.1 Supplier Relationship Management and Organizational Performance
The study sought to examine the effect of supplier relationship management on
organizational performance. It was hypothesized (Hypothesis HA1) that supplier relationship
had a positive effect on organizational performance. Data was analyzed using simple
regression analysis and the results were presented in Table 4.7.
Table 4.7: Simple Regression Results for Effect of Supplier Relationship Management
on Organizational Performance
Model in Table 4.7 showed effect of supplier relationship management on organizational
performance. The model showed that R Square was 0.329, which showed that 32.9 % of the
variation in organizational performance was explained by supplier relationship management.
ANOVAa
Model Sum of
Squares
Df Mean Square F Sig.
Regression 1.763 1 1.763 3.108 .041a
Residual 19.407 36 .342
Total 20.810 37
The ANOVA demonstrated test for the effect of supplier relationship management on
organizational performance. The ANOVA results showed that the model was significant (F =
3.108, P < 0.05).This indicated that the supplier relationship management had a positive
significant effect on organizational performance.
Model Summaryb
Model R R
Square
Adjusted R
Square
Std. Error of the Estimate
1
.622b
.329
.320
.26217

53
Coefficientsa
Model Unstandardized
Coefficients
Standardized t Sig.
Coefficients
Beta
3.853 .000
.528 1.944 .026
B Std. Error
4.885 .268
.625 .173
1 (Constant)
Supplier relationship
Management
a. Predictors: (constant), supplier relationship management
b. Dependent variable: organization performance
From the standardized coefficients in the Table 4.7, the effect of supplier relationship
management on organizational performance is positive and significant (β = 0.528, t = 1.944,
p < 0.05). Hence, the data supported the hypothesis that supplier relationship management
had a positive effect on organizational performance.
These findings were consistent with Wachira (2013) findings that affirm positive significant
relationship between supplier relationship management and firm’s performance. According to
Wachira (2013) study on supplier relationship and organizational performance on alcoholic
beverage industry in Kenya, it was alluded that adopting collaboration relationships with
suppliers positively contribute to competitive advantage, value creation and performance.
4.4.2 Internal Value Chain Activities and Organizational Performance
The study sought to examine the effect of internal value chain activities on organizational
performance. It was hypothesized (Hypothesis HA2) that internal value chain activities had a
positive effect on organizational performance. Data was analyzed using simple regression
analysis and the results were presented in Table 4.8.
Table 4.8: Simple Regression Results for Effect of Internal Value Chain Activities
on Organizational Performance
Model Summaryb
Model R R
Square
Adjusted R
Square
Std. Error of the Estimate
1
.574a
.386
.378
.25637

54
Model in Table 4.8 showed effect of internal value chain activities on organizational
performance. The model showed that R Square was 0.386, which showed that 38.6% of the
variation in organizational performance was explained by internal value chain activities.
ANOVAa
Model Sum of
Squares
Df Mean Square F Sig.
Regression 1.964 1 1.964 0.929 .038b
Residual 18.514 36 .283
Total 20.478 37
The ANOVA demonstrated test for the effect of internal value chain activities on
organizational performance. The ANOVA results showed that the model was significant (F
= 0.929, P < 0.05).This indicated that the internal value chain activities had a positive
significant effect on organizational performance.
Coefficientsa
Model Unstandardized Coefficients Standardized t Sig.
Coefficients
Beta
3.853 .000
.641 2.131 .015
B Std. Error
4.885 .268
.786 .341
1 (Constant)
Internal value chain
Activities
a. Predictors: (constant), internal value chain activities
b. Dependent variable: organization performance
From the standardized coefficients in the Table 4.8, the effect of internal value chain
activities on organizational performance is positive and significant (β = 0.641, t = 2.131,
p < 0.05). Hence, the data supported the hypothesis that: internal value chain activities had a
positive effect on organizational performance.
These findings were consistent with observations of Porter (1985) that highlights internal
value chain activities of the firm as building blocks by which firms deliver products to the
customer, earn profit/margins as well as develop advantages over rivals. These activities do
not operate in isolation but in a cohesive manner as an interdependent system which is related
to each other through linkages. Internal value chain activities and linkages together lead to
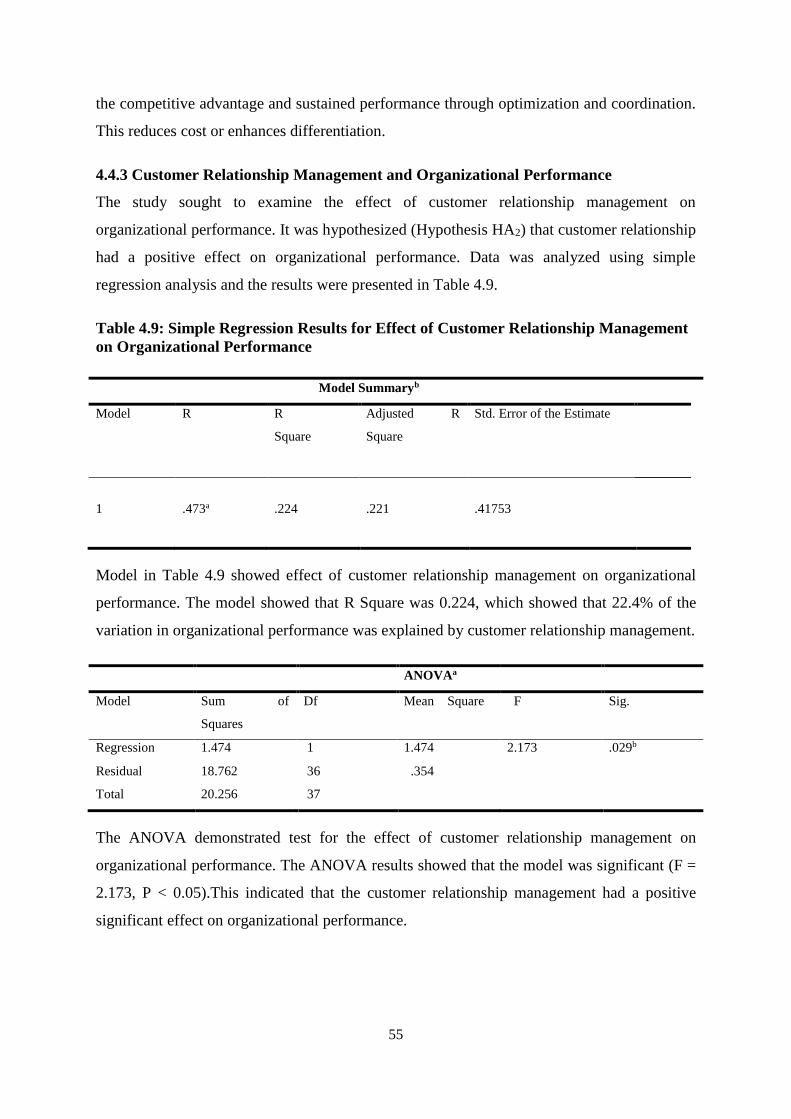
55
the competitive advantage and sustained performance through optimization and coordination.
This reduces cost or enhances differentiation.
4.4.3 Customer Relationship Management and Organizational Performance
The study sought to examine the effect of customer relationship management on
organizational performance. It was hypothesized (Hypothesis HA2) that customer relationship
had a positive effect on organizational performance. Data was analyzed using simple
regression analysis and the results were presented in Table 4.9.
Table 4.9: Simple Regression Results for Effect of Customer Relationship Management
on Organizational Performance
Model in Table 4.9 showed effect of customer relationship management on organizational
performance. The model showed that R Square was 0.224, which showed that 22.4% of the
variation in organizational performance was explained by customer relationship management.
ANOVAa
Model Sum of
Squares
Df Mean Square F Sig.
Regression 1.474 1 1.474 2.173 .029b
Residual 18.762 36 .354
Total 20.256 37
The ANOVA demonstrated test for the effect of customer relationship management on
organizational performance. The ANOVA results showed that the model was significant (F =
2.173, P < 0.05).This indicated that the customer relationship management had a positive
significant effect on organizational performance.
Model Summaryb
Model R R
Square
Adjusted R
Square
Std. Error of the Estimate
1
.473a
.224
.221
.41753

56
Coefficientsa
Model Unstandardized Coefficients Standardized t Sig.
Coefficients
Beta
3.853 .000
.382 1.501 .042
B Std. Error
4.885 .268
.596 .197
1
(Constant)
Customer relationship
Management
a. Predictors: (constant), customer relationship management
b. Dependent variable: organization performance
From the standardized coefficients in the Table 4.9, the effect of customer relationship
management on organizational performance is positive and significant (β = 0.382, t =
1.501, p < 0.05). Thus, the data supported the hypothesis that customer relationship
management had a positive effect on organizational performance.
These findings were consistent with Kaplan and Norton (1992) findings that customer is one
of the key element of performance measurement using the Balanced Scorecard Model due to
the competitive environment that business operate in. Just as a company needs to develop
relationships with its supplier, it also needs to foster relationship with its customers. The
desired outcome is a win-win relationship where both parties benefit; leading to increased
organization performance.
4.5 Supplier Relationship Management, Internal Value Chain Activities, Customer
Relationship Management and Organizational Performance
The study sought to establish the joint effect of supplier relationship management, internal
value chain activities and customer relationship management on organizational performance.
It was hypothesized (HA4) that supplier relationship management, internal value chain
activities and customer relationship management had a positive effect on organizational
performance. The hypothesis was tested using multiple regression analysis.
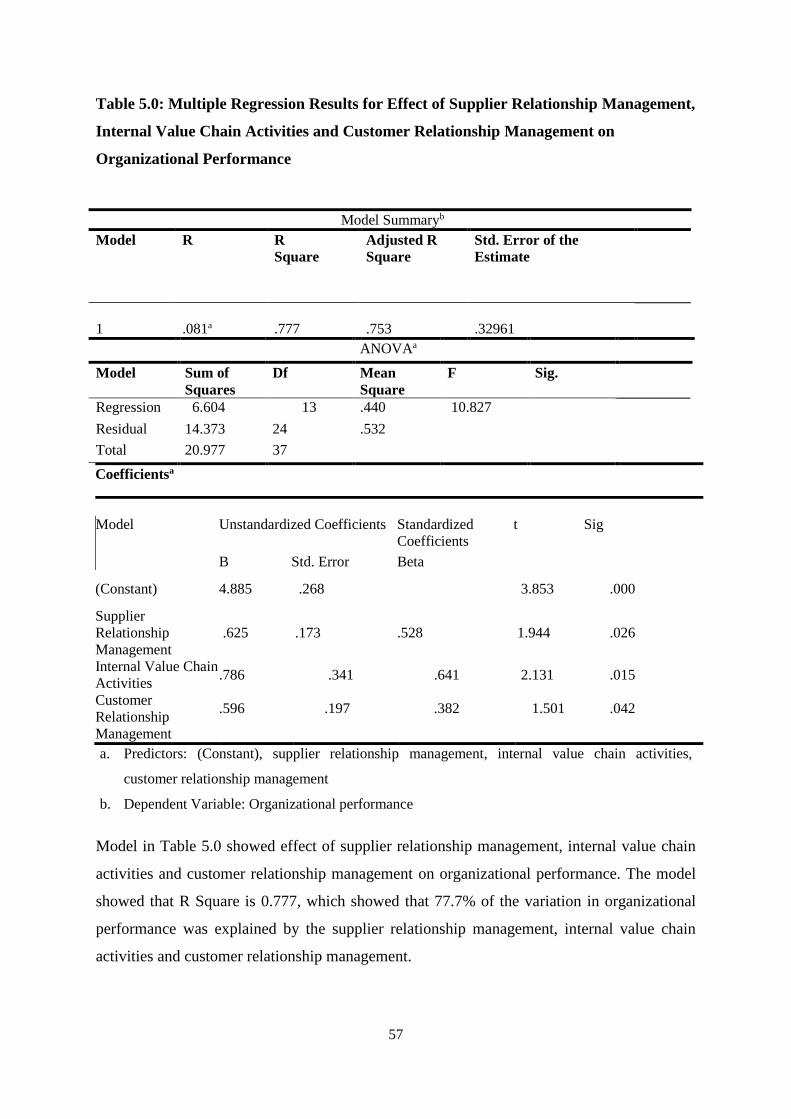
57
Table 5.0: Multiple Regression Results for Effect of Supplier Relationship Management,
Internal Value Chain Activities and Customer Relationship Management on
Organizational Performance
Model Summaryb
Model R R
Square
Adjusted R
Square
Std. Error of the
Estimate
1
.081a
.777
.753
.32961
ANOVAa
Model Sum of
Squares
Df Mean
Square
F Sig.
Regression 6.604 13 .440 10.827
Residual 14.373 24 .532
Total 20.977 37
Coefficientsa
Model Unstandardized Coefficients Standardized
Coefficients
t Sig
B Std. Error Beta
(Constant) 4.885 .268
3.853 .000
Supplier
Relationship
Management
.625 .173 .528 1.944 .026
Internal Value Chain
Activities .786 .341 .641 2.131 .015
Customer
Relationship .596 .197 .382 1.501 .042
Management
a. Predictors: (Constant), supplier relationship management, internal value chain activities,
customer relationship management
b. Dependent Variable: Organizational performance
Model in Table 5.0 showed effect of supplier relationship management, internal value chain
activities and customer relationship management on organizational performance. The model
showed that R Square is 0.777, which showed that 77.7% of the variation in organizational
performance was explained by the supplier relationship management, internal value chain
activities and customer relationship management.

58
The ANOVA demonstrated test for the supplier relationship management, internal value
chain activities and customer relationship management on organizational performance. The
ANOVA results showed that the model was significant (F = 10.827, P < 0.05).This indicated
that the combined dimensions of value chain management practices; supplier relationship
management, internal value chain activities and customer relationship management had a
positive significant effect on performance. Hence, the results support hypothesis HA4 which
stated that supplier relationship management, internal value chain activities and customer
relationship management jointly had a positive effect on organizational performance.
From the standard coefficients in the table 5.0, internal value chain activities had the
greatest effect on organizational performance which was positive and significant (=
0.641, t = 2.131, p < 0.05), followed by the effect of supplier relationship management on
Organizational performance which was positive and significant (= 0.528, t = 1.944, p <
0.05), and the customer relationship management had least effect on organizational
performance which was positive and significant (= 0.382, t = 1.501, p < 0.05).
The findings of this study are consistent with observations of Porter (1985) that highlights
factors which impacted organizational performance and value chain management practices in
organizations. They include linkages, interrelationships, location and timing. Value chain is
not a collection of independent activities, but rather interconnected internal value chain
activities through linkages and interrelationships which are the primary means of achieving
competitive advantage and sustained performance.
The findings are consistent with Ghonar (2015) study which demonstrated that value chain
management practices impact a firm’s performance. Ghonar (2015) concluded that
organizations that carry out value chain management practices in their organizations often
enjoy improved performance in terms of higher profits, better responsiveness in the market,
long-term market dominance and long-term competitive advantage.
Aguko (2014) demonstrated that an ideal measure must take into account information on both
historical organization performance and future organization performance expectations which
depend on the actions recently to create strategic alternatives and opportunities. Therefore,
the value of the opportunities created relates to past actions and, accordingly, this value
should be included in a performance measure as the risk adjusted present value of the
opportunities.

59
CHAPTER FIVE
SUMMARY OF FINDINGS, CONCLUSION AND RECOMMENDATIONS
5.1 Introduction
This chapter comprises of the summary of findings, conclusion and recommendations of the
study. The chapter discusses summary of findings regarding the research objectives,
hypotheses and conclusions of the study. Finally, the chapter discusses implications of the
study to management theory and practice and directions for further research.
5.2 Summary of Findings
The first objective of the study was to determine the effect of firm supplier relationship on
organizational performance. The findings revealed a positive significant relationship between
supplier relationship management and organizational performance. Thus Hypothesis HA1 was
supported. Regarding supplier relationship management, the findings of the study revealed
that supplier relationship management aided the organizations to sort and maintain best
products in the market. The medium and large scale retail outlets stressed that supplier
relationship management aided them to develop new high quality products in the market. The
firms recognized that including suppliers in improvement programs, planning and goal setting
activities was important for a firm to reach its objectives.
The second objective of the study was to determine the effect of internal value chain
activities on organizational performance. The findings revealed a positive significant
relationship between supplier relationship management and organizational performance. Thus
Hypothesis HA2 was supported. Regarding internal value chain activities, the findings of the
study revealed that internal value chain activities do not operate in isolation but in a cohesive
manner as an interdependent system which was related to each other through linkages.
Internal value chain activities and linkages together lead to the competitive advantage and
sustained performance through optimization and coordination. This reduced cost or enhanced
differentiation.
The third objective of the study was to determine the effect of customer relationship on
organizational performance. The findings revealed a positive significant relationship between
customer relationship management and organizational performance. Thus Hypothesis HA3
was supported. Regarding customer relationship management, the findings of the study
revealed that customers have become crucial for every organization due to the competitive

60
environment that businesses operate in. Just as a company needs to develop relationships with
its supplier, it also needs to foster relationship with its customers. The desired outcome is a
win-win relationship where both parties benefit; leading to increased organization
performance.
The fourth objective of the study was to establish the joint effect of firm supplier relationship
management, internal value chain activities and customer relationship management on
organizational performance. The corresponding hypothesis was tested using multiple
regression analysis. The regression results showed that the combination of supplier
relationship management, internal value chain activities and customer relationship
management explained a greater variance in organizational performance, than the variance
explained by internal value chain activities alone. Therefore, Hypothesis HA4 was supported.
5.3 Conclusion
The overall objective of this study was to determine the effect of value chain management
practices on performance of medium and large scale retail outlets in Nakuru County. The
specific objectives were to: determine the effect of firm supplier relationship management on
organizational performance; determine the effect of internal value chain activities on
organizational performance; determine the effect of customer relationship management on
organizational performance; and establish the joint effect of firm supplier relationship
management, internal value chain activities and customer relationship management on
organizational performance.
The results of the study revealed that medium and large-scale retail outlets in Nakuru County
practice value chain management practices to a greater extent. The finding of the study led to
the following conclusions:
The results of the first objective of the study also revealed that supplier relationship had a
positive significant relationship on organizational performance since adopting collaboration
relationships with suppliers positively contributed to competitive advantage, value creation
and performance.
The results of the second objective of the study also revealed that there was linkage between
internal value chain activities and organizational performance of medium and large-scale
retail outlets in Nakuru County. Internal value chain activities was positively related to the
organizational performance of retail outlets. The finding confirmed that internal value chain

61
activities were crucial in enhancing organizational performance. Hence, higher levels of
internal value chain activities would result in higher levels of organizational performance.
The results of third objective of the study also revealed that customer relationship
management had a positive significant relationship on organizational performance since a
company needs to develop relationships with its supplier; it also needs to foster relationship
with its customers. The desired outcome was a win-win relationship where both parties
benefited; leading to increased organization performance.
The results of the fourth objective showed that the joint effect of firm supplier relationship
management, internal value chain activities and customer relationship management on
organizational performance was greater than the effect of internal value chain activities alone.
This showed that synergizing firm supplier relationship management, internal value chain
activities and customer relationship management initiatives achieved a greater effect on
organizational performance than that of internal value chain activities alone.
5.4 Recommendations of the Study
This study was based on the resources-based view theory to determine effect of firm supplier
relationship management, internal value chain activities and customer relationship
management on organizational performance respectively. It also used resources-based view
theory to determine the joint effect of these dimensions of value chain management practices
on organizational performance. The findings of the study conducted in medium and large-
scale retail outlets in Nakuru County had various implications for strategic management
theory and management policy and practice explained below.
5.4.1 Recommendations for Management Policy and Practice
This study had implications to management policy and practice. First, the study confirmed a
positive significant relationship between internal value chain activities and organizational
performance. In order to create a competitive advantage and sustained improved
performance, medium and large scale retail outlets need to focus on their internal value chain
activities and manage the linkages between them.
The study further recommended that the top management in medium and large scale retail
outlets should provide for information sharing between their organization and their suppliers
so as to have the right information in regard to what their customers need. Thereafter,
respond adequately to the customer requirements, coordinate internal processes better and

62
offer better customer service which would lead to improved revenues and properly guided
capacity planning.
Lastly, the results showed that the effect of firm supplier relationship management, internal
value chain activities and customer relationship management have a greater impact on
organizational performance than the effect of internal value chain activities on organizational
performance alone. This implied that to enhance organizational performance, managers need
to integrate all dimensions of value chain management practices into a cycle that will
encourage repeat processes that will lead to long term sustainable performance. Managers
should spearhead this initiative through creating an organizational culture of continuous
improvement that supports value chain management practices.
5.4.2 Recommendations for Further Research
The study employed a cross-sectional census survey in that data was collected over a
short period from the entire population. The study also employed explanatory research
design. The design was useful because it was used to determine cause and effect
relationships between variables and make predictions about the variables under study. Cross-
sectional census survey and explanatory research design face limitations in determining
other casual relationships that may affect study since perceptions vary over time. Thus, future
research should employ longitudinal research design in data collection to improve
comprehension of linkages between study variables and casual relationships in the study.
Future research should broaden the conceptualization of the resources-based view theory to
include other theories that may give depth to the study. There is also need to cover other
factors (scale, capacity utilization, vertical intergration, learning, policy decisions and
government regulations) related to value chain management practices that can impact on
organizational performance to a larger extent since the factors used in this study can only
explain 77.7% of the increase in performance.
63
REFERENCES
Agarwal, R., & Audretsch, D. (2001). “Does entry matter? The impact of the lifecycle
and technology of firm survival.” The Journal of Industrial Economics, 49(1), 21-43.
Aguko, S. O. (2014). Value chain analysis and organizational performance of beer
manufacturing companies in Kenya, Unpublished MBA Thesis, University of Nairobi,
Nairobi.
Anandarajan, M., & Arinze, Z. (1998). “Matching client/server processing architectures
with information processing requirements: A contingency model.” Information
and management, 267-274.
Baker, L. (2004). Turn your supply chain into value chain. Assessed on 18 feb 2005 from
http://www.wmep.org/ value chain management.html
Barney, J. B. (1991). ‘Firm resources and sustained competitive advantage.’ Journal of
Management, 17, 99-120.
Barney, J. B. (2001). “Is the resource-based “view” a useful perspective for strategic
management research? Yes.” Academy of Management Review, 26 (1), 41-56.
Barney, J., & Arikan, A. (2001). The resource-based view: Origins and implications. In
M. Hitt, R. Freeman, & J. Harrison (Eds.), Handbook of strategic management
(pp. 124–185). Oxford, UK: Blackwell.
Barney, J.B., & Clark, D. (2007). Resource-based theory: Creating and sustaining
competitive advantage. New York: Oxford University Press.
Barney, J.B., & Hesterly, W. (2012). Strategic management and competitive advantage:
Concepts and cases (4th ed.). New Jersey: Pearson.
Barney, J. B., Wright, M., & Ketchen Jr., D. J. (2001). The resource-based view of the
firm: Ten years after 1991. Journal of Management, 27, 625-641.
Bauer, R., Braun, R., & Clark, G.L. (2008). “The emerging market for European
corporate governance: The relationship between governance and capital
expenditure,”1997- 2005, Journal of Economic Geography, 8(4), 441-469.
Beal, R.M. (2000). Competing effectively: environmental scanning, competitive strategy
and organizational performance in small manufacturing firms. Journal of Small
Business Management, 38 (1), 27-47.
Bonney, L., Clark, R., Collins, R., & Fearne, A. (2007). From Serendipity to sustainable
competitive advantage: Insights from Houston’s farm and their journey of co-
innovation; Supply chain management: An International Journal, 395-399.
Bradly, M., Cronin, J., & Brand, R. (2002). “Performance-only measurement of service

64
quality: A replication and extension.” Journal of Business Research, 55(1), 17-31.
Bresnen, M., & Marshall, N. (2000). "Building partnerships: case studies of client
contractor collaboration in the UK construction industry." Construction
Management and Economics, 18 (7), 819-32.
Brown, S. L., & Eisenhardt, K. M. (1998). Competing on the edge: Strategy as structured
chaos Boston, MA: Harvard Business School Press.
Buono, A. (1997). Enhancing strategic partnership: “Intervening in network
organizations.” Journal of Organization Change, 10(3), 251-266.
Capon, C. (2008). Understanding strategic management. Prentice Hall, Financial Times,
Harlow.
Chandler, G.N., & Hanks, S.H. (1994). Market attractiveness, resource-based
capabilities, venture strategies, and venture performance. Journal of Business
Venturing, 9, 331-349.
Chege, P.W. (2014). Effect of business value chain practices on the supply chain
performance of large manufacturing firms in Kenya, Unpublished Doctor of
Philosophy Thesis, Jomo Kenyatta University of Agriculture and Technology,
Nairobi.
Chen, I.J., Paulraj, A., & Lado (2004). Strategic purchasing, Supply management and firm
performance. Journal of operations Management, 5, 86-115.
Cool, K., Dierickx, I. & Martens, R. (1994). “Asset stocks, strategic groups and rivalry,”
in Daems, H. and Thomas, H. (Eds), Strategic groups, Strategic moves and
performance, Elsevier Science, Oxford, 219-34.
Cool, K., Almeida, C., & Dierickx, I. (2002). “Constructing Competitive Advantage,” in
Pettigrew, Andrew, Thomas, Howard and Whittington, Richard (Eds), Handbook of
Strategy and Management, Sage publications.
Corsten, D., & Felde, J. (2005). “Exploring the performance effects of key-supplier
collaboration: An empirical investigation into Swiss buyer-supplier relationships.”
International Journal of Physical Distribution & Logistics Management, 35(6), 445-
461.
Darroch, J. (2005). Knowledge management, Innovation and firm performance. Journal of
Knowledge Management, 9(3), 101-115.
Dawes, J., & Swailes, S. (1999). “Retention san frontiers: Issues for financial service
retailers.” International Journal of Bank Marketing, 17 (1), 36-43.

65
Dehning, B., & Richardson, V. (2002). “Return on investments on information technology: A
research synthesis.” Journal of Information Systems, 6(1), 7-30.
DeVellis, R.F. (1991). Scale development: Theory and application. Applied Social Research
Methods series, 26.
Dimitriadis, S., & Stevens, E. (2008). Integrated customer relationship management for
service activities. An internal/ external gap model. Managing Service Quality, 18(5),
496-511.
Fawcett, S.E., & Magnan, G.M. (2002). The rhetoric and reality of supply chain integration.
International Journal of Physical Distribution and Logistics Management, 32(5), 339-
361.
Flynn, B.B., Huo, B., & Zhao, X. (2010). "The impact of supply chain integration on
performance: A contingency and configuration approach." Journal of Operations
Management, 28(1), 58-71.
Fogg, M. (2009). Managing purchasing and supply relationships. United Kingdom: The
Chartered Institute of Purchasing and Supply.
Foss, N. (1998). “The resource-based perspective: An assessment and diagnosis of
problems.” Scandinavian Journal of Management, 14(3), 133-149.
Gabriel, E. (2006). “Value chain for services - A new dimension of porter’s value chain.”
The IMS International Journal, 34, 1-30.
Gereffi, G. (1994). ‘The organization of buyer-driven global commodity chains: How US
retailers shape overseas production networks’, in G. Gereffi and M. Korzeniewicz
(eds.), Commodity Chains and Global Capitalism. Westport: Greenwood Press.
Ghonar, B. (2015). Strategic management of value chain activities and performance of
Safaricom Kenya limited, Unpublished MBA Thesis, University of Nairobi, Nairobi.
Goffin, K., Lemke, F., & Szwejczewski, M. (2006). “An exploratory study of ‘close’
supplier -manufacturer relationships.” Journal of Operations Management, 24(2),
189-209.
Gompers, P., Ishii, J., & Metrick, A. (2003). “Corporate governance and equity
prices.” Quarterly Journal of Economics, 118, 107-155.
Gray, J.H. (1997). Small business strategy in Australia. Academy of Entrepreneurship
Journal, 2 (2), 44-58.
Gruen, T.W. (1997). Relationship marketing: The route to marketing efficiency and
effectiveness. Business Horizons, 40(6), 32-8.
Hamid, H. (2009). Toward unfolding CRM implementation in Pakistan: A case study.

66
17th European conference on information systems. Islamabad, Pakistan. Retrieved
June 28, 2011, from http://is2.lse.ac.uk/asp/aspecis/20090249.pdf.
Hardacre, B., & Collins, G. (2008). Procurement’s role in the generation and capture of
value in supply chains.
Helfat, C. E. (2000). Guest editor’s introduction to the special issue: The evolution of
firm capabilities. Strategic Management Journal, 21, 955-960.
Henry, A. E. (2011). Understanding strategic management (2nd ed). Oxford: Oxford
University Press.
Hitt, M. A., Bierman, L., Shimizu, K., & Kochhar, R. (2001). Direct and moderating
effects of human capital on strategy and performance in professional service firms: A
resource-based perspective. Academy of Management Journal, 44, 13-28.
Hitt, M.A., Ireland, R.D., Hoskisson, R.E. (2007). Strategic management:
Competitiveness and globalization. Mason, US: Thomson South Western.
Hooley, G. J., Greenlay, G., Cadogan, J. W., & Fahy, J. (2005). The performance impact
of marketing resources. Journal of business research , 58, 18-27.
Hooley, G.J., Greenley, G., Fahy, J., & Cadogan, J. (2004). "Market focused revenues,
competitive positioning and firm performance." Journal of Marketing Management,
17 (5-6), 503-52.
Howe, L. D. (2003). A value management approach to strategy. Retrieved from
http://www. innovationgame.com/invgame/vmpaper.htm.
Hunger, D. J., & Wheelen, L.T. (2006). Strategic Management and Business Policy:
Cases (10th ed). Pearson/ Prentice Hall.
Inayatullah, R.N., & Amar, S. (2012). Role of buyer-supplier relationship and trust on
organizational performance. Delhi Business Review, 13(2).
Jeevananda , D. S. (2011). "A study on customer satisfaction level at hypermarkets in
Indian retail industry." Research Journal of Social Science & Management,1.
Kalwani, M., & Narayandas, N. (1995). Long-term manufacturing-supplier relationships:
Do they pay-off for supplier firms? Journal of Marketing, 59(1), 1-16.
Kannan, V.R., & Tan, K.C. (2005). “Buyer-supplier relationships: The impact of supplier
selection and buyer-supplier engagement on relationship and firm performance.”
International Journal of Physical Distribution and Logistics Management, 36(10),
755-775.
Kaplan, R., & Norton, D. (1992). “The balanced scorecard to strategy.” California
Management Review, 39(1), 53-79.

67
Kaplan, R., & Norton, D. (1992). The balanced score card-measures that drive
performance. Harvard Business Review, Jan-Feb 71-79.
Kaplan, R.S., & Norton, D.P. (2006). “Using the Balanced Scorecard as a strategic
management system. ”Harvard Business Review, Jan-Feb.
Kaplinksy, R., & Morris, M. (2001). A handbook for value chain research. Working paper
prepared for the IDRC, Brighton, UK, Institute for Development Studies.
Kennedy, A., Kelleher, C., & Quigley, M. (2006). “CRM best practices: Getting it right
first time at ESB International (ESBI)”, 27(1), 255-272.
Khalfan, M.M.A., McDermott, P., & Swan, W. (2007). "Building trust in construction
projects.” Supply chain management: An International Journal, 12 (6), 385-91.
Kibera, F.N. (2007). Introduction to business: A Kenyan perspective. Kenya Literature
Bureau, Nairobi, Kenya.
Kim, J., Suh, E., & Wang, H. (2003). “A model for evaluating the effectiveness of CRM
using the balanced scorecard. ” Journal of Interactive Marketing, 17(2), 10-33.
KIPPRA, (2016). Kenya economic report 2016: Fiscal decentralization in support of
devolution, Nairobi, Kenya.
Kotler, P., & Armstrong, G. (2006). Marketing: An introduction, 8th ed. New Jersey:
Prentice Hill.
Kronsbein, D., Meiser, D., & Leyer, M. (2014). Conceptualisation of contextual factors for
business performance. Proceedings of International Multiconference of Engineers
and Computer Scientists, 2, March 12-14, Hong Kong.
Kumar, N. (2005). “The global retail challenge.” Business Strategy Review, 16(1), 4-7.
Lahiri, S.M., Kedia, G. A. , & Mukherjee, D. (2011). Buyer–supplier partnership quality
and supply chain performance: Moderating role of risks, and environmental
uncertainty. European Management Journal, 29(4), 260-271.
Leopoldo, L. C., & Daniel, S.S. (2012). “Value chain and technical efficiency: An
empirical analysis in the eastern European industrial firms.” International Journal
of Value Chain Management, 6(3), 187-215.
Liedholm, C. (2001). Firm Dynamics: Evidence from Africa and Latin America, World
Bank Institute.
Lusine, H.A., Alfons, G.J., and Olaf van Kooten, (2007). Performance measurement in
agri-food supply chain: A case study. Emerald Group publishing limited.
Lynch, R. (2006). Corporate strategy. London: Prentice Hall.
Mahapatro, B. B. (2010). Human resource management. New Delhi: New Age

68
International Publishers.
Mäntyneva, M. (2001). Asiakkuudenhallinta. Vantaa: TummavuorenKirjapainoOy.
Marete, P. K. (2010). Application of Hines value chain model by Kenya medical supplies
agency, Unpublished MBA Thesis, University of Nairobi, Nairobi.
Marston, N. (2008). KG fruits: The benefits of collaborating as a ‘new generation’
producer co-operative; Value chain management (DVD); George Morris Centre.
Masoomeh, K., Reza, S., & Kambiz, H. (2015). A literature review on customer
relationship management and critical success factors.
Matt, S., Tim, W., John, O. (2007). “The customer-led bank: How to retain customers
and boost top-line growth.” Journal of Business Strategy, 28(6), 4-12.
Medori, D., & Steeple, D. (2000). A framework for auditing and enhancing performance
measurement systems. International Journal of Operations and Production
Management, 20, 520–533.
Mugenda, O., & Mugenda, A. (2003). Research methods. Quantitative and qualitative
approaches. Nairobi: Acts Press.
Mwirigi, M.F. (2011). Role of supply chain relationships in the growth of small firms in
Kenya. International Journal of Social Sciences and Entrepreneurship, 1 (5),
415-434.
Namusonge, G., & Omondi, D. (2015). The role of supply chain leadership in retail
institutions’ performance: The case of Nakumatt Holdings Limited, Kenya.
International Journal of Humanities and Social Science, 5(2), 135-142.
Narain, R., & Sigh, A. (2012). Role of buyer-supplier relationship and trust in organizational
performance. Delhi Business Review, 13(2), 73-82.
Neville, C. (2007, July). Introduction to research and research methods, School of
Management, University of Bradford.
Newbert, S. L. (2007). Empirical research on the resource-based view of the firm: An
assessment and suggestions for future research. Strategic Management Journal,
28, 121-146.
Nguyen, D.D., & Kira, D.S. (2001. Value added systems. In Malcolm Warner (ed). The
International Encyclopedia of Business and Management, 2nd ed., 7(8), 1-11.
Nielsen Company (2015). Africa: How to navigate the retail distribution labyrinth.
Njuguna, M. M. (2013). Value chain management practices and supply chain

69
performance of large manufacturing firms in Nairobi, Unpublished MBA Thesis,
University of Nairobi, Nairobi.
Nunnally, J. C. (1978). Psychometric theory (2nd ed.). New York: McGraw-Hill.
Olhager, J. (2012). The role of decoupling points in value chain management. Modelling
value: Selected papers of the 1st international conference on value chain management,
37–47.
Olsen, R. F., & Ellram, L. M. (1997). A portfolio approach to supplier relationships.
Industrial Marketing Management, 26 (2), 101–113.
Ongeti, W. J. (2014). Organizational resources, corporate Governance and performance
of Kenyan state corporations. Unpublished PhD Thesis. Nairobi: University of
Nairobi.
Ouma, D., Mwangi, T.D., & Oduk, P.M. (2013). Modeling agility in Kenyan
supermarkets chain expansion. International Journal of Business and Commerce,
2(8), 21-36 (ISSN: 2225-2436): Asian Society of Business and Commerce Research.
Pathania-Jain, G. (2001). Global parents and local partners. A value-chain analysis of
collaborative strategies of media firms in India. Journal of Media Economics, 14(3),
169-187.
Pearce II, J.A., & Robinson Jr., R.B. (2009). Strategic Management: Formulation,
Implementation and Control. New York: McGraw-Hill.
Pinar, M., & Girard, T. (2008). “Investigating the impact of organizational excellence and
leadership on business performance: An exploratory study of Turkish firms.” The
SAM Advanced Management Journal, 73(1), 29-45.
Pinar, M., Rogers, J.D., & Baack, D. (2003). “A comparison of high vs. low market
orientation: A case of Turkey.” Journal of Global Awareness, 4(1), 89-104.
Penrose, E. G. (1959). The theory of growth of the firm. Wiley, New York.
Platt, M. B., Hertenstein, J. H., & Brown, D. R. (2001). Valuing design: Enhancing
corporate performance through design effectiveness. Design Management Journal, 12
(3), 10 – 19.
Pollitt C., &. Bouckaert (2000). Public management reform: An international comparison.
Oxford: Oxford University Press
Porter, M.E. (1985). Competitive advantage: Creating and sustaining superior performance.
1st Edition, Free Press, New York.

70
Porter, M.E. (1998). Competitive advantage: Creating and sustaining superior performance.
USA, New York Free Press.
Porter, M.E. (2001). ‘Strategy and the internet’, Harvard Business Review, 79(3), 59-78.
Porter, M.E. (2013). Performance measurement and value based management. In Focus
magazine for the performance management professional, Issue No. 2 - January.
Postma, T.J.B.M., & Zwart, P.S. (2001). Strategic research and performance of SMEs.
Journal of Small Business Strategy, 12 (92), 52-64.
Prajogo, D.I., McDermott, P., & Goh, M. (2008). Impact of value chain activities on quality
and innovation. International Journal of Operations and Production Management,
28(7), 615-635.
Price waterhouse Coopers. (2013). Supplier relationship management: How key suppliers
drive your company’s competitive advantage.
Priem, R. L., & Butler, R. (2001). Is the resource-based ‘view’ a useful perspective for
strategic management research? The Academy of Management Review, 26(1), 22-
40.
Ratemo, J. (2011). “The influence of supplier relationship management of procurement
performance”; Unpublished MSc Thesis, Jomo Kenyatta University of
Agriculture and Technology, Nairobi.
Rana, S.M., Osman, A., & Islam, A. (2014). Customer satisfaction of retail chain stores:
Evidence from Bangladesh. Journal of Asian Scientific Research, 2014, 4(10), 574-
584.
Rayport, J.F., & Sviokla, J.J. (1995). “ Exploiting the virtual value chain.” Harvard
Business Review, 73(6), 75-86.
Riechheld, F. (1993). “Loyalty-based management.” Harvard Business Review, 64-73.
Roko, L.P., & Opusunju, M.I. (2016). Value chain and performance in agro allied small
and medium scale enterprise in Sokoto state, Nigeria. International Journal of
Business and Social Research, 6(9), 8-17.
Schiebel, M. (2005). "Value chain analysis and competitive advantage in
telecommunication Linns in the United Kingdom", Unpublished Ph.D Dissertation,
Institute of Marketing and Innovation, University of Natural Resources and Applied
life Sciences, 2.15
Shank, J.K., & Govindarajan, V. (1993). Strategic cost management: The new tool for
competitive advantage. New York: The Free Press.
Somekh, B., & Cathy, L. (2005). Research methods in the social sciences. London: Sage

71
Publications Inc.
Sparling, D. (2007). Development of value chain management as business practice:
Value chain management (DVD), George Morris Centre.
Suhong, Li., Nathan, B.R., Nathan, T.S., & Rao, S.S. (2004). The Impact of Supply chain
Management practices on competitive advantage and organizational performance.
Omega the International Journal of Management Science, 34(2006), 107-124.
Teece, D. J., Pisano, G., & Shuen, A. (1997). Dynamic capabilities and strategic
management. Strategic Management Journal, 18, 509-533.
Urbig, D. (2.003). "The value chain analysis-implications for firms and industry
analysis"; Proceedings of Perspectives in business informatics research (BIR) Berlin-
Shaker Verlag; 1-15.
United Nations International Labor Organization (UNILO). (2009). Guide for value chain
analysis and upgrading. Retrieved from
http://www.valuechains.org/dyn/bds/docs/detail/545/6.
Viara, P., & Alexei, S. (2010). Modeling organizational performance indicators. Journal
Information Systems, 35(4), 505-527.
Venu, S. (2001). Competitive advantage strategies: Alternative scenarios, India,
Businessline, 12 (1).
Wachira, R.W. (2013). Supplier relationship management and supply chain performance
in alcoholic beverage industry in Kenya, Unpublished MBA Thesis, University of
Nairobi, Nairobi.
Wagner, S.M. (2010). Supplier traits better customer firm innovation performance.
Industrial Marketing Management, 39(7), 1139-1149.
Walter, A., Muller, T.A., Helfert, G., & Ritter, T. (2003). “Functions of industrial
supplier relationships and their impact on relationship quality.” Industrial Marketing
Management, 32, 159-169.
Wernerfelt, B. (1984). “A resource-based view of the firm.” Strategic Management
Journal, 5, 171-180.
Wiggins, R. R., & Ruefli, T. W. (2005). Schumpeter’s ghost: Is hypercompetition making
the best of time shorter? Strategic Management Journal, 26, 887-911.
Wilson, D.T. (1995). “An integrated model of buyer –seller relationships.” ISBM report
lo-1995, The Pennsylvania State University.
Winter, S.G. (2005). Towards an evolutionary theory of production. In: K. Dopfer, ed.
Principles of evolutionary economics. Cambridge: Cambridge University Press.

72
Wulf, K.D., Odekerken, S.G., & Iacobucci, D., (2001). Investments in consume
relationships: A cross-country and cross-industry exploration. J. Marketing, 65(4):
33-50.
Yang, Z., Wang, X., & Su, C. (2006). A review of research methodologies in
international business. International Business Review, 15(6), 601-617.
Yeo, R. (2005). Problem-based learning: Lessons for administrators, educators, and learners.
International Journal of Educational Management, 19(7), 5401-5551.
Ylikoski, T. (2000). Unohtuikoasiakas?, 2nd edition. Keuruu: OtavanKirjapainoOy.

73
APPENDICES
Appendix I : Questionnaire
Section A: Organizational Characteristics
Please provide the following information regarding your organization
1. Name of company…………………………………………………
2. Job position of the respondent ……………………………
3. Please tick as appropriate to indicate how long your organization has been in
operation in Nakuru County, Kenya.
Below 5 years 5-10 years 11-15 years 16-20 years
4. How many employees are in this company?
Between 51-100 above 100
5. Markets served:
I. Local (Nakuru County)…………………….
II. National…………………………………….
III. International………………………………..

74
Part II: Value Chain Management Practices
6. Please indicate the degree of agreement or disagreement with the following
statements by ticking the choice that fits the situation in your company best using the
key where 1 =Strongly Disagree, 2 = Disagree, 3 = Neutral, 4 = Agree, 5 = Strongly
Agree.
Statement
SD D N A SA
a) Supplier Relationship Management
i. We regularly solve problems jointly with our
suppliers.
1 2 3 4 5
ii. We consider quality as our number one criterion in
selecting suppliers.
1 2 3 4 5
iii. We have a continuous improvement programs that
include our key suppliers.
1 2 3 4 5
iv. We actively involve our key suppliers in new
product development.
1 2 3 4 5
v. We include our key suppliers in our planning and
goal setting activities.
1 2 3 4 5
vi. We regularly measure our suppliers’ contributions
to our profitability.
1 2 3 4 5
b) Internal Value Chain Activities
i. We strive to differentiate our value chain activities 1 2 3 4 5
ii. We explore opportunities of employing new
technologies in our value chain activities.
1 2 3 4 5
iii. We strive to minimize cost in our value chain
activities.
1 2 3 4 5
iv. Our Value Chain Activities are linked. 1 2 3 4 5
c) Customer Relationship Management
i. We frequently measure and evaluate customers’
satisfaction.
1 2 3 4 5

75
ii. We promptly respond to customers’ problems,
suggestions and complaints.
1 2 3 4 5
iii. We have different marketing patterns for target
customers.
1 2 3 4 5
iv. We offer after sale service to our customers. 1 2 3 4 5
v. We actively provides discount for loyal customers. 1 2 3 4 5
Part III: Organizational Performance
For each of the following aspects of performance, indicate the change in the aspects for the
last three years using the key where 1=very much decreased (VMD), =2 decreased (D) 3=no
change (NC), 4= increased (I), 5= very much increased (VMI).
Organizational Performance VMD D NC I VMI
Market Performance
i. Sales Growth 1 2 3 4 5
ii. Market Share 1 2 3 4 5

76
Appendix II: Medium and Large Scale Retail Outlets in Nakuru County
1. Bawari Stores (Naivasha- Moi Road)
2. Charles O. Machungu Hardware (Nakuru East- Geoffrey Kamau)
3. Choppies Supermarket (Nakuru East)
4. Chuma Mart Limited (Nakuru West- Shabaab)
5. C.K. Patel Hardware (Nakuru East- Kenyatta Lane)
6. Elburgon Bidii Stores
7. Elephant Hardware Stores Limited (Njoro- Posta)
8. Ereto Bookshop (Nakuru East- Kenyatta Avenue)
9. Gilanis Supermarket
10. Home Budget Supermarket (Molo)
11. Hygienic Supermarket
12. Jamaa Supermarket (Naivasha- Chotara Road)
13. Kanini Enterprises (Nakuru Town)
14. Mache Hardware (Nakuru Town)
15. Moses Gikonyo Ndungu Hardware (Gilgil- Syndicate)
16. Naivas Supermarket
17. Hotel Kunste
18. Ole Ken Hotel
19. Naivasha Self Service (Naivasha- Chotara)
20. Nakumatt West Side Supermarket
21. Nilkanthvarni Hardware Limited (Nakuru West-Shabaab)
22. Patmatt Bookshop (Nakuru East- Kenyatta Avenue)
23. Nuru Palace Hotel
24. Quickmart Limited (Nakuru East- Shirikisho Way)
25. Rivanas Holdings (Nakuru West- Kanu Street)
26. Ruby Hardware Limited (Nakuru West- Shabaab)
27. Society Stores (Naivasha- Mbaria Kaniu)
28. Stagematt Supermarkets (Nakuru East-Biashara)
29. Sumkam (Njoro)
30. Super Bargains Glass and Hardware (Nakuru Town)
31. Tiles and Home Appliances Nakuru Limited (Nakuru West-Shabaab)
32. Timber Craft East Africa Limited (Nakuru West- London)
33. Tuskys Supermarket

77
34. Bontana Hotel
35. Cathy Hotel
36. Merica Hotel
37. Eagle Palace Hotel
38. Uchumi Bidii Stores (Molo)
39. Legacy Hotel
40. Vision Mart Limited
41. West End (Elburgon)
42. Hotel Waterbuck
43. Wool Matt Supermarket
(County Government of Nakuru, Ministry of Finance and Economic Planning, 2017)