effect of teacher self-efficacy on - ku scholarworks - the
TRANSCRIPT

An Exploratory Study of Teacher Self-Efficacy Beliefs and
Professional Learning Community
By
Susan M. Romeo
Submitted to the graduate degree program in Educational Policy and Leadership and the
Graduate Faculty of the University of Kansas in partial fulfillment of the requirements for
the degree of Doctor of Education.
________________________________
Chairperson: Dr. John Rury
________________________________
Committee Member: Dr. Howard Ebmeier
________________________________
Committee Member: Dr. Mark Mahlios
________________________________
Committee Member: Dr. Perry Perkins
________________________________
Committee Member: Dr.Argun Saatcioglu
Date Defended: December 15, 2010

DEDICATION
The paper is dedicated to Rocco A. Romeo, my husband and partner of twelve
years, who sacrificed much in order for me to reach my professional goals. Education is a
“people” business, and a worthy and rewarding line of work for one’s life. As a
professional educator, I am passionate about making a real difference in the lives of the
children, my staffs, my schools, and the districts in which I have served and will continue
to serve over the course of my career. It has not been an easy road to travel, yet you never
discouraged me for doing what I am intrinsically driven to do -- strive for excellence and
meaning in my passion for improving schools for children. I fall short of excellence
many, many times, and I have certainly wanted to give up on this research paper, but here
it is. Thank you for your support and patience over the course of my journey.
Susan
In memory of William D. Harris
1964-1995
William encouraged my transition to the field of education because he knew it was my
one true passion, thus contributing to the possibility of this dissertation. I hope he is
looking down right now with a smile.
2

ACKNOWLEDGMENTS
This dissertation has taken a long and winding road through many personal and
professional trials and tribulations, as well as successes and joys. There were many
individuals along the road who encouraged me and often actually thrust me forward when
I wanted to give up. Those who know me, though, know that I never would have forgiven
myself if I had taken the easy way out and given up when I wanted to.
It is impossible to thank all those who have contributed to the successful completion
of this project, but here are some individuals and groups that must be acknowledged:
Dr. John Rury for putting up with the considerable number of delays, and for
allowing me to push forward when he could have given up on me.
Dr. Perry Perkins for assisting me with reentry to the program after taking several
years off and for leaving me with the impression that he viewed my success as his
success.
Thank you to the members of my dissertation committee at the University of
Kansas: Dr. Howard Ebmeier, Dr. Mark Mahlios, Dr. Perry Perkins, Dr. John Rury, and
Dr. Argun Saatcioglu.
Thank you professional mentors and supporters: Dr. Kevin Daniel, Dr. Jill
Hackett, Dr. Terri Jamison, and Dr. David McGehee.
Thank you to Dr. Elizabeth Pearman for providing invaluable dissertation
coaching and technical advisement.
3

Thank you to the teachers and staffs at both Sunset Valley Elementary in the
Lee’s Summit School District and Raymore Elementary in the Raymore-Peculiar School
District for supporting me through the various stages of obtaining my doctorate degree.
Thank you to special friends who have been instrumental in my success by
providing encouragement and a kick in the pants when I needed it: Stephanie Bridges,
Michelle Hofmann, Karen Hurst Michelle Miller, and Ken Wilbanks.
Thank you to my sister, Peggy Nordblad, and my father, Patrick Powers for being
there when times got tough.
Last, but not least, thank you to all my former and current students who make this
all worthwhile.
4

TABLE OF CONTENTS DEDICATION...............................................................................................................2 ACKNOWLEDGMENTS .............................................................................................3 LIST OF TABLES.........................................................................................................8 LIST OF FIGURES .......................................................................................................9 ABSTRACT.................................................................................................................10 CHAPTER 1: INTRODUCTION TO THE STUDY...................................................11 Introduction......................................................................................................11 Overview of the Literature...............................................................................12 School Reform .....................................................................................12 Professional Learning Communities....................................................14 Self-Efficacy and Teacher Efficacy .....................................................17 Core Research Questions of the Study.............................................................20 Importance of Study.........................................................................................20 Limitations and Delimitations..........................................................................22 Assumptions.....................................................................................................23 Operational Definitions....................................................................................23 Summary and Organization of the Study.........................................................24 CHAPTER 2: REVIEW OF RELATED LITERATURE............................................27 Introduction......................................................................................................27 Overview of American School Reform ...........................................................27 Introduction..........................................................................................27 19th Century School Reform ................................................................28 20th Century School Reform ................................................................31 No Child Left Behind...........................................................................38 Reforming Schools Through Professional Learning Communities .................41 Essential Elements of Professional Learning Communities ............................43 Self-Efficacy and Teacher Efficacy as Constructs of Social Cognitive Theory ………………………………………………………………………..47 Self-Efficacy ....................................................................................................48 Bandura’s Triadic Reciprocal Causation Model .............................................49
5

Teacher Efficacy ..............................................................................................51 Summary ..........................................................................................................54 CHAPTER 3: METHODOLOGY ...............................................................................55 Overview..........................................................................................................55 Research Design………………………………………………………………55 Population and Sample………………………………………………………..56 Instruments……………………………………………………………………59 Data Collection Procedures…………………………………………………...62 Validity and Reliability……………………………………………………….63 Data Analysis………………………………………………………………….65 Summary………………………………………………………………………69 CHAPTER 4: PRESENTATION OF THE RESULTS ...............................................70 Overview..........................................................................................................70 Study Participants ............................................................................................71 Instruments…………………………………………………………………...74 Findings……………………………………………………………………….82 Summary .....................................................................................................… 88 CHAPTER 5: DISCUSSION, CONCLUSIONS, IMPLICATIONS, AND RECOMMENDATIONS.............................................................................................89 Overview..........................................................................................................89 Factor Analysis ................................................................................................89 Correlation Analyses........................................................................................91 Discussion and Implications of the Study........................................................94 Limitations of the Study...................................................................................97 Future Research ...............................................................................................98 Concluding Thoughts.......................................................................................99 REFERENCES ..........................................................................................................100 FOOTNOTES……………………………………………………………………….106 APPENDIX A: LETTER REQUESTING PERMISSION TO RESEARCH IN LEE’S SUMMIT R-7 SCHOOL DISTRICT.........................................................................107
6
APPENDIX B: HUMAN STUDIES INTERNET INFORMATION STATEMENT............................................................................................................112 APPENDIX C: DEMOGRAPHIC SURVEY............................................................114 APPENDIX D: SCHOOL PROFESSIONAL STAFF AS LEARNING COMMUNITY QUESTIONNAIRE (SPSLCQ) .................................................................................115 APPENDIX E: TEACHERS’ SENSE OF EFFICACY QUESTIONNAIRE (TSES) ......................................................................................118 APPENDIX F: STEPWISE REGRESSION ………………………………………120 VITA………………………..……………………………………………………….126
7
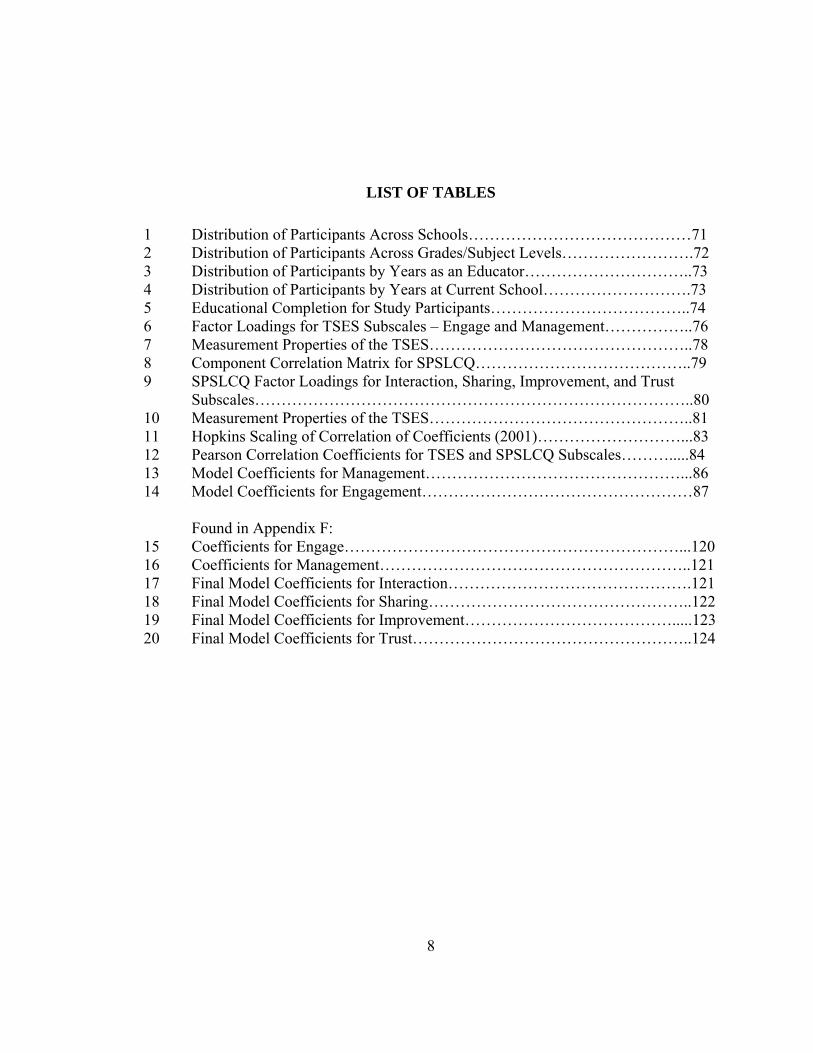
LIST OF TABLES
1 Distribution of Participants Across Schools……………………………………71 2 Distribution of Participants Across Grades/Subject Levels…………………….72 3 Distribution of Participants by Years as an Educator…………………………..73 4 Distribution of Participants by Years at Current School……………………….73 5 Educational Completion for Study Participants………………………………..74 6 Factor Loadings for TSES Subscales – Engage and Management……………..76 7 Measurement Properties of the TSES…………………………………………..78 8 Component Correlation Matrix for SPSLCQ…………………………………..79 9 SPSLCQ Factor Loadings for Interaction, Sharing, Improvement, and Trust Subscales………………………………………………………………………..80 10 Measurement Properties of the TSES…………………………………………..81 11 Hopkins Scaling of Correlation of Coefficients (2001)………………………...83 12 Pearson Correlation Coefficients for TSES and SPSLCQ Subscales……….....84 13 Model Coefficients for Management…………………………………………...86 14 Model Coefficients for Engagement……………………………………………87 Found in Appendix F: 15 Coefficients for Engage………………………………………………………...120 16 Coefficients for Management…………………………………………………..121 17 Final Model Coefficients for Interaction……………………………………….121 18 Final Model Coefficients for Sharing…………………………………………..122 19 Final Model Coefficients for Improvement………………………………….....123 20 Final Model Coefficients for Trust……………………………………………..124
8

LIST OF FIGURES
1. Bandura’s Triadic Reciprocal Causation Model..............................................49
9
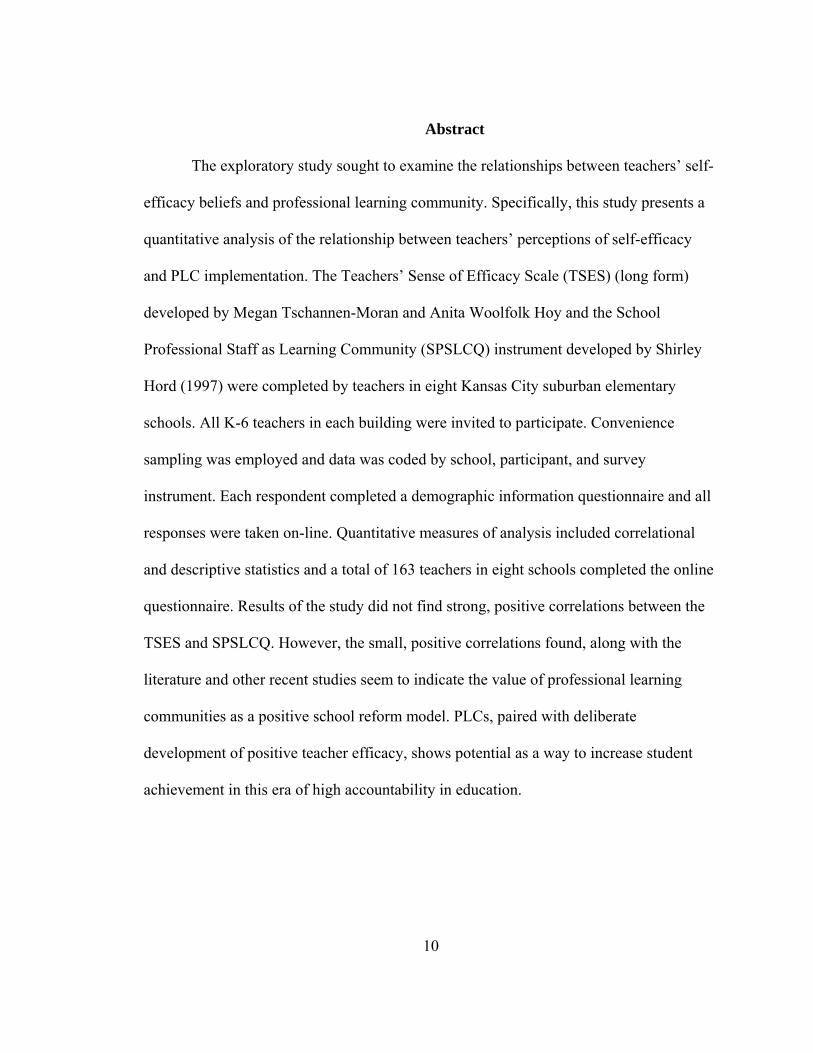
Abstract
The exploratory study sought to examine the relationships between teachers’ self-
efficacy beliefs and professional learning community. Specifically, this study presents a
quantitative analysis of the relationship between teachers’ perceptions of self-efficacy
and PLC implementation. The Teachers’ Sense of Efficacy Scale (TSES) (long form)
developed by Megan Tschannen-Moran and Anita Woolfolk Hoy and the School
Professional Staff as Learning Community (SPSLCQ) instrument developed by Shirley
Hord (1997) were completed by teachers in eight Kansas City suburban elementary
schools. All K-6 teachers in each building were invited to participate. Convenience
sampling was employed and data was coded by school, participant, and survey
instrument. Each respondent completed a demographic information questionnaire and all
responses were taken on-line. Quantitative measures of analysis included correlational
and descriptive statistics and a total of 163 teachers in eight schools completed the online
questionnaire. Results of the study did not find strong, positive correlations between the
TSES and SPSLCQ. However, the small, positive correlations found, along with the
literature and other recent studies seem to indicate the value of professional learning
communities as a positive school reform model. PLCs, paired with deliberate
development of positive teacher efficacy, shows potential as a way to increase student
achievement in this era of high accountability in education.
10
CHAPTER 1: INTRODUCTION TO THE STUDY
Introduction
National best-selling author, Jim Collins, makes a simple, but powerful
declarative statement about what it takes to be great: “Good is the enemy of great” (2000,
p. 1). Collins proclaimed this as one of the central reasons so little in the world is great.
“We don’t have great schools, principally because we have good schools” (Collins, 2001,
p. 1). Collins used the analogy of a flywheel to make an eloquent point:
The flywheel image captures the overall feel of what it was like inside the companies as they went from good to great. No matter how dramatic the end result, the good to great transformations never happen in one fell swoop. There was no single defining action, no grand program, no one killer innovation, no solitary lucky break, no wrenching revolution. Good to great comes about by a cumulative process–step by step, action by action, decision by decision, turn by turn of the flywheel–that adds up to sustained and spectacular results. (Collins, 2001, p. 165)
A critical question in schooling is whether today’s children should have good
schools or great schools. To move education forward, educators must determine what
reforms will move schools from good to great.
Schools today face complex demands and overwhelming problems, causing the
drumbeat of school reform to be louder than ever. American school reform is not a new
concept, but the current climate is particularly pressurized. Johnson (1996, p. 91) called
the current era of school reform, “the best of times and the worst of times in public
education.” Federal legislation known as the No Child Left Behind (NCLB) Act has
increased pressure on schools to find methods that will ensure every child in the United
States achieves proficiency in the areas of reading, mathematics, and science. Each state
is responsible for identifying essential skills students should master at particular grade
11

levels, assessing those skills, and identifying students who do and do not meet
proficiency standards. As states scramble to meet the mandates of No Child Left Behind,
schools feel urgency to identify and implement programs and strategies to bring about
comprehensive school improvement.
Overview of the Literature
School Reform
A significant body of circumstantial evidence points to a deep, systematic incapacity of U.S. schools, and the practitioners who work within them, to develop, incorporate, and extend new ideas about teaching and learning in anything but a small fraction of schools and classrooms. (Elmore, 1996, p. 1)
Historically, the United States populace has believed that schools can solve
society’s problems. Many education policymakers believe the right reform strategy can
solve all of our schools’ problems. T. C. Hunt (2005) claimed that an examination of the
history of education reform might slow the sprint to embrace the next reform panacea. T.
C. Hunt pointed out the history of American education is littered with supposed panaceas
for the various educational issues of those time periods and warned about the need to
learn from past school reform efforts to avoid the search for today’s school reform “silver
bullet” (p. 89). T. C. Hunt offered a few notable examples from U.S. education history:
• The common school would remove all crime and poverty from American society.
• Bible reading in schools would result in a virtuous America. • McGuffey readers would instill the right character in students. • Schools of the early 1900s would make good, loyal Americans out of
immigrant children.
12

• The “Life Adjustment” curriculum of the mid-1900s would prepare all American youths for quality lives as individuals, family members, and citizens.
• Increased funding for math and science by the National Defense Education
Act would help the U.S. catch up with the Soviets in the post-Sputnik era and increase rigor in schools.
• School reforms accelerated in the 20th century with the advent of open
education, performance contracting, behavioral objectives, modular scheduling, the accountability movement, and site-based education, and similar reforms. (T. C. Hunt, 2005, pp. 84-85)
Hord (1997) discussed the prevalence of a quick-fix mentality in U.S. culture and
described it as a “microwave oven” (p. 3) theory of school improvement. Hord
maintained that many schools are poorly prepared to implement their change initiatives
and often implement them in a cursory manner. Hord recommended a high level of staff
collaboration and the implementation of professional learning community practices and
philosophies as a way to combat the quick-fix tendencies that often accompany school
reform initiatives.
Purkey and Smith (1982, as cited in Saphier & King, 1985) supported the concept
that the culture of a school is the foundation for school reform. Purkey and Smith
reasoned, “Academically effective schools are distinguished by their structures,
processes, and climate of values and norms that channel staff and students in the direction
of successful teaching and learning.” (1982, p. 68, as cited in Saphier & King, 1985).
DuFour (2004) emphasized that professional learning communities are a mechanism of
reform and increasing student achievement, and he recommended engaging teachers in
school improvement efforts. Fullan (2007) supported the same position and stated,
13

“Educational change depends on what teachers do and think – it’s as simple and complex
as that” (p. 129).
DuFour and Eaker (1998) lamented that past efforts to reform school had
historically not had the anticipated results for a number of reasons: (a) the complexity of
the task, (b) misplaced focus and ineffective strategies, (c) lack of clarity on the intended
results, (d) failure to persist, and (e) lack of understanding of the change process (p. 17).
However, DuFour and Eaker insisted it was not necessary to give in to despair with
regard to school reform. Instead, they maintained increasing evidence has emerged for
hope for substantial school improvement through the implementation of professional
learning communities.
Professional Learning Communities
“If schools want to enhance their organizational capacity to boost student
learning, they should work on building a professional community that is characterized by
shared purpose, collaborative activity, and collective responsibility among staff.”
(Newmann & Wehlage, 1995, p. 37)
The prominence of the school improvement model known as the professional
learning community has grown tremendously in recent years. Increasing student
achievement is the ultimate goal of the professional learning community model. The
establishment of a professional learning community (PLC) involves a shared, systematic
approach to identify and address students’ needs. A learning community makes the most
of resources and staff in the school and has the potential to provide teachers with the
14

professional development and research-based strategies necessary to teach students with
varying abilities and to improve student achievement (DuFour, Eaker, & DuFour, 2005).
Louis and Kruse maintained, “A core characteristic of the professional learning
community is an undeviating focus on student learning” (as cited in Hord, 2004, p. 19).
DuFour, DuFour, and Eaker (2008) discussed three ideas to guide the implementation of
PLC. First, the ultimate purpose of the school is to guarantee high levels of learning for
all students. DuFour, DuFour, and Eaker (2008) emphasize that in PLCs the focus is on
“Was it learned?” rather than “Was it taught?”(p.19). Changing from a focus on teaching
to a focus on learning is critical to the work of a PLC.
Second, educators cannot achieve the fundamental purpose of learning if they
work in isolation. They must work collaboratively to address the issues with significant
impact on student learning, and together, ensure that learning occurs at high levels for
each student. Third, educators must continually seek evidence of student learning
through systematic monitoring. This monitoring of progress informs instructional
decisions and daily classroom practices (DuFour et al., 2008, pp. 18-19).
Even though PLCs are in fashion and most educators generally believe the
implementation of PLCs will improve student achievement, the Center for
Comprehensive School Reform and Improvement stated, “It can be challenging to show
direct relationships between PLCs and student outcomes” (Learning Point Associates,
2009, p. 1). One explanation provided was that the actual existence of a PLC must be
shown prior to establishment of a link between the PLC and measurable student
15

achievement. As noted by Roberts and Pruitt (2003), the term “learning community” has
taken on a variety of meanings in the literature.
Doerr (2009) pointed out that “professional learning community” has become a
“catchphrase in education” (p. 28). Doerr asserted that asking a variety of individuals to
define PLC would likely yield an array of different answers. However, The Center for
Comprehensive School Reform and Improvement cited a number of studies that have
examined the relationship between professional learning community and student
achievement.
Researchers Hughes and Kritsonis (2007, as cited in Learning Point Associates,
2009) selected a sample of schools from a database of schools that were possibly
implementing PLCs and that had sent staff to PLC workshops. The mean length of time
the sample schools (N = 64) reported functioning as a PLC was 2.5 years. During a
three-year period, 90.6% of these schools reported an increase in standardized math
scores; 81.3% reported an increase in English/language arts scores between 5 points and
26 points.
Case studies of three elementary schools showed that during a five-year period,
students from minority and low-income families improved their scores on state
achievement tests from less than 50% proficiency to 75% proficiency. Strahan (2003, as
cited in Learning Point Associates, 2009) conducted interviews to examine the role of a
collaborative professional culture on instructional improvement and found that working
collaboratively in PLCs was a characteristic of these schools.
16

Using multiple sources of data from a four-year evaluation of PLCs in an urban
district, Supovitz (2002, as cited in Learning Point Associates, 2009) found that an
explicit focus on instructional improvement was necessary for PLCs to have a positive
impact on improving teaching and learning. Without such focus, PLCs may have a
positive effect on culture and teachers' feelings of well-being, but not necessarily on
student achievement. Researchers found similar results in another large urban district
(Supovitz & Christman, 2003, as cited in Learning Point Associates, 2009)
Vescio, Ross, and Adams (2006) submitted that the literature “provides modest
evidence that professional learning communities impact teaching” (p. 13). In their
examination of 10 studies, they found six studies that “attempted to make those
connections” (p. 14). Vescio et al. maintained that although few in number, the overall
results of these studies put forth evidence that the literature supported the “assumption
that student learning increases when teachers participate in professional learning
communities” (p. 16). In the current era of high-stakes testing and school accountability,
the success or failure of professional learning communities as a reform depends on
whether student achievement improves with PLC implementation.
Self-Efficacy and Teacher Efficacy
The construct of self-efficacy has its theoretical underpinnings in Bandura’s social
cognitive theory (1977, 1997). Social cognitive theory avows that human behavior is not
solely influenced and driven by human biology and environment. Instead, social
cognitive theory asserts that humans are complex and act in intentional ways, or exhibit
17

“agency” (Bandura, 1997, p. 3). Bandura stated, “The power to originate actions for
given purposes is the key feature of personal agency” (1997, p. 3).
Bandura put forth that internal and external factors, as well as past and present
behaviors, influence humans. He suggested many interrelated factors, which may or may
not be within the individual sphere of control, determine human behavior. Fundamental
to Bandura’s social cognitive theory, however, is that personal beliefs contribute greatly
to life choices, as well as to eventual successes and failures. “People need firm
confidence in their efficacy to mount and sustain the effort required to succeed”
(Bandura, 1997, p. 11).
Bandura formally defined self-efficacy as “beliefs in one’s capabilities to organize
and execute the courses of action required to produce given attainments” (1997, p. 3).
These beliefs are influential in one’s behavior choices and ability to redirect one’s
behavior. Bandura is particularly noted for his model of triadic reciprocal causation,
which outlines the three critical elements of human agency: (a) external environment, (b)
personal behavior, and (c) internal personal factors such as biological events and
affective and cognitive processes (Bandura, 1997, p. 6). The three components are
multidirectional, and each brings a varying amount of influence at any given time.
Bandura (1997) stated, “A growing body of research in educational psychology
suggests that a teacher’s quality of performance and commitment to work is related to his
or her level of motivation to influence student learning” (as cited in Ware & Kitsantas,
2007, p. 303). Protheroe (2008) noted the concept of teacher efficacy originated a little
over 30 years ago, when the RAND Corporation asked teachers to express their degree of
18

agreement with two belief statements on their 1976 teacher survey. Since then, research
in this area has “suggested powerful effects from the simple idea that a teacher’s belief in
his or her ability to positively impact student learning is critical to actual success or
failure in a teacher’s behavior” (Henson, 2001, p. 17). Tschannen-Moran, Hoy, and Hoy
(1998) stated a teacher’s sense of self-efficacy is “related to teachers’ behavior in the
classroom. It affects the effort they put into teaching, the goals they set, and their level of
aspiration” (pp. 222-223).
Protheroe (2008) pointed out two important questions related to teacher efficacy:
• How does a teacher’s sense of efficacy affect his or her teaching?
• Can it, through its impact on teaching, affect student achievement? (p. 43).
Protheroe went on to cite the work of Jerald (2007) as providing an overview of
important findings related to teachers with a stronger sense of efficacy in his considerable
review of the literature. Jerald found that teachers with a stronger sense of efficacy:
• Tend to exhibit greater levels of planning and organization,
• Are more open to new ideas and are more willing to experiment with new methods to better meet the needs of their students,
• Are more persistent and resilient when things do not go smoothly,
• Are less critical of students when they make errors, and
• Are less inclined to refer difficult students to special education.
(Protheroe, 2008, p. 43)
In general, the literature demonstrates two overall findings, as summed up by a study
conducted by Ware and Kitsantas (2007). First, teachers who report high self-efficacy
19

tend to overcome challenges to their teaching, are more optimistic, give greater work
effort, and take responsibility for their work. At the other end of the spectrum, teachers
who report low self-efficacy are more likely to attribute their results to external factors.
Core Research Questions of the Study
This goal of the current correlational study is to explore the relationship between
two variables: attitudes toward professional learning community and teacher self-efficacy
beliefs. To this end, the following research questions were explored:
Research Question One:
Is there a relationship between the subscales of the TSES (Engage, and
Management) and the subscales of the SPSLCQ (Interaction, Sharing,
Improvement, and Trust)?
Research Question Two:
Do school location, gender, grade level/content area taught, total number of
years as a professional educator, total number of years working at current
school and education level predict subscales of the TSES (Engage and
Management) and the subscales of the SPSLCQ (Interaction, Sharing,
Improvement, and Trust)?
Importance of the Study
The goal of this study was to explore the impact of teacher efficacy beliefs on the
level of PLC implementation in particular schools. The use of two instruments
commonly used to measure the constructs of teacher efficacy and PLC implementation
facilitated the research. The instruments utilized in the study were the Teachers’ Sense of
20

Efficacy Scale (long form) (TSES) and the School Professional Staff as Learning
Community (SPSLCQ). The TSES is intended to assess whether a teacher believes that
student motivation and learning are under the teacher’s control. The SPSLCQ (Hord,
1997) is designed to assess whether teachers perceive their school as having a positive
learning environment and a supportive learning community. The results of this study add
to the general body of school improvement research, and specifically, to the areas of
teacher efficacy and professional learning communities.
Research studies have indicated the impact of teacher efficacy beliefs on
classroom performance and student achievement (Henson, 2001). Rozenholtz (1989, as
cited in Hord, 1997) discovered that teachers with a strong sense of efficacy were more
likely to adapt and improve classroom practices and had increased longevity in the
profession. Rozenholtz found that teacher workplace factors influenced teacher
commitment and effectiveness.
Darling-Hammond (1996) suggested that redesigning the way teachers spend their
time and providing collaboration structures for teachers so they could work together
might increase teacher satisfaction. Darling-Hammond found a need for restructuring
now, more than ever. “Schools are now expected not only to offer education, but to
ensure learning” (Darling-Hammond, 1996, p. 5). Most educators in recent years have
viewed professional learning communities, as an organizational structure, as an effective
model for increasing collegiality among teachers and improving schools.
This correlational study was investigative in nature, with the goal of ascertaining
whether a relationship was present between teachers within professional learning
21
communities and their personal beliefs of self-efficacy in the teaching role. By using
Likert-like scales to measure constructs of professional learning community and self-
efficacy, the data were treated as continuous variables, which allowed for stronger
statistical analyses. The study began with the hope that the results could inform the
practices of educational leaders, with the ultimate goal of improving schools to increase
student learning and success. Informed leaders are better equipped to meet the needs of
teachers and students. The cultivation of strong teacher efficacy and implementation of
professional learning communities have the potential to meet the stated goals.
Limitations and Delimitations
The study had a number of limitations. As a result of the sample size, eight
schools and 164 teachers, the results are not as generalizable as they might have been
with a larger sample size. Most of the respondents were white females, typical of
Midwestern elementary school faculties. Study results might have been applicable to
more settings, had respondents exhibited greater diversity. Respondents participated on a
voluntary basis at the encouragement of their building administrators. It is probable that
teachers who responded may generally have had more positive attitudes toward
educational research and the larger mission of schooling. In general, teachers who tend to
be “systems thinkers” are more likely to arrive early or stay late to participate in optional
activities such as this study.
A noted delimitation is that the study addressed only kindergarten through 6th
grade regular education and special education teachers in the elementary school setting.
All teachers in the participating school had participated in professional development
22
training in the area of professional learning communities. However, teachers at the
various schools had differing amounts of professional experience with regard to years in
teaching, years in the district, and degree completion. This may have had an impact on
teacher responses to the questionnaires.
Assumptions
This study had three basic assumptions: The self-reported data collected from
teachers for this study were assumed to be truthful, as were the candid responses to each
questionnaire item; teachers’ participation in the study was voluntary; and each teacher
had participated in professional learning communities training at his or her building site.
Operational Definitions
Collaboration. This is a systematic process in which teams work together to
analyze and impact professional practice in order to improve individual and collective
results (DuFour, 2004, p. 2).
No Child Left Behind (NCLB). The NCLB is legislative act passed in 2001 by
Congress that defines parameters for public schools. “NCLB is built on four principles:
accountability for results, more choices for parents, greater local control and flexibility,
and an emphasis on doing what works based on scientific research” (United States
Department of Education, 2007, n.p.). This legislation mandates that all students
(regular, special education, all demographic groups) score “proficient” in
reading/language arts and math by the year 2014 (Northwest Regional Comprehensive
Center, n.d.).
23

Professional learning community (PLC). This is a group of educators committed
to working collaboratively in ongoing processes of collective inquiry and action research
to achieve better results for the students they serve. Professional learning communities
operate under the assumption that the key to improved learning for students is
continuous, job-embedded learning for educators (DuFour et al., 2008).
Self-Efficacy. Beliefs in one’s capabilities to organize and execute the courses of
action required to produce given attainments (Bandura, 1997, p. 3).
Teacher efficacy. Teachers’ confidence in their ability to promote students’
learning (Hoy, 2000, p. 2).
Summary and Organization of the Study
This study presents a quantitative analysis of the relationship between teacher
efficacy and depth of PLC implementation. The Teachers’ Sense of Efficacy Scale
(TSES) (long form) developed by Megan Tschannen-Moran and Anita Woolfolk Hoy
and the School Professional Staff as Learning Community (SPSLCQ) instrument
developed by Shirley Hord (1997) was administered to the teachers in eight Kansas City
suburban elementary schools. All K-6 teachers in each building were invited to
participate. Convenience sampling as defined by Creswell (2002) was employed.
Principals and assistant principals assisted with participant completion of the survey
instruments by encouraging and reminding teachers to submit the demographic surveys
and questionnaires, which were contained in one document to enable ease in responding.
Teacher participation was completely voluntary and questionnaires were completed either
before or after regular school hours. Data was coded by school, participant, and survey
24

instrument. Quantitative measures of analysis include correlational and descriptive
statistics. Teacher participants were provided an informational statement and Internet
Information Statement. All responses were provided on-line.
This study is presented in five parts. Chapter 1 contains a brief overview of
relevant literature that supports this study, core research questions, significance of the
study, delimitations and limitations, assumptions, and operational definitions of important
terms, and a brief conclusion statement.
Chapter 2, the review of literature, includes background information on past and
present school reform initiatives in order to set the stage for today’s urgent need to
improve schools in the United States by increasing student achievement and meeting the
needs of the No Child Left Behind Act. Professional learning communities and its
essential elements are discussed as a potential model for meeting the needs of today’s
schools during this time of extreme accountability. The construct of teacher efficacy is
reviewed as there is literature to support the notion that teacher attitudes and self-beliefs
impact the way they do their job and to what extent they feel they can and do make a
difference with regard to student learning. Bandura’s (1977, 1986, 1997) social cognitive
theory of self-efficacy receives considerable emphasis in this section.
Chapter 3 includes the methodology used in this study including a description of
the research population, sampling procedures, questionnaires used, design, and analysis
procedures, nature of descriptive statistics collected. Chapter 4 presents a summary of the
study results, including factor and reliability analysis, correlation analysis, and a
25

summary of descriptive statistics for the sample. Chapter 5 contains a discussion of
results, implications of results, and future research opportunities.
26
CHAPTER 2: REVIEW OF RELATED LITERATURE
Introduction
Chapter 2 presents a review of the literature related to the critical elements of this
study. Each section of this chapter presents a review of pertinent literature relating to the
study. The intent of the literature review is to examine past school reform movements,
the professional learning community as a school reform model, and teacher efficacy as an
influence on school performance and culture.
Overview of American School Reform
Introduction
Fullan (1997) acknowledged, “These are indeed tough times for public education
and public educators” (p. vii). While virtually every school is searching for new and
better ways to meet the needs of today’s school children and the mandates of No Child
Left Behind (NCLB), Fullan assured, “There is no silver bullet” with regard to school
reform (p. vii). From the colonial period to the present, our nation’s citizens have
“dreamed of improving, if not perfecting, the nation’s public schools” (Reese, 2000, p.
7). Americans have expected public schools to solve a wide variety of social problems
through the reform of the schools. Though the popular issues of school reform may ebb
and flow, such issues generally reflect wider national concerns. Periods of great social
change often result in calls to reform our nation’s schools. Reese (2000) asserted,
“Reforming schools is one prominent way the United States tries to understand and
improve itself” (p. 7).
27

19th Century School Reform
Interest in maintaining a centrally managed public school system had its historical
roots in colonial America (Schneider & Keesler, 2007). Governmental entities managed
public schools and parents were not obligated to send their children to school. The few
compulsory education laws of the colonial period had foundations in religious fervor
(Imber & Van Geel, 2004). Students learned to read the Bible to ensure protection
against satanic influence. The curriculum focused on the three R’s: reading, ’riting, and
’rithmetic, as well as religion and morals (Reece, 2000; Schneider & Keesler, 2007).
Attendance was erratic and teachers did not expect most students to be proficient
readers until around the age of 12. Private academies existed in many larger cities and
charity schools were established for the urban poor (Reese, 2000). By the late 1700s,
American education began to experience a shift from a concentration on religious and
moral education to a more “secular, scientific, and functional orientation” (Schneider &
Keesler, 2007, p. 199). This shift was a result of European influences and the beginning
of national sentiment that education was a “socialization tool” (Schneider & Keesler,
2007, p. 199) for the young democratic nation.
The most significant accomplishment of 19th century school reformers was the
establishment of universal, tax-supported public schools (Reese, 2000). Public schools
were established in the Northern states before the Civil War and then more slowly in the
Southern states after the Civil War. By the 1830s and 1840s, schools across the
countryside educated boys and girls living in the immediate areas. These schools were
often referred to as “common schools.” While not always free, common schools were
28

accessible to white boys and girls from the neighboring areas. In the cities, reformers
worked to abolish charity schools for the poor and slowly moved to integrate all students
into the emerging public schools. Many middle and upper class students began attending
the new public schools (Reese, 2000).
Though allocation of social and economic resources continued to develop free
elementary education in the early 1800s, the push for free secondary schools did not
emerge until the 1820s (Schneider & Keesler, 2007). During the mid-1800s, reformers
worked to increase the number of teachers, improve teacher training, raise learning
standards, and remove older children from the elementary school setting. Influential
reformer, Horace Mann, Secretary of the Massachusetts State Board of Education, and
other leading reformers continued to advocate for increased public funding for universal
public education.
By 1850, most state legislatures had established an office for the state
superintendent of education, along with systems to oversee local schools. The public
expected American schools of this period to be the primary social agency to join students
from divergent cultural backgrounds and to “Americanize” immigrants (Nelson,
Palonsky, & Carlson, 2000). Compulsory education and an emphasis on civics, history,
and the English language were subjects used to indoctrinate the new American students.
While public education in this era was a means of developing democracy and offering
opportunities for social movement (Nelson et al., 2000), this visionary ideal did not apply
to all individuals. Nearly 100 years passed before all individuals had legal access to
29

public education, the quality of which varied greatly among populations (Schneider &
Keesler, 2007).
Throughout the 1800s, some reformers sought to standardize various aspects of
public education. Horace Mann was particularly influential during this era and called for
more state control of local districts. Mann also recommended a number of specific
innovations such as increasing the number of consolidated schools, the adoption of
uniform textbooks, and the creation of more age-graded classrooms. In addition, Mann
pushed for opening more free high schools, the hiring of women as elementary teachers,
and the adoption of a more standardized curriculum (Reese, 2000).
The movement to create and expand public universities also took root in this era.
While the 1800s saw significant growth and innovations in education, not all states
hurried to adopt them. The progress toward more state control eventually gained ground
and officials adjusted local school practices accordingly. However, the substantial
majority of 19th century schoolchildren attended school only for a few brief years (Reese,
2000). With 90% of Americans still living and working on farms, most considered
school as a luxury, with only one in ten children attending formal schooling (Schneider &
Keesler, 2007).
By the 1890s and early 1900s, reformers were already talking about the concept
of the “new education” (Reese, 2000). The new education was a combination of ideas
originating in Europe that later made its way to America. Advocates of the new
education had a wide variety of philosophical viewpoints about how schools should
educate children. One particularly notable movement encouraged the shift from
30

emphasis on traditional textbooks and recitation to more child-centered teaching
strategies. Despite the agenda of the new education, most schools still operated in a
traditional manner in the early 1900s.
20th Century School Reform
The transition from the 19th century to the 20th century continued to be a dynamic
period in American history, with industrialization, immigration, urbanization, and the
continued evolution of American schooling impacting social and economic elements of
society. Child labor still existed during this period and many children still did not attend
school for more than a few years, if at all, despite the rhetoric about the importance of
school in shaping the new democracy. The process of immigration reduced the number
of child laborers over time, as adult immigrants took their jobs. African Americans
began their migration north as technological improvements in farming reduced the need
for human laborers. It was a time of great societal change and the cry for school reform
again sounded as a means of improving societal ills.
The drumbeat for school reform echoed through the period between the
depression of the 1890s and the end of World War I in 1918 (Reese, 2000). The
reformers of this era, the administrative progressives, sought to reform schools by taking
their prompt from America’s flourishing manufacturing economy (School Communities
That Work, 2002). The goal of the administrative progressives was to create a formula or
method of running effective schools that would “produce assimilated, productive citizens
as efficiently as Ford’s factories produced cars” (School Communities That Work, 2002,
p. 2).
31

The administrative progressives were mostly white male, first-generation
professionals with similar ideals, interests, and training who served as lifelong educators
and held many high-level positions in education (Tyack & Cuban, 1995). This group of
reformers shared a common conviction in corporate-style scientific management and a
desire to separate schooling from politics (School Communities That Work, 2002). By
removing education from politics, experts could make the critical decisions about school
management (Tyack & Cuban, 1995). Tyack and Cuban asserted that the administrative
progressives “shaped the agenda and implementation of school reform more powerfully
from 1900-1950 than any other group has done before or since” (1995, p. 17).
Standardization of inputs rather than outputs was the goal of the administrative
progressives (School Communities That Work, 2002). The administrative progressives
put forth a business-oriented view of schools. For efficiency in both rural and urban
areas, the administrative progressives pushed for consolidated, centralized school systems
run by high-salaried experts assumed to serve the interests of all the children (Reese,
2000). Their reforms lead to a reduction in local control and smaller school boards, both
changes that were unwelcome in many communities. Dissenting groups saw the
corporate approach of the administrative progressives as devaluing the importance of
neighborhood influence (Reese, 2000).
While the administrative progressives wielded much power, opposition groups
and grassroots groups lobbied for other changes in schooling. Many of these groups
insisted on more social services in schools and they supported the implementation of
breakfast programs, construction of more playgrounds, and increased usage of schools as
32

community centers (Reese, 2000). Those opposing the approach taken by administrative
progressives maintained that little consideration was paid to the developmental needs of
individual students and “students were seen more as products to be shaped than as active
contributors to their own learning” (Stoskopf, 2002).
The administrative progressives of the first half of the 20th century were the “chief
American architects of reform and arbiters of educational progress,” according to Tyack
and Cuban (1995, p. 17). This dynamic period in the history of schooling saw the
introduction and implementation of many features of modern public education. More
children had access to public education, children attended school more often and for
longer periods of time, school funding increased, and the structures of current day
elementary and secondary schools were solidified. The role of the high school changed
rapidly with diversification of the curriculum and addition of extracurricular activities.
The impact of the administrative progressives remains significant in today’s schools, as
evidenced by the continuation of the structures first promoted by the administrative
progressives (School Communities That Work, 2002, p. 2).
One of the most prominent educational reform movements of the 1920s and 1930s
was the concept of progressive education (Schneider & Keesler, 2007). Supporters of
progressive education espoused a more active learning style, improved student-teacher
interactions, and recognition of individual differences. By the 1940s and 1950s, the
pendulum swung back the other way, with more traditional methods, schedules, and
routines. By the late 1960s and early 1970s, more progressive methods were again
33
fashionable, only to drift away once again after the publication of A Nation at Risk in
1983 (Schneider & Keelser, 2007).
Though school consolidation and centralization was rapid and extensive by
midcentury, school districts varied from one to the next, and often schools varied within
the same district (Reese, 2000). While comprehensive high schools were standard, elite
private schools existed in larger cities, contributing to ongoing issues of racial and social
class segregation. Reformers and citizens in general continued to view the primary
purpose of schools as ensuring an educated, democratic populace, but equal opportunities
still did not exist for all.
In both urban and rural areas, racial segregation continued to be commonplace,
even more so in the South. Issues of unequal educational opportunity moved to the
forefront of educational reform in the 1950s. The 1954 U. S. Supreme Court decision of
Brown v. Board of Education struck down the longstanding “separate but equal” doctrine
of Plessy v. Ferguson and declared that “in the field of public education, the doctrine of
‘separate but equal’ has no place” (Imber & Van Geel, 2004, p. 213).
The actual dismantling of racially identifiable schools was a sluggish process, and
not until the Civil Rights Act of 1964 did the federal government possess a means for
forcing racial desegregation in public schools (Schneider & Keesler, 2007). The Act,
which prohibited allocation of federal monies to schools that discriminated on the basis
of race, provided an effective sanction for schools that did not comply with
desegregation.
34

School reform after 1945 moved into a new realm (Reese, 2000). America
emerged as a world power after World War II, experienced rapid growth and prosperity,
and sought to maintain its competitive edge on the world stage. The Cold War with the
Soviet Union overtook the relatively peaceful time after WWII, and the Soviet’s launch
of the Sputnik space satellite propelled the Soviets into a scientific leadership position
(Schneider & Keesler, 2007). Many education reformers responded with calls to reform
school math and science programs to ensure America’s ability to maintain its competitive
edge. Many of the math and science programs launched post-Sputnik remain in effect
today.
Student enrollment continued to grow in the 1960s, along with the economy
(Reese, 2000). Disparate funding among urban and suburban school districts, as well as
those in the North and South, contributed to unequal educational opportunities for poor
and Black students (Schneider & Keesler, 2007). Race relations were often tense in this
period and Whites moved to the suburbs as cities deteriorated. Faith in the prospect of
progress fueled both protest and federal legislation, according to Tyack and Cuban
(1995). The federal government responded with several pieces of legislation in response
to the obvious inequalities.
The Johnson administration declared a War on Poverty and created two federal
programs to assist low-income children (Schneider & Keesler, 2007); Head Start for
preschool students, and Job Corps for adolescents. Later, the Nixon administration
enacted the Elementary and Secondary Education Act, mandating educational services
for poor children (Tyack & Cuban, 1995). The federal role in schools had grown
35

significantly since WWII, having increased to about 9% of all education spending by this
time (Reese, 2000).
The 1960s and 1970s was a period in which the struggle for equity in education
continued. School desegregation and compensatory education programs for at-risk
students were important educational issues. Integration efforts had taken hold and new
teaching practices such as open classrooms, more student choice in course offerings,
flexible scheduling, magnet schools, and alternative schools were common (Reese, 2000;
Schneider & Keesler, 2007). Conservatives asserted that these recent developments in
education had a negative effect on schools, as they cited removal of prayer from schools,
decreasing test scores, and the decline of student discipline. As the economy weakened
in the 1970s, Republicans gained prominence and took the lead in school reform (Reese,
2000).
The late 1970s and early 1980s ushered in a period of high criticism of America’s
schools. The 1983 federal report, A Nation at Risk, authored by the National
Commission of Excellence in Education, called for sweeping educational reform (Good
& Braden, 2000). The report claimed that the public schools of the 1960s and 1970s had
“lost their intellectual rigor” and that America was losing its prominence in the areas of
“commerce, industry, science, technology, and innovation” (as cited in Good & Braden,
2000, p. 34). The report was a “landmark indictment” of the nation’s schools (Schneider
& Keesler, 2007, p. 202) and called for a return to an emphasis on academic excellence
(Reese, 2000).
36

The report contained specific recommendations in five major areas: content,
standards and expectations, time, teaching, and leadership and fiscal support (Good &
Braden, 2000). Shortly after A Nation at Risk (National Commission on Excellence in
Education, 1983), Gallop polls indicated only 31% of those polled gave public schools a
grade of A or B, demonstrating a fairly consistent drop in public confidence (Tyack &
Cuban, 1995). In response, state legislatures throughout the 1980s required local districts
to increase standards, extend the school year, assign more homework, and implement
other measures to increase educational rigor (Reese, 2000; Schneider & Keesler, 2007).
A Nation at Risk had a lasting effect on how Americans viewed public schools.
After A Nation at Risk, reformers set out on one of the most pervasive school reform
efforts in American history, a movement that continues today (Schneider & Keesler,
2007). States promulgated more educational laws and regulations in the mid-1980s than
had been produced in the previous 20 years (Tyack & Cuban, 1995). Toch (as cited in
Schneider & Keesler, 2007) estimated there were 3000 separate school reform measures
enacted in the 1980s. State-level task forces were numerous in the 1980s and the trend
continued into the 1990s. More than a quarter century has passed since the A Nation at
Risk report, and it remains controversial today (Ravitch, 2008).
As a result of A Nation at Risk, school reform and the role of school leaders began
to change in the 1980s and did not take a linear path to No Child Left Behind, but rather
moved in “fits and starts” (J. W. Hunt, 2008, p. 581). Hunt outlined three of the most
substantial reform movements of the 1980s and 1990s: The excellence movement, the
restructuring movement, and the standards movement. The excellence movement sought
37

to increase standards for teachers and students and typically recommended changes in the
structures of teaching, such as schedules, calendars, requirements, and assessments. In
this era, advocates held up business models as possible solutions for the ills of schooling.
The restructuring movement at the end of the 1980s focused on district-level
changes with heavy endorsement of site-based management, leading to a great deal of
support from teachers and building administrators. During the restructuring movement,
teachers and principals received encouragement to try creative new approaches. District
and building level administrators enjoyed support for sharing control and fostering
teacher leadership. This was also a time when stakeholders began expecting improved
student achievement results.
J. W. Hunt (2008) named the standards movement as the third movement
resulting from A Nation at Risk. The federal legislation of Goals 2000 and No Child Left
Behind have had profound impacts on schools, with directives to improve student
achievement through sweeping mandates and funding muscle. Subject-area standards
and a focus on assessment are hallmarks of the standards movement and influence how
schools operate today.
No Child Left Behind
Finn (2002) asserted, “Accountability may be the hottest word in primary and
secondary education nowadays” (p. 85). The hallmark of this accountability movement is
the federal statute known as the No Child Left Behind Act (NCLB). NCLB is the 2001
amendment of the Elementary and Secondary Education Act, which Congress initially
passed in 1965. A multifaceted piece of legislation, NCLB combines the former Title I
38

grant program; a new assessment, accountability, and reform system; and a number of
provisions that impact school operations (Imber & Van Geel, 2004).
Finn and Hess (2004) maintained NCLB is “driven by two main pistons: imposing
systematic testing on schools and districts, and imposing forceful remedies on weak
schools” (p. 39). Schneider and Keesler (2007) contended that NCLB has regressed from
a standards-based approach to one of “testing and accountability, whereby schools now
receive the brunt of sanction, should their students fail to reach specified performance
criteria” (p. 206). School districts across the nation are scrambling to meet the mandates
of NCLB. School leaders are searching for ways to improve practices and increase
student achievement.
The essential goal of No Child Left Behind is to transport all students to a state-
specified level of proficiency by 2014 (Imber & Van Geel, 2004). NCLB represents a
substantial expansion of federal control over public education, and encouraging reform in
underperforming, high-poverty schools. However, Finn and Hess (2004) stated that
NCLB “has grand ambitions, but its means are meager” because federal funds amount to
pennies on the public school dollar, thus giving Congress “limited fiscal leverage” (p.
39). Nevertheless, NCLB is an ambitious legal mandate with a specific set of
requirements. Imber and Van Geel (2004, pp. 105-106) outlined key aspects of the
assessment and accountability aspects of NCLB:
• Adopt “challenging academic content standards” and “challenging student
academic achievement standards” regarding what children are to know and be
able to do.
39

• Establish “annual yearly progress” (AYP) objectives for all students and
separate measurable annual objectives for disadvantaged students, students from
major racial and ethnic groups, students with disabilities, and students with
limited English proficiency.
• Administer tests “aligned” with the state’s standards annually to all
students in grades 3-8 and at least once during high school to assess AYP in
mathematics and reading or language arts. Schools must also test science at least
once during grades 10-12. The assessment of any student who has attended
school in the United States for three or more consecutive years must be in
English. On a case-by-case basis, individual students may be exempted from this
requirement. Schools must annually assess the English proficiency of students of
limited English speaking ability.
• Issue various reports detailing assessment results, including a report on
each student for parents and teachers; assessment results disaggregated by gender,
major racial and ethnic groups, English proficiency, migrant status, disability, and
status as economically disadvantaged; and school, school district, and state report
cards.
• Continue to participate in the biennial National Assessment of Education
Progress of reading and math for students in the fourth and eighth grades.
No Child Left Behind is “clearly the most ambitious educational initiative in
American history,” as evidenced by its impact on all aspects of schooling, according to
DuFour, DuFour, and Eaker (2008). NCLB has shifted public focus to the building level
40

and to how individual and groups of students perform academically (J. W. Hunt, 2008).
With mandated annual increases in the percentage of students achieving proficiency on
state assessments until 2014, educators at all levels are feeling the strain of NCLB.
School administrators are seeking and implementing school improvement initiatives in
hopes of meeting the 2014 deadline, when the legislation expects all students to be
proficient in reading and in math. One prominent school improvement initiative in recent
years is professional learning communities (PLCs). DuFour and Eaker (1998, p. xi)
maintained that PLCs are “the most promising strategy for sustained, substantive, school
improvement.”
Reforming Schools Through Professional Learning Communities
In recent decades, the American public and education professionals alike have
sought new practices and programs to improve public education (Hord, 1997). Reform
advocates recognize that educators must embrace change in order to achieve systematic
improvement. “Educational leaders’ work is further complicated by current needs for the
fundamental and systematic change required for dramatically increasing student learning
and achievement” (Helsing, Howell, Kegan & Lahey, 2008, p. 438). Driven by the
demands of teaching and learning within a climate of increasing accountability, school
improvement efforts are in overdrive to improve student achievement and meet the
demands of No Child Left Behind. One school improvement model that has emerged to
meet these demands is that of professional learning communities.
Historically, school reform has often been the mechanism for improving society
in general, but change comes slowly. According to Tyack and Cuban (1995), “For over a
41

century and a half, Americans have translated their cultural anxieties and hopes into
dramatic demands for educational reform” (p. 1). Tyack and Cuban asserted the
“structures, rules, and practices” (1995, p. 8) that impact instruction have changed little in
the last century and a half, though innovators periodically challenge the status quo.
Tyack and Cuban stated that one common theme for innovation over the years has been
the call for teachers to work in teams rather than function in isolation (1995, p. 87).
Teacher collaboration is a critical attribute of the school improvement model
known as professional learning communities. Purposeful dialogue can have an important
impact on schools (Sparks, 2005). DuFour (2004), a major advocate of PLCs, suggested
educators “must work together to achieve their collective purpose of learning for all” (p.
9) and “create structures to promote a collaborative culture” (p. 9). Such learning
communities connect individuals in collective work and bring them into contact with
other educators and ideas. Collaborating as a PLC encourages “teachers to reflect
critically on their practice, thus creating new knowledge and beliefs about teaching and
learning” (Hord, 1997). DuFour (2004) believed that, despite compelling evidence about
the effectiveness of teacher collaboration, teachers in many schools continue to work in
isolation, to the detriment of school improvement.
The professional learning community model differs greatly from the factory
model of the late 19th and early 20th centuries (DuFour & Eaker, 1998). The post-
industrial world of today requires a significant paradigm shift. Factory model education
no longer works in this technological and knowledge-based world. Today’s educators are
responsible for equipping students with knowledge and skills differing greatly from those
42

of generations past. Students must be empowered to be learners, thinkers, and
communicators. DuFour and Eaker (1992) suggested an educational organization must
be willing to “renew itself—to seek and find better ways of fulfilling its mission” in order
to meet the needs of today’s learners (p. 8). The professional learning community
provides a model for school improvement that fosters adult learning and a focus on
continuous improvement.
Essential Elements of Professional Learning Communities
In their book Revisiting Professional Learning Communities at Work: New
Insights for Improving Schools, DuFour et al. (2008) defined a professional learning
community as follows:
We define a professional learning community as educators committed to working
collaboratively in ongoing processes of collective inquiry and action research to
achieve better results for the students they serve. Professional learning
communities operate under the assumption that the key to improved learning for
students is continuous, job-embedded learning for educators. (p. 14)
The PLC is a conceptual school improvement model aimed at increasing student
achievement by building the capacity of school personnel to create and sustain conditions
that promote high levels of student and adult learning. According to DuFour, Dufour,
Eaker, and Karhanek (2004), the “fundamental purpose of school is learning, not
teaching–an enormous distinction” (p. 2). Key aspects of this initiative include shared
purpose, collaborative activity, and collective responsibility for results. The four critical
questions of learning that are emphasized within a PLC are:
43

1. What is it we want all students to learn—by grade level, by course, and by
unit of study?
2. How will we know when each student has acquired the intended
knowledge and skills?
3. How will we respond when students experience initial difficulty so that we
can improve upon current levels of learning?
4. How will we respond when students already know the curriculum?
(DuFour et al., 2004, pp. 2-3)
In a high-functioning PLC, these questions guide the daily work, decisions, and
conversations of every staff member and the school in general.
In an effective PLC, the four critical questions drive the selection of learning
objectives, curriculum, and assessment methods. PLC schools systematically plan
intervention strategies for struggling and accelerated students, and allocate time and
financial resources to provide quality educational programs for each student.
The term “professional learning community” first surfaced in the literature of
organizational theory as early as the 1960s; the concept presented an alternative to the
isolation in which teachers often worked. Senge (1990), whose primary focus was on
corporations rather than schools, nevertheless influenced the field of education with his
advocacy to move toward becoming a learning organization by striving for continuous
renewal. Senge’s image of a learning organization was a place where “people continually
expand their capacity to create the results they truly desire, where new and expansive
44

patterns of thinking are nurtured, where collective aspiration is set free, and where people
are continually learning how to learn together” (Senge, 1990, p. 3).
Senge promoted the establishment of a supportive culture that enabled a high
level of staff collaboration and an effort toward unified goals. Senge outlined five
learning disciplines that must be in place to ensure an effective learning organization: (a)
personal mastery, (b) mental models, (c) team learning, (d) building shared vision, and
(e) systems thinking (as cited in Roberts & Pruitt, 2003, p. 3). Senge’s five learning
disciplines have had obvious impact on today’s PLC culture, as evidenced in the
discussion of Hord’s research.
Even more recently, teacher collaboration and the PLC model has gained wider
acceptance among educators. By the mid-1990s, the ideas advocated by Senge had been
recognized in the educational community under the concept of professional learning
communities. In her extensive 1997 research report entitled Professional Learning
Communities: Communities of Continuous Inquiry and Improvement, Hord suggested
Professional Learning Communities shared five common attributes: (a) supportive and
shared leadership, (b) collective creativity, (c) shared values and vision, (d) supportive
conditions, and (e) shared personal practice (pp. 14-20). Hord maintained that while a
major goal of school reform is to provide an optimal learning environment for students,
teachers thrive professionally when the five preceding attributes are present.
Hord (1996) developed the School Professional Staff as Learning Community
Questionnaire (SPSLC) as a tool to examine teachers’ perceptions about their school’s
staff and structures and the extent to which they perceive their school to exhibit each of
45

the five conceptual dimensions of a professional learning community. Though much of
the research examining schools as professional learning communities is qualitative, the
SPSLC collects quantitative data and will be used in the present study to explore the
relationship between two variables, attitudes toward professional learning community and
self-efficacy beliefs. The descriptors of Hord’s five PLC dimensions from the SPSLC
follow.
1. Supportive and shared leadership: School administrators participate democratically with staff sharing power, authority, and decision-making.
2. Shared values and vision: staff members share visions for school
improvement that have an undeviating focus on student learning, and are consistently referenced for the staff’s work.
3. Collective learning and the application of that learning: Staff members’
collective learning and application of the learnings (taking action) create high intellectual learning tasks and solutions to address student needs.
4. Shared practice: Peers review and give feedback based on observing each
other’s classroom behaviors in order to increase individual and organizational capacity.
5. Supportive conditions: School conditions and capacities support the staff’s
arrangement as a professional learning organization. (Hord, 1996)
Doerr (2009) acknowledged that professional learning community has become an
educational catchphrase that can elicit many different responses when individuals or
organizations define the term. However, the PLC research base supports the importance
of the basic key elements of professional learning communities. Doerr (2009) asserted
having an exact definition or model of a PLC is not important because individual schools
must meet the needs of their own cultures, but key practices of learning communities
improve teaching performance and student achievement. These practices include (a)
46

establishment of a clearly identified problem around which the learning team can come
together, (b) meetings that focus on the problem, (c) dedication of time to meet
consistently, (d) sharing and appropriately differentiating responsibility as well as mutual
accountability, and (e) establishment of a climate of trust where teachers can be open
about their concerns and weaknesses (pp. 28-29). Schmoker (2004) observed “It is
stunning that for all this evidence and consensus of expert opinion, such collaboration–
our most effective tool for improving instruction–remains exceedingly, dismayingly rare”
(p. 431).
Self-Efficacy and Teacher Efficacy as Constructs of Social Cognitive Theory
Self-efficacy and teacher efficacy are important constructs of social cognitive
theory. Bandura (1997) defined self-efficacy as, “beliefs in one’s capabilities to organize
and execute the courses of action required to produce given attainments” (p. 3). Dembo
and Gibson (1985) defined teacher efficacy more simplistically as, “The extent to which
teachers believe they can affect students’ learning” (p. 173). While a variety of factors
impact the effectiveness of classroom teachers, Ashton (1984) noted:
No other teacher characteristic has demonstrated such a consistent relationship to
student achievement…and…a potentially powerful paradigm for teacher
education can be developed on the basis of the construct of teacher efficacy
beliefs.” (p. 28)
Researchers from the RAND Corporation initiated the investigation of teacher
efficacy by adding two items to an extensive questionnaire administered to teachers in
1976, and the concept of teacher efficacy was born (Tschannen-Moran, Woolfolk, &
47

Hoy, 1998). One of the questions measured general teaching efficacy (GTE), while the
other measured personal teaching efficacy (PTE) (Koehler, 2006). General teaching
efficacy is one’s belief in the power of teaching to overcome external student factors.
Personal teaching efficacy refers to teachers’ beliefs in their personal teaching abilities.
Self-Efficacy
Psychologist and Stanford University professor, Albert Bandura, is well-
recognized as the originator of the theory of self-efficacy within the field of psychology
known as social cognitive theory (Henson, 2001, Pajares, 2004). Bandura published
Social Foundations of Thought and Action in 1986, which offered a view of human
behavior that imparts a “central role to cognitive, vicarious, self-regulatory, and self-
reflective processes in human adaptation and change” (Pajares, 2004, p. 1). Believers in
this theory view people as proactive rather than solely reactive in nature. Bandura
asserted that people can and do learn both directly and indirectly by observing behaviors
and the consequences of those behaviors (Gibson, 2004).
In social cognitive theory, “Human agency operates within in an interdependent
causal structure involving triadic reciprocal causation” (Bandura, 1986). The term
agency refers to “acts done intentionally” (Bandura, 1997, p. 3). The theory suggests that
a combination of behavioral, cognitive, and environmental factors influence behavior.
Bandura (1997) maintained that in this “transactional view of self and society, internal
personal factors in the form of cognitive, affective, and biological events; behavior; and
environmental events all operate as interacting determinants that influence one another
48

bidirectionally” (p. 6). The relative influence of the three major elements of the model is
circumstantial and not necessarily of equal strength at any one time.
Figure 1. Bandura’s (1997) Triadic Reciprocal Causation Model
Bandura’s social cognitive theory contrasts with theories of human functioning
that largely emphasize the factors of environment and biology (Pajares, 2004). In social
cognitive theory, individuals are agents in their own development and can make things
occur as a result of their chosen actions. Bandura (1986) suggested, “What people think,
believe, and feel affects how they behave” (p. 25). Bandura (1986) believed, “A theory
that denies that thoughts can regulate actions does not lend itself readily to the
explanation of complex human behavior” (p. 15).
As a social cognitive theorist, Bandura suggested that individuals hold beliefs that
enable them to maintain a level of control over their thoughts, emotions, motivation and
Behavioral Factors
Personal Factors
Environmental Factors
49

acts. Individuals have the ability to perceive, regulate, and evaluate their own behaviors,
which is influenced by both self-beliefs and environmental sources. The process of
environmental factors interacting with personal factors such as behavior and cognitive
abilities is known as reciprocal determinism (Bandura, 1997).
Essential to Bandura’s beliefs is the notion that humans are not just products of
their environment and biology (Henson, 2001). Social cognitive theory maintains that
current and past behaviors affect humans, as does the interplay between internal and
external influences. Bandura was critical of theorists who regarded the mind and body as
separate entities (Henson, 2001).
A central concept of Bandura’s social cognitive theory is that of self-efficacy. As
stated previously, Bandura (1997) defined self-efficacy as “Beliefs in one’s capabilities to
organize and execute the courses of action required to produce given attainments” (p. 3).
The essential premise of self-efficacy is that an individual’s self-belief is key to his or her
actions, resiliency, motivation, and performance, taking into account one’s environment
(Bandura, 1997).
Tschannen-Moran et al., (1998) pointed out that self-efficacy has to do with self-
perception of competence rather than actual competence. When individuals overestimate
or underestimate their genuine abilities, it may influence the amount of effort put forth on
a task or the course of action taken. Bandura 1997) maintained, “A capability is only as
good as its execution. The self-assurance with which people approach and manage
difficult tasks determines whether they make good or poor use of their capabilities.
Insidious self-doubts can easily overrule the best of skills”(p. 35). In the school setting,
50
individual self-efficacy beliefs influence both teachers and students. Teachers who feel
they can truly make a positive difference in students’ lives are likely to put forth more
effort in meeting student needs. As well, students who believe they can complete a task
are more likely to put forth effort than students who do not have high self-efficacy in that
particular area. Tschannen-Moran et al. (1998) stated, “Slightly overestimating one’s
actual capabilities has the most positive effect on performance” (p. 211).
Teacher Efficacy
Research in the area of educational psychology indicates that teacher performance
and dedication to work is related to the personal level of motivation to influence
achievement (Bandura, 1997). Teacher motivation can be assessed through the construct
of teacher efficacy (Ware & Kitsantas, 2007). The definition of teacher efficacy is
“Teachers’ confidence in their ability to promote students’ learning” (Hoy, 2000). The
concept was introduced approximately 30 years ago when the RAND corporation
conducted a teacher study. Teachers indicated their level of agreement with the
following two items:
• “When it comes right down to it, a teacher really can’t do much because
most of a student’s motivation and performance depends on his or her
home environment.”
• “If I try really hard, I can get through to even the most difficult or
unmotivated students” (Armor et al., 1976, as cited in Protheroe, 2008, p.
42).
51

Protheroe (2008) alluded to the idea that this work set the stage for what is now
well understood about teacher efficacy and that a teacher’s belief in his or her power to
impact student learning can determine the level of success that teacher is able to achieve
with students. Koehler (2006) pointed out that in the years following the RAND study,
numerous researchers investigated teacher efficacy and developed longer instruments to
assess teacher efficacy. Koehler also stated that research has shown teacher efficacy is
important with regard to teacher retention, stress reduction for teachers, and student
achievement.
According to Bandura (1977), teacher efficacy is a form of self-efficacy and a
cognitive process in which beliefs about an individual’s aptitude to perform at a given
level of accomplishment are constructed. Resiliency in the face of difficulty, effort
exerted, and persistence are all impacted by self-efficacy (Bandura, 1997). Bandura
(1977) maintained that both efficacy expectations and outcome expectations affect
efficacy. Efficacy expectations are an individual’s beliefs about his or her own capability
to achieve a certain level of mastery in a given situation. Outcome expectations are those
judgments an individual makes about the probable consequences of specific behaviors in
a situation.
Researchers believe a variety of variables at the school level influence teachers’ sense of
efficacy. Hoy, Hoy, and Tschannen-Moran (1998) indicated that teacher isolation, lack of clarity,
and alienation could erode teacher efficacy beliefs. However, greater opportunity for
collaboration with colleagues, a supportive environment, and feedback given and received from
professional observations can increase teacher efficacy beliefs. Additionally, principal leadership,
52

shared decision-making, and school culture can influence teachers’ sense of efficacy. Kohm and
Nance (2009) stated,
Teachers who work in schools with strong collaborative cultures behave
differently from those who depend on administrators to create the conditions of
their work. In collaborative cultures, teachers exercise creative leadership together
and take responsibility for helping all students learn. (p. 67).
Teachers who benefit from collaboration and thus feel more efficacious may
likely impact student learning to a higher degree. Kohm and Nance (2009) also asserted
that principals could cultivate collaborative cultures to build the confidence teachers need
to succeed.
Bandura (1997) emphasized that teachers’ experience, or performance
accomplishments, shape teachers’ sense of efficacy. Teachers who have experienced the
success of enabling their students to master concepts and skills are likely to be more
efficacious. Hoy (2000) suggested that as early as student teaching, teachers begin to
develop a lasting sense of efficacy. This has certain implications for principals as they
design induction programs for new teachers.
Appropriate training and support for new teachers can increase new teachers’
sense of efficacy, which will likely have long lasting effects on the learning and
achievement of their future students. Principals face countless challenges, but helping to
ensure that teachers have the instructional skills and the professional confidence they
need to teach their students effectively is one of the most critical challenges (Brinson &
53

Steiner, 2007). Consciously working to build efficacy can provide leaders a means to
achieve this goal.
Henson (2001) stated, “Clearly, the study of teacher efficacy has borne much
fruit” (p. 5), but went on to describe obstacles concerning its meaning and measure.
Henson illuminated the two central concerns regarding the issue:
• Due to the theoretical nature of the self-efficacy construct, the argument
has been made that it is most appropriate to measure it within context of
specific behaviors.
• Construct validity of scores from the primary instruments purporting to
measure teacher efficacy has been questioned. (2001, p. 5)
Koehler (2006) asserted that while educators have learned much through teacher
efficacy research, “The measurement of this construct has been problematic due to the
unstable psychometric properties of the instruments used” (p. 1).
Summary
The foregoing information was a review of the literature related to Bandura’s
theory of efficacy beliefs and the influence that teacher self-efficacy and a professional
learning community can have on teaching and learning. While a positive belief of
efficacy motivates individuals to endeavor harder and longer, a weak perception of
efficacy contributes to decreased motivation (Bandura, 1977, 1986, 1997). The review
covered the framework of professional learning communities, as many researchers and
educators believe these contribute to teachers’ self-efficacy. Chapter 3 outlines the design
of this study.
54

CHAPTER 3: METHODOLOGY
Overview
Chapter 3 presents the design and analysis of the study. Special attention is given
to participants in the study, the way participants were selected, a description of the
instruments used and the statistical analyses. The study sought to explore the
relationships between variables and whether predictors could be identified. The following
research questions were posed by the study
RQ1: Is there a relationship between the subscales of the TSES (Engage, and
Management) and the subscales of the SPSLCQ (Interaction, Sharing,
Improvement, Trust)?
RQ2: Do school location, gender, grade level/content area taught, total number
of years as a professional educator, total number of years working at current
school and education level predict subscales of the TSES (Engage and
Management) and the subscales of the SPSLCQ (Interaction, Sharing,
Improvement, and Trust)?
Research Design
The study utilized a descriptive survey research design (Creswell, 2005) where
“you administer a survey or questionnaire to a small group of people in order to identify
trends in attitudes, opinions, behaviors, or characteristics of a large group of people” (p.
52). Though generalizability of results may be somewhat limited due to sample size and
homogeneity increased knowledge of teacher efficacy beliefs and their impact on PLCs, a
proven school improvement model, has the potential to positively impact student
55

learning, according to the literature. In addition this study may serve to encourage future
research on this area.
Quantitative survey data was collected to investigate the relationships between
variables pertinent to the study questions. Surveys or questionnaires allow for the fairly
easy collection of data from a wide variety of sources in a timely and concise manner
(Dillman, 2000). Various methods of survey data collection include personal interviews,
telephone interviews, mailed questionnaires, and directly administered questionnaires
(Ary, Jacobs, & Razavieh, 2002). Regardless of the method chosen, the six basic steps
involved in conducting survey design research are planning, defining the population,
sampling, constructing the instrument, conducting the survey, and processing the data
(Ary, et al., 2002).
Population and Sample
The population of interest for this study is certified elementary teachers in the
suburban Kansas City area. In order to solicit an adequate sample size of certified
elementary teachers, the researcher elected to approach a large school district in suburban
Kansas City with a total K-12 student enrollment of 17,300 students. The district
encompasses an area of 117 square miles and has 3 high schools, 3 middle schools and 18
elementary schools. The researcher set up a meeting with key decision makers of the
district and completed the district’s Application to Conduct Research (Appendix A). The
superintendent’s cabinet reviewed the Application to Conduct Research and approved the
application. The researcher then spoke to all 18 elementary building principals about the
research project at the monthly principals’ meeting and sent a follow-up email inviting all
56

18 principals to recruit faculty members as potential survey participants. Eight of the 18
schools opted to participate in the study. Ten principals declined participation with
several citing the end of the school year as a difficult time for teachers to complete extra
projects. One principal declined his building’s participation stating his teachers had
already participated in several studies during the 2009-2010 school year.
Faculty members from the eight elementary schools were asked by their building
administrators to complete the questionnaires, Teachers’ Sense of Efficacy Scale and
School Professional Staff as Learning Community, on a voluntary basis. The researcher
requested that principals or their assistant principals facilitate administration of the
questionnaires, with most principals opting to administer the surveys just prior to
regularly scheduled faculty meetings. All certified K-6 teachers in the participating
schools were encouraged by their building administrators to complete the online
questionnaires. Teachers were clearly instructed participation was voluntary, with no
consequences for opting out. A total of 163 teachers completed the online questionnaires.
There were varying levels of participation at each school site, perhaps some building
principals may encouraged their staff to participate more than other principals. It should
also be noted the number of faculty at each school varies and corresponds with the
variance in the total number of questionnaires completed at each school.
There were approximately 40 certified teachers per building with three to four
sections of each K-6 grade level. All K-6 regular classroom, art, music, physical
education, and special education teachers were encouraged to participate in the study.
Most respondents were female, which reflects the typical demographic of elementary
57

teachers as a whole. All respondents were asked to indicate their gender, ethnicity,
teaching area, years of teaching experience, years of teaching in their current building,
and highest degree completed.
Informed Consent
The study used a consent procedure to inform voluntary participants of the study.
Participants were informed of the purpose of the research, the time involved, assessment
of minimal risk and benefits to participants, contact for questions about the research, and
contact for questions about their rights as a research participant. This information was
addressed in a cover letter to all participants and was Internet based (see Appendix B).
Survey respondents were asked to indicate their consent prior to completing the survey.
Confidentiality
Every research participant in a study has a right to privacy and the expectation the
data was kept confidential at all times. The right to privacy and confidentiality was
disclosed to research participants prior to the start of a study. Research participants have
a right to expect respect for autonomy, trust, scientific integrity, and fidelity. Every
research participant has the right to expect there will be no chance of being identified by
name at any time, before, during, or after the study. No personally identifying
information or data was collected. Data was only reported in an aggregated format. Each
survey form was provided with a randomly selected identification number and a cover
letter explained privacy and ethical issues to participants as well as explaining their
participation is voluntary. Creswell (2003) suggested the fundamental role for ethical
research is to do no harm, including physical, psychological, social, economic, or legal
58

harm. At the competition of the study any paper data was shredded, encrypted, and kept
in a secure electronic format for a period of three years. Participants were also informed
they had the option not to complete the survey however, their participation would be
appreciated and make an addition to the study. All data will be stored for a period of three
years in a separate locked file in the researcher’s office. After a period of three years, the
data will be shredded in a crosscut shredder along with the electronic data compact disc.
Instruments
This study consisted of three separate instruments for respondents to complete:
the School Professional Staff as Learning Community Questionnaire (SPSLCQ) (Hord,
1997) the Teachers’ Sense of Efficacy Scale (TSES) Long Form (Tschannen-Moran &
Woolfolk Hoy, 2001) A demographic instrument was also used to collect educational and
personal information from each respondent. Each instrument is described and the
properties of the instrument articulated as follows.
SPSLCQ
The SPSLCQ (Hord, 1997) was selected to assess whether teachers consider their
school as having a positive learning environment and a supportive learning community.
Permission to use the instrument was obtained from the authors (Appendix D) The
SPSLCQ is purported to consist of consists of five dimensions of learning communities
as identified in research literature. The five dimensions include: 1) shared leadership; 2)
shared vision; 3) collective learning; 4) peer review; and 5) supportive
conditions/capacities. The SPSLC utilizes a 5 point Likert scale ranging from a low level
of agreement or alignment with the elements of a professional learning community (1) to
59

a high level of agreement or alignment with the elements of a professional learning
community (5).
The Southwest Educational Development Laboratory (SEDL) (1996) conducted a
pilot test on the SPSLC. However, there were only 28 participants in completing the
pilot test. SEDL asserts the sample represented the general school population including
students, teachers, and parents. SEDL reported it was important to determine the
reliability of an instrument and pointed out “there are two types of reliability: internal
consistency (e.g., Cronbach’s Alpha) and stability (test-retest)”. Results found the
Cronbach’s alpha reliability was α=.92, with .75 or higher generally viewed as an
appropriate level of internal consistency (SEDL). The test-retest reliability of the
instrument for the pilot test was α=.94 for the 15 matched respondents. While the pilot
test yielded promising results, a field test was recommended.
The Southwest Educational Development Laboratory (SEDL) field test of the
SPSLCQ sought to:
1. assess the reliability of the SPSLCQ
2. assess the validity of the SPSLCQ
3. draw conclusions about use of the SPSLCQ in educational improvement
efforts at the school level
Conclusions from the SPSLCQ field test indicated the usability, reliability, and validity
of the SPSLCQ appear to meet expectations. “Based on factor analysis results, it appears
that the 17-item instrument represents a unitary construct of a professional learning
community within schools.” (SEDL, n.d..)
60

TSES
The second instrument used in the study was Teachers’ Sense of Efficacy Scale
(TSES), Long Form (Tschannen-Moran & Woolfolk Hoy, 2001). Permission was
obtained from the authors to use the scale (Appendix E). The TSES consists of 24 items
purported to address 3 subscales or construct as follows: Efficacy of Student Engagement-
(7 items), 2) Efficacy in Instructional Strategies (8 items), and Efficacy in Classroom
Management (8 items). Tschannen-Moran & Woolfolk and Hoy asserted conducting
factor analysis was important and the factors or subscales were moderately correlated.
The TSES asked respondents to use a 9 point Likert type response scale of No Means of
Self Agency (1) to a “Great Deal” of Self-Efficacy (9) in the circumstances provided in
the stimulus questions.
It is well documented in the literature teacher efficacy research has been hindered
by both construct validity and measurement problems (Henson, 2001). As discussed
previously in this study, both locus of control theory (RAND,) and social cognitive
theory (Bandura, 1986) are foundational to the study of teacher efficacy and
instrumentation. While the Teacher Self-Efficacy Scale (TSES) (Gibson & Dembo, 1984)
was the dominant instrument in the study of teacher efficacy for many years, the
instrument was criticized for both factor and discriminant validity issues. Tschannen-
Moran and Woolfolk Hoy (2001) developed the TSES utilizing an unpublished teacher
efficacy instrument developed by Bandura to improve on the weaknesses of the TSES.
Tschannen-Moran& Woolfolk Hoy (2001) emphasized the importance of
conducting factor analysis on the TSES to ascertain how study participants would
61

respond to individual items. They maintained three moderately correlated factors have
been consistently found in the TSES but stated the scales can vary somewhat. The
subscales include: Student Engagement, Instructional Practices, and Classroom
Management. Subscale scores were computed using unweighted means (Tschannen-
Moran & Woolfork Hoy) and reliability coefficient alphas were reported to be α=.87,
α=.91 and α=.90 respectively for the subscales.
Demographic Form
Study participants were also asked to complete a demographic form to obtain
descriptive data to be used in the analysis and to describe study participants. Participants
were asked to identify their school, gender (male/female), and grade level/content area
(grades K-6, Art/Music/PE, and special education). Study participants were also asked
their ethnic group (Asian, Black, Hispanic, White, or Other) and total number of years as
a professional educator (less than 1 year, 1-3 years, 4-5 years, 6-10 years, 11-20 years,
21-30 years, and 31+ years). Educators also provided the total number of years of
working at their current school (less than 1 year, 1-3 years, 4-5 years, 6-10 years, 11-20
years, 21-30 years, and 31+ years) and their highest level of educational completion
(Bachelor, Masters, Master plus 30, Specialist, and PhD/EdD). This data was numerically
coded and used in further analysis.
Data Collection Procedures
After receiving approval from the school district and principals of the eight
participating schools, teachers opting to participate at each school site received an
electronic questionnaire packet including the three instruments described above, along
62

with the Informed Consent Form and Internet Information Statement (Appendix B). The
website, www.surveymonkey.com, was used to collect data for all teachers. The
electronic delivery method known as SurveyMonkey was employed. Arrangements were
made for teachers to access the website through the computers at their schools. Once
teachers access the link to the website and the survey, they were taken to the survey
content. All data was collected through the website and remained anonymous and
confidential at all times. After four weeks of data collections, the data was downloaded
into and Excel spreadsheet and uploaded to SPSS for analysis.
Validity and Reliability
In descriptive survey research where there is no treatment and control or
comparison group, it was still important to consider the validity and reliability of the
study. Study validity can be thought of as internal or external. External validity refers to
the genearalizabilty of the findings of a study or would the same result be found with
another group of participants, in another setting, or at another time. To what other
populations, settings, or measurement variables could the findings of the study be
generalized? Ary et al. (2007) identified three types of external validity: population,
ecological, and external validity of operations. Population external validity concerns
identifying other populations to which the findings of a study are generalizable.
Population validity addresses how the subjects were selected for a study. The study used
volunteers and this does present a problem. Volunteers may have special characteristics
not typical of the population and no one knows how or why non-volunteers would have
answered the items on the surveys or why they did not volunteer (Ary et al., 2002).
63

Ecological validity is concerned with the generalizing of the findings to other
situations. Before generalizing the findings, care needs to be taken to consider the
environment in which the research was done; threats to ecological validity (pretesting,
novelty effect of a new treatment, or attitudes developed over the course of the study) do
not present problems in the study. There is no pretesting, there is no treatment, and the
study is of short enough duration to not affect the attitudes and perceptions of the
participants. External validity of operations addressed how the study was conducted with
specific operational definitions. Would the same results be expected with different
investigators using different operational definitions or measurement procedures?
Campbell and Stanley (1963) distinguished between research designs in terms of
internal validity, defining internal validity as the extent to which extraneous variables are
controlled by the researcher. Extraneous variables are those variables that may affect the
outcomes of a study. The eight factors related to internal validity (history, maturation,
testing, instrumentation, statistical regression, differential selection, experimental
mortality, and selection maturation interaction) are concerning in the study. History
might present a problem, as there might be some occurrence within the organization or in
the world at large that might affect how study participants would answer the items on the
surveys included in the study. The occurrence of outside events (organizational or world)
is beyond the control of the researcher; however, any occurrence was noted in the study if
necessary. Maturation may not be a problem due to the short time line for the study and
the participants being adults whose developmental sequence is not as rapid as in young
children. Testing may not be a problem as there was no pretesting involved in the study.
64

Instrumentation might be a problem as the instruments selected for the study have not
been used extensively in prior research. However, they measure the constructs selected
for the study. Since there are no repeated measures, statistical regression to the mean does
not present a problem; however, differential selection could be problematic as the study
used volunteers and volunteer schools. Selection maturation interaction is also not a
problem as the study’s participants are all adult and not liable to change over the short
time period of the study. Experimental mortality or subjects dropping out of a study
might be a problem. There is a possibility a participant might start a survey but not
complete it or the response rate might be very low.
Data Analysis
The study was exploratory in nature and sought to determine whether a
relationship existed between teachers in professional learning communities and their self-
efficacy beliefs in the teaching role. Prior to addressing the research questions posed by
the study, it was necessary to describe the study participants using descriptive statistics
(frequency and percentages) and to assess the properties of the TSES and SPSLCQ. A
principal components factor analysis using a direct oblmin rotation and Cronbach alpha
were used to identify useful and meaningful subscales contained within the TSES and
SPSLCQ. The two instruments have been used in research previously but are fairly new
and were administered to a fairly large group in a unique setting. The group used in this
study may differ from previous study. Validity and reliability can be person and situation
specific (Ary et al., 2002). Ascertaining the psychometric properties of any instrument is
important in any research because of the differences in different study groups. Data will
65

also be checked to make ensure it meets the assumptions of the statistical tests proposed
for the study. Upon completing the factor and reliability analysis to identify viable,
useful, and meaningful subscales or factors, subscale scores were accomplished by
summing across the responses for each individual for the items in each subscale to create
subscale or factor scores.
Research Question 1
The first research question asked if there was a relationship between the subscales
of the TSES and the SPSLCQ. The question was as follows:
RQ1: Is there a relationship between the subscales of the TSES (Engage, and
Management) and the subscales of the SPSLCQ (Interaction, Sharing,
Improvement, Trust)?
The statistical procedure used to answer this question was a Pearson Product Moment
correlation. A correlation assesses the strength of a relationship between two variables
and can be positive or negative. A correlation coefficient can arrange from -1.00 to +1.00.
In a positive correlation, as one variable goes up the second variable goes up
correspondingly. In a negative correlation, as one variable goes up the second variable
goes down. A probability level of p=.05 or less will be used as a guiding criteria for
interpreting the correlations.
Research Question 2
The second question posed by the study asked whether the descriptive
demographic were predictors of the subscales of the TSES and SPSLCQ. The research
question is as follows:
66
RQ2: Do school location, gender, grade level/content area taught, total number
of years as a professional educator, total number of years working at current
school and education level predict subscales of the TSES (Engage and
Management) and the subscales of the SPSLCQ (Interaction, Sharing,
Improvement, and Trust)?
There are two groupings of advanced multivariate statistical techniques available
addressing differences between groups and those addressing and testing the existence of
predictable relationships between a set of variables. Simple linear regression and multiple
regressions serve to answer predictive types of questions. Simple linear regression or
simple regression involves a single independent variable (IV) and a single DV. The goal
of simple regression is to create a linear equation predicting the value of the DV if there
is a value for the IV. The idea behind simple regression is to obtain the best fitting line
through a series of points. The regression analysis is the means to develop the best fitting
line also called a regression line. In multiple regression a set of predictor variable are
selected (IVs) as potential predictors of a dependent variable as is the case in the study.
Multiple regressions are an extension of simple linear regression involving more than one
predictor variable. It is used to predict the value of a single DV from a weighted linear
combination of IVs.
One problem with multiple regressions may be the existence of multicollinearity.
Multicollinearity is a problem arising when there are moderate to high intercorrelations
between predictor variables. The problem lies with the possibility there may be two or
more variables that are measuring essentially the same information (Tabachnick & Fidell,
67
2007). Not only do you not gain much by adding variables to a regression analysis that
are measuring the same thing but multicollinearity can cause real problems with the
analysis itself. Stevens (1992) points out three reasons why multicollinearity can cause
problems. They include: (a) multicollinearity limits the size of the R since the IVs are
going after much the same variability in the DV; (b) multicollinearity can cause difficulty
because individual effects are confounded when there is overlapping information; and (c)
multicollinearity tends to increase the variances of the regression coefficients resulting in
unstable prediction equations. The simplest method of diagnosing multicollinearity is to
investigate high intercorrelations between the IV predictor variables. A second method is
to inspect the variance inflation factor (VIF) which is an indicator of the relationships
between predictors (Stevens, 1992). Stevens also notes VIF values greater than 10 are
generally cause for concern. The data for all regression analyses was checked to ensure
multicollinearity does not present a problem in the analysis. If multicollinearity does
exist, a variable may be deleted or variables may be combined to create a single
construct.
The data for the regression analysis was also checked to ensure compliance with
the assumptions of regression. The assumptions of regression include: (a) the independent
variables are fixed (the same values would be found if the study were replicated), (b) the
IVs are measured without error, (c) the relationship between the IVs and the DV is co-
linear, (d) the mean of the residuals for each observation on the DV is zero, (e) errors on
the DV are independent, (f) errors are not correlated with the IV, (g) variance across all
values of the IV is constant, and (h) errors are normally distributed (Mertler & Vannata,
68

2001). The assumptions were inspected through examination of residual scatter plots,
assessment of linearity, inspection of normality through skewness, kurtosis, and
Kolmogorov –Smirnov statistics, and inspection of the Box’s test for homosecdasticity
(Mertler & Vannata, 2001). Multiple regressions served as the statistical analysis for the
second research questions posed by the study and is appropriate for use in predictive
studies.
Summary
Chapter 3 included population, sampling, instrumentation, and design and data
analysis methods employed to answer both research questions. The research questions of
this study determined the analytic methods used in this solely quantitative study. Multiple
correlations and descriptive statistics were utilized to examine study results. Chapter 4
presents a summary of the findings of this study.
69
CHAPTER 4: PRESENTATION OF THE RESULTS
Overview
Chapter 4 presents the findings of the study. The purpose of the study was to
determine whether or not there was a relationship between the subscales of the TSES and
the subscales of the SPSLCQ. The study participants are described and the instruments
used in the study are presented. Factor and reliability analysis were conducted to add to
the validity and reliability of the instruments. The results of the analysis of the data to
address the questions posed by the study are presented and the chapter ends with a
summary. The research questions posed by the study are as follows:
RQ1: Is there a relationship between the subscales of the TSES (Engage,
and Management) and the subscales of the SPSLCQ (Interaction, Sharing,
Improvement and Trust)?
RQ2: Do school location, gender, grade level/content area taught, total
number of years as a professional educator, total number of years working at
current school and education level predict subscales of the TSES (Engage and
Management) and the subscales of the SPSLCQ (Interaction, Sharing,
Improvement, and Trust)?
It should be noted, not all of the study participants completed each item; however,
missing data was random and was subsequently treated as missing data and not included
in descriptive data or in further analyses.
70

Study Participants
A total of 163 teachers participated in the study by completing the survey
instruments. All of the participants were educators in one school district and represented
8 elementary schools within the district. Table 1 presents the distribution of study
participants across the 8 schools. The study participants consisted of males (n=7, 4.5%)
and females (n=148, 96.5%). The participants were predominately Caucasian (n=157,
98.1%) and also included African Americans (n=2, 1.3%) and Hispanics (n=1, .6%).
Participants were fairly evenly distributed across the grad/subject levels found in the
typically elementary school. However, there were more special education teachers (n=34,
21.3%) than in any particular grade level and fifth grade teachers constituted the largest
group of classroom teachers (n=19, 11.9%). Table 2 presents the distribution of educators
across grade/subject levels.
Table 1
Distribution of Participants Across Schools
School N %
1 14 8.6
2 19 11.7
3 21 13.0
4 16 9.9
5 29 17.9
6 22 13.6
7 18 11.1
8 23 14.2
71
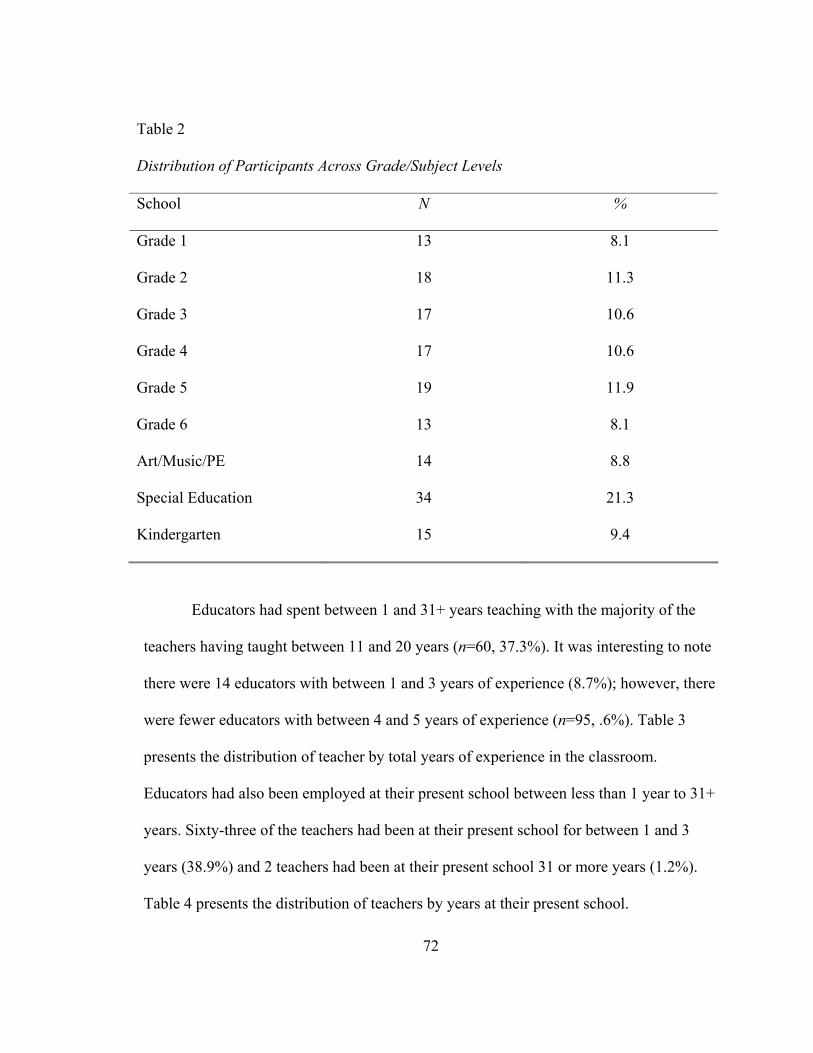
Table 2
Distribution of Participants Across Grade/Subject Levels
School N %
Grade 1 13 8.1
Grade 2 18 11.3
Grade 3 17 10.6
Grade 4 17 10.6
Grade 5 19 11.9
Grade 6 13 8.1
Art/Music/PE 14 8.8
Special Education 34 21.3
Kindergarten 15 9.4
Educators had spent between 1 and 31+ years teaching with the majority of the
teachers having taught between 11 and 20 years (n=60, 37.3%). It was interesting to note
there were 14 educators with between 1 and 3 years of experience (8.7%); however, there
were fewer educators with between 4 and 5 years of experience (n=95, .6%). Table 3
presents the distribution of teacher by total years of experience in the classroom.
Educators had also been employed at their present school between less than 1 year to 31+
years. Sixty-three of the teachers had been at their present school for between 1 and 3
years (38.9%) and 2 teachers had been at their present school 31 or more years (1.2%).
Table 4 presents the distribution of teachers by years at their present school.
72

Table 3
Distribution of Participants by Years as an Educator
N %
1-3 years 14 8.7
4-5 years 9 5.6
6-10 years 37 23.0
11-20 years 60 37.3
21-30 years 36 22.4
31+ years 5 3.1
Table 4
Distribution of Participants by Years at Current School
N %
Less than 1 year 1 .6
1-3 years 63 38.9
4-5 years 16 9.9
6-10 years 38 23.5
11-20 years 37 22.8
21-30 years 5 3.1
31+ years 2 1.2
73
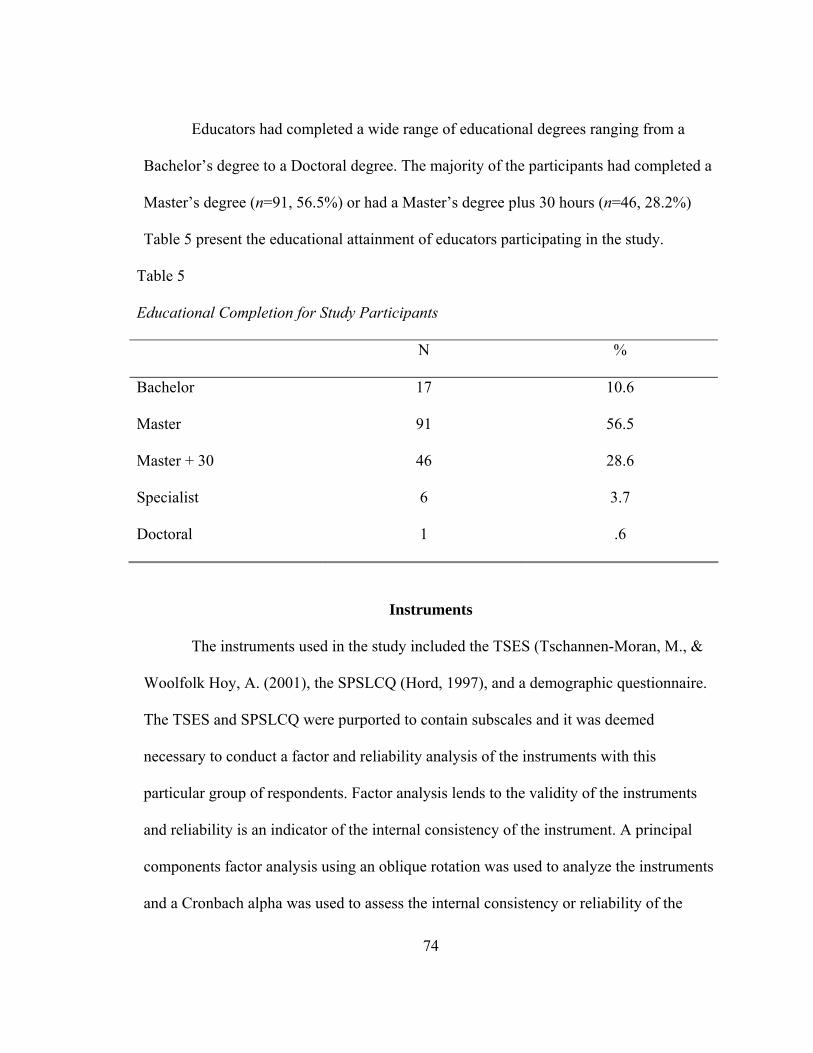
Educators had completed a wide range of educational degrees ranging from a
Bachelor’s degree to a Doctoral degree. The majority of the participants had completed a
Master’s degree (n=91, 56.5%) or had a Master’s degree plus 30 hours (n=46, 28.2%)
Table 5 present the educational attainment of educators participating in the study.
Table 5
Educational Completion for Study Participants
N %
Bachelor 17 10.6
Master 91 56.5
Master + 30 46 28.6
Specialist 6 3.7
Doctoral 1 .6
Instruments
The instruments used in the study included the TSES (Tschannen-Moran, M., &
Woolfolk Hoy, A. (2001), the SPSLCQ (Hord, 1997), and a demographic questionnaire.
The TSES and SPSLCQ were purported to contain subscales and it was deemed
necessary to conduct a factor and reliability analysis of the instruments with this
particular group of respondents. Factor analysis lends to the validity of the instruments
and reliability is an indicator of the internal consistency of the instrument. A principal
components factor analysis using an oblique rotation was used to analyze the instruments
and a Cronbach alpha was used to assess the internal consistency or reliability of the
74

instruments. The object of a factor analysis is to reduce the number of items or variables
to meaningful and useful subscales or factors. Viable subscales were identified and scores
were created by summing across all of the items in the subscale. The reliability analysis
indicated it was not necessary to reverse code any of the items as all of the items had
positive item to total correlations.
TSES
The TSES consists of 24 items utilizing a 9 point Likert type response scale of
Nothing (1) to A Great Deal (9). In exploratory factor analysis the goal is to describe and
summaries the data by grouping items measuring an underlying construct. The
oblique/direct oblimin rotation results in factors being correlated with each other. The
interpretation of the factors is based on the pattern matrix with each item loading on one
factor providing evidence of unique relationships with no overlap among factors
(Tabachnick & Fidell, 2007). The Kaiser-Meyer-Olin statistic indicated the data was
appropriate for factor analysis (KMO=,937) and the Bartlett’s test of sphericity was non-
significant (X2 (276) = 2175,.817, p=<.001). The analysis of the TSES indicated there
were 2 factors or subscales contained within the scale accounting for 59.34% of the
variance and providing useful and meaningful subscales to be used in further analysis.
The reliability for the total scale was α=.953. The first subscale consisted of 16 items
measuring the construct of how teachers engage and instruct students in the classroom
and was labeled Engage. The calculated Cronbach alpha for the Engaged subscale was
α=.933. The second subscale was consisted of 8 items and measured the construct of how
teacher manage their classrooms. The subscale was named Management and had a
75

calculated Cronbach alpha of α=.903. The component matrix indicate the correlation
between the two subscales was r=.655 or there was a moderate relationship between the
two factored subscales.
The factor analysis identified different subscales from the original pilot study;
however, the current study had a substantially larger group of participants than the pilot
study and all items loaded on one and only one subscale with factor loadings between
.430 and .849 well above an arbitrary cut off point of a factor loading of .30. It was not
necessary to remove any items from the analysis. It is interesting the factor analysis did
not identify a separation between student engagement and instructional strategies and
several iterations of the factor analysis were attempted to determine whether or not the
items would separate into instruction and engagement; however, separate viable
subscales were not identified and the two subscales identified were used in further
analysis. The reliability for the two subscales was also higher than other arrangements of
items. Table 6 presents the factor loadings for the TSES subscales and Table 7 presents
the descriptive data for the Engaged and Management subscales.
Table 6
Factor Loadings for TSES Subscales – Engage and Management
Item Engage Loading
Management Loading
Engage 2 How much can you do to help your students think critically? .849 -.157 23 How well can you implement alternative strategies in your classroom?
.843 -.093
12 How much can you do to foster student creativity? .772 -.064 11 To what extent can you craft good questions for your students? .770 .000 6 How much can you do to get students to believe they can do well in school work?
.766 -.066
76

22 How much can you assist families in helping their children do well in school?
.739 -.034
20 To what extent can you provide an alternative explanation or example when students are confused?
.660 .125
24 How well can you provide appropriate challenges for very capable students?
.648 .146
10 How much can you gauge student comprehension of what you have taught?
.644 .084
14 How much can you do to improve the understanding of a student who is failing?
.643 .188
7 How well can you respond to difficult questions from your students?
.638 .001
4 How much can you do to motivate students who show low interest in school?
.617 .105
9 How much can you do to help your students value learning? .587 .146 17 How much can you do to adjust your lessons to the proper level for individual students?
.492 .268
18 How much can you use a variety of assessment strategies? .464 .329 1 How much can you do to get through to the most difficult students?
.430 .254
Management 13 How much can you do to get children to follow classroom rules?
-.007 .773
3 How much can you do to control disruptive behavior in the classroom?
.041 .762
16 How well can you establish a classroom management system with each group students?
.150 .716
8 How well can you establish routines to keep activities running smoothly?
-.135 .701
15 How much can you do to calm a student who is disruptive or noisy
.179 .651
19 How well can you keep a few problem students form ruining an entire lesson?
.252 .611
5 To what extent can you make your expectations clear about student behavior?
.148 .577
21 How well can you respond to defiant students? .433 .457
77

Table 7
Measurement Properties of the TSES
No of
Items
Cronbach
Alpha
Mean SD Range
Engage 16 .933 122.11 12.77 82-144
Management 8 .903 63.55 6.36 40-72
SPSLCQ
The SPSLCQ consists of 17 items utilizing a 9 point Likert type response scale of
Rarely (1) to Regularly (9). The response scale was the same for all of the items but the
working was changed to match the content of the individual items. Exploratory factor
analysis was used to describe and summarize the data by grouping items measuring an
underlying construct. The oblique/direct oblimin rotation was used and results in factors
being correlated with each other. The interpretation of the factors is based on the pattern
matrix with each item loading on one factor providing evidence of unique relationships
with no overlap among factors (Tabachnick & Fidell, 2007). The Kaiser-Meyer-Olin
statistic indicated the data was appropriate for factor analysis (KMO=,830) and the
Bartlett’s test of sphericity was non-significant (X2 (136) = 1077.225, p=<.001).The
analysis of the SPSLCQ indicated there were 4 factors or subscales contained within the
SPSLCQ scale accounting for 61.21% of the variance and provided useful and
meaningful subscales to be used in further analysis. The reliability for the total scale was
78

α=.873. The first subscale consisted of 4 items measuring the construct of how staff
interact and communicate. The first subscale was named Interactions. The calculated
Cronbach alpha for the Interactions subscale was α=.669. The second subscale was
consisted of 4 items and measured the construct of how teacher share skills and
knowledge. The subscale was named Shared and had a calculated Cronbach alpha of
α=.774. The third subscale consisted of 5 items and measured improvement in vision and
learning. The subscale was named Improvement and had a calculated Cronbach alpha of
α=.780. The fourth subscale consisted of 4 items and addressed trust in the school. The
underlying construct was defined as the trust within the school including caring,
collaboration, and relationships. The fourth subscale was named Trust and had a calculate
Cronbach alpha of α=.727. The component matrix indicate the correlations between the 4
subscales ranged from r=-.364 to r=.219 indicating there were low negative and positive
relationships between the 4 subscales. The component correlation matrix for the 4
factored subscales can be found in Table 8.
Table 8
Component Correlation Matrix for SPSLCQ
Interaction Sharing Improvement Trust
Interaction 1.00
Sharing .210 1.00
Improvement -.114 -.364 1.00
Trust .160 .294 -.448 1.00
79
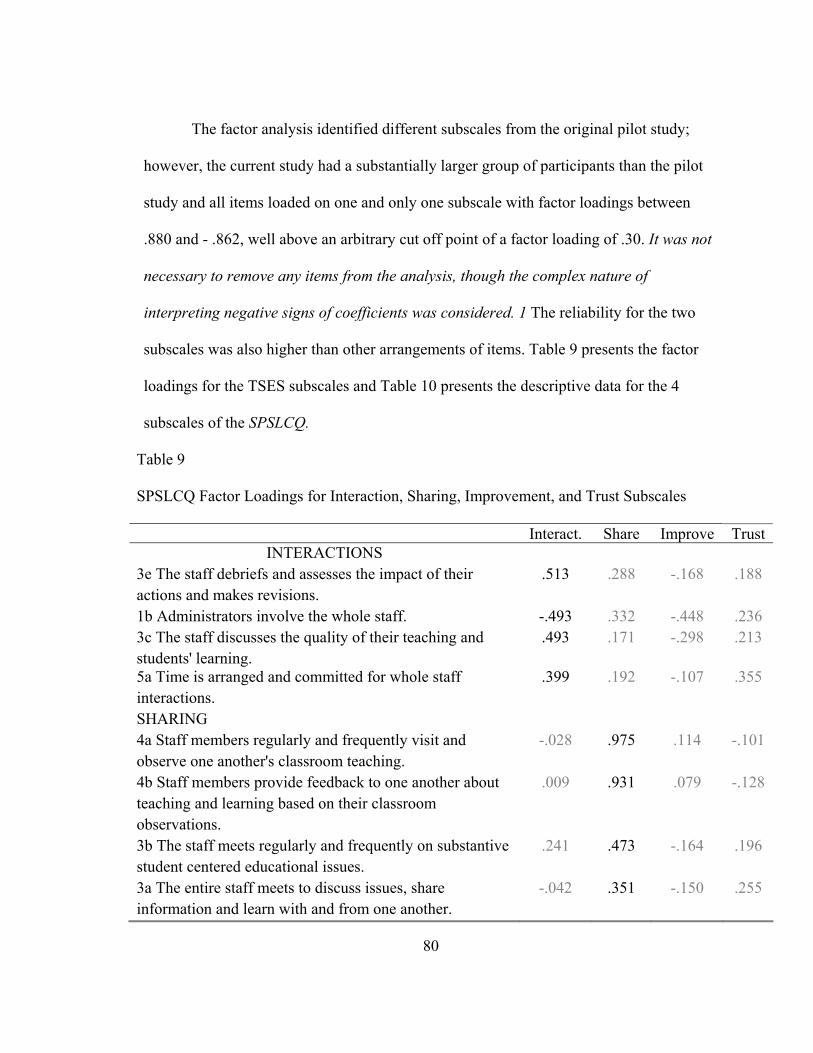
The factor analysis identified different subscales from the original pilot study;
however, the current study had a substantially larger group of participants than the pilot
study and all items loaded on one and only one subscale with factor loadings between
.880 and - .862, well above an arbitrary cut off point of a factor loading of .30. It was not
necessary to remove any items from the analysis, though the complex nature of
interpreting negative signs of coefficients was considered. 1 The reliability for the two
subscales was also higher than other arrangements of items. Table 9 presents the factor
loadings for the TSES subscales and Table 10 presents the descriptive data for the 4
subscales of the SPSLCQ.
Table 9 SPSLCQ Factor Loadings for Interaction, Sharing, Improvement, and Trust Subscales
Interact. Share Improve Trust INTERACTIONS
3e The staff debriefs and assesses the impact of their actions and makes revisions.
.513 .288 -.168 .188
1b Administrators involve the whole staff. -.493 .332 -.448 .236 3c The staff discusses the quality of their teaching and students' learning.
.493 .171 -.298 .213
5a Time is arranged and committed for whole staff interactions.
.399 .192 -.107 .355
SHARING 4a Staff members regularly and frequently visit and observe one another's classroom teaching.
-.028 .975 .114 -.101
4b Staff members provide feedback to one another about teaching and learning based on their classroom observations.
.009 .931 .079 -.128
3b The staff meets regularly and frequently on substantive student centered educational issues.
.241 .473 -.164 .196
3a The entire staff meets to discuss issues, share information and learn with and from one another.
-.042 .351 -.150 .255
80

IMPROVEMENT 2b Visions for improvement are always focused on students, teaching, and learning.
-.022 -.075 -.862 -.022
2a Visions for improvement are discussed by the entire staff such that consensus and a shared vision result.
-.031 -.001 -.862 -.096
2c Visions for improvement target high-quality learning experiences for all students
.168 .000 -.786 -.058
3d The staff, based on their learning, makes and implements plans that address students' needs, more effective teaching, and more successful student learning.
.461 .058 -.466 .111
1a Although there are some legal and fiscal decisions required of the principal, school administrators consistently involve the staff in discussing and making decisions about school issues.
-.403 .007 -.445 .428
TRUST 5e Caring, collaborative, and productive relationships exist among all staff members.
-.033 -.082 .087 .880
5d Trust and openness characterize all of the staff members.
-.154 -.013 .011 .868
5b The size, structure, and arrangements of the school facilitate staff proximity and interaction.
.180 -.022 .068 .665
5c A variety of processes and procedures are used to encourage staff communication.
.224 .072 -.084 .469
Table 10
Measurement Properties of the SPSLCQ
No of Items
Cronbach Alpha Mean SD Range
Interaction 4 .699 16.92 2.08 8.00-20.00
Sharing 4 .774 14.36 2.80 8.00-20.00
Improvement 5 .780 22.52 2.55 12.00-25.00
81

Trust 4 .727 16.95 2.36 8.00-20.00
Findings
Research Question 1
The first research question and null hypothesis posed by the study asked if there
was a relationship between the subscales of the TSES and the SPSLCQ. The research
question and hypothesis are as follows:
RQ1: Is there a relationship between the subscales of the TSES (Engage and
Management) and the subscales of the SPSPLCQ (Interaction, Sharing, Improvement,
and Trust)?
HO1: There will be no relationship between the subscales of the TSES (Engage
and Management) and the subscales of the SPSPLCQ (Interaction, Sharing,
Improvement, and Trust)?
A Pearson Product Moment correlation was used to test the hypothesis for the
strength of the relationships between the 6 subscales of the TSES and SPSLCQ. A
correlation is a measure of the strength of the relationship between two variables and can
be positive or negative. In a positive correlation as one variable goes up, the second
variable also increases. In a negative correlation as one variable increases, the other
variable decreases. Values for a Pearson correlation can range from –1.00 to +1.00 and
the closer the correlation coefficient is to 1.00, positive or negative the stronger the
relationship. While it is the strength of the relationship that is important rather than the
probability of obtaining that relationship, the probabilities are also reported. The Hopkins
82

scaling of correlation coefficients was used as method for interpreting the calculated
correlation coefficients. The Hopkins scaling can be found in Table 11.
Table 11
Hopkins Scaling of Correlation Coefficients (2001)
Correlation Coefficient Descriptor
0.0 - 0.1 trivial, very small insubstantial tiny, practically zero
0.1 - 0.3 small, low, minor
0.3 - 0.5 moderate, medium
0.5 - 0.7 large, high, major
0.7 - 0.9 very large, very high, huge
0.9 - 1.0 near, practically, or almost perfect, distinct, infinite
The findings of the correlation analysis indicated there were statistically
significant; however, many of the relationships between the subscales were small or
moderate. There was a large relationship between the Management and Engage subscales
of the TSES, r=.748. The relationship between the Management and Engage subscales
and the Interaction, Sharing, Improvement, Trust was small or moderate. The correlations
between the subscales of the SPSLCQ were moderate to small. All of the relationships
were positive indicating as one variable went up the second variable went up
correspondingly. The correlation coefficients can be found in Table 12.
83

Table 12 Pearson Correlation Coefficients for TSES and SPSLCQ Subscales Manage Engage Interaction Sharing Improve Trust Management 1.00 Engage r=.748
p=<.001 1.00
Interaction r=.269 p=.001
r=.368 p=<.001
1.00
Sharing r=.042 p=.596
r=.227 p=.004
r=.587 p=<.001
1.00
Improvement r=.276 p=<.001
r=.308 p=<.001
r=.669 p=<.001
r=.385 p=<.001
1.00
Trust r=.252 p-.001
r=.263 p=.001
r=.695 p=<.001
r=.423 p=<.001
r=.516 p=<.001
1.00
Research Question 2
The second research question and null hypothesis posed by the study was as
follows:
RQ2: Do school location, gender, grade level/content area taught, total number
of years as a professional educator, total number of years working at current school and
education level predict subscales of the TSES (Engage and Management) and the
subscales of the SPSLCQ (Interaction, Sharing, Improvement, and Trust)?
HO2: School location, gender, grade level/content area taught, total number of
years as a professional educator, total number of years working at current school and
education level will not be predictors of the subscales of the TSES (Engage and
Management) and the subscales of the SPSLCQ (Interaction, Sharing, Improvement, and
Trust)?
84

A multiple linear regression was used to test this. The dependent variable was the
TSES subscales (Engage and Management). A separate regression was completed for
each dependent variable. The predictor variables were school, gender, grade level/content
area taught, total number of years as a professional educator, total number of years
working at current school and education level. Prior to completing each regression, it was
necessary to dummy code some of the variables. Dummy variables take the place of the
original categorical variables in the analysis and coded as k-1 where k is the number of
levels of the original variable. Gender was dummy coded as female=1 and male=0.
School was also dummy coded into 7 groups (8 schools-1). Grade level was also dummy
coded into 8 dummy variables (9 types of classroom teacher –1). Other descriptive
variables (years in school, years as an educator, and educational level were not dummy
coded for this analysis. A probability level of p=.05 was used as the criteria for
evaluating each regression. The data was assessed to ensure it met the assumptions of
regression and was found to be satisfactory.
Regression is a statistical technique that allows a researcher to predict an
individual’s score on one variable based on his or her score on one or more additional
variables. A multiple linear regression using Management as the dependent variable and
school, grade level/content area taught, total number of years as a professional educator,
total number of years working at current school, education level, Interaction, Sharing,
Improvement, and Trust as the independent or predictor variables was conducted. The
regression model accounted for 16.5% of the variance, R= .406, R2=.165, R2adj=.077, F
(15, 142) = 1.869, p=.031. Sharing and Trust approached being statistically significant
85
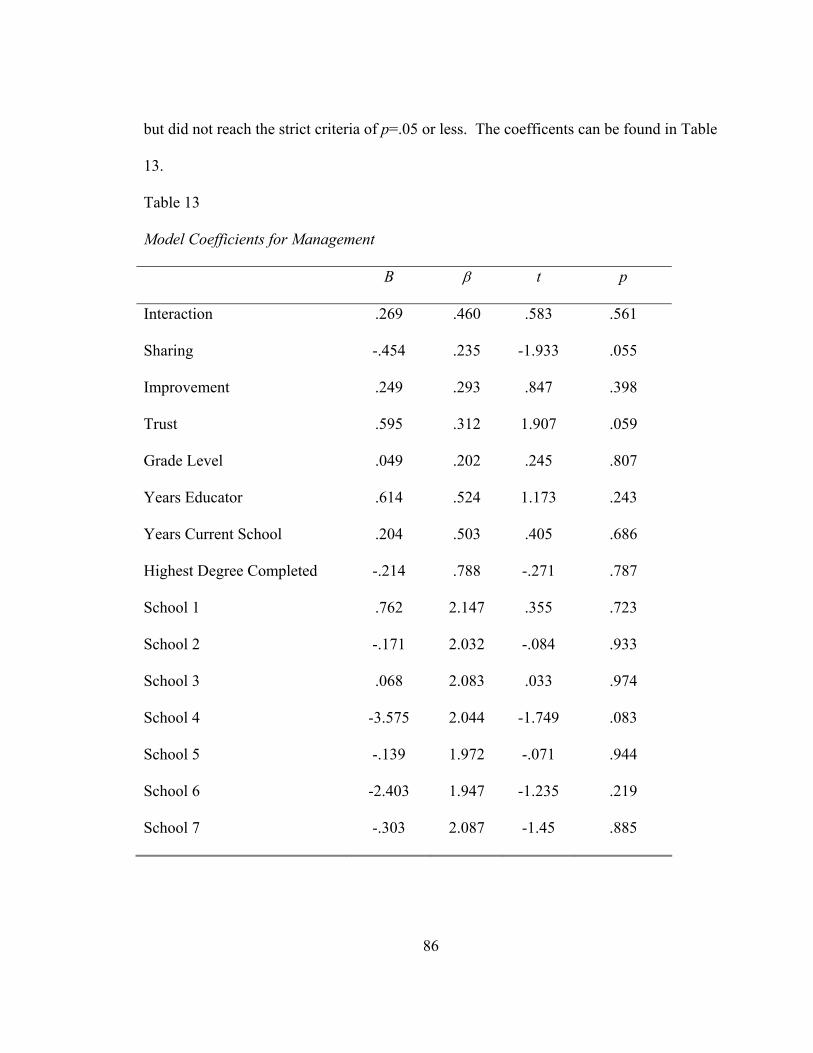
but did not reach the strict criteria of p=.05 or less. The coefficents can be found in Table
13.
Table 13
Model Coefficients for Management
B β t p
Interaction .269 .460 .583 .561
Sharing -.454 .235 -1.933 .055
Improvement .249 .293 .847 .398
Trust .595 .312 1.907 .059
Grade Level .049 .202 .245 .807
Years Educator .614 .524 1.173 .243
Years Current School .204 .503 .405 .686
Highest Degree Completed -.214 .788 -.271 .787
School 1 .762 2.147 .355 .723
School 2 -.171 2.032 -.084 .933
School 3 .068 2.083 .033 .974
School 4 -3.575 2.044 -1.749 .083
School 5 -.139 1.972 -.071 .944
School 6 -2.403 1.947 -1.235 .219
School 7 -.303 2.087 -1.45 .885
86
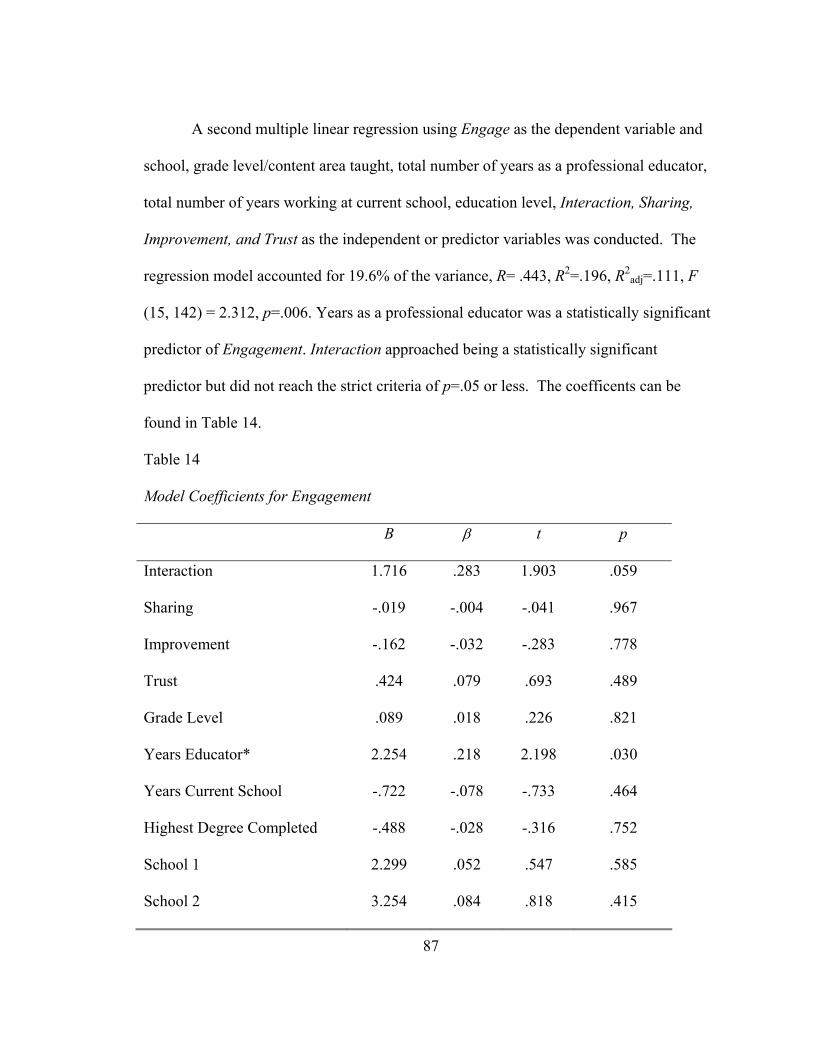
A second multiple linear regression using Engage as the dependent variable and
school, grade level/content area taught, total number of years as a professional educator,
total number of years working at current school, education level, Interaction, Sharing,
Improvement, and Trust as the independent or predictor variables was conducted. The
regression model accounted for 19.6% of the variance, R= .443, R2=.196, R2adj=.111, F
(15, 142) = 2.312, p=.006. Years as a professional educator was a statistically significant
predictor of Engagement. Interaction approached being a statistically significant
predictor but did not reach the strict criteria of p=.05 or less. The coefficents can be
found in Table 14.
Table 14
Model Coefficients for Engagement
B β t p
Interaction 1.716 .283 1.903 .059
Sharing -.019 -.004 -.041 .967
Improvement -.162 -.032 -.283 .778
Trust .424 .079 .693 .489
Grade Level .089 .018 .226 .821
Years Educator* 2.254 .218 2.198 .030
Years Current School -.722 -.078 -.733 .464
Highest Degree Completed -.488 -.028 -.316 .752
School 1 2.299 .052 .547 .585
School 2 3.254 .084 .818 .415
87
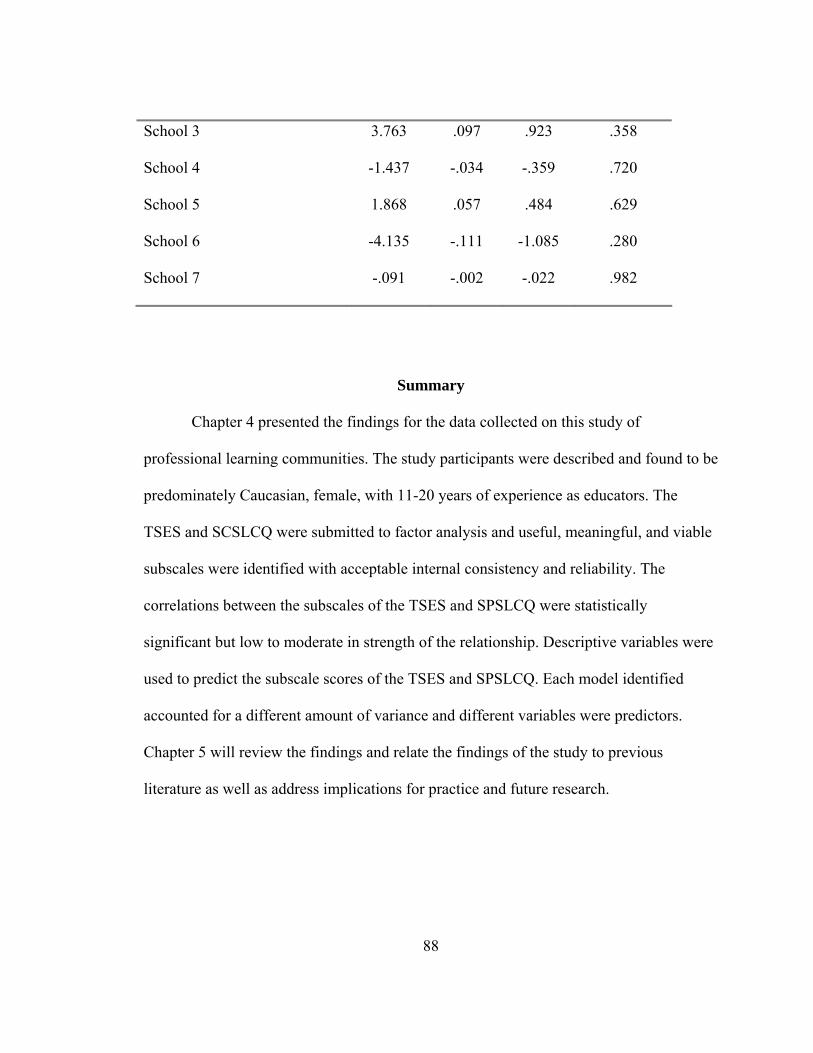
School 3 3.763 .097 .923 .358
School 4 -1.437 -.034 -.359 .720
School 5 1.868 .057 .484 .629
School 6 -4.135 -.111 -1.085 .280
School 7 -.091 -.002 -.022 .982
Summary
Chapter 4 presented the findings for the data collected on this study of
professional learning communities. The study participants were described and found to be
predominately Caucasian, female, with 11-20 years of experience as educators. The
TSES and SCSLCQ were submitted to factor analysis and useful, meaningful, and viable
subscales were identified with acceptable internal consistency and reliability. The
correlations between the subscales of the TSES and SPSLCQ were statistically
significant but low to moderate in strength of the relationship. Descriptive variables were
used to predict the subscale scores of the TSES and SPSLCQ. Each model identified
accounted for a different amount of variance and different variables were predictors.
Chapter 5 will review the findings and relate the findings of the study to previous
literature as well as address implications for practice and future research.
88
CHAPTER 5: DISCUSSION, CONCLUSIONS, IMPLICATIONS, AND RECOMMENDATIONS
Overview
This chapter contains information about the major findings of the study, including
a discussion of possible explanations for such findings, overall implications of the study,
limitations of the study, and ideas for future research.
Factor Analysis
Factor and reliability analysis were conducted to enhance the reliability and
validity of the instruments. Both the TSES (Tschannen-Moran & Woolfolk Hoy, 2001))
and SPSPLCQ (Hord, 1997) have been tested previously and were purported to consist of
several subscales. However, reliability and validity are person and situation specific.
What may be valid and reliable for one group may not be valid and reliable for another
and it was deemed necessary to assure the instruments were used appropriately for this
unique group of educators (Thorndike & Thorndike-Christ, 2009). It is important to
assess the validity and reliability of any instrument with the unique group of individuals
participating in the study. It is possible the previous studies had been conducted using
similar but different individuals than the participants of this study. Factor and reliability
analysis did find the items in the TSES and SPSPLCQ were different but from the
subscale previously proposed. The subscales identified from this analysis provided useful
and meaningful information on the educators participating in the study and were used in
further analysis.
The analysis of the TSES identified 2 factors or subscales within the scale
accounted for 59.34% of the variance and assisted in meaningful analysis. Reliability for
89
the total scaled was found to be α =.953. The first subscale consisted of 16 items and
was labeled Engage. The second subscale consisted of 8 items and was labeled
Management. The component matrix indicated the correlation between the two subscales
was r=.655; a moderate relationship between the two subscales. It was not necessary to
reverse code any of the items and it was not necessary to remove any items due to low
factor loading. The item arrangement makes sense and may be a viable and reliable
alternative to previously reported subscales of the TSES.
Factor analysis of the SPSLCQ identified 4 factors or subscales within the scale
accounting for 61.21% of the variance and assisted in improved analysis. Reliability for
the total scaled was found to be α=.873. It was interesting the factor analysis of the
SPSLCQ also identified different subscales than those previously proposed. The first
subscale consisted of 4 items and was labeled Interactions. The second subscale
consisted of 4 items and was labeled Shared. The third subscale consisted of 5 items and
was named Improvement, while the fourth subscale consisted of 4 items and was named
Trust. The component matrix indicated the correlation between the 4 subscales ranged
from r=-.364 to r=-.219, resulting in low negative and positive relationships among the
four factored subscales. The current study had a considerably larger number of
respondents and study participants may be intrinsically different, have different working
conditions, and different perceptions than participants in the pilot study. It was not
necessary to reverse code any of the items and all items loaded on one and only one
subscale.
90

The factors or subscale identified through the factor analysis for the TSES and
the SPSLCQ differed from what had originally been proposed adding credence to
checking the subscales and reliability whenever an instrument is used. Measurement is an
inexact science and the properties of any instrument can change depending upon the
individuals taking an assessment or survey of any kind. The subscales identified through
this process of factor and reliability analysis proved to be useful and meaningful and may
prove to be viable when the TSES and SPSPLCQ are used again in future research
Correlation Analyses
The first research questions asked “Is there a relationship between the subscales
of the TSES (Engage and Management) and the subscales of the SPSLCQ (Interactions,
Sharing, Improvement, and Trust)?”. A Pearson Product Moment correlation was used to
test the strength of the relationships between the 6 subscales of the instruments. This
parametric test was appropriate to use because it is a robust test. The results of the
correlation analysis were found to be statistically significant, though small or moderate in
strength.
The largest relationship was determined to be between the Management and
Engage subscales. While an exact causal relationship is not established through
correlation analysis, social cognitive theory asserts that the way individuals feel about
their abilities can affect their view of student performance such as student engagement.
Perhaps the larger correlation between the Management and Engage in the Pearson
Product Moment correlation can be explained in that teachers who perceive their students
to be engaged, also perceive they are so engaged as a result of their student management
91
skills. Previous research has shown that teacher efficacy is related to teacher confidence
about their performance of certain specific teaching skills (Ashton, 1984). Tschannen-
Moran, Woolfolk Hoy, and Hoy (1998) define teacher efficacy as “the teacher’s belief in
his or her capacity to organize and execute courses of action required to successfully
accomplish a specific teaching task in a particular context” (p. 233).
The second question asked “Do school location, gender, grade level/content area
taught, total number of years working at current school and education level predict
subscales of the TSES (Engage and Management) and the subscales of the SPSLCQ
(Interaction, Sharing, Improvement, and Trust)?”. Multiple linear regression was used to
test the null hypothesis. A separate regression was run for each dependent variable. A
probability level of .05 was used to determine rejection or acceptance of the null
hypothesis for the individual regressions.
Two multiple linear regressions were run to evaluate the correlation between
teachers’ perceptions of efficacy and professional learning community. The first multiple
linear regression used Management as the dependent variable and school, grade
level/content area taught, total number of years as a professional educator, total number
of years working at current school, education level, Interaction, Sharing, Improvement,
and Trust as the independent or predictor variables. Sharing (p=.055) and Trust (p=.059)
approached being statistically significant but did not reach the strict criteria of p=.05 or
less. While strict criteria of p=.05 for statistical significance was not met, the correlations
are suggestive, given the exploratory nature of this study and the number of respondents.
The findings point toward a positive association between the efficacy of teacher
92
respondents and the level and their perceptions of trust sharing and trust among fellow
teachers. This lends credence to the importance of teacher collaboration in professional
learning community.
The second multiple linear regression used Engagement as the dependent variable
and school, grade level/content area taught, total number of years as a professional
educator, total number of years working at current school, education level, Interaction,
Sharing, Improvement, and Trust as the independent or predictor variables. An interesting
caveat of the Engagement regression is that only years as a professional educator
(p=.030) was a statistically significant predictor of Engagement. Interaction (p=.059)
approached being a statistically significant predictor but did not reach the strict criteria of
p=.05 or less. The findings of this regression suggest that teacher participants in this
study perceive that there is a positive relationship between their level of efficacy
regarding student engagement and the degree and nature of interactions in their school.
This finding again seems to support the elements of professional learning community.
However, the most interesting finding of the Engagement regression is that teachers’
number of years as an educator showed statistical significance at p=.030. It is a frequent
perception that teachers who have been in the profession the longest are more cynical
about student engagement and student behaviors. This belief is not supported by the
results obtained with group of respondents. Among these teachers, the most experienced
apparently have high levels of self efficacy regarding student engagement.
93
Discussion and Implications of the Study
The concluding sections of Chapter 5 are an effort to relate results, conclusions,
implications, and to suggest topics for related future research.
Overall findings are disappointing but not surprising. Though it was hoped a
stronger, positive relationships might be found it is likely the size of the sample of the
study impacted the findings. Note too the variability in response rates whereby
respondents failed to answer one or more of the items in one or both instruments.
Another possible explanation why the relationships were not stronger could be the
considerable difference in the size of the response scales for the respective instrument.
The TSES used a 1-5 Likert-like scale. It is likely this helped respondents better
differentiate between their answers unlike the SPSLC scale. This instrument used a 1-9
point Likert-like scale. Measurement construction holds that the number or possible
response items should be dictated by the clarity the scales adds to differentiating from
one response item to another. It could be that respondents were not able to confidently
select the “best” answer because there were too many options. Additionally, items 2,4,6
and 8 provided no adjective or descriptor upon which to base an answer. Such an open-
ended scale may have caused some subjective interpretations which in the end caused
confusion, lack of confidence in the answers, frustration in not having clear guidance
when answering.
The review of related literature suggests that schools organized as learning
communities, rather than bureaucracies, are more apt to exhibit academic success. The
implementation of PLCs have implications not only for student learning, but also for
94

staff. Hord (1997) summarizes her research findings related to positive staff outcomes
when schools organize themselves as learning communities. For staff, the positive
implications include:
• reduction of isolation of teachers
• increased commitment to the mission and goals of the school and
increased vigor in working to strengthen the mission
• shared responsibility for the total development of students and collective
responsibility for students’ success
• powerful learning that defines good teaching and classroom practice, that
creates new knowledge and beliefs about teaching and learners
• increased meaning and understanding of the content that teachers teach
and the roles that they play in helping all students achieve expectations
• higher likelihood that teachers will be well informed
• more satisfaction and higher morale, and lower rates of absenteeism
• Significant advances into making teaching adaptations for students, and
changes for learners made more quickly than in traditional schools
• Commitment to making significant and lasting changes
• Higher likelihood of undertaking fundamental, systematic change (pp. 33-
34)
As seen through Hord’s research, teachers can benefit in many ways from being part of a
learning community. As Hord points out, teachers who participate in a learning
community demonstrate higher morale and job satisfaction. Hord’s work links with
95

Bandura’s theories of teacher self-efficacy. Bandura (1997) contended that “The task of
creating learning environments conducive to development of cognitive competencies
rests heavily on the talents and self-efficacy of teachers” (p. 240). Bandura (1997)
suggested that teacher’s beliefs in their own abilities has a definite impact on their ability
to cope with their teaching role.
The researcher had hoped that the study findings would indicate a clear, positive
correlation between teacher self-efficacy beliefs and teacher beliefs about professional
learning community implementation at their school site. While the results may be
somewhat disappointing, there may be a number of factors that impacted the findings, yet
were not part of the research design. One factor could have been the type and quality of
the professional development culture within each school building. Though unknown,
different buildings may have instituted PLC supports differently, or operationalized those
communities differently, thus accounting for some differences in answers.
In addition, the style, strengths, and weaknesses of building leadership may
impact the way teachers view their own capabilities and their power to influence school
matters. Certainly, all teachers bring with them a myriad of lifelong personal experiences
and attitudes that undoubtedly influence their teaching efficacy as well. Again, no
responses were analyzed to determine differences between specific groups, i.e., years of
teaching, grade level, etc.
In summary, though this study did not find strong, positive correlations between
the TSES and SPSPLC, the small, positive correlations found along with the literature
and other recent studies seem to indicate the value of professional learning communities
96

as a positive school reform model. PLCs, coupled with intentional development of
positive teacher efficacy, shows promise as a way to meet the needs of today’s learners
and the amped up level of accountability that all educators feel today.
Limitations of the Study
There are several limitations to the study, beyond the disappointing findings. The
over representation of females to males is not surprising given the population frame,
elementary school teachers. However, it would have been interesting to determine if an
adequate sample size of males respondents might answer questions differently, so too
with the over representation of caucasian respondents. Again, the sample frame, schools
in the suburban Midwest, are likely to have an under representation of teachers of color.
Thus their particular take on learning communities was not ascertained as would have
been ideal.
A larger response rate would have been much preferred. The original goal of
survey participation of all 18 district elementary schools was not met for a variety of
reasons. Data analysis from the larger sample would have been helpful in determining
meaningful trends and beliefs among teachers. One could speculate that attitudes and
efficacy beliefs of the building administrators in each of the 8 participating buildings may
have had some immeasurable impact on teacher responses from each particular building.
Perhaps the schools that elected to participate generally have a higher level of PLC
implementation as a result of phased-in implementation of the model. A related factor
might be that having a relatively small set of respondents, and then losing respondents
through their failure to answer items, may have impacted results. If there had been a
97
larger response rate it would have allowed for the examination of a research area
addressed by the authors of the TSES. The authors of the TSES looked at responses from
beginning teachers. A large response rate having nearly equal respondents across the
levels of academic training might have proven worthwhile. The inability to disaggregate
between respondent’s level of education may have caused a loss of important data.
As referenced above, the potential lack of precision in the SPSLC from the 9-
point Likert scale exists. Though not done in this study, the scale could have been
statistically reduced to a smaller number of items or the instrument could have been
modified from the beginning and respondents offered a smaller number of items from
which to choose.
Future Research
The subsequent recommendations for future research are based on the results and
limitations of this study. In a related study, a researcher could modify the School
Professional Staff as Learning Community questionnaire and offer respondents fewer
response items, present this alternate form to a group of teachers, and then a short time
later administer the long form to the same group of teachers. The researcher could then
compare the results from the long form and the sort forms of the SPSLC to determine if
the responses differed significantly from each other.
In order to determine whether teaching experience impacted one’s sense of self-
efficacy as a teacher, the Teachers’ Sense of Efficacy Scale questionnaire could be
administered to first year teachers at the beginning of the school year and then at the end
of the school year to see what growth, if any occurred. This study could be further
98

refined by working with schools who have PLC in place and those that do not, if any
exist.
Another recommendation would be to devise a correlational study that seeks to
discover whether students in higher teacher self-efficacy schools show higher levels of
student achievement. Bandura (1997) states that in efficacious schools “teachers maintain
a resilient sense of instructional efficacy and accept a fair share of responsibility for their
students’ academic progress” (p. 242). Deeper analysis in the area of teacher efficacy and
student achievement could prove to be a fruitful endeavor.
Concluding Thoughts
In this time of high-stakes testing and high standards for students, teacher efficacy
as a paradigm has the potential to make the difference for students. Teachers who believe
they can meet the needs of all students are more apt to persevere and demonstrate the
effort and teaching behaviors necessary to succeed. Research has shown that teachers
who work in schools that are organized as professional learning communities can feel a
reduced sense of isolation, increased support, higher morale, and other characteristics that
potentially have a positive impact on the learning environment. In closing, the words of
Peter Senge seem appropriate:
“People with high levels of personal mastery...cannot afford to choose between reason and intuition, or head and heart, any more than they would choose to walk on one leg or see with one eye." (Senge, 1990, p. ) In his own way, it seems that Senge may have been trying to convey one of today’s
common themes….do whatever it takes! These are certainly words for all educators to
live by in these tough educational times.
99

REFERENCES
Ary, D., Jacobs, L., & Razavieh, A. (2002). Introduction to research in education. Belmont, CA: Wadsworth Publishing.
Ashton, P. (1984). Teaching efficacy. Journal of Teacher Education, 25(2), 41-54. Bandura, A. (1977). Self-Efficacy: Toward a unifying theory of behavioral change.
Psychological Review, 84, 191-215. Bandura, A. (1986). Social foundations of thought and action: A social cognitive
theory. Englewood Cliffs, NJ: Prentice Hall. Bandura, A. (1997). Self-efficacy: The exercise of control. New York, NY: Freeman. Brinson, D., & Steiner, L. (2007). Public impact. [Issue brief]. Retrieved from the
Center for Comprehensive School Reform and Improvement website at http://www.centerforcsri.org
Collins, J. (2001). Good to great: Why some companies make the leap and others don’t.
New York, NY: Harper Business. Creswell, J. W. (2003). Research design qualitative, quantitative, and mixed methods
approaches (2nd ed.). Thousand Oaks, CA: Sage Publications. Darling-Hammond, L. (1996). The quiet revolution: Rethinking teacher development.
Educational Leadership, 53(6), 4-10. Dembo, M. H., & Gibson, S. (1985). Teachers’ sense of efficacy: An important factor in
school improvement. Elementary School Journal, 86, 173-184. Dillman, D.A. (2007). Mail and internet surveys: The tailored design method (2nd ed.).
Hoboken, NJ: John Wiley & Sons. Doerr, H. (2009). PLCs. Principal, 89(1), 26-30. DuFour R. (2004). What is a “Professional learning community”? Educational
Leadership, 61(8), 6-11.
100

DuFour, R., DuFour, R., & Eaker, R. (2008). Revisiting professional learning communities at work: New insights for improving schools. Bloomington, IN: Solution Tree Press.
DuFour, R., DuFour, R., Eaker, R., & Karhanek, G. (2004). Whatever it takes: How
professional learning communities respond when kids don’t learn. Bloomington, IN: National Educational Service.
DuFour, R., & Eaker, R. (1992). Creating the new American school: A principal's guide
to school improvement. Bloomington, IN: Solution Tree. DuFour, R., & Eaker, R. (1998). Professional learning communities at work: Best
practices for enhancing student achievement. Bloomington, IN: National Educational Service.
DuFour, R., Eaker, R., & DuFour, R. (2005). On common ground. Bloomington, IN:
Solution Tree. Elmore, R. (1996). In E. Miller, Idealists and cynics: The micropolitics of systematic
school reform. Harvard Education Letter, 12(4), 1. Finn, C. (2002). Making school reform work. The Public Interest, 148, 85-95. Finn, C. E., & Hess, F. M. (2004). On leaving no child behind. The Public Interest, 157,
35-56. Fullan, M. (1997). What’s worth fighting for in the principalship? New York, NY:
Teachers College Press. Fullan, M. (2007). The new meaning of educational change (4th ed.). New York, NY:
Teachers College Press. Gibson, S. (2004). Social learning (cognitive) theory and implications for human resource
development. Advances in Developing Human Resources, 6(2), 193-210. Good, T. L., & Braden, J. S. (2000). The great school debate: Choice, vouchers, and
charters. Mahwah, NJ: Erlbaum. Guskey, T. R., & Passaro, P. D. (1994). Teacher efficacy: A study of construct
dimensions. American Educational Research Journal, 31, 627-643. Helsing, D., Howell, A., Kegan, R., & Lahey, L. (2008). Putting the "development" in
professional development. Harvard Educational Review, 78, 437-465. 101

Henson, R. K. (2001, November). Teacher self-efficacy: Substantive implications and
measurement dilemmas. Paper presented at the Annual Meeting of the Educational Research Exchange, College Station, TX.
Hopkins, W. (2009). Scale of magnitude for effect statistics, Retrieved January 23, 2010,
from http://www.sportsci.org/resource/stats/effectmag.html Hord, S. M. (1996). School professional staff as learning community [Questionnaire].
Austin, TX: Southwest Educational Development Laboratory. Hord, S. (1997). Professional learning communities: Communities of continuous inquiry
and improvement. Austin, TX: Southwest Educational Development Laboratory. Hoy, A. W. (2000, April). Changes in teacher efficacy during the early years of
teaching. Paper presented at the Annual Meeting of the American Educational Research Association, New Orleans, LA.
Hoy, W., Hoy, A., & Tschannen-Moran, M. (1998). Teacher efficacy: Its meaning and
measure. Review of Educational Research, 68, 202-248. Hunt, J. W. (2008). A nation at risk and no child left behind: Déjà vu for administrators?
Phi Delta Kappan, 89, 580-585. Hunt, T. C. (2005). Educational reforms: Lessons from history. Phi Delta Kappan, 87(1),
84-89. Jerald, C. D. (2007). Believing and achieving (Issue Brief). Washington, DC: Center for
Comprehensive School Reform and Improvement. Johnson, S. M. (1996). Leading to change: The challenge of the new superintendency.
San Francisco, CA: Jossey-Bass. Koehler, J. R. (2006, June). The measurement of teacher efficacy. Presentation at the
2006 Harvard Graduate School of Education Student Research Conference and International Forum, Cambridge, MA.
Kohm, B., & Nance, B. (2009). Creating collaborative cultures. Educational
Leadership, 67(2), 67-72.
102

Learning Point Associates. (2009). What does the literature and emerging research tell us about the benefits of PLCs? Retrieved from http://www.centerforcsri.org/plc /literature.html
Mertler, C., & Vannatta, R. (2001). Advanced and multivariate statistical methods. Los
Angeles: Pyrczak, Publishing. National Commission on Excellence in Education. (1983, April). A nation at risk: The
imperatives for educational reform. Washington, DC: U.S. Department of Education.
Nelson, J. L., Palonsky, S. B., & Carlson, K. (2000). Critical issues in education:
Dialogues and dialectics (4th ed.). Boston, MA: McGraw Hill. Newmann, F., & Wehlage, G. (1995). Successful school restructuring: A report to the
public and educators by the center for restructuring schools. Madison, WI: University of Wisconsin Press.
Pajares, F. (2002). Overview of social cognitive theory and of self-efficacy.
Retrieved March 27, 2010, from http://www.emory.edu/EDUCATION/mfp/eff.html
Pajares, F. (2004). Albert Bandura: Biographical sketch. Retrieved March 27,
2010, from http://des.emory.edu/mfp/bandurabio.html Protheroe, N. (2008). Teacher efficacy: What is it and does it matter? Principal, 87(5),
42-45. Purkey, S., & Smith, M. (1982). Too soon to cheer? Synthesis of research on effective
schools. Educational Leadership, 41(3), 64-69. Ravitch, D. (2008). A nation still at risk. Hoover Digest, 4, 66-70. Reese, W. (2000). Public school reform in America. Bloomington, IN: Phi Delta Kappa
Educational Foundation. Roberts, S. M., & Pruitt, E. Z. (2003). Schools as professional learning communities:
Collaborative activities and strategies for professional development. Thousand Oaks, CA: Corwin Press.
Rozenholtz, S. (1989). Teacher’s workplace: The social organization of schools. New
York, NY: Longman.
103

Saphier, J., & King, M. (1985). Good seeds grow in strong cultures. Educational Leadership, 42(6), 67-74.
Schmoker, M. (2004). Tipping point: From feckless reform to substantive instructional
improvement. Phi Delta Kappan, 85, 424-432. Schneider, B. L., & Keesler, V. A. (2007). School reform 2007: Transforming education
into a scientific enterprise. Annual Review of Sociology, 33, 197-217. Retrieved from arjournals.annualreviews.org
School communities that work for results and equity. (2002). Providence, RI: Annenberg
Institute of Brown University. Senge, P. M. (1990). The fifth discipline: The art and practice of the learning
organization. New York: Doubleday. Sparks, D. (2005). Leading for results: Transforming teaching, learning, and
relationships in schools. Thousand Oaks, CA: Corwin Press. Stevens, J. (1992). Applied multivariate statistics for the social sciences (2nd ed.).
Hillsdale, NJ: Erlbaum Associates. Stoskopf, A. (2002). Echoes of a forgotten past: Eugenics, testing, and education reform.
The Educational Forum, 66, 126-133. Thorndike, R. & Thorndike-Christ, T. (2009) Measurement and evaluation in psychology and education (8th ed.) Upper Saddle River, NJ: Prentice Hall. Tschannen-Moran, M., Woolfolk, A., & Hoy, W. K. (1998). Teacher efficacy: Its
meaning and measure. Review of Educational Research, 68, 202-248. Tschannen-Moran, M., Woolfolk, A., & Hoy, W. K. (2001). Teacher efficacy: Capturing
and elusive construct. Teaching and Teacher Education, 17, 783-805. Tyack, D., & Cuban, L. (1995). Tinkering toward Utopia. Cambridge, MA: Harvard
University Press. Vescio, V., Ross, D., & Adams, A. (2006, January). A review of research on professional
learning communities. Paper presented at the January 2006 NSRF Research Forum, University of Florida, Gainesville, FL.
104

Ware, H., & Kitsantas, A. (2007). Teacher and collective efficacy beliefs as predictors of professional commitment. Journal of Education Research, 100, 303-310.
105

FOOTNOTES
1 Examination of the negative factor loading of item 1b (-.493) in the SPSLCQ
prompted the researcher to conduct an additional factor analysis withholding this item.
The new output rendered three underlying constructs, rather than the four constructs
identified in this study. Due to the inter-relatedness of items and the complex nature of
rotational dynamics, negative signs are complicated to interpret. For the purposes of this
study, the determination was made to retain item 1b. The importance of this item is
evidenced by its retention in three out of the four constructs of the original results.
106

APPENDIX A Document Provided to Intended Researcher by:
Signature_____________________________________ Date:___________
(Building Principal for District Employee or SLC Staff for Out-of-district Researchers)
INSTRUCTIONAL OPERATIONS TEAM Lee’s Summit R-7 School District
301 NE Tudor Rd. Lee’s Summit, Missouri 64086
REQUEST FOR PERMISSION TO CONDUCT RESEARCH/GATHER DATA
IN THE LEE’S SUMMIT R-7 SCHOOLS TO MEET A COURSE REQUIREMENT
DIRECTIONS: The applicant should complete this form, obtain the necessary approval and signatures, and return to: Associate Superintendent of Instruction & School Leadership Lee’s Summit R-7 School District 301 NE Tudor Rd. Lee’s Summit, Missouri 64086 It may take up to three weeks for requests to be processed; please plan accordingly in order to meet course deadlines.
1. Please describe concisely the basic concepts and goals of your proposed project, and include an explanation of how the project meets a course requirement within the field of education.
The proposed study is to fulfill the requirements of my Doctorate in Educational Policy and Leadership at the University of Kansas. The purpose of the study is to explore the characteristics of and interrelationships between teachers’ self-efficacy and professional learning community. Specifically, this study will present a quantitative analysis of the relationship between teacher efficacy and depth of PLC implementation in a particular school.
107
2. List the names of all data collection instruments you intend to use and enclose a copy of each with this application. Also, enclose a copy of each parent/student consent form. Please describe in detail the distribution, implementation, and collection methods you intend to use in your data collection.
The proposed study is to fulfill the requirements of my doctorate in Educational Policy and Leadership at the University of Kansas. The purpose of the study is to explore the characteristics of and interrelationships between teachers’ self-efficacy beliefs and professional learning community. Specifically, this study will present a quantitative analysis of the relationship between teacher efficacy and depth of PLC implementation in a particular school. The Teachers’ Sense of Efficacy Scale (long form) developed by Megan Tschannen-Moran and Anita Woolfolk Hoy and the School Professional Staff as Learning Community (SPSLCQ) instrument developed by Shirley Hord (1997) will be administered to the teachers in nine Lee’s Summit School District elementary schools. All K-6 teachers in each building will be invited to participate. Convenience sampling as defined by Creswell (2002) will be employed. Principals and assistant principals will assist with participant completion of the survey instruments by encouraging and reminding teachers to submit questionnaires. Teacher participation is completely voluntary and questionnaires will be completed either before or after regular school hours. Data will be coded by school, participant, and survey instrument. Quantitative measures of analysis will include correlational and descriptive statistics. Teacher participants will be provided an informational statement and Informed Consent Form. Additionally, each participant will complete a demographic information questionnaire. All responses will be taken on-line.
3. Give the names of the Lee’s Summit R-7 School District public school(s), you intend to involve to meet the project requirements. Are there certain demographics required for the project (ie: grade level, gender, etc.)
All kindergarten through sixth grade teachers at the following LSSD elementary schools will be invited to participate in the surveys. Schools will only be identified by code in the published dissertation. Cedar Creek Greenwood Elementary Hawthorn Hill Elementary Hazel Grove Elementary Trail Ridge Elementary Sunset Valley Elementary
108

West View Elementary 4. What amount of time would be required of staff or students in the R-7 schools in
order to meet project requirements?
Approximately 25 minutes to complete all portions.
5. Are there any other school records you would require (for example, achievement test scores or attendance?). If so, please provide a detailed explanation of your process to code such records to ensure confidentiality. No other records required.
6. Give the name of each person who will enter the schools. For nondistrict
employees, please provide existing background checks for individuals or a plan to ensure background checks are in place prior to entry in schools.
Surveys will be facilitated my building principals and/or assistant principals.
7. What is the date you wish to begin? Week of May 17-21.
8. By what date do you anticipate being finished? Survey completions week of May 17-21. Intended degree completion by August 31, 2010.
9. Please obtain the signature of your instructor responsible for this
assignment and attach a copy of the assignment guidelines.
Signature: (Signature pending approval by Human Subjects Committee – week of May 10-14)
Position:
John L Rury Professor of Education (ELPS) University of Kansas 423 JR Pearson Hall 1122 West Campus Rd Lawrence, KS 66045
[email protected] 785-864-9697 (p)
109

785-864-4697 (f) University/College/School/Department/Division:
Professor of Education (ELPS) University of Kansas
10. Name of applicant (please print)
Susan M. Romeo Principal Sunset Valley Elementary School 2404 SW Regency Drive Lee’s Summit, MO 64082 (816) 529-4773 May 5, 2010
CRITERIA FOR APPROVAL OR DISAPPROVAL The approval or disapproval of requests will be made within the following general guidelines.
1. The only projects which will generally be approved are those which: a) contribute to the improvement of education in the Lee’s Summit R-7
Schools; b) contribute to the improvement of education in general.
2. Even within the above categories, studies will generally be disapproved if they:
a) appear to infringe on the privacy of pupils, parents, or staff members; b) present a burden to pupils or staff members; c) threaten school-community relations in any way.
3. Research solely for a course requirement will be considered only for Lee’s
Summit R-7 School District staff. 4. At any point in the research process, R-7 staff can terminate the study if
determined necessary for any reason.
5. The R-7 School District reserves the right to access any results or product created as a result of projects conducted using R-7 students, staff, or facilities.
110

PARTICIPATION OF THE SCHOOLS Generally, participation in any research study conducted by an outside agency or individual will be completely voluntary on the part of the principals, teachers, pupils and any other personnel involved.
111

APPENDIX B: HUMAN STUDIES INTERNET INFORMATION STATEMENT
Approved by the Human Subjects Committee University of Kansas, Lawrence Campus (HSCL). Approval expires one year from 5/21/2010. HSCL #18762 Internet Information Statement
The Department of Educational Leadership and Policy Studies at the University of Kansas supports the practice of protection for human subjects participating in research. The following information is provided for you to decide whether you wish to participate in the present study. You should be aware that even if you agree to participate, you are free to withdraw at any time without penalty. We are conducting this study to better understand the relationship between professional learning community implementation and teachers' self-efficacy beliefs. This will entail your completion of a questionnaire. The questionnaire packet is expected to take approximately 15-20 minutes to complete. The content of the questionnaires should cause no more discomfort than you would experience in your everyday life. Although participation may not benefit you directly, we believe that the information obtained from this study will help us gain a better understanding of the research gathered should be helpful in providing insight into leadership in the area of school culture and PLC implementation. Your participation is solicited, although strictly voluntary. Your name will not be associated in any way with the research findings. It is possible, however, with internet communications, that through intent or accident someone other than the intended recipient may see your response. If you would like additional information concerning this study before or after it is completed, please feel free to contact us by phone or mail. Completion of the survey indicates your willingness to participate in this project and that you are at least age eighteen. If you have any additional questions about your rights as a research participant, you may call (785) 864-7429, write the Human Subjects Committee Lawrence Campus (HSCL), University of Kansas, 2385 Irving Hill Road, Lawrence, Kansas 66045-7563, or email [email protected]. Sincerely, Susan M. Romeo
112
Principal Investigator 2404 SW Regency Drive Lee’s Summit, MO 64082 (816) 529-4773 John L Rury Faculty Supervisor Professor of Education (ELPS) University of Kansas 423 JR Pearson Hall 1122 West Campus Rd Lawrence, KS 66045 (785) 864-9690
113

114
APPENDIX C: DEMOGRAPHIC SURVEY
Current School Location: o Cedar Creek (0) o Greenwood (1) o Hawthorn Hill (2) o Hazel Grove (3) o Trailridge (4) o Sunset Valley (5) o Westview (6) o Pleasant Lea (7)
Gender:
o Male o Female
Ethnicity:
o Asian o Black o Hispanic o White o Other
Grade level / content area in which you are currently teaching:
o Kindergarten o First Grade o Second Grade o Third Grade o Fourth Grade o Fifth Grade o Sixth Grade o Art/Music/PE o Special Education
Total number of years as a professional educator:
o 0 o 1-3 o 4-5 o 6-10 o 11-20 o 21-30 o 31-over
Total number of years working at your current school:
o 0 o 1-3 o 4-5 o 6-10 o 11-20 o 21-30 o 31-over
Highest degree completed:
o Bachelor o Masters o Masters + 30 o Specialist o PhD/EdD
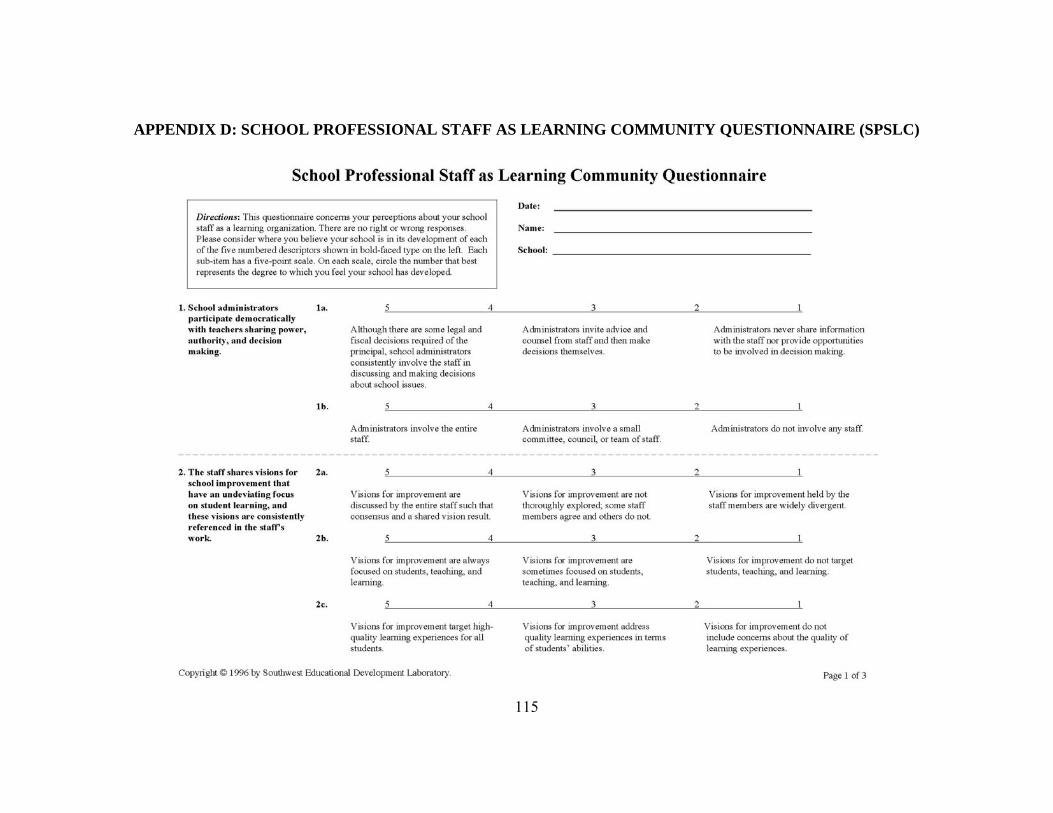
APPENDIX D: SCHOOL PROFESSIONAL STAFF AS LEARNING COMMUNITY QUESTIONNAIRE (SPSLC)
115

116

117

118

APPENDIX E: TEACHERS’ SENSE OF EFFICACY SCALE QUESTIONNAIRE
(TSES)
.
119

APPENDIX F Stepwise Regression
A stepwise regression was selected for the study due to its exploratory nature.
Stepwise multiple regressions are sometimes referred to as a statistical multiple
regressions. When there are multiple predictor variables a stepwise multiple regression
may be used to determine which specific IVs contribute to the model (Mertler &
Vannatta, 2001). Forward, stepwise, and backward are methods of entering and keeping
variables in the model. In using a stepwise selection method, at each step tests are
performed to determine the significance of each IV already in the equation. If a variable
were entered into the analysis and is measuring much the same construct as another, a
reassessment of the variables may conclude the first variable is no longer contributing
anything to the analysis. In a stepwise selection procedure, the variable would then be
dropped out of the analysis even though it might have been a good predictor at one time.
The variable may not be found to provide a substantial contribution to the model (Mertler
& Vannatta, 2001). The independent or predictor variables were school location, gender,
grade level/content area taught, total number of years as a professional educator, total
number of years working at current school and education level and the dependent
variables were the subscale scores from the TSES and SPSLCQ. A probability level of
p=.05 was used as the criteria for accepting or rejecting the null hypothesis.
Engage
The stepwise regression using Engage as the dependent variable and school,
gender, grade level/content area taught, total number of years as a professional educator,
120

total number of years working at current school and education level as the independent or
predictor variables found there was a statistically significant model accounting for 3.8%
of the variance, R= .194, R2=.038, R2adj=.031, F (1, 148) = 5.786, p=.017. Of the possible
predictor variables, only years as an educator was statistically significant. The
coefficients can be found in Table 14. The null hypothesis was rejected for years in
education and retained for all other predictor variables.
Table 14
Coefficients for Engage
B β t p Bivariate Partial
Yrs Ed 2.048 .194 2.405 .017 .194 .194
Class Management
The stepwise regression using Management as the dependent variable and school,
gender, grade level/content area taught, total number of years as a professional educator,
total number of years working at current school and education level as the independent or
predictor variables found there was a statistically significant model accounting for 4.4%
of the variance, R= .211, R2=.044, R2adj=.038, F (1, 148) = 6.880, p=.010. Of the possible
predictor variables, only school 4 was statistically significant. The coefficients can be
found in Table 15. The null hypothesis was rejected for school 4 and retained for all other
predictor variables.
121
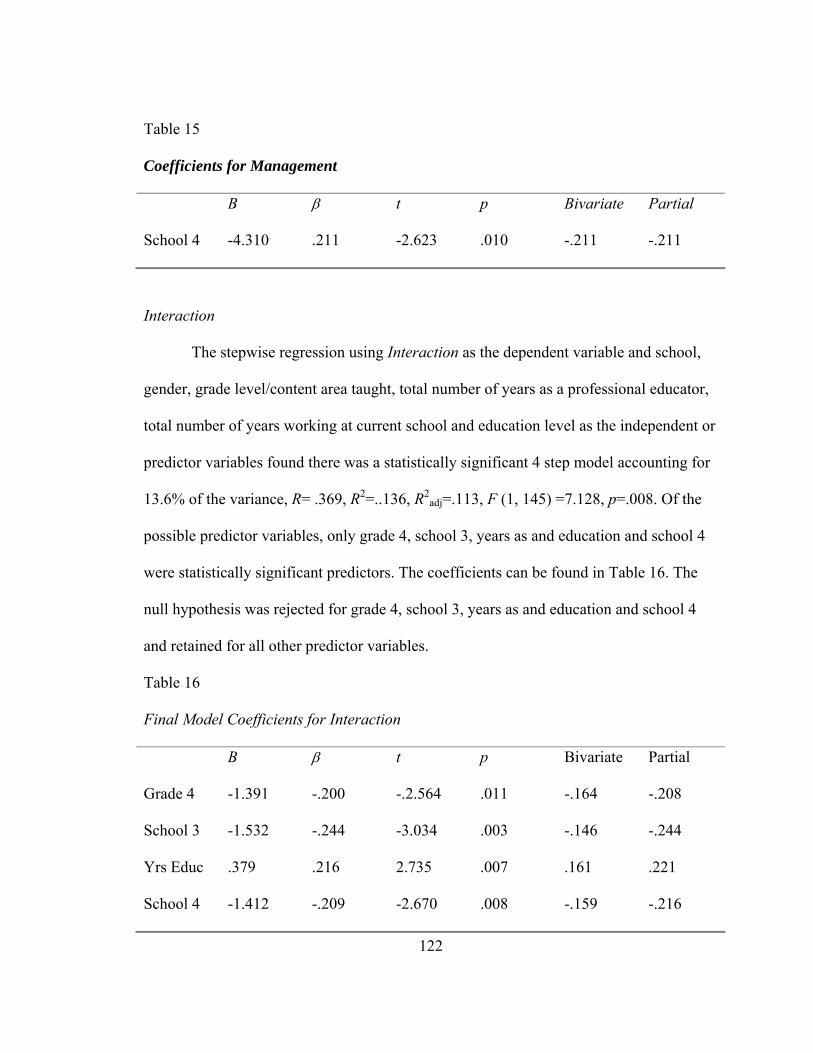
Table 15
Coefficients for Management
B β t p Bivariate Partial
School 4 -4.310 .211 -2.623 .010 -.211 -.211
Interaction
The stepwise regression using Interaction as the dependent variable and school,
gender, grade level/content area taught, total number of years as a professional educator,
total number of years working at current school and education level as the independent or
predictor variables found there was a statistically significant 4 step model accounting for
13.6% of the variance, R= .369, R2=..136, R2adj=.113, F (1, 145) =7.128, p=.008. Of the
possible predictor variables, only grade 4, school 3, years as and education and school 4
were statistically significant predictors. The coefficients can be found in Table 16. The
null hypothesis was rejected for grade 4, school 3, years as and education and school 4
and retained for all other predictor variables.
Table 16
Final Model Coefficients for Interaction
B β t p Bivariate Partial
Grade 4 -1.391 -.200 -.2.564 .011 -.164 -.208
School 3 -1.532 -.244 -3.034 .003 -.146 -.244
Yrs Educ .379 .216 2.735 .007 .161 .221
School 4 -1.412 -.209 -2.670 .008 -.159 -.216
122

Sharing
The stepwise regression using Sharing as the dependent variable and school,
gender, grade level/content area taught, total number of years as a professional educator,
total number of years working at current school and education level as the independent or
predictor variables found there was a statistically significant 5 step model accounting for
17.3% of the variance, R= .415, R2=.173, R2adj=.144, F (1, 144) =5.293, p=.023. Of the
possible predictor variables, only school 1, years as educator, school 3, grade 4, and
gender were statistically significant predictors. The coefficients can be found in Table 17.
The null hypothesis was rejected for school 1, years as educator, school 3, grade 4, and
gender and retained for all other predictor variables.
Table 17
Final Model Coefficients for Sharing
B β t p Bivariate Partial
School 1 1.979 .191 2.491 .014 .219 .203
Yrs Educ .536 .227 2.921 .004 .195 .237
School 3 -1.877 -.222 -2.806 .006 -.158 -228
Grade 4 -1.717 -.183 -2.384 .018 -.149 -.195
Gender 2.348 .176 2.302 .023 .138 .188
123

Improvement
The stepwise regression using Improvement as the dependent variable and school,
gender, grade level/content area taught, total number of years as a professional educator,
total number of years working at current school and education level as the independent or
predictor variables found there was a statistically significant 5 step model accounting for
12.2% of the variance, R= .349, R2=.122, R2adj=.097, F (1, 145) =4.361, p=.039. Of the
possible predictor variables, years as educator, school 4, grade 4, and school 6 were
statistically significant predictors. The coefficients can be found in Table 18. The null
hypothesis was rejected for years as educator, school 4, grade 4, and school 6 and
retained for all other predictor variables.
Table 18
Final Model Coefficients for Improvement
B β t p Bivariate Partial
Yrs Educ .399 .191 2.453 .015 .183 .200
School 4 -1.736 -.215 -2.734 .007 -.176 -.221
Grade 4 -1.374 -.165 -2.124 .035 -.160 -.174
School 6 -1.202 -.164 -2.088 .039 -.133 -.171
Trust
The stepwise regression using Trust as the dependent variable and school, gender,
grade level/content area taught, total number of years as a professional educator, total
number of years working at current school and education level as the independent or
124
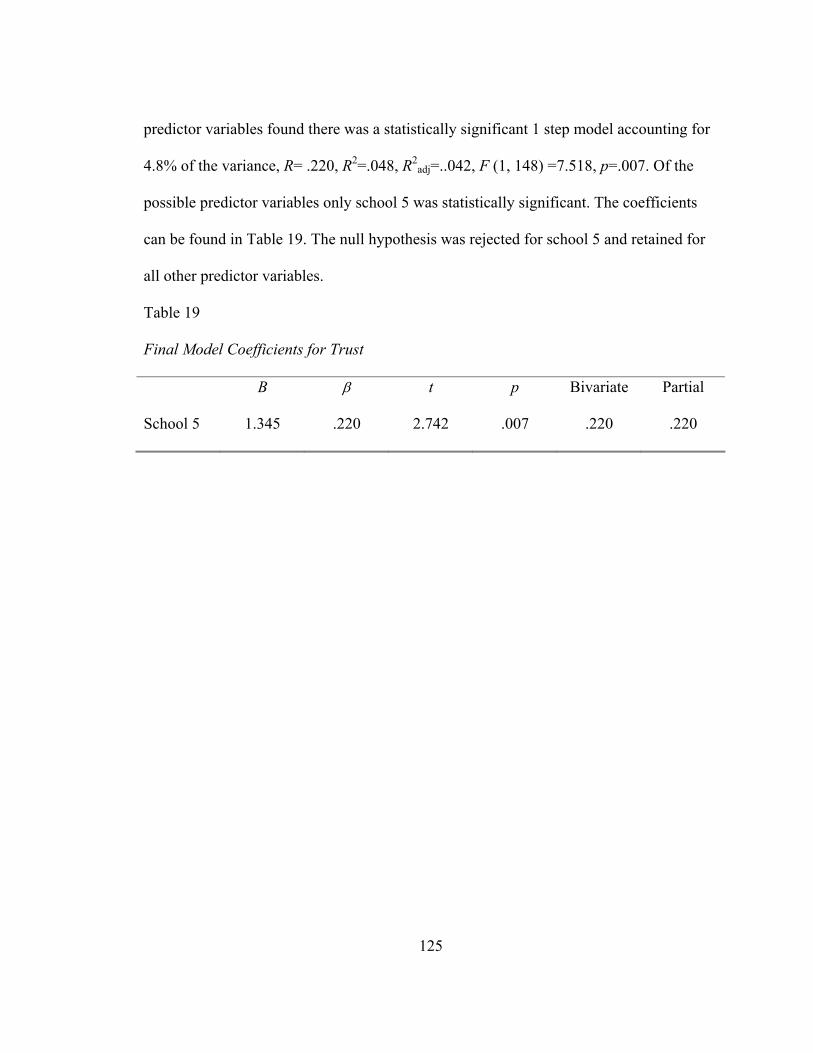
predictor variables found there was a statistically significant 1 step model accounting for
4.8% of the variance, R= .220, R2=.048, R2adj=..042, F (1, 148) =7.518, p=.007. Of the
possible predictor variables only school 5 was statistically significant. The coefficients
can be found in Table 19. The null hypothesis was rejected for school 5 and retained for
all other predictor variables.
Table 19
Final Model Coefficients for Trust
B β t p Bivariate Partial
School 5 1.345 .220 2.742 .007 .220 .220
125
126
VITA Susan graduated in 1981 from Blue Springs High School in Blue Springs,
Missouri. After receiving her Bachelor of Science degree from Central Missouri State
University in 1990, she began her elementary teaching career in the Butler School
District in Butler, Missouri. In 1993, Susan moved to the Raytown School District, in
Raytown Missouri, where she served as an elementary teacher and administrative intern.
She earned her Master of Arts degree in Elementary Administration in 1998. Susan left
the Raytown School District in 2003 to serve as principal of Raymore Elementary in the
Raymore-Peculiar School District until summer of 2009. During the 2009-2010 school
year, while serving as a principal in the Raymore-Peculiar School District, Susan was
selected to serve as the building principal of a new school under construction in the Lee’s
Summit School District to open in the fall of 2009. Susan opened Sunset Valley
Elementary School in the Lee’s Summit School District, in Lee’s Summit, Missouri, and
presently serves as the principal of Sunset Valley. She will receive her Doctor of
Educational Policy and Leadership degree in May 2011 from the University of Kansas.