effect of submerged arc process variables on dilution and bead geometry in single wire surfacing
DESCRIPTION
Effect of submerged arc process variables on dilution and bead geometry in single wire Effect of submerged arc process variables on dilution and bead geometry in single wireTRANSCRIPT

Journal of Materials Processing Technology, 37 (1993) 767 780 767 Elsevier
Effect of submerged arc process variables on dilution and bead geometry in single wire surfacing
N. Murugan
Welding Laboratory, Department of Mechanical Engineering, IIT, New Delhi, India
R.S. Parmar
Department of Materials Technology, Brunel University, UK
and
S.K. Sud
IDDC, IIT, New Delhi, India
Industrial S u m m a r y
Weld sur fac ing is the t echn ique of deposi t ing a layer of ma te r i a l on to the surface of a componen t to make it more r e s i s t an t to wear, cor ros ion or h igh t empera tu re t h a n the pa ren t meta l or subst ra te . This enhances p roduc t ion economies by enab l ing the use of a cheaper , more easily m a c h i n a b l e pa ren t mate r ia l coated wi th expensive meta ls and alloys for ach iev ing desired proper t ies in specific areas of products. I t has become more popula r t h a n the pre-cladding of mate r ia l s as it is employed at the final s tage of fabr ica t ion. Weld sur fac ing is employed for the fabr ica t ion of new components for use in chemical and fert i l izer plants , nuc l ea r power plants , pressure vessels, ag r i cu l tu ra l mach ines and even a i rc ra f t and missile components . Also, it has been used widely for m a i n t e n a n c e and repa i r of ra i lway ro l l ing s tock as well as points and junct ions , e a r th moving and agr i cu l tu ra l machinery , large gear wheels, conveyor shafts, chutes, t u rb ine componen ts and i nnumerab l e o the r components .
T h o u g h weld sur fac ing is carr ied out by var ious techniques , au tomated submerged arc welding is the popular ly employed t echn ique due to its h igh qual i ty and rel iabi l i ty . Also, by the proper se lec t ion of the process control parameters , single wire sur fac ing becomes one of the cost effective means of deposi t ing a corros ion re s i s t an t overlay. However, for use of SAW in its au tomat i c mode, the cont ro l pa ramete r s are required to be fed to the system accord ing to some ma thema t i c a l fo rmula t ion to achieve the desired end results: the present paper deals wi th the deve lopment of such models. M a t h e m a t i c a l models were developed by us ing a five level factor ia l t echn ique to predic t the weld bead geometry for deposi t ing 316L s ta in less steel
Correspondence to: N. Murugan , Welding Labora tory , Depa r tmen t of Mechan ica l Engineer- ing, IIT, New Delhi-110016, India.
0924-0136/93/S06.00 ',C 1993 Elsevier Science Publ i shers B.V. All r igh ts reserved.
768 N. Murugan et al./ Single wire surfacing
onto structural steel IS 2062. The responses, namely, penetration, reinforcement, width and dilution as affected by open-circuit voltage, wire feed-rate, welding speed and nozzle-to-plate distance, have been investigated. The models developed have been checked for their ad~ equacy and significance by using the F-test and the t-test, respectively. The main and interaction effects of the control factors on dilution and bead geometry have been presented in graphical form, which is more useful in selecting the process parameters to achieve tile desired quality of the overlay.
1. I n t r o d u c t i o n
Weld sur fac ing is not only an ind ispensab le process in the r epa i r and m a i n t e n a n c e industr ies , but is a lso employed inc reas ing ly in the process and power industr ies . I t is appl ied ma in ly to inc rease the life of componen t s ope ra t i ng under condi t ions of wear and cor ros ion by hard- fac ing and c ladding and to reduce the i r cost by r epea ted rebui ld ing [1]. T h o u g h it is ca r r ied out by n u m e r o u s welding me thods such as SMAW, SAW, GTAW, GMAW, FCAW. ESW, PAW, etc., SAW is the p r e d o m i n a n t me thod due to its h igh produc t iv i ty , be t t e r qual i ty , easy appl icab i l i ty and good re l iabi l i ty [2].
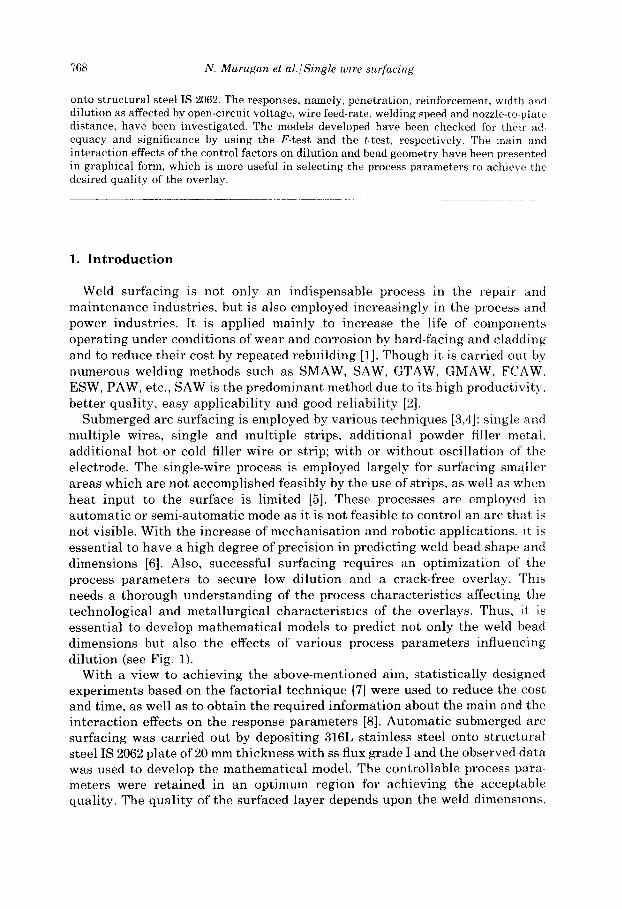
Submerged arc su r fac ing is employed by var ious t echn iques [3,4]: s ingle and mul t ip le wires, s ingle and mul t ip le strips, addi t ional powder filler metal , add i t iona l hot or cold filler wire or strip; wi th or w i thou t osci l la t ion of the e lectrode. The s ingle-wire process is employed la rge ly for sur fac ing smal le r a reas which are not accompl i shed feas ibly by the use of strips, as well as when hea t inpu t to the sur face is l imi ted [5]. These processes are employed in a u t o m a t i c or s emi -au toma t i c mode as it is no t feasible to cont ro l an arc t ha t is not visible. With the inc rease of m e c h a n i s a t i o n and robot ic appl ica t ions , it is essent ia l to have a h igh degree of prec is ion in p red ic t ing weld bead shape and d imens ions [6]. Also, successful su r fac ing requi res an op t imiza t ion of the process p a r a m e t e r s to secure low di lu t ion and a crack-f ree over lay . This needs a t h o r o u g h u n d e r s t a n d i n g of the process cha rac t e r i s t i c s a f fec t ing the t echno log ica l and m e t a l l u rg i ca l cha rac t e r i s t i c s of the over lays . Thus, it is essent ia l to develop m a t h e m a t i c a l models to predic t not only the weld bead d imens ions but also the effects of va r ious process p a r a m e t e r s inf luencing d i lu t ion (see Fig. 1).
Wi th a view to ach iev ing the above-ment ioned aim, s t a t i s t i ca l ly designed expe r imen t s based on the fac to r ia l t echn ique [7] were used to reduce the cost and t ime, as well as to ob ta in the requi red in fo rma t ion abou t the ma in and the i n t e r a c t i o n effects on the response p a r a m e t e r s [8]. A u t o m a t i c submerged arc su r fac ing was car r ied out by depos i t ing 316L s ta in less steel onto s t ruc tu ra l s teel IS 2062 p la te of 20 mm th ickness wi th ss flux grade I and the observed da ta was used to develop the m a t h e m a t i c a l model. The con t ro l l ab le process para- me te r s were r e t a ined in an op t i m um reg ion for ach iev ing the accep tab le qual i ty . The qua l i ty of the sur faced l ayer depends upon the weld dimensions ,
N. Murugan et al./Single wire surfacing 769
Width
Penefrotion ~ ~ -
t
% Oi~ution = Ap x 100 Ar + A#
Fig. 1. Weld bead geometry.
Reinforcemenf
especially on the dilution, as the latter determines the amount of ferrite present in the overlay [3,4]. The recommended amount of ferrite to be present in the overlay to have resistance to microfissuring and hot cracking is of the order of 5 to 11 FN (ferrite number) [9]. The actual amount present may be calculated if the composition of both the base metal and the filler metal and the amount of dilution in the overlay are known [10]. The economies of ss weld cladding are dependent on achieving the specific chemistry at the practical deposition rate in a minimum number of layers. Obviously, when the amount of dilution in the first layer is the least possible, the total number of overlays required in order to be able to satisfy metallurgical needs is less. By effectively controlling the dilution, single-wire surfacing by 316L ss onto mild steel has produced acceptable weld quality [11]. This paper presents mathematical models developed for predicting the effects of process variable for single-wire surfacing on dilution and bead geometry from the experimental data obtained, without delving too deeply into the measurement of ferrite. The experiments were based on a central composite design matrix of five level full factorial technique. Regression analysis was used to develop the models and the vari- ance method was used to test their adequacy.
2. Plan of invest igat ion
The research work was planned to be carried out in the following steps: (1) identifying the important process control variables; (2) finding the upper and lower limits of the control variables, viz., open
circuit voltage (V), wire feed-rate (F), welding speed (S) and nozzle- to-plate distance (N);
(3) developing the design matrix; (4) conducting the experiments as per the design matrix; (5) recording the responses, viz., penetration (P), weld width (W), reinforce-
ment (R), and dilution (D); (6) development of mathematical models; (7) calculating the coefficients of the polynomials; (8) checking the adequacy of the models developed;

770 N. Murugan et al./ Single wire surfacing
Table 1
Control parameters and their levels
Parameter Unit Notation Factor levels 2 ~ o I 2:
open-circuit voltage V V 36 38 ~0 42 ~. feed rate m/min F 1.26 1.52 I78 2.(}4 ! i ~ welding speed m/rain S 0.40 0.56 0.72 0.88 i~!i nozzle-to-plate mm N 30 :~ 38 42 4~ distance
(9) t es t ing the s ignif icance of the regress ion coefficients and a r r iv ing at the final m a t h e m a t i c a l models;
(10) p re sen t ing the ma in effects and the s ignif icant i n t e rac t ions be tween dit- f e ren t p a r a m e t e r s in g raph ica l form;
(11) ana lys i s of results .
2.1. Identification of the process variables The independen t ly con t ro l l ab le process p a r a m e t e r s were identified to enab le
the ca r ry ing out of the expe r imen ted work and the deve lopmen t of the math- ema t i ca l models: they were open-c i rcu i t vo l t age (V), wire feed-ra te (F), welding speed (S), and nozzle-to-plate d i s t a nce (N). The expe r imen t s were conduc ted by lay ing four beads wi th a pos i t ive e lec t rode and a cons t an t over lap of 2 to 3 mm. The responses were measu red af ter c ross-sec t ioning the ove r l ay at its mid-point. Hence, all the process va r i ab l e s and the responses requi red for the inves t iga t ion were identified.
2.2. F ind ing the limits of the process variables Tria l runs were ca r r i ed out by va ry i ng one of the process p a r a m e t e r s whilst
keep ing the res t of them at cons t an t va lues [12]. The work ing r ange was decided upon by inspec t ing the bead for a smooth a p p e a r a n c e and the absence of any vis ible defects, viz., su r face porosi ty , undercut , etc. The uppe r l imit of a fac tor was coded as + 2 and the lower l imit as - 2 , the coded va lues for i n t e rmed ia t e va lues be ing ca lcu la ted f rom the fol lowing re la t ionship :
X; = 2 1 2 X - (Xmax + Zmin)]/(Zmax - - Zmin)
where Xi is the requi red coded va lue of a va r i ab le X; X is any va lue of the va r i ab l e f rom Xmi. to Xmax; Xmi, is the lower level of the va r i ab le and Xmax is the uppe r level of the var iable . The decided levels of the process p a r a m e t e r s wi th the i r uni t s and no t a t i ons a re g iven in Tab le 1.

N. Murugan et al./Single wire surfacing
Table 2
Design matr ix and observed values of bead dimensions
771
S1. No. Design matrix Pene t ra t ion Reinforcement Width Dilution (mm) (mm) (mm) (%)
V F S N
1 1 - 1 - 1 - 1 2.763 3.225 36.9 38.95 2 1 - 1 - 1 1 2.7 2.65 41.3 4'2.99 3 1 1 - 1 - 1 3.25 4.075 39.1 36.95 4 1 1 - 1 - 1 4.375 3.125 45.2 54.68 5 1 1 1 1 2.25 2.4 27.9 41.55 6 1 - 1 1 - 1 2.05 2.025 36.4 40.5 7 - 1 1 1 - 1 2.85 2.675 32.1 46.64 8 1 1 1 - 1 2.775 3.1 33.6 38.69 9 - 1 - 1 - 1 1 2.275 2.775 38.5 37.48
10 1 - 1 - 1 1 2.35 2.725 44.0 37.43 11 1 1 1 1 3.425 3.575 41.4 42.01 12 1 1 - 1 1 3.25 3.1 43.0 42.95 13 1 1 1 1 2.3 2.4 30.0 40.41 14 1 - 1 1 1 2.125 2.225 31.4 41.9 15 ] 1 1 1 2.775 3.0 29.4 41.96 16 1 1 1 1 2.55 2.625 33.2 42.85 17 - 2 0 0 0 2.9 2.9 36.5 42.65 18 2 0 0 0 2.625 2.525 43.3 42.63 19 0 - 2 0 0 1.925 2.5 33.7 36.6 20 0 2 0 0 4.15 2.975 37.7 52.14 21 0 0 - 2 0 3.65 3.925 45.8 41.59 22 0 0 2 0 2.45 2.5 29.0 43.43 23 0 0 0 - 2 3.1 2.6 40.5 45.58 24 0 0 0 2 2.513 2.625 39.0 39.81 25 0 0 0 0 2.9 2.65 39.8 46.05 26 0 0 0 0 2.5 2.6875 36.3 43.05 27 0 0 0 0 2.525 2.3 38.2 45.74 28 0 0 0 0 2.525 2.625 37.3 42.53 29 0 0 0 0 2.425 2.6 36.6 41.05 30 0 0 0 0 2.5 2.775 37.2 42.5 31 0 0 0 0 2.9 2.75 39.6 45.83
2.3. Developing the design matr ix T h e s e l e c t e d d e s i g n m a t r i x , s h o w n i n T a b l e 2, is a c e n t r a l c o m p o s i t e r o t a t -
a b l e f a c t o r i a l d e s i g n [13] c o n s i s t i n g o f 31 s e t s o f c o d e d c o n d i t i o n s . I t c o m p r i s e s
a fu l l r e p l i c a t i o n o f 24 ( = 16) f a c t o r i a l d e s i g n p l u s 7 c e n t r e p o i n t s a n d 8 s t a r
p o i n t s . A l l w e l d i n g v a r i a b l e s a t t h e i n t e r m e d i a t e (0) l e v e l c o n s t i t u t e t h e c e n t r e
p o i n t s a n d t h e c o m b i n a t i o n s o f e a c h o f t h e w e l d i n g v a r i a b l e s a t e i t h e r i t s
l o w e s t ( - 2 ) o r h i g h e s t ( + 2) w i t h t h e o t h e r t h r e e v a r i a b l e s o f t h e i n t e r m e d i a t e
l e v e l s c o n s t i t u t e t h e s t a r p o i n t s . T h u s t h e 31 e x p e r i m e n t a l r u n s a l l o w e d t h e
e s t i m a t i o n o f t h e l i n e a r , q u a d r a t i c a n d t w o - w a y i n t e r a c t i v e e f f e c t s o f t h e
w e l d i n g v a r i a b l e s o n t h e b e a d g e o m e t r y .
772 N. Murugan et al./ Single wire surfacing
Electrode F l u x w i r e - - ~
\ /Wire r
D i r e c t i o n travel
/ , Base metal /~
~ Wire reel
Cant r o1 Paw e r system 7 sourceff
• - - JJ , , oo o 9 r l J L = +__
read / I I I I Auto-torch | J 1 .:,ux H '
Work l e a d ~
I
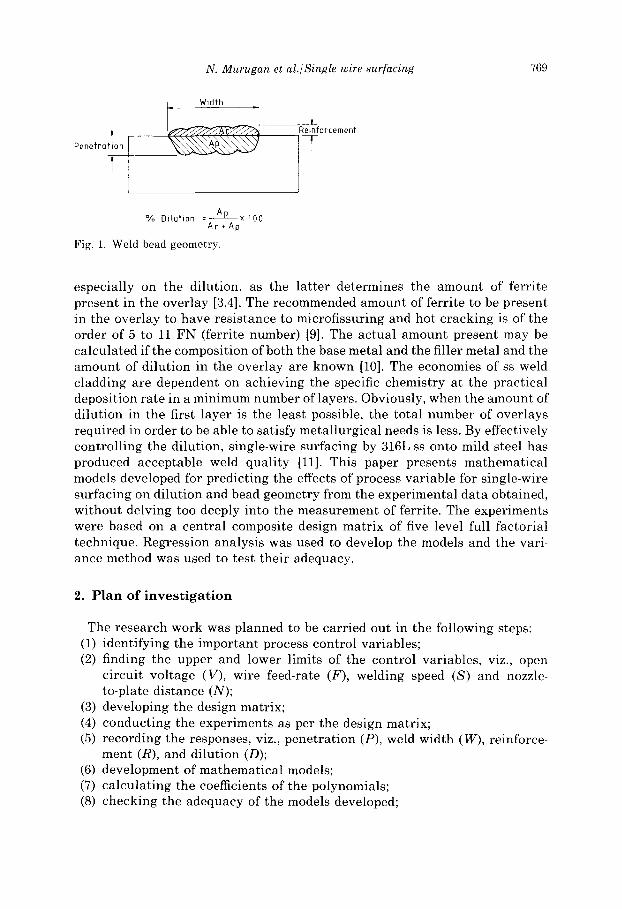
Fig. 2. Surfacing by the submerged arc welding process.
2.4. Conducting the experiment as per the design matrix Figure 2 shows the schemat i c expe r imen ta l set-up for typica l s ingle-wire
su r fac ing by an a u t o m a t i c SAW unit , wi th a power source of cons t an t po ten t ia l rect i f ier type h a v i n g 600 A capac i ty . The expe r imen t s were conducted as per the design ma t r i x a t r andom, to avoid sys t emat i c e r rors in f i l t ra t ing the system. Au tome l t 316L ss wire of 3.15.mm d i am e t e r and ss flux grade I were used to deposi t ss on to s t r u c t u r a l s teel p la te IS 2062 of 20 mm thickness . Keep ing the pos i t ive polar i ty , four beads each of 150 mm length wi th an ove r l ap of 2 to 3 ram were laid.
2.5. Recording of the responses The surfaced p la tes were cross-sect ioned a t the i r mid-points to ob ta in test
spec imens 10 mm wide. These spec imens were p repa red by the usua l me t a l l u r gical pol i sh ing me thods and e tched wi th 2% nital . The weld-bead profiles were t r aced us ing an opt ical profile p ro jec to r and the bead dimensions , viz., width, pene t ra t ion , and re in fo rcement , were measured . Wi th the help of a p lan imete r . the a reas of the p a r e n t p la te mel ted and the weld meta l fo rming the reinforce- m e n t were measu red and the p e r c e n t a g e d i lu t ion was ca lcula ted . The observed va lues of W, P and R and ca lcu la t ed va lues of d i lu t ion are g iven in Table 2.
2.6. Development of mathematical models The response func t ion r ep re sen t ing any of the weld-bead d imens ions can be
expressed [12] as Y = f ( V , F , S,N), the r e l a t ionsh ip se lected being a second-

N. Murugan et al./Single wire surfacing
Table 3
Estimated values of the coefficients of the models
773
S1. No. Coefficient Penetration Reinforcement Width Dilution (P) (R) (W) (D)
1 b0 2.611 2.627 37.857 43.821 2 bl 0.0109 0.1375 1.933 0.667 3 b2 0.453 0.242 0.775 2.358 4 b3 -0.296 -0.3188 -4.542 0.1975 5 b4 0.131 -0.0333 -0.1917 - 1.0625 6 bll 0.0113 0.0277 0.2232 0.5133 7 b22 0.08 0.0339 0.8268 -0.0808 8 b33 0.083 0.1527 -0.4018 0.5458 9 ba4 0.0222 0.0268 0.1857 0.4995
10 b12 0.063 0.0125 -0.425 0.449 11 bl3 -0.102 0.0969 -0.150 - 1.830 12 bl~ 0.08 0.025 -0.5125 0.5938 13 b23 -0.124 0.0094 -0.3375 -0.8725 14 b24 0.0336 -0.0313 -0.275 -0.0263 15 b34 0.1008 0.0594 0.65 0.840
d e g r e e r e s p o n s e s u r f a c e e x p r e s s e d as fo l lows :
Y=bo +bl V + b 2 F + b 3 S + b a N + b l l V2 +b22F2 +b33S2 +b44N2 +b12 V F
+b13 V S+b14 V N+b23F S+b2aF N+b3aS N
2. 7. Evaluation of the coefficients of models T h e v a l u e s of t h e coef f ic ien t s w e r e c a l c u l a t e d by r e g r e s s i o n w i t h t h e h e l p o f
t h e f o l l o w i n g e q u a t i o n s [14]:
b0 =0.142857 ~ Y - 0 . 0 3 5 7 1 4 ~ ( X , Y)
b, = 0.041667 ~(X, Y)
b, = 0.03125 ~ (X,, Y) - 0.035714 ~ (X,, Y) - 0.035714 ~ Y
b,j = 0.0625 ~(Xij Y)
A c o m p u t e r p r o g r a m m e w a s d e v e l o p e d to c a l c u l a t e t h e v a l u e o f t h e s e coeffi- c i e n t s for d i f f e r e n t r e s p o n s e s , t h e v a l u e s b e i n g p r e s e n t e d in T a b l e 3.
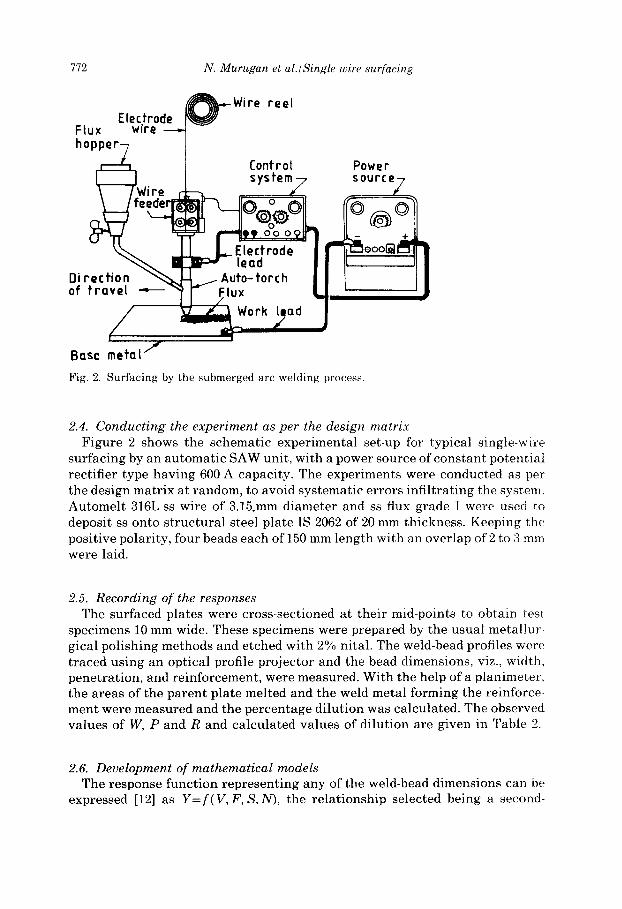
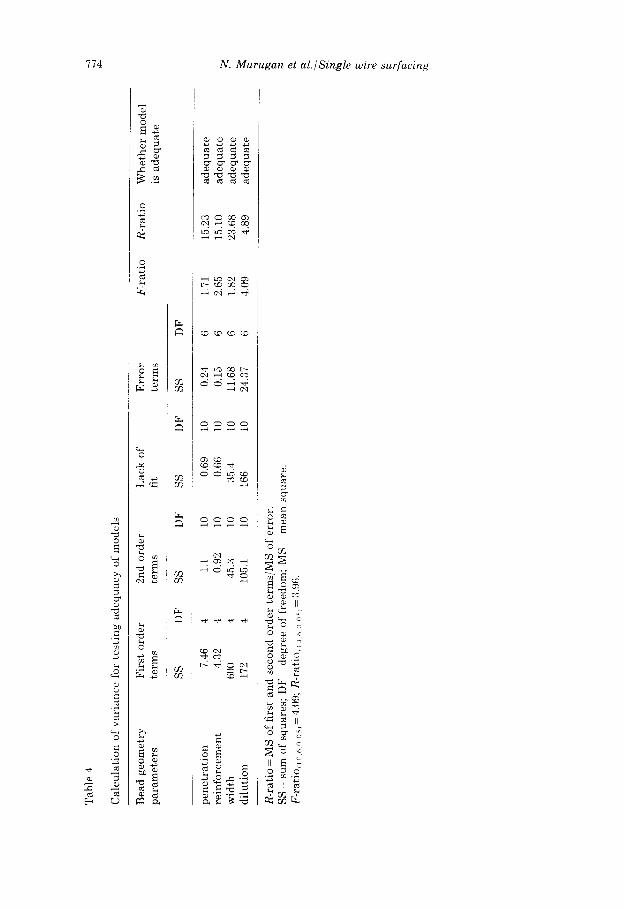
2.8. Checking the adequacy of the developed models T h e a d e q u a c y o f t h e m o d e l s was t h e n t e s t e d by u s i n g t h e a n a l y s i s of v a r i a n c e
t e c h n i q u e ( A n o v a ) [13,14]. As p e r t h i s t e c h n i q u e : (i) t h e c a l c u l a t e d v a l u e o f t h e F - r a t i o o f t h e m o d e l d e v e l o p e d does n o t e x c e e d t h e s t a n d a r d t a b u l a t e d v a l u e o f F - r a t i o for a d e s i r e d l eve l o f c o n f i d e n c e ( say 95%); a n d (ii) i f t h e c a l c u l a t e d v a l u e o f t h e R - r a t i o of t h e m o d e l d e v e l o p e d e x c e e d s t h e s t a n d a r d t a b u l a t e d
Tab
le
4
Cal
cula
tion
of
var
ian
ce
for
test
ing
adeq
uac
y of
m
odel
s
Bea
d ge
omet
ry
para
met
ers
Fir
st
orde
r 2n
d or
der
Lac
k
of
Err
or
F-r
atio
R
-rat
io
Wh
eth
er
mod
el
term
s te
rms
fit
term
s is
ade
quat
e
ss
DF
S
S
DF
ss
D
F
SS
D
F
pen
etra
tion
7.
46
4 1.
1 10
0.
69
rein
forc
emen
t 4.
32
4 0.
92
IO
0.66
wid
th
600
4 45
.3
10
35.4
dilu
tion
17
2 4
105.
1 10
16
6
R-r
atio
=
MS
of
fi
rst
and
seco
nd
orde
r te
rms/
MS
of
er
ror.
S
S
sum
of
sq
uar
es;
DF
d
egre
e of
fr
eedo
m;
MS
m
ean
sq
uar
e.
F-r
atio
,,n
,h,o
oil=
4.09
: R
-rat
io,,,
.,,,i
,=3.
96.
10
0.24
6
1.71
15
.23
adeq
uat
e 70
0.
15
6 2.
65
15.1
0 ad
equ
ate
10
11.6
8 6
1.82
23
.68
adeq
uat
e 2
10
24.3
7 6
4.09
4.
89
adeq
uat
e 5 _1

N. Murugan et al./Single wire surfacing 775
value of the R-rat io for a desired level of confidence (say 95%) then the model may be considered adequate wi thin the confidence limit. From Table 4, it has been found tha t all models are adequate.
2.9. Testing the coefficients for significance The va lue of the regress ion coefficients gives an idea as to what ex ten t the
cont ro l var iables affect the responses quant i ta t ive ly . Insignif icant coefficients can be e l iminated along with responses with which they are associated, with- out sacrificing much of the accuracy, to avoid cumbersome mathemat ica l labour. To achieve this, s tudent ' s t-test is used [14]. According to this test, when the ca lcu la ted value of t cor responding to a coefficient exceeds the s tandard tabula ted value for the desired level of probabi l i ty (say 95%), the coefficient becomes significant. After de termining the signif icant coefficients, the final models were developed using only these coefficients.
2.10. Development of final models The final ma themat ica l models as de termined by the above analysis are
represented below:
P = 2.6107 + 0.4536 F - 0.2964 S - 0.1307 N - 0.1242 F S
R=2.6268 0 .1375V+0.2417F-0 .3188S+0.0969 VS+0.1527S 2
W= 37.857 - 1.933 V+ 0.775 F - 4.542 S - 0.8268 F 2
D = 43.821 + 2 . 3 5 8 F - 1 .0625N- 1.83 V S
3. R e s u l t s
The mathemat i ca l models furnished above can be used to predict the weld- bead geometry by subs t i tu t ing the values, in coded form, of the respect ive factors. The responses ca lcula ted from these models for each set of coded welding var iables are represented in graphical form in Figs. 3 to 9. Also, by subs t i tu t ing the values of the desired bead geometry, the values of the control factors, in coded form, can be obtained.
4. D i s c u s s i o n
The main effects of the different process var iables on the weld-bead dimen- sions predicted from the mathemat ica l models using the exper imenta l observa- t ions are depicted in Figs. 3 to 9, these showing the genera l ly convinc ing t rends between cause and effect.
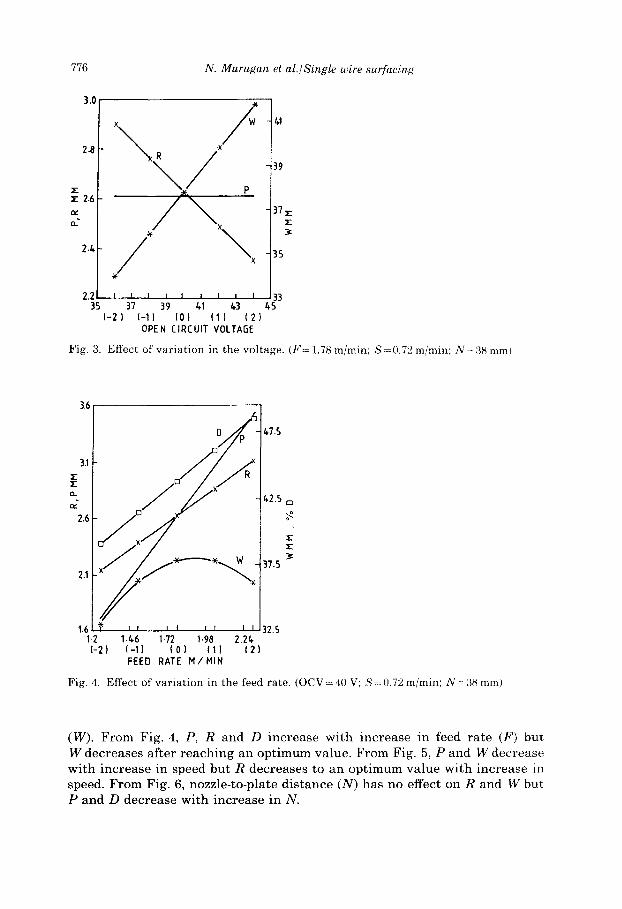
4.1. Direct effects of parameters From Fig. 3, vol tage (V) has no significant effect on pene t ra t ion (P). Rein-
forcement (R) decreases with increase in V but the reverse is t rue with width
776 N. Murugan et al./Single wire surfacing
2E 2.6
o_"
3.0
2, x \
2.2 ~ , , i I i I / I 35 37 39 /.1 1,3
(-2) (-I) (0) (I) (2) 0PEN CIR(UIT VOLTAGE
/+I
39
3 7 ~ -
35
33 ~,5
Fig. 3. Effect of variation in the voltage. (F= 1.78 m/min; S=0.72 m/min; N= 38 ram!
3.6
3.1
o_
2.6
2.1
1.6 1.2 1-2)
"~ I f , I I , I I [ I
I./+6 1.72 1.98 2.2/+ (-I} (0) |I) {2) F E E D R A T E H / H I N
/.7S
/,2.5
o~
: IE :IE 3~
3"/.5
32.5
Fig. 4. Effect of variation in the feed rate. (OCV=40 V: S=0.72 m/min; N=38 ram)
(W). From Fig. 4, P, R and D increase with increase in feed rate (F) but W decreases after reach ing an opt imum value. From Fig. 5, P and W decrease with increase in speed but R decreases to an opt imum value with increase m speed. F rom Fig. 6, nozzle-to-plate dis tance (N) has no effect on R and W but P and D decrease with increase in N.

N. Murugan et al./Single wire surfacing 777
325
o. .
2.75
2.25
~3
38
33
.)(.
1.75 , i i , ~ , ' 28 0-36 0.52 0-68 0.86 1.00
( - 2 ) {-1) (0) ( 1 ) (2 ) SPEED H / NIN
Fig. 5. Effect of variation in the speed. (OCV =40 V; F= 1.78 m/min; N= 38 ram)
3.0 ~.7
~2.8
2.6 x × "~",~~x
2.6
-)6 * " ,)~
2 . 0 I I i i l I I , 3 " /
29 33 37 ~1 ~,5 ( - 2 ) ( - 1 ) {0 ) [1) ( 2 ) j
MH
~5
~3
Fig. 6. Effect of variation in the nozzle-to-plate distance. (OCV=40V; F=1.78m/min; S=0.72 m/rain)
4.2. Interaction effects of process parameters on dilut ion From Fig. 7, i t is c lear t h a t the d i lu t ion is not affected by the changes in
vo l t age provided t ha t the speed is kep t a t the 0 level. When S is changed f rom the 0 level, D has two en t i re ly different and opposi te trends: when S is below

778 N. Murugan et a/./Single wire surfacing
S/,
S=-2 x
/*9 ~ //~S.-- -1
Z- /.6,
S=2
3 / * I I I I I I I I I 35 37 39 /.1 /*3 /*S
(-2) ( -1) 0 (-1) ( -2) OPEN CIRCUIT VOLTAGE VOLTS
Fig. 7. E f f ec t o f v a r i a t i o n in t h e v o l t a g e o n p e r c e n t a g e d i l u t i o n . ( F = ] .78 m / r a m : N ~ : ~ ram)
All fQctors at /*9 _x01 Level
"=39 x
3/* ×
29, i , t 4 p = I , l 1.2 1./.6 1.72 1 98 2.2/,
( -2) ( -1) (0) (1) (2 ) FEED RATE H / H t N
Fig. 8. E f f e c t o f v a r i a t i o n in t h e feed r a t e o n p e r c e n t a g e d i l u t i o n .
the 0 level D inc reases wi th inc rease in V but when S is above the 0 level D decreases wi th inc rease in V. This is due to the hea t input to the sys tem inc reas ing when the welding speed decreases , hence mel t ing of more base me ta l r e su l t ing in more di lut ion.
N. Murugan et al./Single wire surfacing 779
~38
33
x ~ a 1
-1
Z8 I , I I I I I I I 29 33 37 G1 ~,S
l-2) l-1) {0) (1) (2) NOZZLE-TO-PLATE DISTANEE MM
h i t f a c t o r s Qt
Level
L e v e l L e v e l
Level
Level
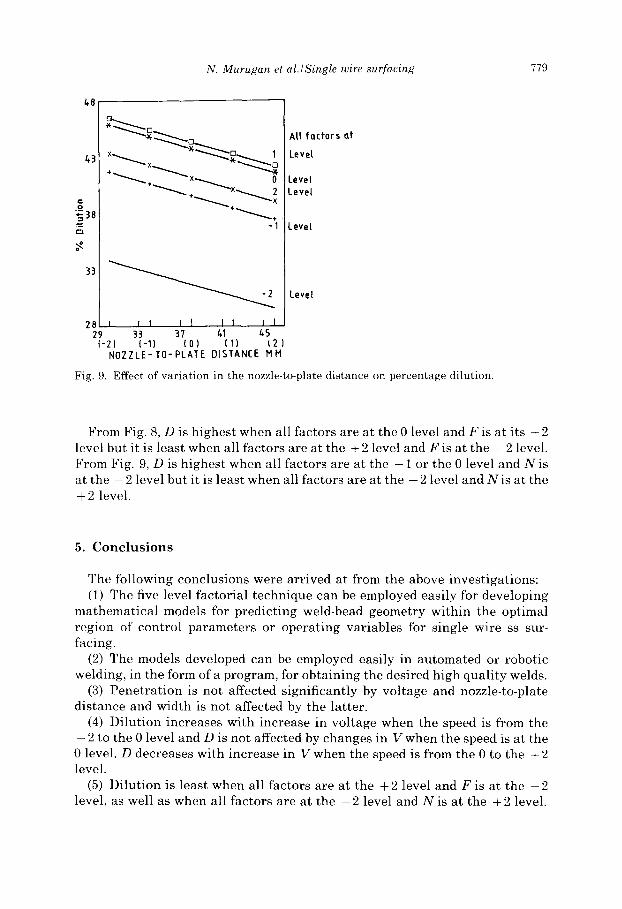
Fig. 9. Effect of variation in the nozzle-to-plate distance on percentage dilution.
From Fig. 8, D is highest when all factors are at the 0 level and F is at its + 2 level but it is least when all factors are at the + 2 level and F i s at the - 2 level. From Fig. 9, D is highest when all factors are at the + 1 or the 0 level and N is a t t h e 21evel but it is least when all factors are at the - 21evel and N is at the + 2 level.
5. Conclus ions
The following conclusions were arr ived at from the above invest igat ions: (1) The five level factorial technique can be employed easily for developing
mathemat ica l models for predict ing weld-bead geometry within the optimal region of control parameters or opera t ing variables for single wire ss sur- facing.
(2) The models developed can be employed easily in au tomated or robot ic welding, in the form of a program, for obta in ing the desired high qual i ty welds.
(3) Pene t ra t ion is not affected significantly by vol tage and nozzle-to-plate dis tance and width is not affected by the latter.
(4) Dilut ion increases with increase in vol tage when the speed is from the - 2 to the 0 level and D is not affected by changes in V when the speed is at the 0 level. D decreases with increase in V when the speed is from the 0 to the + 2 level.
(5) Dilut ion is least when all factors are at the + 2 level and F is at the - 2 level, as well as when all factors are at the - 2 level and N is at the + 2 level.
780 N. Murugan et al./Single wire sur[hcing
References
[1] R.S. Parmar, Welding Processes and Technology, Khanna Publishers, New Delhi, ~992 [2] P.T. Houldcroft, Submerged-Arc Welding, Abington Publishing, UK, 1989. [3] Hallock, H.C. Campbell and W.C. Johnson, Am. Weld. J., 45 (1966) 399. [4] Stan Grainger, Engineering Coatings, Abington Publishing, UK, 1989. [5] American Society For Metals, Metals Hand Book, Vol. 6, Metals Park. OH. 1982 [6] J.C. McGlone, Met. Constr., 14 (1982) 378. [7] Y.P. Adler, E.V. Markov and Y.V. Granovsky, 2'he Design of Experiments W t i~d
Optimal Conditions, MIR Publishers, Moscow, 1975. [8] P. Harris and B.L. Smith, Met. Constr., 15 (1983) 661. [9] D.V. Smith, Am. Weld. J., 67 (1988) 57.
[10] J.F. Lancaster, Metallurgy of Welding, Allen & Unwin, I,ondon, 1987. [11] B.T. Nugent, Met. Constr., 14 (1982) 241. [12] V.K. Gupta and R.S. Parmar, Fract ional factorial technique to predict dimensions of the
weld bead in automatic submerged arc welding, J. Inst. Eng. (India), 70 (1989) 67. [13] William G. Cochran and Gertrude M. Cox, Experimental Designs. Asia Publishing
House, India, 1963. [14] O.L. Davies, The Design and Anatvsis of Industrial Experiments, Longman, New "~'ork.
1978.