effect of strain-rate in severe plastic deformation on ... · pdf filechip formation by...
TRANSCRIPT

1
Effect of Strain-rate in Severe Plastic Deformation on
Microstructure Refinement and Stored Energies
Shashank Shekhar, Jiazhao Cai, Saurabh Basu, Sepideh Abolghasem, M. Ravi Shankar*
School of Engineering, 3700 O‟Hara Street, University of Pittsburgh, Pittsburgh, PA, 15261,
USA
Abstract
The interplay of large strain and large strain-rate during high rate severe plastic deformation
(HR-SPD) leads to dynamic temperature rise in situ that engenders a recovered microstructure
whose characteristics is not just a function of the strain, but also of the strain-rate and the
coupled temperature rise during the deformation. In this paper, we identify three classes of
microstructures characterized by multi-stage recovery phenomena, that take place during the
high strain-rate SPD of Cu. It is found that the first stage of this recovery is similar to the first
stage of static recovery which is characterized mainly by annihilation of dislocations. Second
stage starts around 360K and was characterized by dislocations getting arranged in tight cell
boundaries and eventually into sub-grain. Recovery stages were found to be followed by a stage
of grain growth and recrystallization when the temperature in the deformation zone approaches
480K.
Keywords: ultrafine grained materials, severe plastic deformation (SPD), dynamic recovery,
stored energy, high strain-rate
* Corresponding author ([email protected])

2
I. Introduction
Severe plastic deformation (SPD) in metallic systems is accompanied not only by grain
refinement which endows it with strength [1-4], but also by generation and organization of high
density of crystal defects. The energies stored in various configurations of these defects provide
the driving force for most observed recovery and recrystallization phenomena [5-9]. Dislocations
which contribute to most of this stored energy in severely deformed materials are mostly
integrated into grain boundaries, cell boundaries or complex entanglements that are prone to
annihilation in response to heating, resulting in microstructural transformation.
Most of the work on SPD, till date, has utilized very low strain-rates (~0.1/s to 10/s), except for
few recent works wherein strain-rates of the order of 103 were utilized [10-12] and resulted in
intriguing property combinations. One of these studies (Ref. 10) utilized dynamic plastic
deformation instead of SPD where they obtained high levels of plastic deformation through
repeated compressive deformation at high strain rates. While in the works mentioned in Ref. 11
and 12, we utilized high shear strain rates for SPD where strains of the order 3-5 and strain-rates
of the order of ~103 were obtained in one pass of deformation. The interplay of large shear
strains and high srain-rates and the supplementary effect of temperature rise near the deformation
zone that accompanies the high strain-rates, as modeled in our earlier work, gives rise to novel
microstructures and subsequently, enhanced material properties [11, 12]. We have shown that
high strain-rate SPD can lead to dense dispersion of nanotwins in low SFE material like brass
[11]. In the case of copper, we found that high strain-rate SPD and the accompanying flash
heating leads to bimodal grain size distribution with modes at 500nm and 2000nm [12]. Such
multimodality was shown to lead to a significant increase in ductility of these samples. The flash
3
heating in the deformation zone can, in addition, lead to temperature-induced-dynamic-recovery
which is a microstructural transformation process that takes place by annihilation of defects, and
hence can be expected to alter the stored energy and thus can be related to the changes in
microstructure.
Recovery and recrystallization phenomena have been studied extensively [13-18]. However,
most of these studies, including the ones for dynamic recovery, have focused on very low strain-
rate (~.01 to 1.0) and very high temperatures (> 400°C). In this study, we look at a altogether
different regime of strain, strain-rate and temperature which can induce interplays of recovery
and recrystallization phenomena leading to novel fine grained materials. The difference in the
present study from the earlier studies can be highlighted in following points: this study utilizes
(a) very high strain values – of the order of 3 and higher as compared to a max strain value of 0.5
in the above mentioned references (b) very high strain-rate– in the range of 200 to 4500/s as
compared to highest strain-rate of 20 /s in the earlier studies; (c) we do not heat the samples, but
there is an in situ temperature rise which was calculated to be always less than 300°C. These
parametric differences are also evident from the Z (Zener-Hollomon parameter) values
calculated for various studies (see Table 1). The highest Ln(Z) value for most of these earlier
studies is less than 13, except for the Hasegawa et al, while the lowest Ln(Z) values calculated
for our experiments is above 23, as mentioned in Table 1 and 2. Hasegawa et al. deformed
aluminum samples at room temperature and then studied the recovery ex situ by annealing these
samples at 180°C [14].
The scale of the deformed grain structures examined in this study is also very different from
earlier studies. SPD results in grains of the order of few hundred nanometers as compared to

4
polycryststalline and single crystalline samples used in earlier studies. It is important to note here
that the temperature induced microstructural transformation that we observe here, can neither be
classified as static recovery - which is the change in microstructure with time at a particular
temperature after some pre-strain, nor dynamic recovery – which is the change in microstructure
brought upon by increase in strain alone, during deformation process at a given temperature. The
“dynamic recovery” here is instigated by the rise in temperature caused by very high strain and
strain-rate that the material is subjected to, and hence can be termed as temperature-induced-
dynamic-recovery.
In this paper, we investigate the effect of in-situ heating resulting from large strain-rates on
severely deformed microstructures and its effect on the stored energy. We also relate the
microstructures with the variation in stored energy and this in turn enabled us to demarcate
different stages of recovery and recrystallization. To this end, we undertook an exploration of
thermomechanical deformation of copper across a wide-range of strains, strain-rates that involve
varying levels of exposure to in situ heating in the deformation zone in order to realize different
degrees of recovery and recrystallization.
II. Experimental Methods
Chip formation by machining emerged as our choice of method for severe plastic deformation
because of its versatility to impart large range of strain and strain-rate in a single deformation
pass in a range of material systems [19-25]. This allowed us to scan across wide ranges of strain-
rate (~101 – 10
3 /s) and strains while still creating fully-dense bulk samples that were still large

5
enough for reliable thermal and mechanical analysis. The magnitude of strains in the chip during
machining can be controlled by an appropriate choice of the rake angle of the cutting tool (α),
and the strain-rates are determined by the velocity of tool advance or the machining speed (V)
(see figure 1) [22]. The necessary control over strain and strain-rates were achieved through
appropriate choices of these parameters. We used a machining configuration as shown in Figure
1, with a depth of cut (DOC) value, which determines the width of the samples, as 3mm and feed
rate (f), which determines the thickness of the undeformed chip, as 0.17mm. This configuration
where the width is much larger than the undeformed chip thickness offers a plane-strain simple
shear configuration for imposing SPD across a range of strains, strain-rates and temperature
values [19, 22, 26].
A. Material System
We used commercially pure OFHC copper as our material system and annealed it at 700°C for
2hrs and subsequently machined it to create severely deformed chip samples using different rake
angles (0°, 20°) resulting in different shear strains, at three different machining speeds
(low=50mm/s, med=589mm/s and high=1274mm/s). The shear strain values were calculated
using the geometry of the final chip as described in Ref. [26]. The strain-rates can be calculated
directly from shear strain values and the machining speed as explained in Ref. [27]. In all, copper
was machined at 6 different conditions, here on referred to as a-low, a-med, a-high, b-low, b-med
and b-high. The „a‟ and „b‟ refer to two different rake angles used: 0° and 20° respectively. The
„low‟, „med‟ and „high‟ refer to the three different strain-rates utilized to obtain these samples.
The shear strain and strain-rate values for all these samples are listed in Table 2.

6
B. Mechanical testing
Hardness tests were conducted on all these samples using a Shimadzu microhardness tester
(HMV-2). The samples were put in epoxy mount and polished till 0.05μ alumina. A force of
490.3 mN was used for measuring the hardness values. A minimum of 10 measurements were
taken to find an average value and the standard deviation. The standard deviation was found to
be less than 6% for all samples.
C. Differential scanning calorimetry (DSC) analysis
For an array of these specimens, the stored energy of the samples was measured by conducting
Differential Scanning Calorimetry (DSC) using Perkin Elmer Diamond DSC system. The DSC
plots for various samples are shown in Figure 2. Samples in the shape of discs were prepared
whose diameter was 3-5mm and the thickness was 1-2mm. The samples were polished on SiC
paper and then stress relieved using an acidic solution composed of a suitable mixture of Nitric
acid, Acetic acid and Phosphoric acid to get rid of any surface deformation which may influence
the total energy released. The weight of most of the samples was between 20 to 40 grams which
was found to be optimum, after conducting several tests on samples of varying weights, for
measuring stored energy which is of the order of 1J/g. Standard aluminum pans were used to
encase the sample and empty aluminum pan was used as reference. In order to determine the
baseline, each sample was reheated at the same condition and the resulting heat flow was
subtracted from the original heat flow. This provided individual baseline for each sample, thus
ensuring high accuracy of the results. A detailed review of use of DSC for calculating stored
energy for SPD materials can be found in Ref. [28].

7
D. Electron Microscopy
Small discs of 3mm diameter were cut from the relevant samples to characterize using
transmission electron microscopy (TEM) in a JEOL 200-CX microscope. The samples were
prepared using double-jet electrolytic polishing machine in a Struers Tenupol-5 system.
Samples were also prepared for Orientation Imaging Microscopy (OIM) using EBSD. The
samples were prepared by polishing down to 0.1μ by hand and then put in vibratory polisher
with 0.05μ alumina solution for 1-2 hours for final polishing. OIM was carried out using Phillips
XL-30 system equipped with the EDAX-Ametek EBSD detector featuring a Hikari Camera and
TSL OIM software for data acquisition and analysis. All these images were taken using a step
size of 0.1μ and the scan size was 15μ X 15μ for each sample except for a-high sample for which
the scan size was 25μ X 25μ. We also used the TSL analysis software to measure the length of
regular (15°-180°) grain boundaries and sub-grain boundaries (2°-15°). We then calculated „f’ to
measure the length of sub-grain boundaries as a fraction of the total length of all boundaries.
E. Infrared Thermography
Infrared (IR) thermography was performed to measure the temperature rise and compare the
values with that predicted from our our model. We used a FLIR A325 camera which can
measure temperatures up to 400°C (~675K) for this purpose. The infrared camera was focused
on the middle of the deformation zone ahead of the tool tip in the plane-strain machining
configuration and the resulting images were utilized to calculate the temperature field. A typical
thermograph obtained while machining at 50mm/s using a rake angle of 40° is shown in Figure
3.

8
III. Results
The shear strain, strain-rates and the hardness values of all the samples considered are listed in
Table 2. It is also useful to note here that, in general, shear strains decrease with increasing rake
angle and tend to decrease with increasing strain-rate for a given rake angle. Since the shear
strain values are very high, it would be expected that the hardness values would be saturated and
all the samples would show similar hardness. We find an interesting anomaly in a-high and a-
med which show much lower hardness values than the rest of the samples. We will demonstrate
in the ensuing that this can be traced to in-situ flash heating during machining caused by
temperature rise at high strain-rates. Depending on the amount of temperature rise, recovery can
take place up to different stages and if the temperature rise is too high, material may dynamically
undergo sub-grain growth or recrystallization and result in substantial softening.
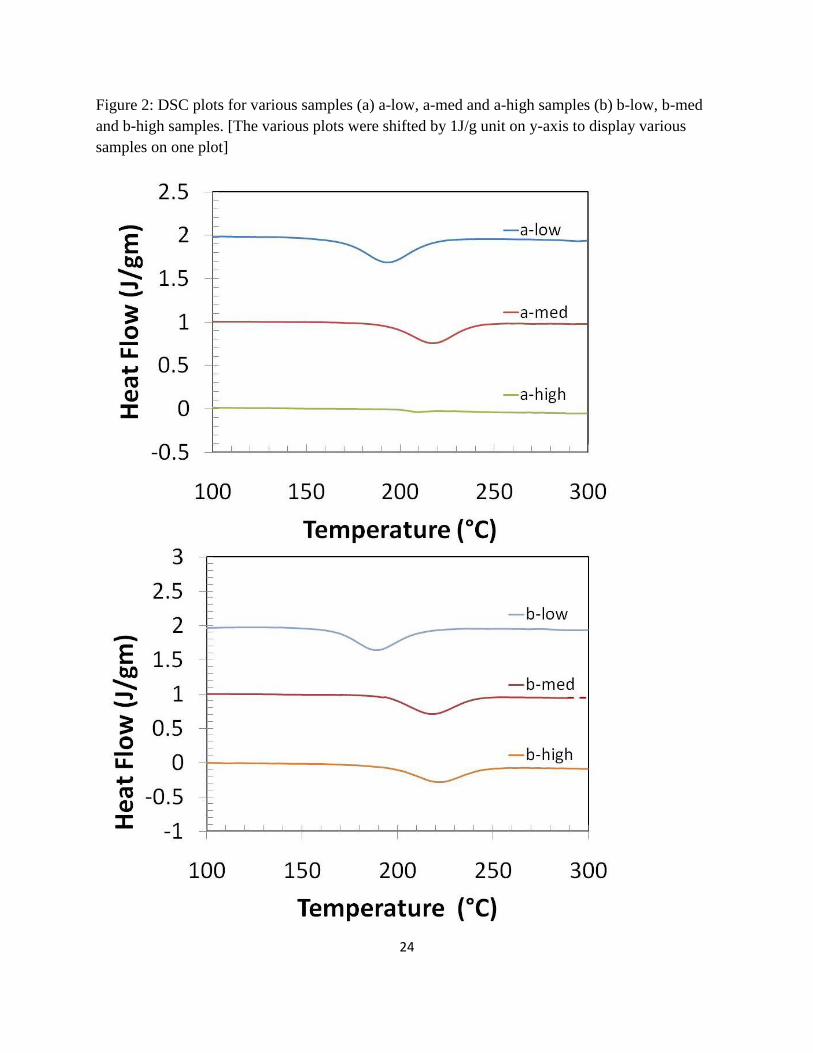
To examine the effect of this in situ temperature rise on the stored energy, we carried out DSC
on our samples over a temperature range of 50°-300° C. Energy values for all the copper samples
are also listed in Table 2 along with the peak temperature at which this energy was released. To
better visualize the data, we plotted the energy release observed in the various samples as a
function of hardness for the various samples in Figure 4. Here we find that stored energy is
highest for b-low sample, which also showed highest hardness value. The samples a-low, b-med
and b-high show comparable stored energies and comparably high values of hardness, while a-
med show a somewhat lower hardness value and a smaller stored energy. We also note from
Table 2 that stored energy value for a-high sample, which showed low hardness, is almost
negligible.

9
TEM images for all the samples are shown in Figure 5. We observe very high level of
refinements for a-low and b-low samples that are consistent with what might be expected from
imposition of high deformation shear strains at the low strain rates. On the contrary, we observe
moderate levels of refinement in a-med, b-med and b-high samples where, we observe
substantial dislocation networks and tangles. To acquire a more statistically significant sampling
of the microstructure across a wider length-scale we performed an EBSD analysis of the samples
(Figure 6). Here, we observe that the scale of the microstructure is generally in agreement with
what was observed in our TEM study. Additionally, we confirm that a-low and b-low samples
are indeed characterized by a preponderance of high-angle grain boundaries intermixed with a
small fraction (f) of low angle boundaries (f~0.3). On the other hand, the samples created at the
higher strain-rates (b-med, b-high and a-med) are characterized by a very high fraction of low
angle boundaries. Yet, we note the rather fine-scale of these low-angle boundaries in these
samples created at the high strain rates. This observation affords some rationalization of the
observed stored energies in the various samples that appears to decline with increasing
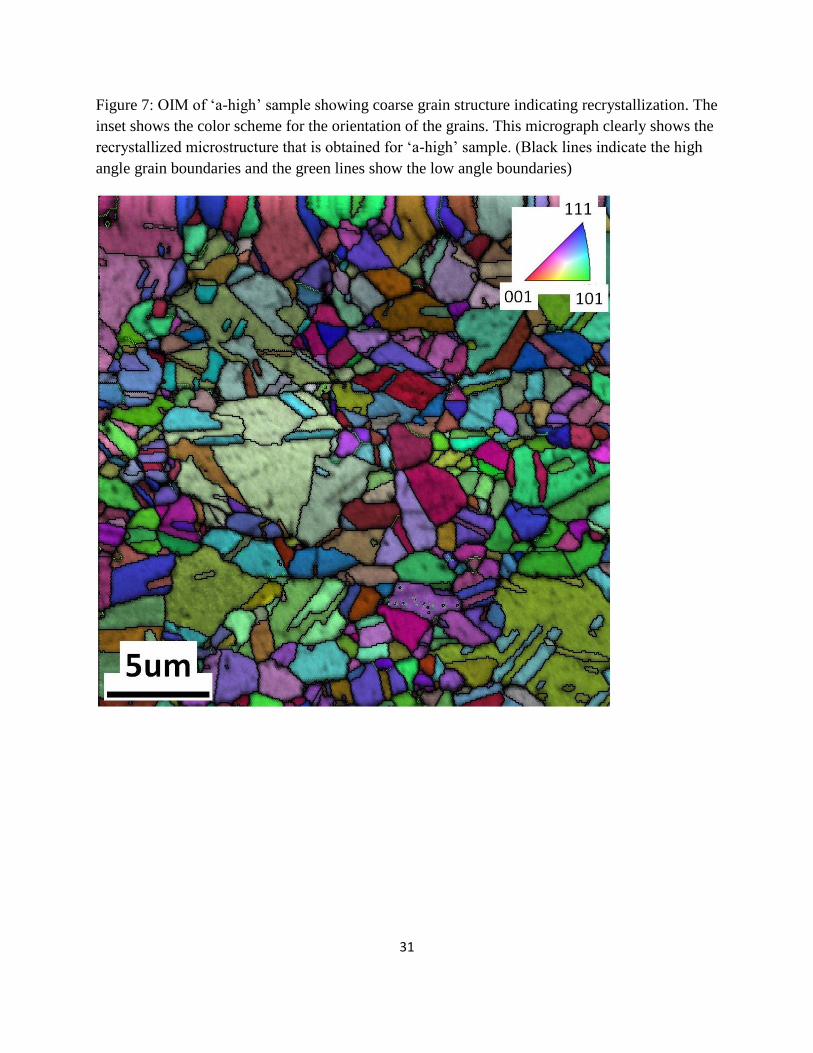
deformation rates with b-low > b-med > b-high and a-low > a-med > a-high. Figure 7 illustrates
the rather coarse grain structure in the a-high samples that indicate substantial recovery and even
recrystallization of the sample.
Additionally, we observed a dispersion of twins in the b-high sample that appeared to co-exist
amongst the network of the ultrafine high and low-angle boundaries. A typical HRTEM image
showing twin boundary in this sample is shown in Figure 8a. The inset shows the fast-fourier-
transformation (FFT) pattern obtained for this image and masks were used to obtain inverse-FFT
to reveal the twin boundary as shown in Figure 8b. Note the rather pristine structure of these
twins in this image.

10
IV. Discussion
The behavior of plastic deformation systems for a given material and prior microstructure is
expected to be controlled by the interactive effects of shear strain, strain-rate and the temperature
in the primary deformation zone ahead of the tool tip. In this study, we examined SPD at a range
of strain rates in samples that were nominally deformed at room temperatures, even though the
temperature in the deformation zone is expected to be elevated. Here, the temperature in the
deformation zone is not an independent variable, but a function of the shear strain and the strain
rate. And, we can intuitively foresee that higher the shear strain and the strain-rate, higher the
temperature in the deformation zone and vice-versa. However, the temperature in the
deformation zone also modifies the constitutive behavior, thus interacting with the
accommodation of the shear strain and the strain-rates, and manifesting the myriad of resulting
deformed microstructures and associated thermomechanical property combinations.
Capturing these interactions is crucial for rationalizing our experimental results. To this end, we
utilized a machining model due to Weiner that is based on the moving heat source principles
[26]. The deformation zone temperature in machining depends primarily on (a) ratio of primary
flow stress to heat capacity, (b) deformation shear strain and (c) thermal number „α‟, which is
defined as *4/)tan..( fV where „ f ‟ is the feed rate (or the undeformed chip thickness) in
machining, is the primary shear plane angle, is the thermal diffusivity of the material and
V is the speed of machining that is also directly proportional to the strain rate in machining. It
has been shown that temperature rise in the deformation zone ΔT is given by Ref. [26]:
)/(*)1( ckT , where is the partition parameter that determines fraction of heat taken
away by the bulk work piece, k the shear-flow stress, the deformation shear strain imposed

11
during machining and )( c is the heat capacity of the work material. Heat capacity )( c , of
copper was taken as 3.45 MJ/m3 [29]. can be estimated using equation given by Weiner [30]:
)2
1()1(
4
1
e
erfcerf , where is the thermal number. Shear flow
stress, k , can be calculated from 3/k , where is the tensile strength. However, this flow
strength is itself a function of shear strain and strain-rate and also the temperature in the
deformation zone. This effect is reasonably captured by material models such as the Johnson and
Cook (JC) equation [29]: ]1][ln1][[ ** mn TCBA , where 0
* / is the
dimensionless plastic strain rate, 1
0 0.1 s and T* is defined as 293293* mpTTT . A, B, n,
C and m are five material constants which were obtained empirically and their values are
A=90MPa, B=292MPa, n=0.31, C=0.025 and m=1.09 for copper [29]. JC model provides good
strain-rate dependence of stress at moderately high temperatures and high strain-rates, which is
where our experimental results are expected to lie. These two models (Weiner model for
temperature calculation [30] and JC model [29] for stress calculation) setup a
thermomechanically coupled problem where we need to know the temperature rise to calculate
the shear strength values, which in turn is required to calculate the temperature rise. The
equations for ΔT(σ, ε, ε ) and σ(ΔT, ε, ε ) can be solved using recursive iteration, the flowchart for
which is shown in Figure 9. The first run of the iteration begins with an initial guess of the
temperature rise. Then we use this temperature rise to calculate the homologous temperature and
then used the JC model to calculate the shear stress and subsequently the temperature rise using
the moving heat source model. This temperature rise is then used to compute the error between
the guessed temperature rise and the calculated temperature rise. Subsequently, regression is

12
used to improve the guess until the error between the temperature rise input into the Johnson-
Cook model and that calculated from the moving heat source model converge to a sufficiently
small value. Using this approach we calculated the temperature rise (ΔTJC) and the shear flow
stress in the deformation zone ( k ) for the various SPD conditions in Table 2. Note that much of
this temperature rise primarily occurs in the deformation zone and during the transit through the
deformation zone, the material is subjected to this flash heating following which it cools very
rapidly. ΔTJC value was also calculated for the machining condition for which infrared
thermography was done (rake =40°; speed = 50mm/sec) and was found to be 40.5° C, hence the
expected temperature in the deformation zone would be T=293 + ΔTJC = 333.5 K. In the
thermograph shown in Figure 3, we see that the temperature in the deformation zone is 324 K
which is very close to the calculated value. This result reinforces our expectation that this
methodology can be used to accurately model the temperature rise and shear strength for a given
machining condition.
We note that we are considering the strain-rate and temperature rise due to the primary
deformation zone alone and the secondary effect due to frictional heating at the tool-chip
interface has been ignored. It has been demonstrated that the effect of frictional heating scales
with the cutting speed (V) and that it is has an effect on the deformation zone temperature at
speeds much higher than those considered here [26]. It is important to point out that for the
temperature field in Figure 3, the camera is focused on the deformation zone, ahead of the tool-
tip and the comparison between the model and the measurement is valid exclusively for this
zone. Further away from the deformation zone, outside the focal region of the camera, it may be
misleading to interpret the results to elucidate the characteristics of the thermomechanical

13
deformation field. Still, it is noteworthy that even in the vicinity of the focused zone ahead of
the tool we do not observe any significant “hot spots” due to secondary frictional heating at the
tool-chip that approach the temperature rise due to the SPD. This is in line with the expectation
that for the deformation speeds considered here, the contribution from frictional heating is small.
This model now enables us to calculate deformation zone temperature for a range of shear strain
and strain-rates in machining to then identify the regions to which the various samples belonged
to (Figure 10). The horizontal axis is the strain-rate plotted on a logarithmic scale in order to
cover a large range of strain-rates and the vertical axis represents the shear strain values. The six
sample conditions that were used in our experiments are also shown on the plot. Colored bands
depict expected temperature in the deformation zone for the given shear strain and strain-rate
conditions and these values increase monotonically as we go towards top-right corner of the map
where both shear strain and strain-rates are high. The various stages in this figure are demarcated
in the context of the DSC results as delineated subsequently.
In order to understand temperature rise of the various samples in context of the stored energy, we
plotted stored energy as a function of temperature rise (Figure 11). It is immediately apparent
that the variation of the stored energy with the deformation zone flash heating temperature
collapses to a single curve, which has been drawn schematically and superimposed on this figure.
Further, in order to find the extent of the different stages of recovery on this plot, we looked at
the stored energy, hardness values and temperature rise of these samples as listed in Table 1. We
see that sample „a-high‟ which showed a very low hardness value and a very high temperature
rise has almost negligible stored energy. The negligible energy value implies that this sample

14
underwent complete recovery process and experienced full microstructural transformation. This
was confirmed by OIM micrograph obtained for this sample (Figure 7) which showed very
coarse grains, which is in contrast to the ultra-fine grains expected at the shear strain values to
which this sample was subjected. The temperature rise for this sample that was calculated from
our iterative method is indicated in Table 1 as ~263° C, the highest among all the samples. We
therefore conclude that this sample was subjected to a high dynamic temperature rise in the
deformation zone that entailed its nearly complete recrystallization and hence the observed
softening, despite the otherwise high level of SPD. This corresponds to the stage III in Figures 10
and 11.
We note from Table 2 and Figure 4 that hardness values of „b-low‟ is high and so is the stored
energy. Moreover, the calculated temperature rise in the deformation zone from Table 1, for this
sample is quite modest ( ~75°C). Under the slow strain rate conditions, it is thus unlikely that
these samples have undergone any significant recovery. Hence, it can be interpreted that this
sample is in the first stage of recovery process which is similar to the first stage of static recovery
where nominal annihilation of dislocations occur due to thermal agitation. This level of recovery
is demarcated as Stage I in Figures 10 and 11. This would also imply that the deformation of this
sample is similar to other slow strain-rate SPD of Cu, like ECAP and we find evidence of this in
the stored energy observed for SPD of Cu obtained by other slow strain-rate processes which
were comparable to that in the present study [10, 31, 32, 33]. The „a-low‟ sample shows a
relatively higher temperature rise (~101°C) than „b-low‟ sample and also has lower energy
compared to it. It can be extrapolated that this sample condition is in Stage-II of the recovery
process. Furthermore, we see from Table 2 that „b-med‟ sample shows very high strength and
moderate temperature rise (~165°C), however, the stored energy in this sample (1.1 J/g) is still

15
comparable to the „a-low‟ sample (1.1 J/g), implying that the in situ thermal agitation in „b-med‟
sample is insufficient for causing rampant recovery or coarsening. So, we can surmise that this
sample is likely in stage-II of recovery. The „b-high‟ and „a-med‟ samples show a relatively high
temperature rise (~201°C and ~223°C respectively) in Table 1, however, the hardness values of
„a-med‟ is significantly lower than the hardness value of „b-high‟, even though the shear strain
values of „a-med‟ is about twice that of „b-high‟. The energy stored in sample „a-med‟ (0.8J/g) is
also significantly lower than the energy stored in sample „b-high‟ (1.0J/g). It can be extrapolated
from these values that the dynamic recovery of „b-high‟ sample is somewhere in the vicinity of
end of stage-II while recovery for „a-med‟ went past stage-II and into the grain-growth regime
leading to its softening. Based on these arguments we demarcate the expected range of the
different recovery stages, which is superimposed on Figures 10 and 11.
Rationalizing the levels of dynamic recovery in the various samples becomes clearer once the
resulting microstructure is also considered. The TEM micrograph for „b-low‟ sample, shown in
Figure 5a, clearly reveals the presence of disorganized dislocation accumulation inside numerous
grains and is pointed out by the arrows. The low temperature rise in this sample does not allow
much mobility to these dislocations and hence a random distribution. The „b-med‟ samples, on
the other hand, which were exposed to a moderately high temperature-rise, would be expected to
have some cell-wall formation from increased mobility of these dislocations and we do see
evidence for this in the TEM micrograph of this sample shown in Figure 5c. Clearly, the
increased temperature causes some re-ordering of the dislocations into more organized cell-
walls. The „a-low‟ samples (in Figure 5b) show a mix of dislocation and some cell-wall
formation, confirming the suggestion that the recovery of this sample just went past Stage-I into
Stage-II. The „b-high‟ sample shows the formation of relatively sharp sub-grain boundaries in the

16
micrograph shown in Figure 5d. The „a-med‟ sample which experienced a little higher
temperature than „b-high‟ shows a distinctively recovered microstructure, accompanied by
moderate grain growth. These micrographs, in effect, show the evolution of a microstructure
through different stages of recovery.
The progress through various recovery stages can also be followed in the Image Quality (IQ)
map obtained by EBSD, as shown in Figure 6, for five different samples (b-low, a-low, b-med,
b-high, a-med), which lie in three different stages of the recovery process and the eventual grain-
growth regime. The dark lines (black) in the figures depict regular grain boundaries which have
misorientation >15° while the light lines (green) depict sub-grain boundaries for which we used a
misorientation between 2° and 15°. With increasing recovery, more and more dislocations
rearrange to form cell-walls and sub-grains, so we expect to see an increase in low angle
boundaries from Stage-I through Stage-II which is clearly evident in images from Figure 6a
(Stage-I) through Figure 6d (end of Stage-II) by increasing density of green lines. Furthermore,
beyond this stage, grains start to grow, and here we expect to see a decrease in the density of
these sub-grain boundaries. In Figure 6e which shows IQ map for a-med sample, which
purportedly lies in Stage-III of grain growth and recrystallization, we observe significantly fewer
of these green lines compared to Figure 6d. We found that there was a monotonous increase in f -
the fraction of low angle boundaries, from Figure 6a and b through Figure 6d which represent
Stage-I through Stage-II of recovery. The relatively lower value of f for sample b-low in Figure
6b can be understood from the fact that this sample is very close to the beginning of Stage-II and
hence significant cell-wall formation has not taken place, yet. We also saw a significant drop in
this ‘f’-value for „a-med‟ sample in Figure 6e, which again goes on to show that recovery in this

17
sample went past Stage-II and entered into the grain-growth regime, thereby reducing the density
of sub-grain boundaries.
The b-high sample shows a relatively high strength for a sample which purportedly lies near the
end of Stage-II, where we expect grain growth to begin and hence softening to set in. This higher
strength of the b-high sample-condition can also be attributed to the presence of twins as
revealed by HRTEM analysis, shown earlier in Figure 8. Dense dispersion of twins is known to
provide improved multifunctional characteristics to the material, from improved strength to
enhanced ductility [34-40]. Initially, we were surprised to observe the presence of twins even
amongst the rampant presence of dislocation structures in the moderately high SFE Cu,
particularly at high temperature expected in the deformation zone. To rationalize this
observation, we utilized the constitutive model for slip-twinning transition formulated by Meyers
et al. which shows that twins can be formed in Cu, albeit, at relatively large shear strains and
high strain-rates [41].
In order to confirm this, we plotted (see Figure 12) the stresses required for twin formation and
that for slip-dislocations for different shear strain values and used the strain-rate found for
sample b-high, i.e. 3300/s. We also ensured that we calculate the temperature for each
combination of shear strain and strain-rate considered in this plot using our iterative approach,
instead of using a constant temperature as used in the plots in Ref [41]. This is crucial because
the stress required for slip is given by [41]: 2/1
432 )lnexp( dkCTCC s
n
G , where
G =46.5MPa, C2=890MPa, C3=0.28 X 10⁻³
K-1
, C4=1.15 X 10⁻⁴
K-1
, n=0.5 and ks=5 MPa.mm1/2
.
And, this contains a strong thermal component, which in our thermomechanically coupled
machining framework varies with shear strain and strain-rate and hence needs to be explicitly

18
considered. Since the twin formation is an athermal process, it was plotted as a horizontal line in
the Figure 12 depending only on the grain-size with a grain size dependent twinning stress given
by [41]: 2
1
0
dkTTT , where T0 =300MPa and kt=21.6MPa.mm1/2
. The stress values for
yielding and twinning was found to be strongly dependent on the grain size, hence we drew plots
for various initial grain sizes varying from 1.25µ to 0.5µ (see Figure 12). We observe a grain size
dependent stress for thermally activated slip which is generally smaller than the stress required
for twinning at the smaller shear strain levels. As the shear strain values increase, we find a
transition point beyond which twinning stress becomes smaller than the stress for slip and under
these conditions, twinning can become feasible.
In chip formation by machining, microstructure refinement occurs gradually across the
deformation zone wherein the microcrystalline material is transformed into a nanostructured
material in a single deformation pass. It has been shown that the deformation zone wherein this
transformation occurs is fan-shaped wherein the material is incrementally subjected to increasing
levels of shear strain [22]. It has also been demonstrated that in the initial parts of this fan shaped
deformation zone, the strain-rates are smaller and the strain rates become progressively more
intense.
In the initial parts of the fan shaped deformation zone, the accumulated shear strain values are
smaller and the level of refinement of the microstructure is also expected to be marginal. In this
early stage of deformation, suppose the microstructure was already refined to a grain size of 0.5
microns, no amount of shear strain can result in twin formation (Figure 12). However, if the
grain sizes in the initial sections of the deformation zone are only refined to say ~1.0 micrometer
in size, then from Figure 12, only a shear strain close to 3.2 is required to produce twins. Now,

19
past the initial marginal levels of deformation, the progressive straining in the b-high sample can
certainly reach these levels of shear strain in the more intense regions of the deformation zone
where the strain rates are also much higher. Thus, enabling the transition from slip to twinning in
accordance with the calculation illustrated in Figure 12. In our earlier work, we have shown that
sample condition b-high results in bimodal grain size distribution and a number of grains which
are greater than 1.0 microns were observed in the chip microstructure. It is plausible that
twinning occurred in these larger grains [12]. Additionally, it is likely that the twins also
contribute to the increased strength in the b-high sample.
V. Conclusions
Chip formation in machining was used to subject Cu to an array of large plastic shear strains at a
range of strain rates with an objective of understanding the effect of strain rate on the stored
energy of the system and its microstructure. The resulting materials were found to possess stored
energies that were found to be a function of the in situ dynamic heating that occurs in the
deformation zone as an outcome of the applied shear strain and strain-rate. Samples which
experienced low temperature rise were found to lie in the first stage of recovery which resulted in
nominal change in microstructure and stored energy. Second stage of recovery was found to start
around 360K and samples in this stage were characterized by formation of cell walls and sub-
grain boundaries with a slight decrease in stored energy. Third stage of the recovery was found
to start near 480K and was characterized by grain growth for samples very close to this
temperature while those subjected to much higher temperature were found to show signs of
complete recovery or recrystallization. The b-high sample which lies near the end of Stage-II

20
retained its hardness even though the samples just-into Stage-III showed substantial softening.
This was rationalized by the presence of twins along with the dislocation structures, which can
also contribute to the higher strength in this sample condition.
VI. Acknowledgements
We would like to acknowledge support from the National Science Foundation (Awards 0826010,
0856626, 0927410) and the Nuclear Regulatory Commission (Faculty Development Grant). We
also thank the Department of Mechanical Engineering and Materials Science for the provision of
access to the electron microscopy instrumentation and for assistance with the execution of this
part of our research.

21
Table 1: Zener Hollomon parameter for earlier studies on recovery and recrystallization of
copper.
T(K) Q/RT LnZ
Hasegawa et al. 2.20E-04 -8.42188 293 29.76019079 21.33831
Petkovic et al. 1.80E-03 -6.31997 723 12.06049226 5.740524
1.80E-02 -4.01738 773 11.2803828 7.262999
8.00E-02 -2.52573 813 10.72538241 8.199654
Sample et al. 5.00E-03 -5.29832 973 8.961701851 3.663384
1.58E-01 -1.84516 973 8.961701851 7.116542
5.00E-03 -5.29832 1073 8.126501306 2.828184
5.00E-02 -2.99573 873 9.988242728 6.99251
2.00E-02 -3.91202 873 9.988242728 6.07622
2.00E-01 -1.60944 873 9.988242728 8.378805
2.00E+00 0.693147 873 9.988242728 10.68139
2.00E+01 2.995732 873 9.988242728 12.98398
2.00E-01 -1.60944 723 12.06049226 10.45105
2.00E-01 -1.60944 668 13.05349686 11.44406
2.00E-02 -3.91202 773 11.2803828 7.36836
2.00E+00 0.693147 873 9.988242728 10.68139
2.00E-01 -1.60944 973 8.961701851 7.352264
Gottstein et al 5.00E-04 -7.6009 673 12.95651694 5.355614
Luton et al. 1.80E-02 -4.01738 773 11.2803828 7.262999
1.80E-03 -6.31997 723 12.06049226 5.740524
8.00E-02 -2.52573 813 10.72538241 8.199654

22
Table 2: SPD shear strain (γ), strain-rate, resulting hardness values, stored energy from
differential scanning calorimetry (ΔH), temperature value for peak energy release during
differential scanning calorimetry, and dynamic temperature rise in the deformation zone (ΔTJC)
and shear flow stress in the deformation zone (κ) calculated using Johnson and Cook model by
recursive iteration for various samples that were examined. (“a” samples were obtained using a
rake angle of 0° while “b” samples were obtained using a rake angle of 20°)
Sample γ Strain-rate (s-1)
κ (JC shear flow stress) [MPa]
ΔTJC
(°C) Hardness (kgf/mm2)
Δ H (J/g)
Peak Temp (°C) Ln(Z)
a-low 15.1 60 451 101 154 1.1 191.7 26.2
a-med 10.2 1000 382 223 147 0.8 215.4 23.8
a-high 8.5 2500 355 263 109 ~0 207.5 23.5
b-low 10.3 80 418 75 163 1.2 198.8 28.1
b-med 6.7 1350 365 165 161 1.1 215.3 26.2
b-high 5.8 3300 345 201 159 1.0 217.7 25.8
Br40H

23
Figure 1: Machining configuration and various parameters associated with machining. The „chip‟
coming out of machining makes the sample.
24
Figure 2: DSC plots for various samples (a) a-low, a-med and a-high samples (b) b-low, b-med
and b-high samples. [The various plots were shifted by 1J/g unit on y-axis to display various
samples on one plot]

25
Figure 3: Infrared thermograph for machining of copper on a linear setup using a rake angle of
40° at a speed of 50mm/sec Most of the temperature rise is concentrated in the region ahead of
the tool tip which underscores the fact that primary deformation zone is the main contributor to
temperature rise in the material and the chip.

26
Figure 4: Hardness plotted against the stored energy for various copper samples. The top left
quadrant designates materials with high strength and low stored energy. Top Right quadrant
shows materials with high strength, but high stored energy, eg nanostructured materials. Bottom
left quadrant shows material with low strength and low stored energy, eg. the usual
polycrystalline materials. Bottom right quadrant is for materials with low strength and high
stored energy.

27
Figure 5: TEM micrographs for (a) b-low: arrows point to random distribution of dislocations
indicating stage-I of recovery; (b) a-low: arrows indicate to the presence of dislocations and cell
walls that start to form in this samples are also visible (c) b-med: arrows point to cell walls
indicating stage-II of recovery; (d) b-high; arrows point to sub-grain walls indicating later stages
of stage-II of recovery; (e) a-med: illustrating much larger grains indicating grain growth
occurring in stage-III.

28

29
Figure 6: Image Quality maps obtained by EBSD to show the variation in fraction of low angle
boundaries along various stages of recovery (a) b-low sample in stage-I; (b) a-low sample which
has just entered stage-II; (c) b-med sample in stage-II; (d) b-high sample near the end of stage-II;
(e) a-med sample in stage-III. The black lines indicate the regular grain boundary (>15°), while
the green lines indicate the low angle boundaries (2°-15°). f is fraction of low angle boundaries.
[step size = 0.1μ] There is a gradual increase in the low-angle boundary fraction f from a-low and
b-low sample through b-med and finally to b-high sample. However, there is a sudden drop in
the f-value for a-med sample.

30
31
Figure 7: OIM of „a-high‟ sample showing coarse grain structure indicating recrystallization. The
inset shows the color scheme for the orientation of the grains. This micrograph clearly shows the
recrystallized microstructure that is obtained for „a-high‟ sample. (Black lines indicate the high
angle grain boundaries and the green lines show the low angle boundaries)

32
Figure 8: HRTEM image of sample b-high, showing twin boundary. (a) bright field image along
with the FFT pattern in the inset; (b) Inverse FFT image obtained from the FFT-diffraction
pattern, using the mask shown in the inset.

33
Figure 9: Flowchart to show the calculation of temperature rise (ΔT) and shear stress (σ) by
recursive iteration process.

34

35
Figure 10: Color-coded map showing the various parameters that influence the final
microstructure: shear strain, strain-rate and the temperature in the deformation zone (293 + ΔT),
where ΔT was calculated using recursive iteration. Various samples used in the study are shown
on the plot. (The temperature values are in Kelvin.)

36
Figure 11: Variation of stored energy with respect to temperature rise ΔT is plotted along with a
schematic depiction of three stages of recovery and eventual sub-grain growth regime.

37
Figure 12: Stresses required for twin formation and slip-dislocation and their transition point as a
function of shear strain, for various initial grain sizes. The solid lines describe the stress required
for yielding and the dashed lines describe the stress required for twinning for a given initial-grain
size. The circles mark the transition point from slip-dislocation to twin formation. (strain-rate =
4500 s-1
, same as that for sample b-high.)

38
References:
[1] V.L. Tellkamp, A. Melmed and E.J. Lavernia, Mechanical behavior and microstructure of a
thermally stable bulk nanostructured Al alloy, Metall. Mater. Trans. 32A (2001) 2335-2343.
[2] R.Z. Valiev, I.V. Alexandrov, Y.T. Zhu and T.C. Lowe, Paradox of strength and ductility in
metals processed by severe plastic deformation, J. Mater. Res. 17 (2002) 5-8.
[3] K. Tao, H. Choo, H. Li, B. Clausen, J. Jin and Y. Lee, Transformation-induced plasticity in
an ultrafine-grained steel: An in situ neutron diffraction study, Appl. Phys. Lett. 90 (2007)
101911.
[4] C.J. Youngdahl, J.R. Weertman, R.C. Hugo and H.H. Kung, Deformation behavior in
nanocrystalline copper, Scripta Mater. 44 (2001) 1475-1478.
[5] F.J. Humphreys and M. Hatherly, Recrystallization and Related Annealing Phenomena,
second Ed., Elsevier, Oxford, 2004.
[6] F.J. Humphreys, A unified theory of Recovery, Recrystallization and grain growth, based on
the stability and growth of cellular microstructures –I. The Basic Model, Acta Mater., 45 (1997),
4231-4240.
[7] Carpenter H.C.H. and Elam C.F, Crystal Growth and Recrystallization in Metals, J. Inst.
Met., 24 (1920), 83-131.
[8] Alterthum, H., Zur Theorie der Rekristallisation, Zeitschrift fur Metallkunde, 14 (1922) 417-
424.
[9] M. B. Bever, D. L. Holt and A. L. Titchener, The stored energy of cold work, Progress in
Materials Science, 17 (1973) 5-177.
[10] Y.S. Li, Y. Zhang, N.R. Tao and K. Lu, Effect of the Zener–Hollomon parameter on the
microstructures and mechanical properties of Cu subjected to plastic deformation, Acta Mater. 57
(2009) 761-772.
[11] J. Cai, S. Shekhar, J. Wang and M.R. Shankar, NanoTwinned Microstructures from Low
Stacking Fault Energy Brass by High-Rate Severe Plastic Deformation, Scripta Mater. 60 (2009)
599-602.
[12] S. Shekhar, J.Cai, J.Wang and M.R. Shankar, Multimodal Ultrafine Grain Size Distributions
from Severe Plastic Deformation at High Strain Rates, Mat. Sci & Engg. A 527 (2009) 187-191.
[13] G. Gottstein and U.F. Kocks, Dynamic recrystallization and dynamic recovery in <111>
single crystals of nickel and copper, Acta Met., 31 (1983) 175-188.

39
[14] T. Hasegawa and U.F. Kocks, Thermal Recovery processes in deformed aluminum, Acta
Met., 27 (1979) 1705-1716.
[15] R.A. Petkovic, M.J. Luton and J.J. Jonas, Recovery and Recrystallization of polycrystalline
copper after hot working, Acta Met., 27 (1979) 1633-1648.
[16] V.M. Sample, G.L. Fitzsimons and A.J. DeArdo, Dynamic softening of copper during
deformation at high temperatures and strain rates, Acta Met., 35 (1987) 367-379.
[17] M.J. Luton, R.A. Petkovic and J.J. Jonas, Kinetics of recovery and recrystallization in
polycrystalline copper, Acta Met., 28 (1980) 729-743.
[18] G. Gottstein, D. Zabardjadi and H. Mecking, Dynamic recrystallization of tension-deformed
copper single crystals, Met. Sci. (1979) 222-227.
[19] S. Swaminathan, M. Ravi Shankar, S. Lee, J. Hwang, B.C. Rao, A.H. King, S.
Chandrasekar, W.D. Compton and K.P. Trumble, Large Strain Deformation and Ultra-Fine
Grained Materials by Machining, Mater. Sci. Eng. A 410–411 (2005) 358-363.
[20] Y. Uluca, M. Ravi Shankar, J.B. Mann, B.C. Rao, S. Chandrasekar and W. Dale Compton,
Nanocrystalline Materials from Aerospace Machining Chips, Society of Automotive Engineers
(SAE) Trans – J. Aerospace 2005-01-3306 (2005) 994-998.
[21] M. Sevier, S. Lee, M. Ravi Shankar, H.T.Y. Yang, S.Chandrasekar and W.D. Compton,
Deformation Mechanics Associated with Formation of Ultra-Fine Grained Chips in Machining,
Mater. Sci. Forum 503–504 (2006) 379-384.
[22] S. Lee, J. Hwang, M. Ravi Shankar, S. Chandrasekar and W.D. Compton, Large-Strain
Deformation Field in Plane-Strain Machining, Metall. Mater. Trans. A 37 (2006) 1633-1643.
[23] T.G. Murthy, C. Huang, M.R. Shankar, S. Chandrasekar, K.P. Trumble and J.P. Sullivan,
Temperature Field in Severe Plastic Deformation at Small Strain Rates, Mater. Sci. Forum 584–
586 (2008) 231-236.
[24] M. Ravi Shankar, B.C. Rao, S. Lee, S. Chandrasekar, A.H. King and W.D. Compton,
Severe Plastic Deformation (SPD) of Titanium at Near-Ambient Temperature, Acta Mater. 54
(14) (2006) 3691-3700.
[25] S. Swaminathan, M. Ravi Shankar, B.C. Rao, A.H.King, S. Chandrasekar, W.D. Compton
and K.P. Trumble, Large Strain Deformation and Nanostructured Materials by Machining, J.
Mater. Sci. 42 (2007) 1529-1541.
[26] T. Childs, K. Maekawa, T. Obikawa and Y. Yamane, Metal Machining: Theory and
Applications, first ed., Arnold, London (copublished by John Wiley & Sons, New York–
Toronto) 2000.

40
[27] S. Lee, Direct Measurements of Severe Plastic Deformation in Machining and Equal
Channel Angular Pressing, Ph.D. Thesis, Purdue University, West Lafayette, 2006.
[28] Gao Nang, Starink M.J. and Langdon T.G., Using Differential Scanning Calorimery as an
analytical tool for ultrafine-grained metals processed by Severe Plastic Deformation, Materials
Science and Technology 25 (2009) 687-698.
[29] G.R. Johnson and W.H. Cook, A constitutive model and data for metals subjected to large
strain rates and high temperatures, Proceedings of the Seventh International Symposium on
Ballistics, The Hague, The Netherlands, (1983) 541–547.
[30] J.H. Weiner, Shear-plane temperature distribution in orthogonal cutting, Trans. ASME 77
(1955) 1331-1341.
[31] H. Jiang, Y. T. Zhu, D.P. Butt and I.V. Alexandrov, T.C. Lowe, Microstructural evolution,
microhardness and thermal stability of HPT-processed Cu, Mat. Sci. and Engg. A290 (2000)
128-138.
[32] K. Han, R.P. Walsh, A. Ishmaku, V. Toplosky, L. Brandao and J.D. Embury, High strength
and high electrical conductivity bulk Cu, Phil. Mag. 84 (2004) 3705-3716.
[33] Y.S. Li, Y.Zhang, N.R. Tao and K.Lu, Effect of thermal annealing on mechanical properties
of a nanostructured copper prepared by means of dynamic plastic deformation, Scripta Mat. 59
(2008) 475-478.
[34] E. Ma, Y.M. Wang, Q.H. Lu, M.L. Sui, L. Lu and K. Lu, Strain hardening and large tensile
elongation in ultrahigh-strength nano-twinned copper, Appl. Phys. Lett. 85 (2004) 4932-4935.
[35] L. Lu, R. Schwaiger, Z.W. Shan, M. Dao, K. Lu and S. Suresh, Nano-sized twins induce
high rate sensitivity of flow stress in pure copper, Acta Mater. 53 (2005) 2169-2179.
[36] Y.S. Li, N.R. Tao and K. Lu, Microstructural evolution and nanostructure formation in
copper during dynamic plastic deformation at cryogenic temperatures, Acta Mater. 56 (2008)
230-241.
[37] W.S. Zhao, N.R. Tao, J.Y. Guo, Q.H. Lu and K. Lu, High density nano-scale twins in Cu
induced by dynamic plastic deformation, Scripta Mater. 53 (2005) 745-749.
[38] J.W. Christian and S. Mahajan, Deformation Twinning, Prog. Mater. Sci. 39 (1995) 1-157.
[39] C.J. Youngdahl, J.R. Weertman, R.C. Hugo and H.H. Kung, Deformation behavior in
nanocrystalline copper, Scripta Mater. 44 (2001) 1475-1478.

41
[40] L. Lu, Y.F. Shen, X.H. Chen, L.H. Qian and K. Lu, Ultrahigh strength and high electrical
conductivity in copper, Science 304 (2004) 422-426.
[41] M.A. Meyers, O. Voehringer and Y.J. Chen, A constitutive description of the slip-twinning
transition in metals, in: S. Ankem and C.S. Pande (Eds.), Advances in twinning, Minerals, Metals
& Materials Society, Warrendale (PA), 1999, pp. 43–65.