effect of speed and braking load on the wear phenomena of
TRANSCRIPT

Dec 2015, vol 12, No. 2Journal of Occupational Safety and Health
49
Introduction
Currently, Motorcycle factory grows up, their technology and engine power. In Motorcycle, braking system is a vital factor in the safety of motorcyclists. High braking system is should be cover the power, speed and motorcycle load. The most important component in the braking system is brake pad. It used to decelerate the vehicle speed in all transportation sectors. Brake pad has 90% of safety factor while riding motorcycle (Waskito 2008). High efficiency of brake pad is influenced by friction coefficient, hardness and brake pad material. When the brake pad is too hard, it will ruin the brake drum and when the brake pad is too soft, it will effect to the life time of brake pad. Therefore, need to select the material which state in the optimum range of friction coefficient and hardness. The current technology selects the non-asbestos material as brake pad based material because minimum health hazard as compared to asbestos and synthetic (Gurunath 2007). Nowadays, the wear of brake pad is becoming a high issue to solve (Ostermeyer 2001). Wear is not the initial properties of the material, but it appears cause the surface contact (Setiyanto 2009). Wear is also influenced by speed and braking load when driving a motorcycle (Waskito 2008, Setiyanto 2009). Currently, wear is occurred too fast which caused by uncertain braking load. Commonly speed used by motorcyclists is in the range of 50 - 70 km/h. Meanwhile, the braking load used is depending on the condition and braking distance when driving a motorcycle (Waskito 2008, Setiyanto 2009, Dewanto 2008). That correlation is not fully investigated by many researchers. Therefore, in this research will investigate the effect of the speed and braking lad on the wear phenomenon and it will
correlate to the lifetime of the brake pad. The material used in genuine part of brake pad is non-asbestos in Honda motorcycle. Honda is the most manufacturer which used in Malaysia because their advantage for affiance, performance and quality.
Related Work
Setiyanto (2009) has been conducted the research about the comparison between drum brake and disc brake in variation of braking time and braking load. They found that, braking time is increased when braking distance decreased. Braking load is increased when braking time decreased. Shortest braking time, shortest braking distance and the smallest braking load are shown by disc brake.
The influence of relative movement of brake pad on the braking effectiveness is investigated by Dewanto (2008). The result shows that the effectiveness of braking is not caused by round load, but it’s influenced by the braking force or friction torsion.
Brake pad absorbs the kinetic energy from the moving component (brake drum) as shown in Fig. 1. It transforms into the heat and the heat moving out in order to overheating is not occurring (Zainuri 2010). Brake pad material is selected based on their advantages and performance such as high friction coefficient, lowest wear rate, high heat resistant, low coefficient thermal expansion and good moisture and oil resistant (Gurunath 2007). Based on that qualification, an non-asbestos material is selected. It manufactured by 4 to 5 fibers such as Kevlar, steel fiber, rock wool, cellulose and carbon
Effect of Speed and Braking Load on The Wear Phenomena of MotorcycleDafit Feriyanto1, A.M. Leman1, Achmad Zainuri2, I.D.K Okariawan2
1Faculty of Engineering Technology, Universiti Tun Hussein Onn Malaysia (UTHM) 86400, Parit Raja, BatuPahat, Johor, Malaysia , 2Faculty of Engineering, Mataram University, Lombok, West Nusa Tenggara (NTB), Indonesia
Corresponding Author : Email: [email protected], [email protected], [email protected]
_____________________________________________________________________________
Abstract
In the development of current vehicle capabilities required an effective braking system, has a little wear, and safety riding. The objective of the research is to determine wear and braking distance because of braking load and speed motorcycle Honda supra X125 cc. This research used the speed of 50 km/h, 60 km/h, and 70 km/h. Braking load used to be 4 kg, 5 kg, and 6 kg. The test was done by dynamic method and the research was done in two stages; testing in the field and measuring brake wear in the lab using a profile projector. Testing the hardness of brake was done to know hardness brake before and after testing due to the effect of wear, braking time, and braking distance.From testing it was found that increasing of braking load, resulted in increasing wear. The smallest wear was 6 x 10⁻⁵ mm/sea at a speed of 50 km/h, braking load of 4 kg, and braking time of 15.94 seconds. Increasing the speed resulted in increasing braking distances with the smallest of braking distance was 55 meters at the breaking load of 6 kg, the speed of 50 km/h and braking time 9.93 seconds. The hardness of brake lining, increased after the brake lining wear testing. The hardness before the test was 95.8 HRN and after the test was 100.4 HRN.
Keywords: Wear, braking load, speed, braking time, hardness and braking distance.
_____________________________________________________________________________
Dec 2015, vol 12, No. 2 : 49-56
CONTENT-JOSH-DEC-2015-CS6.indd 49 23-Feb-16 9:44:33 AM
Dec 2015, vol 12, No. 2Journal of Occupational Safety and Health
50
fiber (Eriksson 2000, Gurunath 2007). Several brake pad material completed by their friction coefficient and allowable pressure is listed in Table 1.
Brake pad manufactured based on their mechanical properties which effected to the performance of the brake pad when applied in motorcycle. The mechanical properties standard of the brake pad material is listed in Table 2.
Methodology
This experimental were carried out by using genuine brake pad which is designed by AUTOCAD as shown in Figure 2. Genuine brake ad is used in order to standardize brake pad used and to minimize the error when the experimental result is applied in other genuine brake pad.
Effect of Speed and Braking Load on The Wear Phenomena in Honda Motorcycle
(Waskito 2008, Setiyanto 2009, Dewanto 2008). That correlation is not fully investigated by many researchers. Therefore, in this research will investigate the effect of the speed and braking lad on the wear phenomenon and it will correlate to the lifetime of the brake pad. The material used in genuine part of brake pad is non-asbestos in Honda motorcycle. Honda is the most manufacturer which used in Malaysia because their advantage for affiance, performance and quality. RELATED WORK Setiyanto (2009) has been conducted the research about the comparison between drum brake and disc brake in variation of braking time and braking load. They found
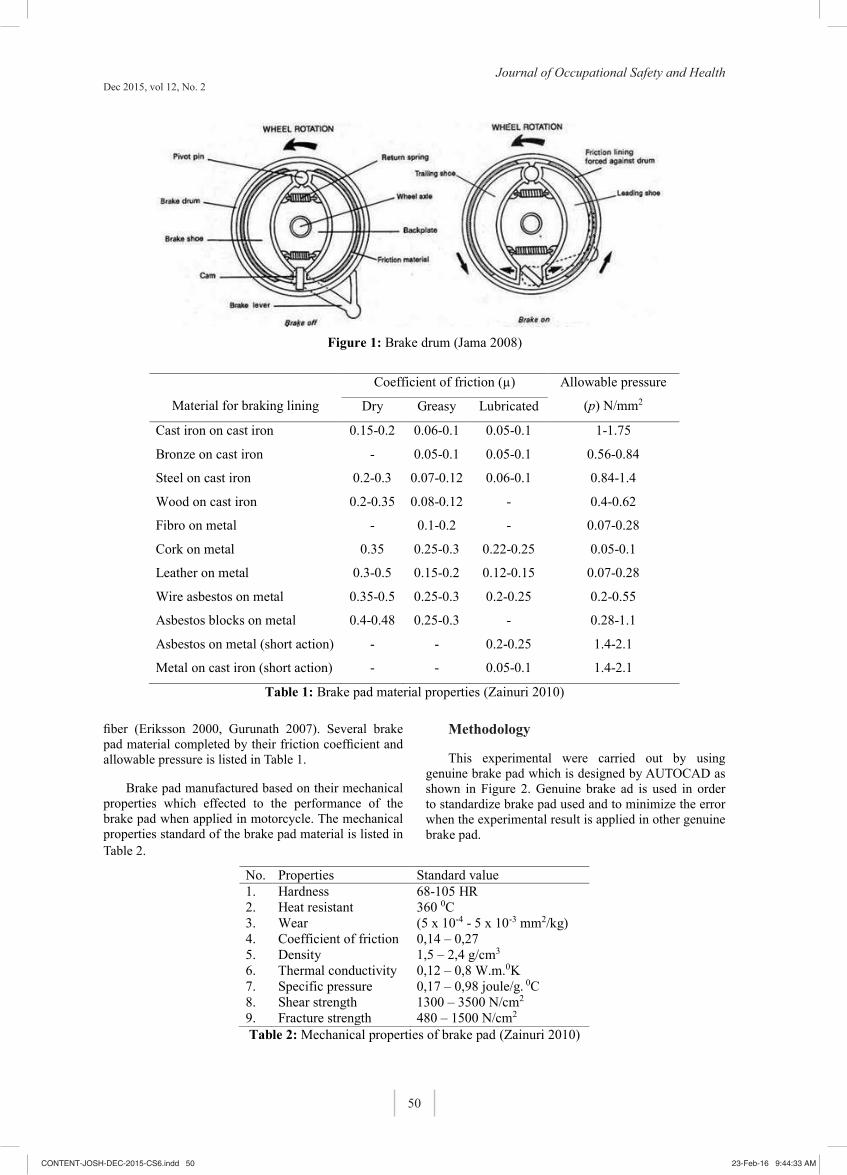
that, braking time is increased when braking distance decreased. Braking load is increased when braking time decreased. Shortest braking time, shortest braking distance and the smallest braking load are shown by disc brake. The influence of relative movement of brake pad on the braking effectiveness is investigated by Dewanto (2008). The result shows that the effectiveness of braking is not caused by round load, but it's influenced by the braking force or friction torsion. Brake pad absorbs the kinetic energy from the moving component (brake drum) as shown in Fig. 1. It transforms into the heat and the heat moving out in order to overheating is not occurring (Zainuri 2010).
Figure 1: Brake drum (Jama 2008)
Brake pad material is selected based on their advantages and performance such as high friction coefficient, lowest wear rate, high heat resistant, low coefficient thermal expansion and good moisture and oil resistant (Gurunath 2007). Based on that qualification, an non-asbestos material is
selected. It manufactured by 4 to 5 fibers such as Kevlar, steel fiber, rock wool, cellulose and carbon fiber (Eriksson 2000, Gurunath 2007). Several brake pad material completed by their friction coefficient and allowable pressure is listed in Table 1.
Original Article J. Occu. Safety & Health 2015
3
Material for braking lining
Coefficient of friction (µ) Allowable pressure
(p) N/mm2 Dry Greasy Lubricated
Cast iron on cast iron 0.15-0.2 0.06-0.1 0.05-0.1 1-1.75
Bronze on cast iron - 0.05-0.1 0.05-0.1 0.56-0.84
Steel on cast iron 0.2-0.3 0.07-0.12 0.06-0.1 0.84-1.4
Wood on cast iron 0.2-0.35 0.08-0.12 - 0.4-0.62
Fibro on metal - 0.1-0.2 - 0.07-0.28
Cork on metal 0.35 0.25-0.3 0.22-0.25 0.05-0.1
Leather on metal 0.3-0.5 0.15-0.2 0.12-0.15 0.07-0.28
Wire asbestos on metal 0.35-0.5 0.25-0.3 0.2-0.25 0.2-0.55
Asbestos blocks on metal 0.4-0.48 0.25-0.3 - 0.28-1.1
Asbestos on metal (short action) - - 0.2-0.25 1.4-2.1
Metal on cast iron (short action) - - 0.05-0.1 1.4-2.1
Table 1: Brake pad material properties (Zainuri 2010)
Brake pad manufactured based on their mechanical properties which effected to the performance of the brake pad when applied
in motorcycle. The mechanical properties standard of the brake pad material is listed in Table 2.
No. Properties Standard value 1. Hardness 68-105 HR 2. Heat resistant 360 0C 3. Wear (5 x 10⁻⁴ - 5 x 10⁻³ mm2/kg) 4. Coefficient of friction 0,14 – 0,27 5. Density 1,5 – 2,4 g/cm3 6. Thermal conductivity 0,12 – 0,8 W.m.0K 7. Specific pressure 0,17 – 0,98 joule/g. 0C 8. Shear strength 1300 – 3500 N/cm2 9. Fracture strength 480 – 1500 N/cm2 Table 2: Mechanical properties of brake pad (Zainuri 2010)
METHODOLOGY This experimental were carried out by using genuine brake pad which is designed by AUTOCAD as shown in Figure 2. Genuine
brake ad is used in order to standardize brake pad used and to minimize the error when the experimental result is applied in other genuine brake pad.
CONTENT-JOSH-DEC-2015-CS6.indd 50 23-Feb-16 9:44:33 AM

Dec 2015, vol 12, No. 2Journal of Occupational Safety and Health
51
Effect of Speed and Braking Load on The Wear Phenomena in Honda Motorcycle
Figure 2: Brake pad as raw material
The experimental research is conducted through the experimental mechanism, determining constant speed, braking time and braking distance which performed by equation 1. Each experiment and variation is carried out by 20 times repetitions. After that the wear is measured by profile projector as shown in Figure 3. V=S/t (1)
V= speed (km/h)
S= braking distance (m)
t= braking time (s) Figure 3: Profile projector
Basely, there are several tools used to measure the thickness reduction of brake pad such as by profile projector and Vernier caliper. Before the experiment, the points coordinate of the brake pad is measured by profile projector and drawing in AUTOCAD as shown in Figure 4. After experimenting, it's measured in profile projector with same point coordinate.
The experimental research is conducted through the experimental mechanism, determining constant speed, braking time and braking distance which performed by equation 1. Each experiment and variation is carried out by 20 times repetitions. After that the wear is measured by profile projector as shown in Figure 3.
V=S/t (1)
V= speed (km/h)
S= braking distance (m)
t= braking time (s)
Basely, there are several tools used to measure the thickness reduction of brake pad such as by profile projector and Vernier caliper. Before the experiment, the points coordinate of the brake pad is measured by profile projector and drawing in AUTOCAD as shown in Figure 4. After experimenting, it’s measured in profile projector with same point coordinate.
Friction force
Wear of the brake pad is influenced by friction between the brake pad with the brake drum. Coefficient of friction is divided into 2 (two) which are static and kinetic friction coefficient (Ostermeyer 2001). The static and kinetic friction force when driving motorcycle based on coefficient of friction is measured by equation 2 and 3, while the torsion which absorbed by brake pad is measured by equation 4 (Eriksson 2001, Gurunath 2007).
For material right moves (maximum friction force):
Fs = μs . N (2)
For moving material:
Fk = μk . N (3)
Torsion absorbed by brake pad:
T = Fout .r (4)
Dengan : Fs = Static friction force (N)
Fk= Kinetic friction force (N)
N = Normal force = Fout (N)
μs= Static friction coefficient
μk= Kinetic friction coefficient
r = Distance (mm)
T = Torsion (Nmm)
Braking efficiency
In order to investigate the characteristic of braking performance, commonly use braking efficiency formula as shown in equation 5. Braking efficiency is the
Effect of Speed and Braking Load on The Wear Phenomena in Honda Motorcycle
Figure 2: Brake pad as raw material
The experimental research is conducted through the experimental mechanism, determining constant speed, braking time and braking distance which performed by equation 1. Each experiment and variation is carried out by 20 times repetitions. After that the wear is measured by profile projector as shown in Figure 3. V=S/t (1)
V= speed (km/h)
S= braking distance (m)
t= braking time (s) Figure 3: Profile projector
Basely, there are several tools used to measure the thickness reduction of brake pad such as by profile projector and Vernier caliper. Before the experiment, the points coordinate of the brake pad is measured by profile projector and drawing in AUTOCAD as shown in Figure 4. After experimenting, it's measured in profile projector with same point coordinate.
CONTENT-JOSH-DEC-2015-CS6.indd 51 23-Feb-16 9:44:33 AM

Dec 2015, vol 12, No. 2Journal of Occupational Safety and Health
52
comparison between maximum decelerate in gravitation unit before tire lock and adhesion coefficient (Lubi 2001).
(5)
Where, a = Maximum decelerate (m/s2)
g = Gravitation (m/s2)
μ = Adhesion coefficient
Braking efficiency identified the motorcycle utilize the adhesion coefficient which occur while braking motorcycle (Lubi 2001).
Results and Discussion
Effect of the braking load and speed on the braking time, braking distance and thickness reduction is listed in Table 3. Highest and smallest braking time of 17.67 and 9.93 second is located at 4 kg braking load and 70
km/h as well as at 6 kg braking load and 50 km/h speed, respectively. When high speed and lower braking load is applied, the friction both of the brake pad, brake drum and way is small. In addition, in higher braking load and smaller speed led to higher contact surface which effect to the braking distance and thickness reduction. Highest and smallest braking distance is in line with braking time with value of 146 and 55 meter. However, diversecases with thickness reduction pattern where the highest reduction are located in highest braking load of 6 kg and highest speed of 70 km/h.
Focus of this research is on the wear phenomenon which listed in Table 4. Wear is caused by surface contact in each material which cause thickness or mass reduction in certain time. Highest wear of 56 x 10-5 mm/s is located in highest braking load and speed of 6 kg and 70 km/h, respectively. Meanwhile, smallest wear of 6 x 10⁻⁵ mm/s is located in smallest braking load and speed of 4 kg and 50 km/h, respectively. Longest lifetime of 31 months is located in lowest braking load and lowest speed of 4 kg and 50 km/h, respectively.Therefore, it need informed to the motorcyclist in order to keep the
Original Article J. Occu. Safety & Health 2015
5
Figure 4: Brake pad profile after drawing in AUTOCAD
Friction force Wear of the brake pad is influenced by friction between the brake pad with the brake drum. Coefficient of friction is divided into 2 (two) which are static and kinetic friction coefficient (Ostermeyer 2001). The static and kinetic friction force when driving motorcycle based on coefficient of friction is measured by equation 2 and 3, while the torsion which absorbed by brake pad is measured by equation 4 (Eriksson 2001, Gurunath 2007). For material right moves (maximum friction force): Fs = μs . N (2) For moving material: Fk = μk . N (3) Torsion absorbed by brake pad: T = Fout .r (4) Dengan :Fs = Static friction force (N)
Fk= Kinetic friction force (N) N = Normal force = Fout (N) μs= Static friction coefficient μk= Kinetic friction coefficient r = Distance (mm) T = Torsion (Nmm)
Braking efficiency In order to investigate the characteristic of braking performance, commonly use braking efficiency formula as shown in equation 5. Braking efficiency is the comparison between maximum decelerate in gravitation unit before tire lock and adhesion coefficient (Lubi 2001).
(5) Where, a = Maximum decelerate (m/s2)
g = Gravitation (m/s2) μ = Adhesion coefficient
Braking efficiency identified the motorcycle utilize the adhesion coefficient which occur while braking motorcycle (Lubi 2001).
RESULTS AND DISCUSSION Effect of the braking load and speed on the braking time, braking distance and thickness reduction is listed in Table 3. Highest and smallest braking time of 17.67 and 9.93 second is located at 4 kg braking load and 70 km/h as well as at 6 kg braking load and 50 km/h speed, respectively. When high speed and lower braking load is applied, the friction both of the brake pad, brake drum
Effect of Speed and Braking Load on The Wear Phenomena in Honda Motorcycle
and way is small. In addition, in higher braking load and smaller speed led to higher contact surface which effect to the braking distance and thickness reduction. Highest and smallest braking distance is in line with braking time with value of 146 and 55
meter. However, diversecases with thickness reduction pattern where the highest reduction are located in highest braking load of 6 kg and highest speed of 70 km/h.
Speed (km/h)
Braking load (kg)
Average braking time (second)
Average braking distance (meter)
Thickness reduction (x10-3mm)
50 4 15.94 72 1 60 4 16.71 104 1 70 4 17.67 146 2 50 5 11.64 68 2 60 5 13.25 96 3 70 5 14.84 114 4 50 6 9.93 55 5 60 6 10.89 73 6 70 6 13.11 91 7
Table 3: Braking time and braking distance after experiment Focus of this research is on the wear phenomenon which listed in Table 4. Wear is caused by surface contact in each material which cause thickness or mass reduction in certain time. Highest wear of 56 x 10-5 mm/s is located in highest braking load and speed of 6 kg and 70 km/h, respectively. Meanwhile, smallest wear of 6 x 10⁻⁵ mm/s
is located in smallest braking load and speed of 4 kg and 50 km/h, respectively. Longest lifetime of 31 months is located in lowest braking load and lowest speed of 4 kg and 50 km/h, respectively.Therefore, it need informed to the motorcyclist in order to keep the brake pad performance and handling the safety riding.
Speed (km/h)
Braking load (kg)
Average of wear (x10-5 mm/s)
Wear in every braking (x10-5 mm/s)
Brake pad lifetime (months)
50 4 6 0.3 31 60 4 8 0.4 23 70 4 10 0.5 19 50 5 14 0.7 13 60 5 20 1.1 8 70 5 24 1.3 7 50 6 47 2 5 60 6 51 2.6 4 70 6 56 2.8 3
Table 4: Wear of brake pad after experiment
Table 5 shows that hardness of brake pad is increased from 95.8 HRN become 100.4 HRN. It indicated that the friction,
temperature increased and cooling by atmospheric lead to hardness brake pad is increased as well.
CONTENT-JOSH-DEC-2015-CS6.indd 52 23-Feb-16 9:44:34 AM

Dec 2015, vol 12, No. 2Journal of Occupational Safety and Health
53
Effect of Speed and Braking Load on The Wear Phenomena in Honda Motorcycle
and way is small. In addition, in higher braking load and smaller speed led to higher contact surface which effect to the braking distance and thickness reduction. Highest and smallest braking distance is in line with braking time with value of 146 and 55
meter. However, diversecases with thickness reduction pattern where the highest reduction are located in highest braking load of 6 kg and highest speed of 70 km/h.
Speed (km/h)
Braking load (kg)
Average braking time (second)
Average braking distance (meter)
Thickness reduction (x10-3mm)
50 4 15.94 72 1 60 4 16.71 104 1 70 4 17.67 146 2 50 5 11.64 68 2 60 5 13.25 96 3 70 5 14.84 114 4 50 6 9.93 55 5 60 6 10.89 73 6 70 6 13.11 91 7
Table 3: Braking time and braking distance after experiment Focus of this research is on the wear phenomenon which listed in Table 4. Wear is caused by surface contact in each material which cause thickness or mass reduction in certain time. Highest wear of 56 x 10-5 mm/s is located in highest braking load and speed of 6 kg and 70 km/h, respectively. Meanwhile, smallest wear of 6 x 10⁻⁵ mm/s
is located in smallest braking load and speed of 4 kg and 50 km/h, respectively. Longest lifetime of 31 months is located in lowest braking load and lowest speed of 4 kg and 50 km/h, respectively.Therefore, it need informed to the motorcyclist in order to keep the brake pad performance and handling the safety riding.
Speed (km/h)
Braking load (kg)
Average of wear (x10-5 mm/s)
Wear in every braking (x10-5 mm/s)
Brake pad lifetime (months)
50 4 6 0.3 31 60 4 8 0.4 23 70 4 10 0.5 19 50 5 14 0.7 13 60 5 20 1.1 8 70 5 24 1.3 7 50 6 47 2 5 60 6 51 2.6 4 70 6 56 2.8 3
Table 4: Wear of brake pad after experiment
Table 5 shows that hardness of brake pad is increased from 95.8 HRN become 100.4 HRN. It indicated that the friction,
temperature increased and cooling by atmospheric lead to hardness brake pad is increased as well.
Original Article J. Occu. Safety & Health 2015
7
Indenter diameter
(meter)
Pressure load
(kg)
Hardness before
experiment (HRN)
Hardness after experiment
( HRN)
15.9
60
80 105
101 102
103 104
102 97
85 94
Average 95.8 100.4
Table 5: Hardness of brake pad before and after braking
Figure 5: a) Speed and braking time; b) Speed and braking distance; c) Speed and thickness
reduction; and d) Speed and wear in various braking load
The equation of the effect of the braking load on the braking time in various speed are shown in Figure 5a). In braking load of 4 kg can generated the equation of y= 0.000x2 - 0.027x + 14.94. The equation in braking load of 5 kg is y= -0.000x2 + 0.172x + 3.29 and braking load of 6 kg is y= 0.006x2 - 0.597x + 24.03. Braking distance equation in various speeds and braking load is shown in Figure 5b). Braking distance
equation of 4, 5 and 6 kg are y= 0.05x2 - 2.3x + 62, y= -0.05x2 + 8.3x - 222 and y= 1.8x - 35, respectively. Thickness reduction equation in various speeds and braking load is shown in Figure 5c).Braking distance equation of 4, 5 and 6 kg are y= 0.005x2 - 0.55x + 16, y= 0.1x - 3 and y= 0.1x - 1E-13, respectively. Wear equation in various speeds and braking load is shown in Figure 5d). Braking distance equation of 4, 5 and 6
a)
b) c) d)
b)
CONTENT-JOSH-DEC-2015-CS6.indd 53 23-Feb-16 9:44:34 AM

Dec 2015, vol 12, No. 2Journal of Occupational Safety and Health
54
brake pad performance and handling the safety riding.
Table 5 shows that hardness of brake pad is increased from 95.8 HRN become 100.4 HRN. It indicated that the friction, temperature increased and cooling by atmospheric lead to hardness brake pad is increased as well.
The equation of the effect of the braking load on the braking time in various speed are shown in Figure 5a). In braking load of 4 kg can generated the equation of y= 0.000x2 - 0.027x + 14.94. The equation in braking load of 5 kg is y= -0.000x2 + 0.172x + 3.29 and braking load of 6 kg is y= 0.006x2 - 0.597x + 24.03. Braking distance equation in various speeds and braking load is shown in Figure 5b). Braking distance equation of 4, 5 and 6 kg are y= 0.05x2 - 2.3x + 62, y= -0.05x2 + 8.3x - 222 and y= 1.8x - 35, respectively. Thickness reduction equation in various speeds and braking load is shown in Figure 5c).Braking distance equation of 4, 5 and 6 kg are y= 0.005x2 - 0.55x + 16, y= 0.1x - 3 and y= 0.1x - 1E-13, respectively. Wear equation in various speeds and braking load is shown in Figure 5d). Braking distance equation of 4, 5 and 6 kg are y = 0.2x - 4, y = -0.01x2 + 1.7x - 46 and y = 0.005x2 - 0.15x + 42, respectively. Therefore, when the lower and higher speed than experimental parameters, that equation is required
used for measuring the braking time, braking distance, thickness reduction and wear in same braking load.
Low heat transfer of motorcycle brake pad led to it easy to slip because the drum is located inside and disk brake is located outside. Speed, braking time is in-line with braking distance because when speed is increase, the energy kinetic from brake drum isincrease as well. Therefore, the time needed to stop the energy kinetic is increased and automatically the braking distance is increase as well. Besides that, the increasing hardness of brake pad is influence to the higher braking time, higher braking distance and lower thickness reduction.
In this study, wear is measured thickness reduction in braking time. Thickness reduction as indication of the wear is occurring in the brake pad. It investigated via profile projector which used ray reflection principle. The wear is occurring because the contact surface between brake pad and brake drum. Smallest wear is selected as recommended treatment for motorcyclist in order to make longer lifetime and to predict when the braking is action. The brake pad after 60 times experiment is shown in Figure 6. It pictured in order to show the visual distribution of contact surface in each experimental parameter.
Effect of Speed and Braking Load on The Wear Phenomena in Honda Motorcycle
kg are y = 0.2x - 4, y = -0.01x2 + 1.7x - 46 and y = 0.005x2 - 0.15x + 42, respectively. Therefore, when the lower and higher speed than experimental parameters, that equation is required used for measuring the braking time, braking distance, thickness reduction and wear in same braking load. Low heat transfer of motorcycle brake pad led to it easy to slip because the drum is located inside and disk brake is located outside. Speed, braking time is in-line with braking distance because when speed is increase, the energy kinetic from brake drum isincrease as well. Therefore, the time needed to stop the energy kinetic is increased and automatically the braking distance is increase as well. Besides that, the increasing hardness of brake pad is influence to the higher braking time, higher
braking distance and lower thickness reduction. In this study, wear is measured thickness reduction in braking time. Thickness reduction as indication of the wear is occurring in the brake pad. It investigated via profile projector which used ray reflection principle. The wear is occurring because the contact surface between brake pad and brake drum. Smallest wear is selected as recommended treatment for motorcyclist in order to make longer lifetime and to predict when the braking is action. The brake pad after 60 times experiment is shown in Figure 6. It pictured in order to show the visual distribution of contact surface in each experimental parameter.
a). Braking load 4 kg, Speed 50 km/h b). Braking load 4 kg, Speed 60 km/h
c). Braking load 4 kg, Speed 70 km/h d). Braking load 5 kg, Speed 50 km/h
CONTENT-JOSH-DEC-2015-CS6.indd 54 23-Feb-16 9:44:34 AM
Dec 2015, vol 12, No. 2Journal of Occupational Safety and Health
55
Original Article J. Occu. Safety & Health 2015
9
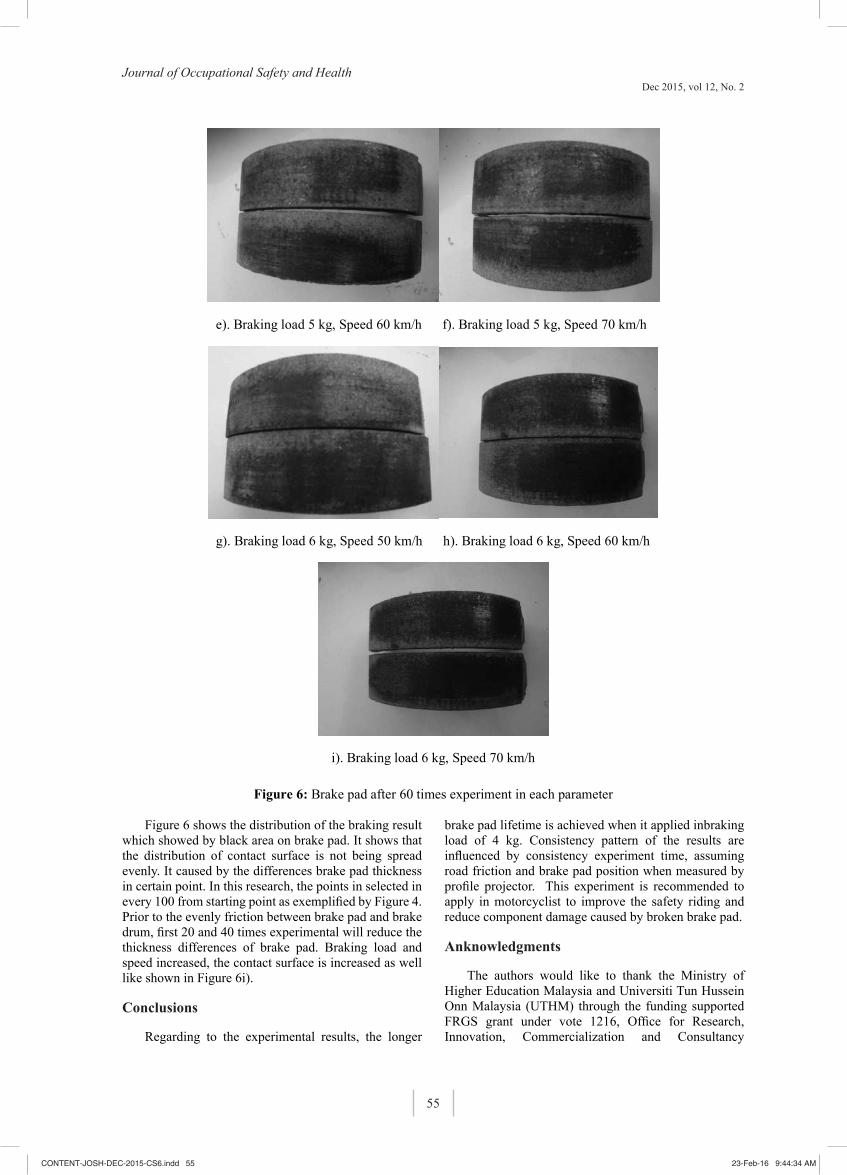
e). Braking load 5 kg, Speed 60 km/h f). Braking load 5 kg, Speed 70 km/h
g). Braking load 6 kg, Speed 50 km/h h). Braking load 6 kg, Speed 60 km/h
i). Braking load 6 kg, Speed 70 km/h
Figure 6: Brake pad after 60 times experiment in each parameter
Figure 6 shows the distribution of the braking result which showed by black area on brake pad. It shows that the distribution of contact surface is not being spread evenly. It caused by the differences brake pad thickness in certain point. In this research, the points in selected in every 100
from starting point as exemplified by Figure 4. Prior to the evenly friction between brake pad and brake drum, first 20 and 40 times experimental will reduce the thickness differences of brake pad. Braking load and speed increased, the contact surface is increased as well like shown in Figure 6i).
Figure 6 shows the distribution of the braking result which showed by black area on brake pad. It shows that the distribution of contact surface is not being spread evenly. It caused by the differences brake pad thickness in certain point. In this research, the points in selected in every 100 from starting point as exemplified by Figure 4. Prior to the evenly friction between brake pad and brake drum, first 20 and 40 times experimental will reduce the thickness differences of brake pad. Braking load and speed increased, the contact surface is increased as well like shown in Figure 6i).
Conclusions
Regarding to the experimental results, the longer
brake pad lifetime is achieved when it applied inbraking load of 4 kg. Consistency pattern of the results are influenced by consistency experiment time, assuming road friction and brake pad position when measured by profile projector. This experiment is recommended to apply in motorcyclist to improve the safety riding and reduce component damage caused by broken brake pad.
Anknowledgments
The authors would like to thank the Ministry of Higher Education Malaysia and Universiti Tun Hussein Onn Malaysia (UTHM) through the funding supported FRGS grant under vote 1216, Office for Research, Innovation, Commercialization and Consultancy
CONTENT-JOSH-DEC-2015-CS6.indd 55 23-Feb-16 9:44:34 AM

Dec 2015, vol 12, No. 2Journal of Occupational Safety and Health
56
Management (ORICC) and then Centre for Graduate Studies – UTHM.
References
(1). Dewanto, J. 2008, Study effect of brake pad relative friction on the braking effectiveness 3th National conference. Retrieved at May 8 2012 from www.petra.ac.id.
(2). Eriksson, Mikael, Staffan Jacobson. 2000. Tribological surfaces of organic brake pads. Tribology international. ( 33) 12, 817-827.
(3). Eriksson, Mikael, John Lord, Staffan Jacobson. 2001. Wear and contact conditions of brake pads: dynamical in situ studies of pad on glass. Wear. (249) 3, 272-278.
(4). Gurunath, P. V., Bijwe, J. 2007. Friction and wear studies on brake-pad materials based on newly developed resin. Wear. (263) 7, 1212-1219.
(5). Jama, J. 2008. Motorcycle principle, 3th editions for high school. Department of National Education,
Jakarta, Indonesia.
(6). Lubi. 2001. Design of grooved brake pad to improve the performance and lifetime of brake pad. Faculty of Mechanical Engineering (FTI-ITS), Surabaya, Indonesia.
(7). Ostermeyer, G.P. 2001. Friction and wear of brake systems. Forschung im Ingenieurwesen. (66) 6, 267-272.
(8). Setiyanto, I. 2009. Effect of sintering temperatures on the wear resistance of brake pad material. Universitas Muhamadiyah Surakarta, Surakarta, Indonesia Waskito, A.T. 2008.IBP Brake Non Asbestos Pad And Lining. http//ibp brakepad.blogspot.com. Retrieved at May 10 2012.
(9). Zainuri, A. 2010. Diktat of second machine element. Department of Mechanical Engineering, Mataram University, Mataram, Indonesia.
CONTENT-JOSH-DEC-2015-CS6.indd 56 23-Feb-16 9:44:34 AM

Dec 2015, vol 12, No. 2Journal of Occupational Safety and Health
57
Introduction
The BASF Group is the world’s largest chemical company by sales and market capitalisation. It was founded by Friedrich Engelhorn in 1865 in Ludwigshafen, Germany. The abbreviation BASF stands for the German company name “Badische Anilin- und Soda-Fabrik” (English: Baden Aniline and Soda Factory), pointing to the early roots and product lines of BASF, which were synthetic dyes. Today, the company has more than 113,000 employees on 359 sites and locations, out of which 6 sites are “Verbund sites”, i.e., integrated production sites. Ludwigshafen remains BASF’s company head¬quarters and its largest site with more than 39,000 employees. BASF operates in 5 different business segments: Chemicals (including petrochemicals, monomers, intermediates), Performance Products (including dispersions and pigments, care chemicals, nutrition & health, paper chemicals and perfor¬mance chemicals), Functional Materials and Solutions (including catalysts, construction chemicals, coatings and performance materials), Agricultural Solutions, and Oil and Gas. BASF products are used in various applications such as agriculture, animal and human nutrition, automotive products, building and construction materials, cleaning agents, clothing and fabric, cosmetics and grooming, home products, household tools and hardware supplies, medical supplies, packaging, office products and sports and leisure (1).
The synthesis, transport and storage of chemical substances usually involves the handling and potential exposure to either basic chemicals, products, mixtures, formulations, or auxillary materials such as catalysts.
To address potential health risks at work, BASF has been providing occupational health service almost from the start: the first health physician was contracted in 1866, one year after BASF was founded. Today, the Occupational Medicine & Health Protection (OM&HP) Department in Ludwigshafen is staffed with 21 occupational physicians, including cardiologists, lung specialists and dermatologists. The department offers occupational medical support for the production plants, as well as medical function diagnostics, emergency response training and medical consultation for travellers and delegates. A sub-department on scientific evaluation and expert panel work summarizes and evaluates the current knowledge on the toxicology and epidemiology of chemical substances and other hazards and influence factors at work. Human biomonitoring (HBM), as part of exposure assessment at work, has been widely used in Germany since the 1970s, and in 1987 an HBM laboratory was established in the department. The parameter spectrum today comprises about 90 biomarkers for more than 70 organic substances and 8 metals. The laboratory is certified according to the Guidelines of the German Medical Association (2) and acts as a national reference laboratory in the German External Quality Assessment Scheme (G-EQUAS) for toxicological analyses in biological materials (3).
Among the substances of continuous interest with respect to health protection at BASF Ludwigshafen is inorganic mercury. The main targets of mercury toxicity are the kidneys and the central nervous system (4,5). Since relatively small amounts of mercury, incorporated over long time intervals, can significantly increase the health risk, exposure control as well as occupational
Exposure Assessment and Health Surveillance for Mercury- the BASF Experience
Jefferelli S.B.1, Trauth B.2, Bader M.2
1 Occupational Medicine and Health Protection, Environment Health and Safety, BASF Asia Pacific Service Centre Sdn. Bhd., Level 25, Menara TM, Jalan Pantai Baharu, 59200 Kuala Lumpur, Malaysia 2 Occupational Medicine and Health Protection,
BASF SE, Carl-Bosch-Straße 38, 67056 Ludwigshafen, Germany
Corresponding Author :Dr. Jefferelli Shamsul Bahrin. E-mail: [email protected]
_____________________________________________________________________________
Abstract
BASF has a long and comprehensive experience in exposure assessment of hazardous chemicals, and of health surveillance, including human biomonitoring (HBM). This article provides a summary on exposure analysis by HBM and health surveillance for mercury at the BASF Verbund site in Ludwigshafen, Germany: the company’s occupational health resources, related legal requirements, code of practice and directives, sources of potential mercury exposure, and how health surveillance is conducted. It shares BASF’s experience in analyzing and controlling exposure to mercury. The paper discusses the similarities and differences of the BASF Ludwigshafen approach with respect to health surveillance practice for mercury in Malaysia.
Keywords: Exposure Assessment, Health Surveillance, Mercury, Human Biomonitoring, BASF
_____________________________________________________________________________
Dec 2015, vol 12, No. 2 : 57-64
CONTENT-JOSH-DEC-2015-CS6.indd 57 23-Feb-16 9:44:34 AM
Dec 2015, vol 12, No. 2Journal of Occupational Safety and Health
58
medical surveillance are required by legislation in Germany. This paper will summarize BASF’s experience in mercury exposure analysis, particularly by Human Biomonitoring, and health surveillance at the Ludwigshafen Verbund site.
Legal Requirements and Assessment Values for Human Biomonitoring
BASF’s health surveillance for mercury is determined by the the legal requirements in Germany, voluntary Industry Codes of Practice, and company directives.
The German Federal Ministry of Labour and Social Affairs publishes the Ordinance on Occupational Health Care (ArbMedVV) (6) and the Hazardous Substances Ordinance (7). Part of the latter are the Technical Guidelines for Hazardous Substances (TRGS), among which the TRGS 903 specifies the Biological Limit Values for Human Biomonitoring (BGW, in German: Biologische Grenzwerte) (8). Furthermore, the TRGS 900 summarizes the Occupational Exposure Limits (OEL) for substances in air (AGW, in German: Arbeitsplatzgrenzwerte) (9). The ArbMedVV defines the scope and contents of occupational health surveillance examinations. The German Occupational Exposure Limit for airborne mercury (AGW) is 20 µg/m3. The limit value in biological material (BGW) for mercury is 25 µg/g creatinine in urine. There is no BGW for mercury in blood.
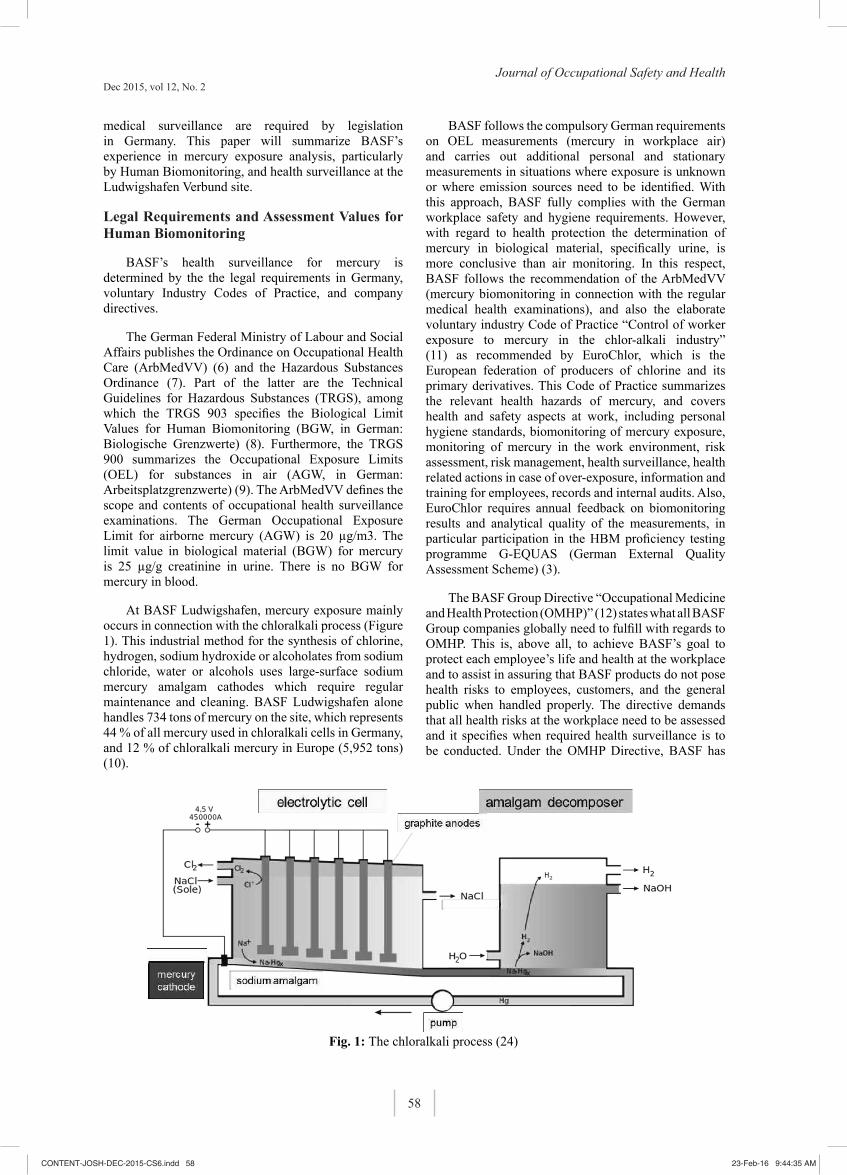
At BASF Ludwigshafen, mercury exposure mainly occurs in connection with the chloralkali process (Figure 1). This industrial method for the synthesis of chlorine, hydrogen, sodium hydroxide or alcoholates from sodium chloride, water or alcohols uses large-surface sodium mercury amalgam cathodes which require regular maintenance and cleaning. BASF Ludwigshafen alone handles 734 tons of mercury on the site, which represents 44 % of all mercury used in chloralkali cells in Germany, and 12 % of chloralkali mercury in Europe (5,952 tons) (10).
BASF follows the compulsory German requirements on OEL measurements (mercury in workplace air) and carries out additional personal and stationary measurements in situations where exposure is unknown or where emission sources need to be identified. With this approach, BASF fully complies with the German workplace safety and hygiene requirements. However, with regard to health protection the determination of mercury in biological material, specifically urine, is more conclusive than air monitoring. In this respect, BASF follows the recommendation of the ArbMedVV (mercury biomonitoring in connection with the regular medical health examinations), and also the elaborate voluntary industry Code of Practice “Control of worker exposure to mercury in the chlor-alkali industry” (11) as recommended by EuroChlor, which is the European federation of producers of chlorine and its primary derivatives. This Code of Practice summarizes the relevant health hazards of mercury, and covers health and safety aspects at work, including personal hygiene standards, biomonitoring of mercury exposure, monitoring of mercury in the work environment, risk assessment, risk management, health surveillance, health related actions in case of over-exposure, information and training for employees, records and internal audits. Also, EuroChlor requires annual feedback on biomonitoring results and analytical quality of the measurements, in particular participation in the HBM proficiency testing programme G-EQUAS (German External Quality Assessment Scheme) (3).
The BASF Group Directive “Occupational Medicine and Health Protection (OMHP)” (12) states what all BASF Group companies globally need to fulfill with regards to OMHP. This is, above all, to achieve BASF’s goal to protect each employee’s life and health at the workplace and to assist in assuring that BASF products do not pose health risks to employees, customers, and the general public when handled properly. The directive demands that all health risks at the workplace need to be assessed and it specifies when required health surveillance is to be conducted. Under the OMHP Directive, BASF has
- 4 -
industry” (11) as recommended by EuroChlor, which is the European federation of producers of
chlorine and its primary derivatives. This Code of Practice summarizes the relevant health hazards
of mercury, and covers health and safety aspects at work, including personal hygiene standards,
biomonitoring of mercury exposure, monitoring of mercury in the work environment, risk assessment,
risk management, health surveillance, health related actions in case of over-exposure, information
and training for employees, records and internal audits. Also, EuroChlor requires annual feedback
on biomonitoring results and analytical quality of the measurements, in particular participation in the
HBM proficiency testing programme G-EQUAS (German External Quality Assessment Scheme) (3).
Fig. 1: The chloralkali process (24)
The BASF Group Directive “Occupational Medicine and Health Protection (OMHP)” (12) states what
all BASF Group companies globally need to fulfill with regards to OMHP. This is, above all, to
achieve BASF’s goal to protect each employee’s life and health at the workplace and to assist in
assuring that BASF products do not pose health risks to employees, customers, and the general
public when handled properly. The directive demands that all health risks at the workplace need to
be assessed and it specifies when required health surveillance is to be conducted. Under the OMHP
Directive, BASF has recently adopted a Responsible Care® requirement with regard to Human
Biomonitoring, and the Ludwigshafen site provides a comprehensive summary of limit values, BASF
internal action values and other assessment values and their specific rationale (13). The BASF
action value for urinary mercury corresponds to the German BGW of 25 µg Hg/g creatinine.
Fig. 1: The chloralkali process (24)
CONTENT-JOSH-DEC-2015-CS6.indd 58 23-Feb-16 9:44:35 AM
Dec 2015, vol 12, No. 2Journal of Occupational Safety and Health
59
recently adopted a Responsible Care® requirement with regard to Human Biomonitoring, and the Ludwigshafen site provides a comprehensive summary of limit values, BASF internal action values and other assessment values and their specific rationale (13). The BASF action value for urinary mercury corresponds to the German BGW of 25 µg Hg/g creatinine.
Mercury Exposure
Human exposure to mercury is ubiquitous and not limited to occupational sources. The main source for inorganic mercury are dental amalgam fillings, while organic mercury compounds (such as methyl mercury) mostly originates from seafood. Some sources of exposure with minor relevance are broken thermometers, energy-saving bulbs, as well as some skin care and medical products (14). Urinary background for mercury varies between 1 - 5 µg per gram creatinine, depending on the number, size and condition of amalgam fillings, and on fish consumption (15).
At BASF Ludwigshafen, there is a risk of exposure to inorganic mercury in the chloralkali electrolysis plant especially during maintenance and cleaning work. Although mercury is inside a closed system under regular production conditions, there is still potential for low exposure through workplace air or contaminated clothes and the skin. Potential exposure to mercury is higher during adjustment or maintenance works where reactor cells or sample valves are opened. The most critical work tasks comprise cleaning of cells, valves or pipes when residual material and deposits are removed, as well as during decommissioning and turnarounds (16,17).
Health Surveillance for Mercury at BASF
The trigger for health surveillance, frequency of assessment and actions to be taken during preplacement and periodic assessment at BASF is closely aligned with the German Ordinance on Occupational Health Care and the EuroChlor Code of Practice (6,11).
Trigger
Every employee with potential exposure to mercury has to undergo health surveillance. Potential exposure is determined by a risk assessment. During the risk assessment, the frequency and duration of exposure, specific job tasks, potential sources of exposure, distance from potential emission sources and existing control measures are determined.
Frequency
Workers at risk will be placed in the mercury health surveillance program which includes periodic health surveillance, including HBM for mercury in urine. The frequency of exposure assessment depends on the estimated degree of exposure. HBM is offered semi-annually for those in regular production; quarterly for those involved in occasional maintenance and reactor
testing; and monthly for those involved in intensive cleaning. Whenever a worker is removed due to an observed excursion of the action value (see below), urinary mercury analysis is repeated monthly until exposure levels drop below half of the action value.
Preplacement
The preplacement assessment will include HBM for mercury and identification of symptoms and signs of mercury exposure. Particular attention will be paid to state of teeth (amalgam fillings), renal damage, neurological and mental abnormalities, psycho-vegetative disorders, evidence to addiction (alcohol, drugs) and thyroid hyperactivity. Urinalysis is conducted.
Periodic
This periodic assessment will also include HBM for mercury and identification of symptoms and signs of mercury exposure. Symptoms identified include restlessness, headaches and limb pain. The oral cavity is inspected to look for stomatitis, gingivitis or mercurial line. Neurological assessment includes identifying tremor, psellism, emotional lability, erethism and vegetative disorder. If indicated, handwriting is tested. Urinalysis is conducted and, if indicated, further assessment such as quantitative determination of urinary protein or urine alpha-1-microglobulin or N-acetyl-ß-D-glucosaminidase in urine is carried out. If indicated, the employee is referred to a nephrologist or neurologist and nerve conduction studies may also be conducted.
Medical Removal Protection
Medical removal is required when there is definite or suspected poisoning or if urinary mercury is above the action value. A medically removed person is only allowed to return to work once urine mercury is below half of the action value, any sign or symptoms of mercury poisoning have disappeared and, if necessary, appropriate industrial hygiene measures including advice on behaviour have been instituted.
Mercury Exposure Control
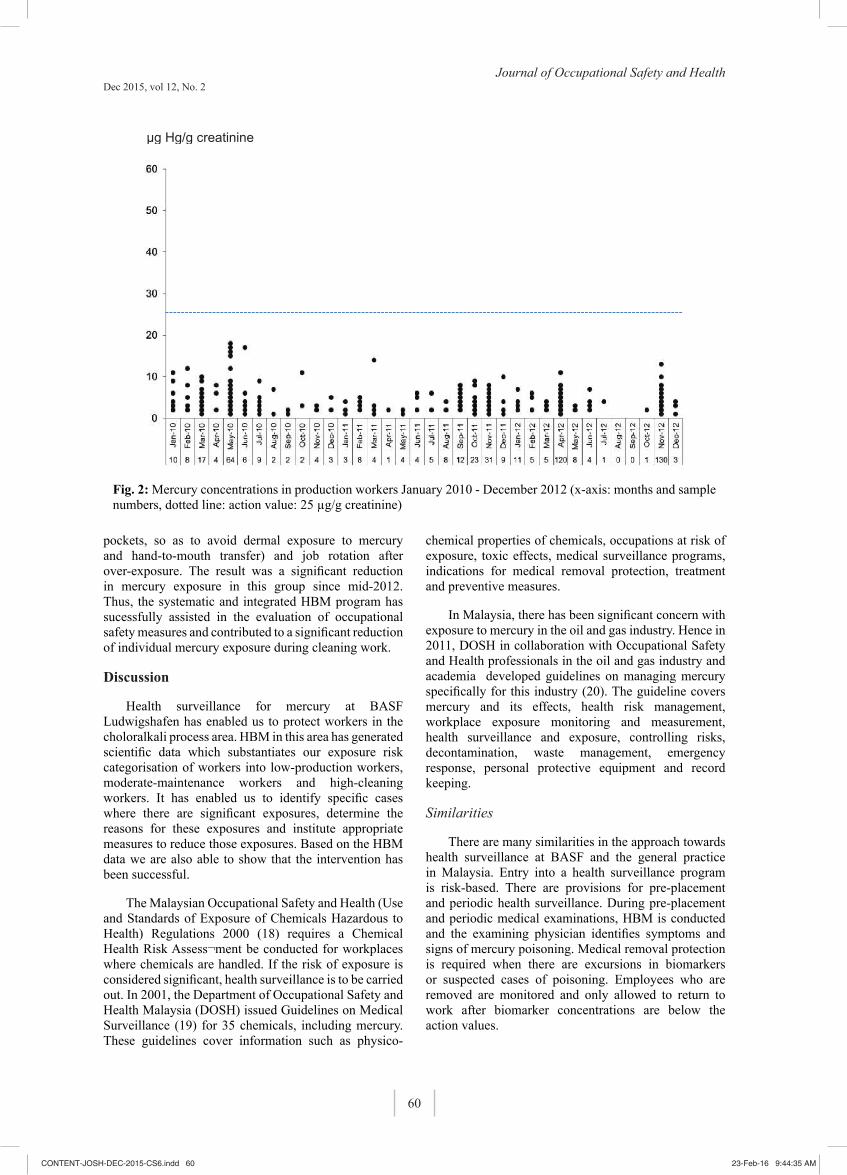
Figures 2 and 3 show the results of regular Human Biomonitoring between 2010 to 2012. No action value excursions were observed for workers in routine production (Figure 2). Only occasional excursions were found in workers occupied with maintenance and control (data not shown).
In contrast, action value excursions were observed in a significant number of the cleaning workers (Figure 3) in the time interval between 2010 to 2011. In these cases, the plant management together with medical and industrial hygiene started a program of intensified safety instructions and training, as well as an adjustment of occupational safety measures such as respiratory protection, daily change of work clothes, handling of gloves (in particular: no putting gloves into trouser
CONTENT-JOSH-DEC-2015-CS6.indd 59 23-Feb-16 9:44:35 AM
Dec 2015, vol 12, No. 2Journal of Occupational Safety and Health
60
pockets, so as to avoid dermal exposure to mercury and hand-to-mouth transfer) and job rotation after over-exposure. The result was a significant reduction in mercury exposure in this group since mid-2012. Thus, the systematic and integrated HBM program has sucessfully assisted in the evaluation of occupational safety measures and contributed to a significant reduction of individual mercury exposure during cleaning work.
Discussion
Health surveillance for mercury at BASF Ludwigshafen has enabled us to protect workers in the choloralkali process area. HBM in this area has generated scientific data which substantiates our exposure risk categorisation of workers into low-production workers, moderate-maintenance workers and high-cleaning workers. It has enabled us to identify specific cases where there are significant exposures, determine the reasons for these exposures and institute appropriate measures to reduce those exposures. Based on the HBM data we are also able to show that the intervention has been successful.
The Malaysian Occupational Safety and Health (Use and Standards of Exposure of Chemicals Hazardous to Health) Regulations 2000 (18) requires a Chemical Health Risk Assess¬ment be conducted for workplaces where chemicals are handled. If the risk of exposure is considered significant, health surveillance is to be carried out. In 2001, the Department of Occupational Safety and Health Malaysia (DOSH) issued Guidelines on Medical Surveillance (19) for 35 chemicals, including mercury. These guidelines cover information such as physico-
chemical properties of chemicals, occupations at risk of exposure, toxic effects, medical surveillance programs, indications for medical removal protection, treatment and preventive measures.
In Malaysia, there has been significant concern with exposure to mercury in the oil and gas industry. Hence in 2011, DOSH in collaboration with Occupational Safety and Health professionals in the oil and gas industry and academia developed guidelines on managing mercury specifically for this industry (20). The guideline covers mercury and its effects, health risk management, workplace exposure monitoring and measurement, health surveillance and exposure, controlling risks, decontamination, waste management, emergency response, personal protective equipment and record keeping.
Similarities
There are many similarities in the approach towards health surveillance at BASF and the general practice in Malaysia. Entry into a health surveillance program is risk-based. There are provisions for pre-placement and periodic health surveillance. During pre-placement and periodic medical examinations, HBM is conducted and the examining physician identifies symptoms and signs of mercury poisoning. Medical removal protection is required when there are excursions in biomarkers or suspected cases of poisoning. Employees who are removed are monitored and only allowed to return to work after biomarker concentrations are below the action values.
- 7 -
µg Hg/g creatinine
Fig. 2: Mercury concentrations in production workers January 2010 - December 2012
(x-axis: months and sample numbers, dotted line: action value: 25 µg/g creatinine)
In contrast, action value excursions were observed in a significant number of the cleaning workers
(Figure 3) in the time interval between 2010 to 2011. In these cases, the plant management together
with medical and industrial hygiene started a program of intensified safety instructions and training,
as well as an adjustment of occupational safety measures such as respiratory protection, daily
change of work clothes, handling of gloves (in particular: no putting gloves into trouser pockets, so
as to avoid dermal exposure to mercury and hand-to-mouth transfer) and job rotation after over-
exposure. The result was a significant reduction in mercury exposure in this group since mid-2012.
Thus, the systematic and integrated HBM program has sucessfully assisted in the evaluation of
occupational safety measures and contributed to a significant reduction of individual mercury
exposure during cleaning work.
Fig. 2: Mercury concentrations in production workers January 2010 - December 2012 (x-axis: months and sample numbers, dotted line: action value: 25 µg/g creatinine)
CONTENT-JOSH-DEC-2015-CS6.indd 60 23-Feb-16 9:44:35 AM

Dec 2015, vol 12, No. 2Journal of Occupational Safety and Health
61
- 8 -
Fig. 3: Mercury concentrations in cleaning workers January 2010 - December 2012
(x-axis: months and sample numbers, dotted line: action value: 25 µg/g creatinine)
6. Discussion
Health surveillance for mercury at BASF Ludwigshafen has enabled us to protect workers in the
choloralkali process area. HBM in this area has generated scientific data which substantiates our
exposure risk categorisation of workers into low-production workers, moderate-maintenance workers
and high-cleaning workers. It has enabled us to identify specific cases where there are significant
exposures, determine the reasons for these exposures and institute appropriate measures to reduce
those exposures. Based on the HBM data we are also able to show that the intervention has been
successful.
The Malaysian Occupational Safety and Health (Use and Standards of Exposure of Chemicals
Hazardous to Health) Regulations 2000 (18) requires a Chemical Health Risk Assessment be
conducted for workplaces where chemicals are handled. If the risk of exposure is considered
significant, health surveillance is to be carried out. In 2001, the Department of Occupational Safety
and Health Malaysia (DOSH) issued Guidelines on Medical Surveillance (19) for 35 chemicals,
including mercury. These guidelines cover information such as physico-chemical properties of
Fig. 3: Mercury concentrations in cleaning workers January 2010 - December 2012 (x-axis: months and sample numbers, dotted line: action value: 25 µg/g creatinine)
Differences
However, there are also some differences in health surveillance for mercury between BASF and Malaysia. The three main differences are: the limit concentration used as action level for mercury in urine, the use or non-use of blood mercury for HBM, and the role of personal exposure monitoring of airborne mercury as a trigger for health surveillance.
i. Limit concentrations for mercury in urine
The Biological Exposure Index (BEI) recommended by DOSH (20) is higher than the action value of BASF (13), the German BGW (8), and the ACGIH BEI (21) (Table 1).
Tab. 1: Comparison of limit values for urinary mercury
The BASF action value for urinary mercury reflects the German BGW. In 2005, the German Ministry of Labour and Social Affairs reduced the BGW for mercury in urine from 100 µg/L (corresponding to approximately 70 µg/g creatinine) to 25 µg/g creatinine. The creatinine-adjustment was introduced to correct for diuretic
variance, i.e., the effect of urine dilution. In 2013, the US ACGIH (21) reduced the BEI for mercury in urine from 35 µg/g creatinine to 20 µg/g creatinine, and in 2007, the European Scientific Committee on Occupational Exposure Limits (SCOEL) published a recommendation for 30 µg/g creatinine (14). All three evaluations were based on similar toxicological grounds, but slightly different emphasis was given to some studies, and the final rounding of data was different.
The limit values were lowered because recent studies were able to detect subtle nephrotoxic and neurotoxic effects at urinary concentrations below 35 µg/g creatinine. While early nephrotoxic and behavioural toxic effects of mercury are usually reversible, some of the neurotoxic effects are not. Long term exposure to mercury levels below 35 µg/g creatinine were associated with memory deficits roughly equivalent to aging 10 years (21).
A reduction in BEI would mean a lower action level. Individuals with urine mercury slightly below previous action level may now be categorised as above action level. This would mean more people would require further assessment and medical removal protection. From
- 9 -
chemicals, occupations at risk of exposure, toxic effects, medical surveillance programs, indications
for medical removal protection, treatment and preventive measures.
In Malaysia, there has been significant concern with exposure to mercury in the oil and gas industry.
Hence in 2011, DOSH in collaboration with Occupational Safety and Health professionals in the oil
and gas industry and academia developed guidelines on managing mercury specifically for this
industry (20). The guideline covers mercury and its effects, health risk management, workplace
exposure monitoring and measurement, health surveillance and exposure, controlling risks,
decontamination, waste management, emergency response, personal protective equipment and
record keeping.
6.1 Similarities
There are many similarities in the approach towards health surveillance at BASF and the general
practice in Malaysia. Entry into a health surveillance program is risk-based. There are provisions for
pre-placement and periodic health surveillance. During pre-placement and periodic medical
examinations, HBM is conducted and the examining physician identifies symptoms and signs of
mercury poisoning. Medical removal protection is required when there are excursions in biomarkers
or suspected cases of poisoning. Employees who are removed are monitored and only allowed to
return to work after biomarker concentrations are below the action values.
6.2 Differences
However, there are also some differences in health surveillance for mercury between BASF and
Malaysia. The three main differences are: the limit concentration used as action level for mercury in
urine, the use or non-use of blood mercury for HBM, and the role of personal exposure monitoring of
airborne mercury as a trigger for health surveillance.
6.2.1 Limit concentrations for mercury in urine
The Biological Exposure Index (BEI) recommended by DOSH (20) is higher than the action value of
BASF (13), the German BGW (8), and the ACGIH BEI (21) (Table 1).
Tab. 1: Comparison of limit values for urinary mercury
Aspect Malaysia
(BEI) BASF
(Action Value) Germany
(BGW) US ACGIH
(BEI)
- 10 -
mercury in urine
(µg/g creatinine) 35 25 25 20
The BASF action value for urinary mercury reflects the German BGW. In 2005, the German Ministry
of Labour and Social Affairs reduced the BGW for mercury in urine from 100 µg/L (corresponding to
approximately 70 µg/g creatinine) to 25 µg/g creatinine. The creatinine-adjustment was introduced to
correct for diuretic variance, i.e., the effect of urine dilution. In 2013, the US ACGIH (21) reduced the
BEI for mercury in urine from 35 µg/g creatinine to 20 µg/g creatinine, and in 2007, the European
Scientific Committee on Occupational Exposure Limits (SCOEL) published a recommendation for 30
µg/g creatinine (14). All three evaluations were based on similar toxicological grounds, but slightly
different emphasis was given to some studies, and the final rounding of data was different.
The limit values were lowered because recent studies were able to detect subtle nephrotoxic and
neurotoxic effects at urinary concentrations below 35 µg/g creatinine. While early nephrotoxic and
behavioural toxic effects of mercury are usually reversible, some of the neurotoxic effects are not.
Long term exposure to mercury levels below 35 µg/g creatinine were associated with memory
deficits roughly equivalent to aging 10 years (21).
A reduction in BEI would mean a lower action level. Individuals with urine mercury slightly below
previous action level may now be categorised as above action level. This would mean more people
would require further assessment and medical removal protection. From an operational perspective
this would mean potential for more distruption to normal work schedule and increase in short-term
costs. However from a safety perspective, the reduction in BEI would mean earlier identification of
susceptible individuals and opportunity for preventing the health impact of exposures.
6.2.2 Mercury in Blood for HBM
DOSH recommends the determination of mercury in blood for HBM and provides a corresponding
BEI of 15 µg/L (20). Neither the German Ministry of Labour and Social Affairs nor the US ACGIH or
BASF Ludwigshafen recommend mercury in blood for HBM, on the grounds that it does not only
reflect recent exposure to inorganic mercury but, above all, exposure to organic mercury in the diet,
e.g., from seafood. This is due to the rapid distribution of organic mercury into the blood lipids and
body fat, and its subsequent elimination via the faeces rather than with urine. For inorganic mercury,
renal elimination with urine is the preferred elimination route. The European SCOEL, however, still
provides a Biological Limit Value of 10 µg/L in blood (14).
CONTENT-JOSH-DEC-2015-CS6.indd 61 23-Feb-16 9:44:35 AM

Dec 2015, vol 12, No. 2Journal of Occupational Safety and Health
62
an operational perspective this would mean potential for more distruption to normal work schedule and increase in short-term costs. However from a safety perspective, the reduction in BEI would mean earlier identification of susceptible individuals and opportunity for preventing the health impact of exposures.
ii. Mercury in Blood for HBM
DOSH recommends the determination of mercury in blood for HBM and provides a corresponding BEI of 15 µg/L (20). Neither the German Ministry of Labour and Social Affairs nor the US ACGIH or BASF Ludwigshafen recommend mercury in blood for HBM, on the grounds that it does not only reflect recent exposure to inorganic mercury but, above all, exposure to organic mercury in the diet, e.g., from seafood. This is due to the rapid distribution of organic mercury into the blood lipids and body fat, and its subsequent elimination via the faeces rather than with urine. For inorganic mercury, renal elimination with urine is the preferred elimination route. The European SCOEL, however, still provides a Biological Limit Value of 10 µg/L in blood (14).
In some industries such as oil production, there is potential exposure to organic mercury i.e. dimethyl mercury (22). If there is occupational exposure to organic mercury, there would be an indication for doing blood mercury and speciation (20)
iii. The role of personal exposure monitoring
Most workplace studies for OEL or BEI derivations rely on HBM exposure analyses. This has resulted in the rather unique situation that OELs for mercury in air are derived basically from HBM data. However, Bender and colleagues have shown in a survey of studies on mercury exposure, that the ratio between the levels of airborne mercury and the biomarker concentrations varies significant¬ly with workplace conditions (23). On these grounds, the analysis of urinary mercury seems to be superior to personal air monitoring from the perspective of health protection, in particular as HBM is more closely related to health effects (14)
- 12 -
Fig. 4: Mercury risk management for routine exposure (DOSH 2011)
At BASF, a workplace risk assessment is deemed adequate to decide whether a worker is included
in a health surveillance program. While personal exposure is investigated by personal or stationary
air monitoring in order to ensure compliance with national regulations, and to assist in identifying
sources of exposure, HBM is the central instrument for checking the efficiency of safety measures
and health protection. Once a worker has entered a mercury health surveillance program he will be
offered to participate in HBM programs on a regular basis, dependent on the results of the risk
assessment and of the HBM. While monitoring of airborne mercury is a compulsory requirement in
Fig. 4: Mercury risk management for routine exposure (DOSH 2011)
CONTENT-JOSH-DEC-2015-CS6.indd 62 23-Feb-16 9:44:35 AM

Dec 2015, vol 12, No. 2Journal of Occupational Safety and Health
63
iv. Trigger for entry into Health Survillance program
DOSH recommends that personal exposure monitoring is used to determine entry into the mercury health surveillance program (20) (Figure 4).
At BASF, a workplace risk assessment is deemed adequate to decide whether a worker is included in a health surveillance program. While personal exposure is investigated by personal or stationary air monitoring in order to ensure compliance with national regulations, and to assist in identifying sources of exposure, HBM is the central instrument for checking the efficiency of safety measures and health protection. Once a worker has entered a mercury health surveillance program he will be offered to participate in HBM programs on a regular basis, dependent on the results of the risk assessment and of the HBM. While monitoring of airborne mercury is a compulsory requirement in Germany, and carried out at BASF Ludwigshafen, the poor correlation between mercury in air and the mercury levels in urine has led to the conclusion that HBM is a better indicator of individual exposure analysis and assessment, and for checking the efficiency of occupational safety measures (22). This approach has been aligned and agreed upon as a site-specific approach between BASF Ludwigshafen and the relevant local German authorities
Conclusion
This paper shares BASF’s mercury health surveillance practice and experience, and it summarizes also the similarities and differences in health surveillance between BASF Ludwigshafen and Malaysia. The three main differences are: BASF’s action level for mercury in urine is lower (25 µg/g creatinine) than the Malaysian BEI (35 µg/g creatinine); BASF does not analyze blood mercury as a parameter for exposure to inorganic mercury; and BASF does not use personal exposure monitoring of mercury in air as a trigger for entry into health surveillance and for checking the effectiveness of health protection measures.
References
(1). BASF Annual Report 2014, http://report.basf.com/2014/en/
(2). German Medical Association (Bundesärztekammer) (2014) Richtlinie der Bundesärztekammer zur Qualitätssicherung laboratoriumsmedizinischer Untersuchungen. Deutsches Ärzteblatt 38: A1583-A1618 (in German)
(3). German External Quality Assessment Scheme (G-EQUAS) http://www.g-equas.de/
(4). Deutsche Forschungsgemeinschaft (DFG) (2001) Mercury and inorganic mercury com-
pounds. in: Hartwig A, Drexler H (editors) The MAK Collection for Health and Safety. http://onlinelibrary.wiley.com/doi/10.1002/3527600418.mb743997anoe0015/pdf
(5). American Conference of Governmental Industrial Hygienists (ACGIH) (2001) Mercury, all forms except Alkyl. Documentation of the Threshold Limit Values and Biological Exposure Indices on CD-ROM, ACGIH, Cincinnati (OH), USA
(6). German Federal Ministry of Labour and Social Affairs (BMAS) (2014) Verordnung zur arbeitsmedizinischen Vorsorge (ArbMedVV). http://www.gesetze-im-internet.de/¬arbmedvv/ (English: http://www.gesetze-im-internet.de/englisch_arbmedvv/index.html)
(7). Bundesanstalt für Arbeitsschutz und Arbeitsmedizin (BAuA) (2010). Gefahrstoffverordnung. http://www.baua.de/de/Themen-von-A-Z/Gefahrstoffe/Rechtstexte/Gefahrstoffverordnung.-html (English: http://www.baua.de/en/Topics-from-A-to-Z/Hazardous-Substances/Hazardous-Substances-Ordinance.html)
(8). Bundesanstalt für Arbeitsschutz und Arbeitsmedizin (BAuA) (2013). Technische Regel für Gefahrstoffe (TRGS) 903: Biologische Grenzwerte. http://www.baua.de/de/Themen-von-A-Z/Gefahrstoffe/TRGS/TRGS-903.html (in German)
(9). Bundesanstalt für Arbeitsschutz und Arbeitsmedizin (BAuA) (2015). Technische Regel für Gefahrstoffe (TRGS) 900: Arbeitsplatzgrenzwerte. http://www.baua.de/de/Themen-von-A-Z/Gefahrstoffe/TRGS/TRGS-900.html (in German)
(10). 10. http://www.eurochlor.org/media/69026/3-4_chlor-alkali_metallic_hg_on_site_end_2012_corrected.pdf
(11). http://www.unep.org/chemicalsandwaste/Portals/9/Mercury/Documents/chloralkali/Updates%20from%20Eurochlor/Health%202%20Edition%206.pdf
(12). BASF Group Directive Occupational Medicine and Health Protection, Revision 1, March 2010
(13). biomonitoring@BASF (2013), Occupational Medicine & Health Protection, GUA, BASF SE, Ludwigshafen, Germany
(14). Scientific Committe on Occupational Exposure Limits (SCOEL) (2007) Mercury and inorganic divalent mercury compounds. SCOEL Recommendation SUM 84, http://ec.europa.eu/social/¬main.jsp?catId=148&langId=en&intPageId=684
CONTENT-JOSH-DEC-2015-CS6.indd 63 23-Feb-16 9:44:35 AM

Dec 2015, vol 12, No. 2Journal of Occupational Safety and Health
64
(15). Human Biomonitoring Commission of the German Federal Environment Agency (Kommission Human-Biomonitoring des Umweltbundesamtes) (1999) Stoffmonographie Quecksilber, http://www.umweltbundesamt.de/sites/default/files/medien/377/dokumente/hgmono.pdf (in German)
(16). Results and implications of a longitudinal biomonitoring study on mercury exposure. Bader M, Brill S, Schlieter A, Uebler Ch, Guth J, presented at the 9th International Symposium on Biological Monitoring in Occupational and Environmental Health (ISBM), 09.-11. September 2013, Manchester, UK
(17). Besson JC, Augarde E, Nasterlack M (2012) Worker protection during mercury electrolysis cell plant decommissioning. Arh Hig Rada Toksikol 63:117-122
(18). Occupational Safety and Health (Use and Standards of Exposure of Chemicals Hazardous to Health) Regulations 2000, Department of Occupational Safety and Health, Ministry of Human Resources Malaysia
(19). Department of Occupational Safety and Health (DOSH), Malaysian Ministry of Human Resources, Guidelines on Medical Surveillance, Malaysia 2001
(20). Department of Occupational Safety and Health (DOSH), Malaysian Ministry of Human Resources, Guidelines on Mercury Management in Oil and Gas Industry, Malaysia 2011
(21). American Conference of Governmental Industrial Hygienists (ACGIH) (2015) TLVs® and BEIs®, ACGIH, Cincinnati (OH), USA
(22). US EPA Mercury in Petroleum and Natural Gas: Estimation of Emissions from Production, Processing and Combustion, 2001 http://nepis.epa.gov/Adobe/PDF/2000E6VS.pdf
(23). Bender HF, Beziel M, Krehenwinkel H, Lademann H, Munstedt R, Menig H, Will W, Nasterlack M (2006) Korrelation zwischen inhalativer Hg-Aufnahme und Ausscheidung, Gefahrstoffe - Reinhaltung der Luft 66:465-468 (in German)
(24). adapted from www.wikipedia.de, author: MarkusZik, public domain copyright
CONTENT-JOSH-DEC-2015-CS6.indd 64 23-Feb-16 9:44:35 AM

Dec 2015, vol 12, No. 2Journal of Occupational Safety and Health
65
Introduction
Exhaust emission from automobile has becoming the largest source that contribute to air pollution especially in urban and industrialized areas. It can be estimated that the vehicle population to grow close to 1300 million by the year 2030 (M. N. and H.V.N Rao, 2003 ). Air pollution has also known to be a major risk to health and environment. Outdoor air pollution is estimated to cause 1.3 million annual deaths worldwide (WHO, 2011).
Typical exhaust gas composition at the normal engine operating conditions are: carbon monoxide (CO, 0.5 vol.%), unburned hydrocarbons (HC, 350 vppm), nitrogen oxides (NOx, 900 vppm) hydrogen (H2, 0.17 vol.%), water (H2O, 10 vol.%), carbon dioxide (CO2, 10 vol.%), oxygen (O2, 0.5 vol.%) . In response to this concern, major efforts and alternative were developed in order to reduce the emission of harmful gases.
The processes which result in the formation of CO, HC, and NOx in exhaust emissions are summarized in table below (MoT 1998).
Catalytic converter is a device incorporated into the exhaust system of an automobile that reduces the amount of nitrogen oxides, carbon monoxide, and unreacted hydrocarbons in automotive emissions (Sebayang et al., 2006). Catalytic converter found to be the best option to control CO, HC and NOx emissions out of various technologies available for automobile exhaust emission control. These gases are eliminated by the basic reactions occur inside a catalytic converter through oxidation for CO and HC and reduction for NOx. Simultaneous reaction of oxidation and reduction gives it which called in term: Three Way Catalyst (TWC) and it had become
the most common type of catalytic converter (Darwin Sebayang et al., 2007 and Heck et al., 2009). Catalytic converters came in many concepts, structures and even the materials; nevertheless, it continued to evolve depending on different vehicle requirements.
The existing of excellent oxidation catalyst materials was usually based on the precious metal (Pt, Pd, and Rd). However, those materials are expensive and limited supply (Koltsakis & Stamatelos, 1997; Benson et al., 2000). In this case , the cheaper ranges of oxides (e.g. CuO, V2O5, NiO,MoO3, and Cr2O3) compared to
Development of Catalytic Converter By Washcoat Of γ-Alumina On Nickel Oxide (Nio) Catalyst In FeCrAl Substrate For Exhaust Emission Control : Proposed Study
A.M. Leman, Fatin Afiqah Jajuli and Dafit Feriyanto
Faculty of Engineering Technology, UniversitiTun Hussein Onn Malaysia (UTHM) 86400, Parit Raja, BatuPahat, Johor, Malaysia
Email: [email protected], [email protected], [email protected]
Abstract Automobile exhaust emission control is one of the trending issues in automobile research field. It caused by high pollution such as carbon monoxide (CO), nitrogen oxides (NOx), and hydrocarbons (HC) distributed by automobile especially form diesel engine. These pollutants give a harmful effect to the environment and human health. Therefore, this paper proposed in reviewing methods on fabrication of modified catalytic converter. FeCrAl is used as substrate which treated using ultrasonic bath technique which could improve the exhaust emission control. This metallic catalytic converter used as the replacement of precious metal that have high production cost. Keywords : Catalytic converter, Exhaust emission, Pollutants
INTRODUCTION
Exhaust emission from automobile has becoming the largest source that contribute to air pollution especially in urban and industrialized areas. It can be estimated that the vehicle population to grow close to 1300 million by the year 2030 (M. N. and H.V.N Rao, 2003 ). Air pollution has also known to be a major risk to health and environment. Outdoor air pollution is estimated to cause 1.3 million annual deaths worldwide (WHO, 2011).
Typical exhaust gas composition at the normal engine operating conditions are: carbon monoxide (CO, 0.5 vol.%), unburned hydrocarbons (HC, 350 vppm), nitrogen oxides (NOx, 900 vppm) hydrogen (H2, 0.17 vol.%), water (H2O, 10 vol.%), carbon dioxide (CO2, 10 vol.%), oxygen (O2, 0.5
vol.%) . In response to this concern, major efforts and alternative were developed in order to reduce the emission of harmful gases.
The processes which result in the formation of CO, HC, and NOx in exhaust emissions are summarized in table below (MoT 1998).
Table 1 : Summary of exhaust emission pollutant (MoT 1998).
No. Name of pollutant
Source
1. Carbon monoxide (CO)
Oxidation of the carbon contained in the fuel that does not proceed to the final product (CO2)
Lack of combustion air Insufficient oxygen in the air
fuel mixture can increase the CO
Development of Catalytic Converter By Washcoat Of γ-Alumina On Nickel Oxide (Nio) Catalyst In FeCrAl Substrate For Exhaust Emission Control :
Proposed StudyA.M. Leman, Fatin Afiqah Jajuli and Dafit Feriyanto
Faculty of Engineering Technology, UniversitiTun Hussein Onn Malaysia (UTHM) 86400, Parit Raja, BatuPahat, Johor, Malaysia
Corresponding Author : Email: [email protected], [email protected], [email protected]
_____________________________________________________________________________
Abstract
Automobile exhaust emission control is one of the trending issues in automobile research field. It caused by high pollution such as carbon monoxide (CO), nitrogen oxides (NOx), and hydrocarbons (HC) distributed by automobile especially form diesel engine. These pollutants give a harmful effect to the environment and human health. Therefore, this paper proposed in reviewing methods on fabrication of modified catalytic converter. FeCrAl is used as substrate which treated using ultrasonic bath technique which could improve the exhaust emission control. This metallic catalytic converter used as the replacement of precious metal that have high production cost.
Keywords : Catalytic converter, Exhaust emission, Pollutants
_____________________________________________________________________________
Dec 2015, vol 12, No. 2 : 65-70
2. Hydrocarbon (HC)
Unburned or partially oxidized fuel
Flame quenching before complete oxidation
Fuel condensing on combustion chamber surfaces
Poor mix of air and fuel 3. Nitrogen
Oxide (NOx)
Simultaneously availability of oxygen with peak flame temperature
Catalytic converter is a device incorporated into the exhaust system of an automobile that reduces the amount of nitrogen oxides, carbon monoxide, and unreacted hydrocarbons in automotive emissions (Sebayang et al., 2006). Catalytic converter found to be the best option to control CO, HC and NOx emissions out of various technologies available for automobile exhaust emission control. These gases are eliminated by the basic reactions occur inside a catalytic converter through oxidation for CO and HC and reduction for NOx. Simultaneous reaction of oxidation and reduction gives it which called in term: Three Way Catalyst (TWC) and it had become the most common type of catalytic converter (Darwin Sebayang et al., 2007 and Heck et al., 2009). Catalytic converters came in many concepts, structures and even the materials; nevertheless, it continued to evolve depending on different vehicle requirements.
The existing of excellent oxidation catalyst materials was usually based on the precious metal (Pt, Pd, and Rd). However, those materials are expensive and limited supply (Koltsakis & Stamatelos, 1997; Benson et al., 2000). In this case , the cheaper ranges of oxides (e.g. CuO, V2O5, NiO,MoO3, and Cr2O3) compared to precious metals are being investigated as an alternative catalyst (Kolaczkowski, 2006).
This work reports the use of NiO catalyst developed from Ni as a starting material. A washcoat is a catalysts carrier with high surface area. This material is usually an oxide layer such as Al2O3, SiO2, TiO2, or SiO2-Al2O3 (Heck et al., 2002). Nickel forms under a normal temperature and pressure conditions only one oxide, NiO. This project is aimed to full washcoat material on the catalyst and substrate using electrochemical and modified surface treatment via ultrasonic bath technique. It purposed to improve the exhaust emission control system. Exhaust gas emission test will be performed in order to investigate the effectiveness of the coated materials to the exhaust emission control.
LITERATURE REVIEW
Exhaust Emission
In the past, vehicular emission abatement was concerned mainly with the residual uncombusted HC, the partial combustion product CO, NOx formed from atmospheric nitrogen during combustion, and particulate matter (PM), especially carbonaceous particulate formed in diesel engines (M.Shelef et al.,1978, J.T. Kummer, 1980).
Catalytic Converter
Catalytic converter is a stainless steel container mounted along the exhaust pipe of the engine and have a porous ceramic structure through which the exhaust gas flows inside the container (Ganesan, 2004). A catalytic converter consists of three basic components, i.e. substrate, washcoat and catalyst (Sebayang et al., 2009) .The active catalyst layer were applied on the surface of monolith walls. The coating, called ‘washcoat’, is composed of porous, high
CONTENT-JOSH-DEC-2015-CS6.indd 65 23-Feb-16 9:44:35 AM

Dec 2015, vol 12, No. 2Journal of Occupational Safety and Health
66
precious metals are being investigated as an alternative catalyst (Kolaczkowski, 2006).
This work reports the use of NiO catalyst developed from Ni as a starting material. A washcoat is a catalysts carrier with high surface area. This material is usually an oxide layer such as Al2O3, SiO2, TiO2, or SiO2-Al2O3 (Heck et al., 2002). Nickel forms under a normal temperature and pressure conditions only one oxide, NiO. This project is aimed to full washcoat material on the catalyst and substrate using electrochemical and modified surface treatment via ultrasonic bath technique. It purposed to improve the exhaust emission control system. Exhaust gas emission test will be performed in order to investigate the effectiveness of the coated materials to the exhaust emission control.
Literature Review
Exhaust Emission
In the past, vehicular emission abatement was concerned mainly with the residual uncombusted HC, the partial combustion product CO, NOx formed from atmospheric nitrogen during combustion, and particulate matter (PM), especially carbonaceous particulate formed in diesel engines (M.Shelef et al.,1978, J.T. Kummer, 1980).
Catalytic Converter
Catalytic converter is a stainless steel container mounted along the exhaust pipe of the engine and have a porous ceramic structure through which the exhaust gas flows inside the container (Ganesan, 2004). A catalytic converter consists of three basic components, i.e. substrate, washcoat and catalyst (Sebayang et al., 2009) .The active catalyst layer were applied on the surface of monolith walls. The coating, called ‘washcoat’, is composed of porous, high surface area inorganic oxides such as γ-Al2O3 (gamma alumina), CeO2 (Ceria) and ZrO2 (Zirconia). Noble metal catalysts, such as Platinum (Pt), Palladium (Pd) and Rhodium (Rh), are deposited on the surface and within the pores of the washcoat (Pontikakis, 2003).
Metallic FeCrAl catalytic converter is very challenging to explore as compared to ceramic catalytic
converter. It is selected as the substrate since the higher thermal conductivity, lower heat capacity, greater thermal and mechanical shock resistant, thinner wall, lower pressure drop (Wu et al., 2005), higher coefficient of thermal expansion (CTE) (Zhao et al., 2003) high temperature oxidation resistance and achieve larger specific surface area as shown in Figure (Putrasari et al., 2010). FeCrAl have excellent oxidation resistance at high temperature around 1300 0C which suitable for material which operated in high temperature such as in industrial furnace, heating elements and as catalytic converter.
The washcoat is a kind of ceramic layer (oxide layer) which has specific surface area and acts as support for catalyst materials. . The waschoat also acts as a barrier from high temperature corrosion (Cueff et al.,2004). Alumina (Al2O3) is one of the most applied washcoat materials (Xu & Moulijn, 2006; Heck, et al., 2009). The washcoat is a thin layer of alumina (Al2O3) coating, typically 20-150 μm thick with a high surface area on the top of substrate. cross section image of washcoat and catalyst on FeCrAl substrate (honeycomb) is shown in Figure 3.
A catalyst configuration comprises: a substrate, a NiO layer was disposed on the substrate, and a catalyst layer comprising a NOx adsorbing catalyst was patented
by Dou (2005). The method is making a NOx absorber by thermally treating NiO to a temperature of about a maximum catalyst application temperature minus 100 oC and the maximum catalyst application temperature.
surface area inorganic oxides such as γ-Al2O3 (gamma alumina), CeO2 (Ceria) and ZrO2
(Zirconia). Noble metal catalysts, such as
Platinum (Pt), Palladium (Pd) and Rhodium (Rh), are deposited on the surface and within the pores of the washcoat (Pontikakis, 2003).
Figure 1 : Catalytic converter monolith of (1) ceramic material and (2) metallic material
Metallic FeCrAl catalytic converter is very challenging to explore as compared to ceramic catalytic converter. It is selected as the substrate since the higher thermal conductivity, lower heat capacity, greater thermal and mechanical shock resistant, thinner wall, lower pressure drop (Wu et al., 2005), higher coefficient of thermal expansion (CTE) (Zhao et al., 2003) high temperature oxidation resistance and achieve larger specific surface area as shown in Figure (Putrasari et al., 2010). FeCrAl have excellent oxidation resistance at high temperature around 1300 0C which suitable for material which operated in high temperature such as in industrial furnace, heating elements and as catalytic converter.
Figure 2 : Specific surface area of the ceramic and metal substrate (Putrasari et al.,
2010)
The washcoat is a kind of ceramic layer (oxide layer) which has specific surface area and acts as support for catalyst materials. . The waschoat also acts as a barrier from high temperature corrosion (Cueff et al.,2004). Alumina (Al2O3) is one of the most applied washcoat materials (Xu & Moulijn, 2006; Heck, et al., 2009). The washcoat is a thin layer of alumina (Al2O3) coating, typically 20-150 μm thick with a high surface area on the top of substrate. cross section image of
CONTENT-JOSH-DEC-2015-CS6.indd 66 23-Feb-16 9:44:36 AM

Dec 2015, vol 12, No. 2Journal of Occupational Safety and Health
67
Figure 4: Schematic diagram of electroplating process
Oxidation test of coated FeCrAl
The oxidation test is conducted using tube furnace and automatic furnace in temperature
of 11000C. Tube furnace and automatic furnace are conducted for 100 hours which divided into 5 cycles as shown in Figure 5.
Figure 5 : Cyclic oxidation of coated Fe-Cr-Al at temperature of 11000C for 100 hours
Exhaust Emission Testing
Testing for the effectiveness of the prepared catalyst can be observed by undergo the emission testing. The emission test was conducted by multi-gas analyzer equipped with a hydraulic dynamometer for emission measurements of HC, CO, and NOx. . The emission test will be conducted at each operating point in varying speed and load for
both conditions with and without catalytic converter. The gas analyzer employed in the setup is capable to measure simultaneous reactions of CO, HC and NOx. It also incorporates a probe, suitable to measure the gases at the inlet and outlet region, along with the thermocouple, to attain temperature values for ambient and the exhaust gas itself. Figure 6 shows the flow experimental setup.
NiO created through plating Ni to the substrate FeCrAl and NiO existed through oxidization in high temperature. This approach is completely creatively new in order to replace the the existing of excellent catalyst materials of precious metal of Pt, Pd, and Rd which are expensive and limited supply.
Methodology
There are several methods for coating the fabrication of modified catalytic converter such as ultrasonic bath and electroplating technique.
Ultrasonic bath process
Ultrasonic bath is conducted to FeCrAl foil which
have fabricated as metallic monolith coated by γ-Al2O3 powder. The samples are cleaned in water and then proceed in methanol for 5 minutes. During ultrasonic process, the frequency of 35 kHz and ultrasonic times of 4.5 hours are imposed. That holding time is selected according to Leman et al., (2015) that the ultrasonic time for 4.5 h has most effective to achieve high thermal stability of metallic material. The samples are immersed into the beaker with γ-Al2O3 powder and ethanol with the concentration of 20 g/l.
Nickel electroplating on FeCrAl substrate
Main purpose of the Nickel electroplating process is for depositing nickel onto FeCrAl. Electroplating is conducted on FeCrAl after new ultrasonic treatment. Electroplating process is conducted through some components such as electrolyte, anti-pitting agent, anode and cathode. Sulphamate type is used as the electrolyte medium. It have composition which consists of nickel (II) sulphate 6-hydrate (NiSO4.6H2O), nickel (ii) chloride (NiCl2•6H2O), boric acid (H3BO3), and sodium dodecyl sulfate (C12H25OSO3.Na). The electrolyte prepared with distilled water, at a constant temperature of 40-600C, and pH value of solution adjusted to 2.5-4.5 using HCl and NaOH reagent. The electrolyte agitated using a magnetic stirrer. The schematic diagram of electroplating process is shown in Figure 4.
Oxidation test of coated FeCrAl
The oxidation test is conducted using tube furnace and automatic furnace in temperature of 11000C. Tube furnace and automatic furnace are conducted for 100 hours which divided into 5 cycles as shown in Figure 5.
washcoat and catalyst on FeCrAl substrate (honeycomb) is shown in Figure 3.
Figure 3 : SEM image of washcoat and catalyst on FeCrAl substrate (Heck and
Farrauto, 2001)
A catalyst configuration comprises: a substrate, a NiO layer was disposed on the substrate, and a catalyst layer comprising a NOx adsorbing catalyst was patented by Dou (2005). The method is making a NOx absorber by thermally treating NiO to a temperature of about a maximum catalyst application temperature minus 100 oC and the maximum catalyst application temperature. NiO created through plating Ni to the substrate FeCrAl and NiO existed through oxidization in high temperature. This approach is completely creatively new in order to replace the the existing of excellent catalyst materials of precious metal of Pt, Pd, and Rd which are expensive and limited supply.
METHODOLOGY
There are several methods for coating the fabrication of modified catalytic converter such as ultrasonic bath and electroplating technique.
Ultrasonic bath process
Ultrasonic bath is conducted to FeCrAl foil which have fabricated as metallic monolith coated by γ-Al2O3 powder. The samples are cleaned in water and then proceed in methanol for 5 minutes. During ultrasonic process, the frequency of 35 kHz and ultrasonic times of 4.5 hours are imposed. That holding time is selected according to Leman et al., (2015) that the ultrasonic time for 4.5 h has most effective to achieve high thermal stability of metallic material. The samples are immersed into the beaker with γ-Al2O3 powder and ethanol with the concentration of 20 g/l. Nickel electroplating on FeCrAl substrate
Main purpose of the Nickel electroplating process is for depositing nickel onto FeCrAl. Electroplating is conducted on FeCrAl after new ultrasonic treatment. Electroplating process is conducted through some components such as electrolyte, anti-pitting agent, anode and cathode. Sulphamate type is used as the electrolyte medium. It have composition which consists of nickel (II) sulphate 6-hydrate (NiSO4.6H2O), nickel (ii) chloride (NiCl2•6H2O), boric acid (H3BO3), and sodium dodecyl sulfate (C12H25OSO3.Na). The electrolyte prepared with distilled water, at a constant temperature of 40-600C, and pH value of solution adjusted to 2.5-4.5 using HCl and NaOH reagent. The electrolyte agitated using a magnetic stirrer. The schematic diagram of electroplating process is shown in Figure 4.
Top Coat
Bottom coat
Honeycomb
CONTENT-JOSH-DEC-2015-CS6.indd 67 23-Feb-16 9:44:36 AM

Dec 2015, vol 12, No. 2Journal of Occupational Safety and Health
68
Exhaust Emission Testing
Testing for the effectiveness of the prepared catalyst can be observed by undergo the emission testing. The emission test was conducted by multi-gas analyzer equipped with a hydraulic dynamometer for emission measurements of HC, CO, and NOx. . The emission test will be conducted at each operating point in varying speed and load for both conditions with and without catalytic converter. The gas analyzer employed in the setup is capable to measure simultaneous reactions of CO, HC and NOx. It also incorporates a probe, suitable to measure the gases at the inlet and outlet region, along with the thermocouple, to attain temperature values for ambient and the exhaust gas itself. Figure 6 shows the flow experimental setup.
This exhaust emission analysis is carried out using Direct -injection diesel engine model TF120 YANMAR one cylinder with capacity of 12 HP as shown in Figure 7 . The four-stroke cycle engine will be used and it operated at 2200 rpm with various engine loads of 20, 40, 60 and 80% which adjusted using hydraulic dynamometer. Diesel oil is used as fuel and temperature will be recorded using thermocouple which placed at downstream of the exhaust valve.
Expected Results
From this study, the results are expected that γ-Al2O3 as the washcoat material will fully embedded to FeCrAl substrate because the combination coating technique performed to the modified catalytic converter. Ultrasonic technique as first coating process aimed to produce the fine surface of FeCrAl in order to more effective of γ-Al2O3 coating. That method followed by electroplating as special surface finishing technology. These techniques are potential to improve the oxidation resistance properties of the modified catalytic converter. It also will effective to convert the CO, NOx and HC to CO2, NO2 and H2O which means that that catalytic converter is effective to improve exhaust emission control of diesel engine. It impact to the environment and improve the health care of the society from the automobile pollutant.
Conclusions
The FeCrAl substrate as metallic catalytic converter which coated by γ-Al2O3 using ultrasonic and nickel-electroplating technique may improve the exhaust emission control which tested using Direct -injection diesel engine model TF120 YANMAR. It will becoming new contribution to the automobile research field and as
reference as well as knowledge for the next researchers.
Acknowledgments
This work was financially supported by Ministry of Education through FRGS Vot 1216 and ORICC, Universiti Tun Hussein Onn Malaysia (UTHM) for the management of the research grant.
References
(1). Leman, A.M. Feriyanto, D. Salleh, M.N.M. Baba, I. 2015. Evaluation of thermal properties of the Fe80Cr20 nanostructure for interconnect application in high temperature. Applied Mechanics and Materials, (815), 193-197.
Figure 6 : Emissions measurements set-up
This exhaust emission analysis is carried out using Direct -injection diesel engine model TF120 YANMAR one cylinder with capacity of 12 HP as shown in Figure 7 . The four-stroke cycle engine will be used and it operated at 2200 rpm with various engine loads of 20, 40, 60 and 80% which adjusted using hydraulic dynamometer. Diesel oil is used as fuel and temperature will be recorded using thermocouple which placed at downstream of the exhaust valve.
Figure 7 : Direct -injection diesel engine model TF120 YANMAR
EXPECTED RESULTS
From this study, the results are expected that γ-Al2O3 as the washcoat material will fully embedded to FeCrAl substrate because the combination coating technique performed to the modified catalytic converter. Ultrasonic technique as first coating process aimed to produce the fine surface of FeCrAl in order to more effective of γ-Al2O3 coating. That method followed by electroplating as special surface finishing technology. These techniques are potential to improve the oxidation resistance properties of the modified catalytic converter. It also will effective to convert the CO, NOx and HC to CO2, NO2 and H2O which means that that catalytic converter is effective to improve exhaust emission control of diesel engine. It impact to the environment and improve the health care of the society from the automobile pollutant.
CONTENT-JOSH-DEC-2015-CS6.indd 68 23-Feb-16 9:44:36 AM

Dec 2015, vol 12, No. 2Journal of Occupational Safety and Health
69
(2). Bartholomew, C. H. & Farrauto, R. J. 2006. Fundamentals of Industrial Catalytic Processes 2nd ed. New Jersey. John Wiley & Son. , (10) , 706, 733- 735.
(3). Benson, M.; Bennett, C.R.; Harry, J.E.; Patel, M.K. & M. Cross. 2000 . The Recovery Mechanism of Platinum Group Metals from Catalytic Converters in Spent Automotive Exhaust Systems. Resources, Conservation and Recycling, (31) , 1-7
(4). Cueff, R., Buscail, H., Caudron, E., Riffard, F., Issartel, C., & El Meski, S. 2004 . Effect of reactive element oxide coating on the high temperature oxidation behaviour of FeCrAl alloys. Applied Surface Science, (229), 233-241.
(5). Dou, D. 2005. NiO catalyst configurations, methods for making NOx adsorbers, and methods for reducing emissions. US patent 6,930,073 B2.
(6). Environmental Protection Agency, EPA National Vehicle and Fuel Emissions Laboratory. (n.d.). Automobile emissions: An overview (EPA 400-F-92-007). Retrieved from Office of Mobile Sources website: http://www.epa.gov/otaq/consumer/05autos.pdf
(7). Ganesan, V., 2004, “Internal Combustion Engines,” Second Edition, McGraw Hill
(8). Hayes, R.E. & Kolaczkowski, S.T. 1997 . Introduction to Catalytic Combustion. Netherlands: Gordon and Breach Science Publishers.
(9). Heck, R.M., Farrauto, R.J., & Gulati, S.T. 2002. Catalytic Air Pollution Control Comercial Technology 2nd ed. USA: John Wiley & Sons, Inc.
(10). Heck, R.M., Farrauto, R.J. & Gulati, S.T. 2009 . Catalytic Air Pollution Control Commercial Technology. 3rd ed. USA: John Wiley & Sons, Inc.
(11). J.T. Kummer, 1980 .J. Prog. Energy Combust. Sci. 6 177.
(12). Kolaczkowski, S. 2006. Treatment of Volatile Organic Carbon (VOC) Emissions from Stationary Sources: Catalytic Oxidation of The Gaseous Phase. In: Structured Catalysts and Reactors 2nd ed,
(13). Koltsakis, G.C. & Stamatelos, A.M. . 1997. Catalytic Automotive Exhaust After Treatment.Progress in Energy and Combustion Science, (23), No. 1, 1-39
(14). M. N. Rao, and H. V. N. Rao. 2003. Air pollution, Tata McGraw-Hill publishing company limited – New Delhi, Chapter 2, 4-12
(15). Ministry of Transport (MOT) . 1998. Vehicle Emissions Testing Programmes: Petrol and Diesel Vehicles. Technical Report compiled by the NZ Ministry of Transport in support of the Vehicle Fleet Emission Control Strategy
(16). M. Shelef, K. Otto, N.C. Otto. 1978. “Advance Catalytic “, 27 311.
(17). Pontikakis, G.N. 2003, “Modeling, Reaction Schemes and Kinetic Parameter Estimation in Automotive Catalytic Converters and Diesel Particulate Filters,” Published Thesis, University of Thessaly, Greece: Department of Mechanical and Industrial Engineering
(18). R. Heck, and R. Farrauto, 2001. ʺAutomobile exhaust catalystsʺ, Applied Catalysis A: General, (221) , 443-457.
(19). Sebayang, D., Amirnordin, S.H., Untoro, P., & Abd Rahman, H. 2006 . Current Status on The Development of catalytic Converter Project. 1st Malaysian Technical University Colleges Annual Conference on Engineering andTechnology (MUCET). Malaysia.
(20). Sebayang, D., Untoro, P., Aminordin, S.H., & Abd Rahman, H. 2007 . Development of an Innovative Three Way Catalytic Converter: Effort and Challenge. World Engineering Congress, Institute of Engineers Malaysia(IEM). Malaysia
(21). Sebayang, D., Untoro, P., Putrasari, Y., Hashim, M., Soon, Y.H., & Gooma, M. 2009. Influence of difference deposition technique of nickel on the FeCrAl metallic monolith. Malaysian Metallurgical Conference. Perlis: Universiti Malaysia Perlis
(22). WHO, 2011. World Health Organization Fact sheet N313. Air Quality and Health. http://www.who.int/mediacentre/factsheets/fs313/ en/index.html.
(23). Wu, X., Weng, D., Zhao, S. & Chen, W. .2005. Influence of An Aluminized Intermediate Layer on The Adhesion of a Gamma-AL2O3 Washcoat on FeCrAl. Surface & Coatings Technology,(190), No. 2-3, 434– 439.
(24). Xu, X. & Moulijn, J.A. 2006. Transformation of Structured Carrier into a Structured Catalyst. in Cybulski, A. & Moulijn, J.A. (Eds.). Structured Catalysts and Reactors 2nd ed. USA: Taylor & Francis Group. 751-777.
(25). Zhao, S.; Zhang, J.; Weng, D. & Wu, X. 2003. A Method to Form Well-Adhered γ-Al2O3 Layers on FeCrAl Metallic Supports. Surface and Coating Technology, Vol. 167, No.1,97-105.
CONTENT-JOSH-DEC-2015-CS6.indd 69 23-Feb-16 9:44:36 AM

Dec 2015, vol 12, No. 2Journal of Occupational Safety and Health
70
CONTENT-JOSH-DEC-2015-CS6.indd 70 23-Feb-16 9:44:36 AM

Dec 2015, vol 12, No. 2Journal of Occupational Safety and Health
71
Introduction
Air pollution and global warming is a major issue nowadays. For this reason, emission limits are introduced around the world and continually being made stricter every year. The enforcement of this regulation has led to the compulsory utilization of catalytic converter as an emission treatment to the exhaust gas of vehicles (Chelef and Mc. Cabe, 2000). Catalytic converter is commonly installed as a device in the exhaust system of an automobile to convert toxic exhaust gas into less harmful gas. Catalyst metals are introduced in catalytic converter to increase the rate of destruction of toxic gases such as carbon monoxide, nitrogen oxide and unburned fuel resulted from incomplete combustion of fuel (Hakan Kelili, 2001).
A serious issue that is always been debated among the environmentalists over the decades and recent years is air pollution. One of the main contributors is said to be the emission of harmful gases produced by vehicle exhaust lines (Mohiudin and Norhafez, 2007). Transportation is responsible for a large part of global emissions (Pachauri and Reisinger, 2007). The numbers of transportation have increased many folds (about ten times) in the last fifty years which resulted in an enormous increase in urban air pollution level especially in developing countries (Mansha et al., 2013). Two methods are being used to reduce harmful engine out exhaust emissions. One is to improve the engine technology and composition of fuels and introduction of alternative fuels so that better combustion occurs and consequently fewer emissions are generated. The second method is post combustion after treatment of the engine out exhaust gases.
A large part of the current studies is devoted to find efficient catalysts to improve their action efficiency, but
one can also optimize the performance of this equipment by acting on the flow distribution inside the catalytic converter (Cansu Ozhan et al., 2014).
Literature Review
Catalytic Converter
Catalytic converter is a stainless steel container mounted somewhere along the exhaust pipe of the engine and inside the container is a porous ceramic structure through which the exhaust gas flows (Ganessan V., 2004). In most converters, the ceramic is a single honeycomb structure with many flow passages. The passages comprise of many shapes, including square, triangular, hexagonal and sinusoidal (Mohiudin and Norhafez, 2007). Early converters used loose granular ceramic with the gas passing between the packed spheres. Since it is difficult to keep the spheres in place, many converter developers opted for ceramic monolith which offers various advantages. Among these advantages are smaller volumes, lower mass and greater ease of packaging (Heck and Farrauto, 1995). Figure 1 show a schematic of catalytic converter based on the gas
Simulation on Toxic Gases of Vehicle Exhaust Equipped with Modified Catalytic Converter for Air Pollution Control : Proposed Study
A.M. Leman, Fakhrurrazi Rahman and Dafit Feriyanto
Faculty of Engineering Technology, UniversitiTun Hussein Onn Malaysia (UTHM) 86400, Parit Raja, BatuPahat, Johor, Malaysia
Corresponding Author : Email: [email protected], wanfakhrurrazi41@gmail, [email protected]
_____________________________________________________________________________
Abstract
The simulation of the catalytic converter system is quite needed in order to characterize the catalyst and also optimizing the monolithic design for the gas emission in the catalytic converter and other related mechanism. The objective of this study is to obtain quantitative description of the gas emission in the catalytic converter system of natural powered automobile exhaust gas using ANSYS Software. This work will present a finite element calculation to predict and evaluate the mass transfer, energy balance and velocity of gas emission in the catalytic converter. The expected result for this research is to evaluate data of the gas emission obtained from the software to be compared with the manual experiment in order to verify the effectiveness of modified catalytic converter.
Keywords : Numerical simulation, Catalytic converter, Gas emission, Monolith reactor
_____________________________________________________________________________
Dec 2015, vol 12, No. 2 : 71-76
to improve the engine technology and composition of fuels and introduction of alternative fuels so that better combustion occurs and consequently fewer emissions are generated. The second method is post combustion after treatment of the engine out exhaust gases.
A large part of the current studies is devoted to find efficient catalysts to improve their action efficiency, but one can also optimize the performance of this equipment by acting on the flow distribution inside the catalytic converter (Cansu Ozhan et al., 2014). LITERATURE REVIEW
Catalytic Converter Catalytic converter is a stainless steel container mounted somewhere along the exhaust pipe of the engine and inside the container is a porous ceramic structure through which the exhaust gas flows (Ganessan V., 2004). In most converters, the ceramic is a single honeycomb structure with many flow passages. The passages comprise of many shapes, including square, triangular, hexagonal and sinusoidal (Mohiudin and Norhafez, 2007). Early converters used loose granular ceramic with the gas passing between the packed spheres. Since it is difficult to keep the spheres in place, many converter developers opted for ceramic monolith which offers various advantages. Among these advantages are smaller volumes, lower mass and greater ease of packaging (Heck and Farrauto, 1995). Figure 1 show a schematic of catalytic converter based on the gas emission flow.
Figure 1: schematic of gas flow in catalytic converter,
(1) inlet header; (2) steel shell; (3) matting; (4)
monolith and (5) outlet header (Wu Guojiang et al.,
2004)
In general the efficiency of the catalyst is dependent upon two parameters, namely the physical formulation and the nature of the flowing gas containing different chemical species. Recently widely applied fuel injection reduces to a large extend this phenomena.
Engine performance changes as a result of negative effect of gas wave motion in exhaust system with monolith of converter, which should be fixed in exhaust pipe (Wojciech and Władyslaw, 2002).
Catalytic Converters are important post combustion after treatment devices mounted in the exhaust system of engines to reduce engine out exhaust emissions and are classified as Two-Way or Three-Way. Two-Way Catalytic Converter works on two gases, CO and unburned HC while the NOx is controlled though exhaust gas recirculation (EGR) and by retarding the ignition timing (M. Mansha et. al., 2013). The active catalyst layer is applied on the monolith walls. The coating, called ‘wash coat’, is composed of porous, high surface area inorganic oxides such as γ-Al2O3 (gamma alumina), CeO2 (Ceria) and ZrO2 (Zirconia). Noble metal catalysts, such as Platinum (Pt), Palladium (Pd) and Rhodium (Rh), are deposited on the
CONTENT-JOSH-DEC-2015-CS6.indd 71 23-Feb-16 9:44:36 AM

Dec 2015, vol 12, No. 2Journal of Occupational Safety and Health
72
emission flow. In general the efficiency of the catalyst is dependent upon two parameters, namely the physical formulation and the nature of the flowing gas containing different chemical species. Recently widely applied fuel injection reduces to a large extend this phenomena.
Engine performance changes as a result of negative effect of gas wave motion in exhaust system with monolith of converter, which should be fixed in exhaust pipe (Wojciech and Władyslaw, 2002).
Catalytic Converters are important post combustion after treatment devices mounted in the exhaust system of engines to reduce engine out exhaust emissions and are classified as Two-Way or Three-Way. Two-Way Catalytic Converter works on two gases, CO and unburned HC while the NOx is controlled though exhaust gas recirculation (EGR) and by retarding the ignition timing (M. Mansha et. al., 2013). The active catalyst layer is applied on the monolith walls. The coating, called ‘wash coat’, is composed of porous, high surface area inorganic oxides such as γ-Al2O3 (gamma alumina), CeO2 (Ceria) and ZrO2 (Zirconia). Noble metal catalysts, such as Platinum (Pt), Palladium (Pd) and Rhodium (Rh), are deposited on the surface and within the pores of the wash coat (Pontikakis, 2003).
The chemical kinetics for the various heterogeneous reactions in a catalytic converter depend on several factors and have to be determined accurately for good qualitative and quantitative predictions by the model. The reaction rates are different for each wash coat formulation and cannot be determined a priori because (1) the kinetics are very sensitive to the wash coat formulation, (2) catalytic processes suffer from aging and deactivation, (3) the reaction path depends on the possible presence of species in real exhaust gas that are not present in controlled experimental studies, and (4) the kinetics is sensitive to feed composition and temperature (Koteswara et al., 2009).
Gas emission
The three pollutants of concern emitted from the spark ignition engines are unburned HC, CO and NOx (currently regulated). Unburned HC and CO are generated due to inefficient combustion while the thermal NOx is formed when nitrogen reacts with excess oxygen at higher temperature (>1800K) in the combustion process and is the predominant form produced by Zeldovich Mechanism in combustion engines (Mansha et. al., 2012).
Monolith Reactor
The important of monolith reactors has grown rapidly in the last two decades. They serve mainly as tools for environmental protection (Chuah et. al., 2004). Catalytic monolith reactors have numerous applications in industrial processes and as technical devices. Although, they are used successfully to reduce the vehicles’ emissions for more than two decades, they still remain a very complex system from the modelling viewpoint (Stephen and Olaf, 2005). Monolith reactor consists of thin parallel straight channels of arbitrary shape, through which the gas containing the reactant flows. The walls of the channels are coated with a porous ceramic containing the catalyst layer.
Simulation Software
Numerical simulation is used as an effective tool for the investigation of the catalytic properties of a catalytic converter and for the prediction of the performance of the catalyst. There are various types of CFD commercial software such as PHOENICS, ANSYS, CFX and STAR-CD. By modelling the exhaust gas flow, the pressure drop and the uniformity of flow through the substrate can be determined. ANSYS FLUENT is used to model the flow of the gas emission through catalytic converter geometry, so that the flow field structure is analysed (Sekar et al., 2014).
Methodology
According to the purpose of this study, it is to develop a simulation for the gas emission flow distribution in the modified catalytic converter using ANSYS Software to be compared with the manual experiment. The simulation steps involved several previous steps such as developing of mathematical equation (thermodynamic) using for energy and mass balance, heat and mass transfer coefficient and flow uniformity index (γ).
Thermodynamic reactions in converter
Thermodynamic reactions in one-dimensional system can be presented in a form of equations of mass balance of certain exhaust components and energy balance in gaseous phase and solid phase (on surface of catalyst walls). There is taken into account four exhaust components.
Additionally, heat conduction can occur in the solid phase. These led to internal energy changes in the solid phase. The energy balance in the gas and solid phases
Thermodynamic reactions in converter
Thermodynamic reactions in one-dimensional system can be presented in a form of equations of mass balance of certain exhaust components and energy balance in gaseous phase and solid phase (on surface of catalyst walls). There is taken into account four exhaust components.
Additionally, heat conduction can occur in the solid phase. These led to internal energy changes in the solid phase. The energy balance in the gas and solid phases can be expressed by Eq. 1 and 2, respectively (Hayes and Kolaczkowski, 1997):
04 gs
H
gmgg TTh
DdxdT
vC (1)
TTCRHTTh
xTk
xS
PSSWsii
iRgss
ws
,, (2)
Where:
g and S = Gas density and solid phase
density
gC and PSC = Constant pressure heat capacity in gas and solid phase, respectively in J kg-1 K-1 vm = Mean mass average velocity in msec-1
h = Heat transfer coefficient in W m-2 K-1
sT and gT = Temperature in gas and solid
phases, respectively in K
W = Reactor wall thickness in m and iRH , is enthalpy of reaction I in J mol-1
Energy Balance Equation
For energy balance, enthalpy flowed in the gas phase without chemical reaction and heat convection can transfer from the gas phase to the solid phase. In the solid phase, chemical reaction occurred and heat convection can
also transfer from the solid phase to the gas phase.
Heat and Mass Transfer Coefficient
Developing of laminar flow in tubes must be analysed using numerical solutions. According Pontikakis and Stamatelos (2001), the proposed formulas of heat transfer balance (eq. 3) has been adopted it in the simulation on the catalytic converter
Heat and Mass Transfer Balance Equation
Convection heat transfer balance is calculated based on Eq. 3 and similar manner with mass transfer balance is calculated based on Eq. 4.
gsg
zg TThsz
TuC
(3)
jssjmgj
zgj
g xxSkzx
ut
x,,
(4)
Meshing and Boundary Condition
Mesh model for the catalytic converter is created using ANSYS Software as it is a
CONTENT-JOSH-DEC-2015-CS6.indd 72 23-Feb-16 9:44:36 AM

Dec 2015, vol 12, No. 2Journal of Occupational Safety and Health
73
can be expressed by Eq. 1 and 2, respectively (Hayes and Kolaczkowski, 1997):
Where:
ρg and ρs = Gas density and solid phase density
Cρg and C ρs = Constant pressure heat capacity in gas and solid phase, respectively in J kg-1 K-1
vm = Mean mass average velocity in msec-1
h = Heat transfer coefficient in W m-2 K-1
Ts and Tg = Temperature in gas and solid phases, respectively in K
δw = Reactor wall thickness in m and ΔHRi is enthalpy of reaction I in J mol-1
Energy Balance Equation
For energy balance, enthalpy flowed in the gas phase without chemical reaction and heat convection can transfer from the gas phase to the solid phase. In the solid phase, chemical reaction occurred and heat convection can also transfer from the solid phase to the gas phase.
Heat and Mass Transfer Coefficient
Developing of laminar flow in tubes must be analysed using numerical solutions. According Pontikakis and Stamatelos (2001), the proposed formulas of heat transfer balance (eq. 3) has been adopted it in the simulation on the catalytic converter
Heat and Mass Transfer Balance Equation
Convection heat transfer balance is calculated based on Eq. 3 and similar manner with mass transfer balance is calculated based on Eq. 4.
Meshing and Boundary Condition
Mesh model for the catalytic converter is created using ANSYS Software as it is a powerful and flexible general-purpose computational fluid dynamics software package used to model flow, turbulence, heat transfer, and reactions for industrial applications.
Flow Uniformity Index (γ)
In order to evaluate the uniformity of flow velocity at the cross-section of a converter, the flow uniformity index is introduced as Eq. 5.
Designing Catalytic Converter
The catalytic converter model is designed in order to simulate the catalytic converter using ANSYS Software. The simulation of the catalytic converter is to investigate the gas emission flow in the substrate, gas velocity, heat transfer occurs in the catalytic converter and energy balance. Figure 2 below show the monolith that will be used in this study. This monolith is made of FeCrAl with diameter of 9 cm. The mesh grid of the monolith is 1 mm2.
This monolith is then will be merge into the catalytic converter model before being analysed by using Computational Fluid Dynamics (CFD). Figure 3 show catalytic converter model designed by that is equip with NiO catalyst and FeCrAl monolith.
Thermodynamic reactions in converter
Thermodynamic reactions in one-dimensional system can be presented in a form of equations of mass balance of certain exhaust components and energy balance in gaseous phase and solid phase (on surface of catalyst walls). There is taken into account four exhaust components.
Additionally, heat conduction can occur in the solid phase. These led to internal energy changes in the solid phase. The energy balance in the gas and solid phases can be expressed by Eq. 1 and 2, respectively (Hayes and Kolaczkowski, 1997):
04 gs
H
gmgg TTh
DdxdT
vC (1)
TTCRHTTh
xTk
xS
PSSWsii
iRgss
ws
,, (2)
Where:
g and S = Gas density and solid phase
density
gC and PSC = Constant pressure heat capacity in gas and solid phase, respectively in J kg-1 K-1 vm = Mean mass average velocity in msec-1
h = Heat transfer coefficient in W m-2 K-1
sT and gT = Temperature in gas and solid
phases, respectively in K
W = Reactor wall thickness in m and iRH , is enthalpy of reaction I in J mol-1
Energy Balance Equation
For energy balance, enthalpy flowed in the gas phase without chemical reaction and heat convection can transfer from the gas phase to the solid phase. In the solid phase, chemical reaction occurred and heat convection can
also transfer from the solid phase to the gas phase.
Heat and Mass Transfer Coefficient
Developing of laminar flow in tubes must be analysed using numerical solutions. According Pontikakis and Stamatelos (2001), the proposed formulas of heat transfer balance (eq. 3) has been adopted it in the simulation on the catalytic converter
Heat and Mass Transfer Balance Equation
Convection heat transfer balance is calculated based on Eq. 3 and similar manner with mass transfer balance is calculated based on Eq. 4.
gsg
zg TThsz
TuC
(3)
jssjmgj
zgj
g xxSkzx
ut
x,,
(4)
Meshing and Boundary Condition
Mesh model for the catalytic converter is created using ANSYS Software as it is a
powerful and flexible general-purpose computational fluid dynamics software package used to model flow, turbulence, heat transfer, and reactions for industrial applications.
Flow Uniformity Index (γ)
In order to evaluate the uniformity of flow velocity at the cross-section of a converter, the flow uniformity index is introduced as Eq. 5.
An
Aw
wwi
in
i
..2
.)(
1
2
1
(5)
An
Aww
i
n
ii
.
.1
Designing Catalytic Converter
The catalytic converter model is designed in order to simulate the catalytic converter using ANSYS Software. The simulation of the catalytic converter is to investigate the gas emission flow in the substrate, gas velocity, heat transfer occurs in the catalytic converter and energy balance. Figure 2 below show the monolith that will be used in this study. This monolith is made of FeCrAl with diameter of 9 cm. The mesh grid of the monolith is 1 mm2.
Figure 2: Monolith for catalytic converter
This monolith is then will be merge into the catalytic converter model before being analysed by using Computational Fluid Dynamics (CFD). Figure 3 show catalytic converter model designed by that is equip with NiO catalyst and FeCrAl monolith.
Figure 3: Catalytic Converter Model
EXPECTED RESULT
The mathematical model for the mass and energy balance of the gas emission will be then used in the ANSYS Software to ensure the concentration of nitrogen oxide (NOx), carbon monoxide (CO) and hydrocarbon (HC) flowing evenly on the FeCrAl monolith. This simulation also give the information about the
λ = uniformity index Ai = local cell area A = local brick area wi = local velocity n = number of cells w = mean velocity
CONTENT-JOSH-DEC-2015-CS6.indd 73 23-Feb-16 9:44:37 AM

Dec 2015, vol 12, No. 2Journal of Occupational Safety and Health
74
Expected Result
The mathematical model for the mass and energy balance of the gas emission will be then used in the ANSYS Software to ensure the concentration of nitrogen oxide (NOx), carbon monoxide (CO) and hydrocarbon (HC) flowing evenly on the FeCrAl monolith. This simulation also give the information about the heat and mass transfer balance in the catalytic converter which become validation tools to the experimental result in order to proof that the catalytic converter can applied to the diesel engine.
Conclusion
Catalytic converter model has been designed using ANSYS software and it solved by FLUENT. Heat and mass transfer investigation may help the analysis of the experimental result.
Acknowledgement
This work was financially supported by Ministry of Education through FRGS Vote 1216 and ORICC Universiti Tun Hussien Onn Malaysia (UTHM) for the management of the research grant.
References
(1). Mohiuddin, A.K.M. and Nurhafez, M. (2007). Experimental Analysis and Comparison of Performance Characteristics of Catalytic Converters Including Simulation. International Journal of Mechanical and Materials Engineering (IJMME), Vol. 2, No. 1, 1-7
(2). Cansu Ozhan, Daniel Fuster and Patrick Da Costa. (2014). Multi-Scale Flow Simulation of Automotive Catalytic Converters. Chemical Engineering Science 116, 161–171.
(3). Pontikakis G. And Stamatelos. A (2001). Mathematical modelling of catalytic exhaust systems for EURO-3 and EURO-4 emissions standards. Proceedings of Institution Mechanical Engineers, Vol 215, Part D. Department of Mechanical and Industrial Engineering, University of Thessaly, Volos, Greece
(4). Ganesan, V., “Internal Combustion Engines,” (2004). Second Edition, McGraw Hill.
(5). Hakan Kaleli, (2001),”The impact of crankcase oil containing phosphorus on catalytic converters and engine exhaust emissions”, Industrial Lubrication and Tribology, Vol. 53 Iss 6 pp. 237 – 255
(6). Hayes, R.E. and S.T. Kolaczkowski, 1997. Introduction to Catalytic Combustion. 1st Edn., Gordon and Breach, Australia, ISBN 10: 9056990926, pp: 681.
(7). Heck, R.M. and Farrauto, R.J. (1995) “.Catalytic Air Pollution Control.,” New York: Van Nostrand Reinhold.
(8). Mohan K. Laxmi, Ranjith Kumar V., Hanumantha Rao Y.V. (2013). Modelling and Simulation of Different Gas Flows Velocity and Pressure in Catalytic Converter with Porous. International Journal of Computational Engineering Research, Vol, 03, Issue 4.
(9). Shelef M., McCabe R.W.. (2000). Twenty five years after introduction of automotive catalysts: what next?. Elsivier Science Chemical and Physical Sciences Laboratory, Ford Research Laboratory, Ford Motor Company. USA.
(10). Mansha M., Qureshi A.H., Chaudry I.A. and Shahid E.M.(2013). Three Ways Catalytic Simulation of Engine-Out Exhaust Emission. Journal of Quality and Technology Management Volume IX, Issue I, pp 57 – 68.
(11). Mansha M. Shahid. E.M., Qureshi A.H.(2012). Control of Combustion Generated Emissions from Spark Ignition Engines: A Review, Pakistan Journal of Engineering and Applied Sciences, Vol. 11, pp 114-128.
(12). McCullough, G., Douglas, R., Cunningham,G., Foley, L.,(2001) “ The Development of a two dimensional transient catalyst model for direct injection two-stroke application”, Proc. Inst. Mech.Eng. Part. D, 215,919-933.
(13). Pontikakis, G.N., (2003). “Modeling,Reaction Schemes and Kinetic Parameter Estimation in Automotive Catalytic Converters and Diesel Particulate Filters,” Published Thesis, University of Thessaly, Greece: Department of Mechanical and Industrial Engineering.
(14). Pachauri, R.K., Reisinger, A., (2007). Climate Change 2007: synthesis Report. Contribution of Working Groups i, ii and iii to the Fourth Assessment Report of the Intergovernmental Panel on Climate Change. IPCC 1.
(15). Koteswara S. Rao, Rayees Imam, Karthik Ramanathan, and S. Pushpavanam (2009). Sensitivity Analysis and Kinetic Parameter Estimation in a Three Way Catalytic Converter American Chemical Society. Vol. 48, No. 8. pp 3779 – 3790. India.
(16). Steffen Tischer , Olaf Deutschmann. (2005). Recent advances in numerical modeling of catalytic monolith reactors. Elsivier Science. Institute for Chemical Technology and Polymer Chemistry, University of Karlsruhe. Karlsruhe, Germany.
CONTENT-JOSH-DEC-2015-CS6.indd 74 23-Feb-16 9:44:37 AM

Dec 2015, vol 12, No. 2Journal of Occupational Safety and Health
75
(17). Sekar T., Kumaran P., Mohana Murugan S. and Sivasubramanian A.. (2014). Redesign of Catalytic Converter. International Journal of Scientific Research. Issue 7. Vol. 3. ISSN No 2277 – 8179. India.
(18). Wojciech Marek and Władyslaw Mitianiec. (2002). Modeling and Research Analysis of Catalytic Converter in A Small Si Two-Stroke Engine. Journal of KONES Internal Combustion Engines 2002 No. 3-4 ISSN 231 - 4005
(19). WU Guojiang, Huang Zhen & Chen Xiaoling, Shanghai,China.(2004). Numerical Simulation of Cold-Start Emission for the Three-Way Catalytic Converter:Mathematical Model and result Analysis
CONTENT-JOSH-DEC-2015-CS6.indd 75 23-Feb-16 9:44:37 AM

Dec 2015, vol 12, No. 2Journal of Occupational Safety and Health
76
CONTENT-JOSH-DEC-2015-CS6.indd 76 23-Feb-16 9:44:37 AM
Dec 2015, vol 12, No. 2Journal of Occupational Safety and Health
77
Introduction
Flooding is one of the most dangerous natural disaster globally (Zhanming wan, 2014). The study found several district in the flood-prone area of Malaysia is flooded every year (Chan Ngai Weng, 2009). The frequency of floods that occur these days has sparked an atmosphere of unrest among the population at risk, because floods can occur at any time and coverage is increasing since the 1970s to the present. The estimated average annual rainfall is received for Peninsular Malaysia is about 2,500 mm (Malaysia Meteorological Department, 2014) has placed Malaysia as among the countries that receive the most rainfall each year.
Warning system are frequently applied as cost-effective risk mitigation measures against natural hazard such as flooding, which provide timely information or ongoing events to reduce loss of life and damage (Martina Sattele, 2015). Research into flood warnings demonstrates the importance of discovering user requirements before designing and
launching flood warning (Emergency Management Australia, Parker 2014). Not to proceed in this manner runs a high risk of warnings being of limited use, largely ignored or substituted by local informal warnings systems (Parker 2014). When flooding in residential areas it can cause destruction of property and also affect the health of population. Thus the system delivery the information to residents indispensable. Exiting warning system that have develop and install not able to give a
clear warning during flooding. Somehow community questioning about the sound proposed for. It’s make the exiting siren system not functioning very well
in part of warning. Other than that, the flood warning system we have nowadays just deliver the warning at residential not to traffic. It’s make hard for traveler to make sure the journey is safe. The existing system just focus on deliver the warning information through texting SMS and Siren but not mapping sign. In part of forecast also have a problem which is not able to easy access to community, Department of Irrigation and Drainage just put on website. It’s make hard to community to access when emergency. The problem will be solve when we develop mobile application that able to deliver forecast, deliver clear warning when flooding and deliver sign in mapping. Its better and not just for resident but also traffic.
Literature Review
Table 1 shown comparison the exiting flood warning system with the ability to deliver forecast, deliver warning, sign in mapping and give clear warning. The source is take from 40 paper that have been publish and the system that have been used nowadays by Department or Irrigation and Drainage. At the comparison part clearly we see the mapping sign still not apply, nowadays majority of people around the world have been use mobile phone and majority of them able to use GPS and Waze.
The Development Of Flood Warning System Using Mobile Application A.M. Leman1 and Syed Hussien Syed Ali2
1 Faculty of Engineering Technology, UniversitiTun Hussein Onn Malaysia (UTHM) 86400, Parit Raja, BatuPahat, Johor, Malaysia 2 Faculty of Civil Engineering and Environmental, UniversitiTun Hussein Onn Malaysia (UTHM) 86400, Parit Raja,
BatuPahat, Johor, Malaysia
Corresponding Author : Email: [email protected], [email protected]
_____________________________________________________________________________
Abstract
Flood warning is designed to protect community from loss of life and their important goods. The objective of this research is to design the flood warning system using mobile application that able to give warning and sign to the mapping. With mobile application concept we can deliver warning faster which is to community smart phone that nowadays majority of them used it. Department of Irrigation and Drainage have built the system that able to detect the rising of water and have delivered the data to the department. The mobile application will get the data directly from server Department of Irrigation and Drainage and distribute to all community. Not just give warning but also able to give sign to the mapping such as GPS and Waze. Red color is danger, Yellow color will consider as warning and green will consider as alert. It is expected that better warning process to community in Malaysia’s in order to promote protection through legislation. The development of mobile application will fulfill the needs of the public, representative of employee, or governmental official to protect community during flooding. Moreover, with this mobile application that cheaper cost and easy to use to the community, it will help government to reduce the cost while flooding. With the ability able to give early warning, give information and educated people, it will make people more alert and get enough information of flooding.
_____________________________________________________________________________
Dec 2015, vol 12, No. 2 : 77-80
CONTENT-JOSH-DEC-2015-CS6.indd 77 23-Feb-16 9:44:37 AM
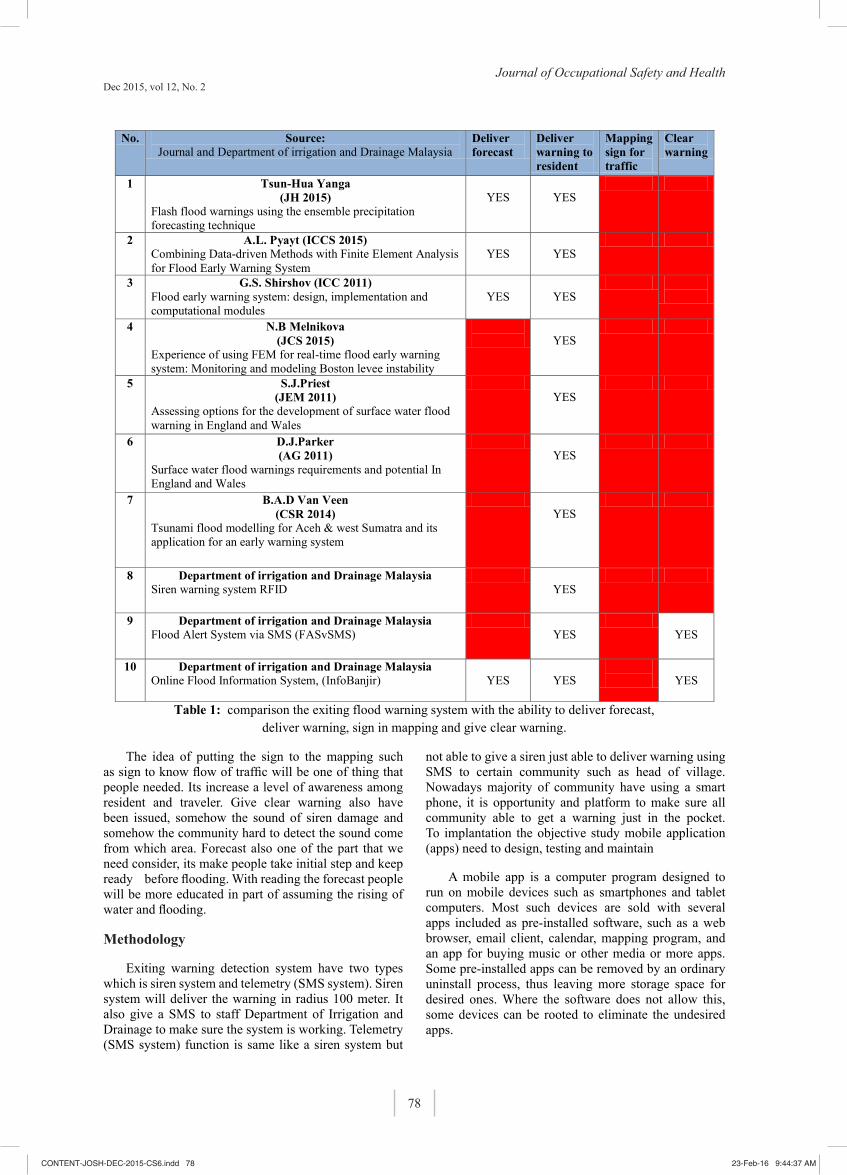
Dec 2015, vol 12, No. 2Journal of Occupational Safety and Health
78
Table 1: comparison the exiting flood warning system with the ability to deliver forecast, deliver warning, sign in mapping and give clear warning.
The idea of putting the sign to the mapping such as sign to know flow of traffic will be one of thing that people needed. Its increase a level of awareness among resident and traveler. Give clear warning also have been issued, somehow the sound of siren damage and somehow the community hard to detect
the sound come from which area. Forecast also one of the part that we need consider, its make people take initial step and keep ready before flooding. With reading the forecast people will be more educated in part of assuming the rising of water and flooding.
No. Source: Journal and Department of irrigation and Drainage Malaysia
Deliver forecast
Deliver warning to resident
Mapping sign for traffic
Clear warning
1 Tsun-Hua Yanga (JH 2015)
Flash flood warnings using the ensemble precipitation forecasting technique
YES
YES
2 A.L. Pyayt (ICCS 2015) Combining Data-driven Methods with Finite Element Analysis for Flood Early Warning System
YES
YES
3 G.S. Shirshov (ICC 2011) Flood early warning system: design, implementation and computational modules
YES
YES
4 N.B Melnikova (JCS 2015)
Experience of using FEM for real-time flood early warning system: Monitoring and modeling Boston levee instability
YES
5 S.J.Priest (JEM 2011)
Assessing options for the development of surface water flood warning in England and Wales
YES
6 D.J.Parker (AG 2011)
Surface water flood warnings requirements and potential In England and Wales
YES
7 B.A.D Van Veen (CSR 2014)
Tsunami flood modelling for Aceh & west Sumatra and its application for an early warning system
YES
8 Department of irrigation and Drainage Malaysia Siren warning system RFID
YES
9 Department of irrigation and Drainage Malaysia Flood Alert System via SMS (FASvSMS)
YES
YES
10 Department of irrigation and Drainage Malaysia Online Flood Information System, (InfoBanjir)
YES
YES
YES
The idea of putting the sign to the mapping such as sign to know flow of traffic will be one of thing that people needed. Its increase a level of awareness among resident and traveler. Give clear warning also have been issued, somehow the sound of siren damage and somehow the community hard to detect the sound come from which area. Forecast also one of the part that we need consider, its make people take initial step and keep ready before flooding. With reading the forecast people will be more educated in part of assuming the rising of water and flooding.
Methodology
Exiting warning detection system have two types which is siren system and telemetry (SMS system). Siren system will deliver the warning in radius 100 meter. It also give a SMS to staff Department of Irrigation and Drainage to make sure the system is working. Telemetry (SMS system) function is same like a siren system but
not able to give a siren just able to deliver warning using SMS to certain community such as head of village. Nowadays majority of community have using a smart phone, it is opportunity and platform to make sure all community able to get a warning just in the pocket. To implantation the objective study mobile application (apps) need to design, testing and maintain
A mobile app is a computer program designed to run on mobile devices such as smartphones and tablet computers. Most such devices are sold with several apps included as pre-installed software, such as a web browser, email client, calendar, mapping program, and an app for buying music or other media or more apps. Some pre-installed apps can be removed by an ordinary uninstall process, thus leaving more storage space for desired ones. Where the software does not allow this, some devices can be rooted to eliminate the undesired apps.
CONTENT-JOSH-DEC-2015-CS6.indd 78 23-Feb-16 9:44:37 AM

Dec 2015, vol 12, No. 2Journal of Occupational Safety and Health
79
Design and Fabrication of Brake Pad Testing Apparatus for Teaching And Learning Application
METHODOLOGY
Figure 1: Concept of flood warning mobile application
Exiting warning detection system have two types which is siren system and telemetry (SMS system). Siren system will deliver the warning in radius 100 meter. It also give a SMS to staff Department of Irrigation and Drainage to make sure the system is working. Telemetry (SMS system) function is same like a siren system but not able to give a siren
just able to deliver warning using SMS to certain community such as head of village. Nowadays majority of community have using a smart phone, it is opportunity and platform to make sure all community able to get a warning just in the pocket. To implantation the objective study mobile application (apps) need to design, testing and maintain
JPS Server
Community able to
response
Or
DANGER WARNING ALERT
EXITING SIREN WARNING SYSTEM RFID MAPS
OK
ALERT
Community
able to response
OK
Expected Result
It is expected that better warning process to community in Malaysia’s in order to promote protection through legislation. The development of mobile application will fulfil the needs of the public, representative of employee, or governmental official to protect community during flooding. Moreover, with this mobile application that cheaper cost and easy to use to the community, it will help government to reduce the cost while flooding. With the ability able to give early warning, give information and educated people, it will make people more alert and get enough information of flooding
Conclusions
The development of mobile application will fulfil the needs of the public, representative of employee, or governmental official to protect community during flooding. Moreover, with this mobile application that cheaper cost and easy to use to the community, it will help government to reduce the cost while flooding
Acknowledgment
The authors need to express thanks to ministry through the MTUN grant No vote 1522, ORICC, UTHM and Community Relations Office for support this project.
References
(1). Melnikova, Jordan, & Krzhizhanovskaya, 2015; Muis, Güneralp, Jongman, Aerts, & Ward, 2015; Sättele, Bründl, & Straub, 2015)Krzhizhanovskaya, V. V., Shirshov, G. S., Melnikova, N. B., Belleman, R. G., Rusadi, F. I., Broekhuijsen, B. J., … Meijer, R. J. (2011). Flood early warning system: Design, implementation and computational modules. Procedia Computer Science, 4, 106–115. http://doi.org/10.1016/j.procs.2011.04.012
(2). Melnikova, N. B., Jordan, D., & Krzhizhanovskaya, V. V. (2015). Experience of using FEM for real-time flood early warning systems: Monitoring and modeling Boston levee instability. Journal of Computational Science, 10, 13–25. http://doi.org/10.1016/j.jocs.2015.04.033
CONTENT-JOSH-DEC-2015-CS6.indd 79 23-Feb-16 9:44:37 AM

Dec 2015, vol 12, No. 2Journal of Occupational Safety and Health
80
(3). Muis, S., Güneralp, B., Jongman, B., Aerts, J. C. J. H., & Ward, P. J. (2015). Flood risk and adaptation strategies under climate change and urban expansion: A probabilistic analysis using global data. Science of The Total Environment, 538, 445–457. http://doi.org/10.1016/j.scitotenv.2015.08.068
(4). Parker, D. J., Priest, S. J., & McCarthy, S. S. 2011. Surface water flood warnings requirements and potential in England and Wales. Applied Geography,
(5). Priest, S. J., Parker, D. J., Hurford, a. P., Walker, J., & Evans, K. 2011). Assessing options for the development of surface water flood warning in England and Wales. Journal of Environmental Management, 92(12), 3038–3048. http://doi.org/10.1016/j.jenvman.2011.06.041
(6). Pyayt, A. L., Shevchenko, D. V., Kozionov, A. P., Mokhov, I. I., Lang, B., Krzhizhanovskaya, V. V., & Sloot, P. M. A. (2015). Combining Data-Driven Methods with Finite Element Analysis for Flood Early Warning Systems. Procedia Computer Science, 51(812), 2347–2356. http://doi.org/10.1016/j.procs.2015.05.404
(7). Sättele, M., Bründl, M., & Straub, D. (2015). Reliability and effectiveness of early warning systems for natural hazards: Concept and application to debris flow warning. Reliability Engineering & System Safety, 142, 192–202. http://doi.org/10.1016/j.ress.2015.05.003
(8). Wang, Y., Zhang, W., Engel, B. A., Peng, H., Theller, L., Shi, Y., & Hu, S. (2015). A fast mobile early warning system for water quality emergency risk in ungauged river basins. Environmental Modelling & Software, 73, 76–89.
CONTENT-JOSH-DEC-2015-CS6.indd 80 23-Feb-16 9:44:37 AM

Dec 2015, vol 12, No. 2Journal of Occupational Safety and Health
81
Introduction
Small and medium enterprises have been flourishing in many countries over these decades. The role that the small and medium enterprise (SME) played has been contributing a major impact towards the economy of the majority of countries all around the globe. This industry covers the majority numbers of companies constructed and also provides a large number of work been produced in terms of employability in the labor sector.
An example for the importance of SME was stated by (Hasle & Limborg, 2006) that said in Denmark, a total of 98% of all companies have less than 50 employees, covering approximately a third of the total working force. This indicates that the importance that the SME industry plays in terms of economic development is huge and it continues to expand over time. Many countries have already realized this importance including Malaysia and steps have been taken to help these industry players to survive and thrive through the economic condition that is full of uncertainties. Due to the severe economic condition nowadays that is full of uncertainties, safety and health issues were neglected in order for the SME owners to cut the operation cost for their business. However, due to the blooming awareness towards the importance of implementing safety and health practices in the SME, research in this particular area have been steadily growing over the years. Various agencies and companies have been collaborating hand in hand to conduct research in this area to protect the wellbeing of the SME workers and also for the SME to achieve sustainable development in the future.
Literature Review
Small and medium enterprises were proven to be an important sector that contribute a lot towards the economic development of a nation (Saleh & Ndubisi, 2006). Despite the contributions and the importance played by the small and medium enterprises, the industries are burdened by many challenges. Several challenges that were faced by the industries are financial, legislations, external factor, access towards management ability and skilled workforces and several others (Khalique, Abdul, Shaari, & Ageel, 2011; Saleh & Ndubisi, 2006). Some of the challenges, mainly access towards management ability and skilled workforces have caused the implementation of occupational safety and health in the workplace to be at a minimum level causing the number of accidents, injuries and fatalities particularly in this sector to rise every year. According to (Hasle & Limborg, 2006), implementing safety and health cultures in the workplace particularly in the SME sectors tends to be low, mainly because of their limited access to finance causing safety practices to be the first item in their list to be thrown out for cost cutting.
SME owners tend to invest their time and money on something that can improve their productivity and boost their income in a short period of time rather than investing on improving safety and health cultures in the workplace. Croucher et al (2013) from the International Labor Organization (ILO) stated that occupational injury and disease is costly on human or social terms and it proved to be vital in providing a powerful incentive to improve OSH outcomes. This statement proves that failure to implement the necessary safety and health practices in the workplace can be catastrophic for any business organization in the long run.
Occupational Safety and Health Management System in Malaysia’s Southern Region: Small and Medium Enterprise Case Study
M. A. Muhammad Hasbullah, A. M. Leman and I. Baba
Faculty of Engineering Technology, Universiti Tun Hussein Onn Malaysia, 86400 Parit Raja, Batu Pahat, Johor
_____________________________________________________________________________
Abstract
Occupational safety and health (OSH) in Small and Medium Enterprises (SMEs) have not received the proper attention not only in Malaysia, but in most of the countries globally, in terms of research or support for implementation. This research focuses on the implementation of the occupational safety and health in small and medium industries in the southern region of peninsular of Malaysia. The objective of this research is to determine the level of awareness of SME owners and also their employers towards the importance of implementing OSH in their daily tasks. This study will be based on conducting a survey to 200 SMEs owners and workers throughout the southern region of Malaysia. The results from this research can be use as a benchmark for other researchers to further enhance the research in this area.
Keywords : Occupational Safety and Health (OSH), Small and Medium Enterprise (SME)
_____________________________________________________________________________
Dec 2015, vol 12, No. 2 : 81-86
CONTENT-JOSH-DEC-2015-CS6.indd 81 23-Feb-16 9:44:37 AM
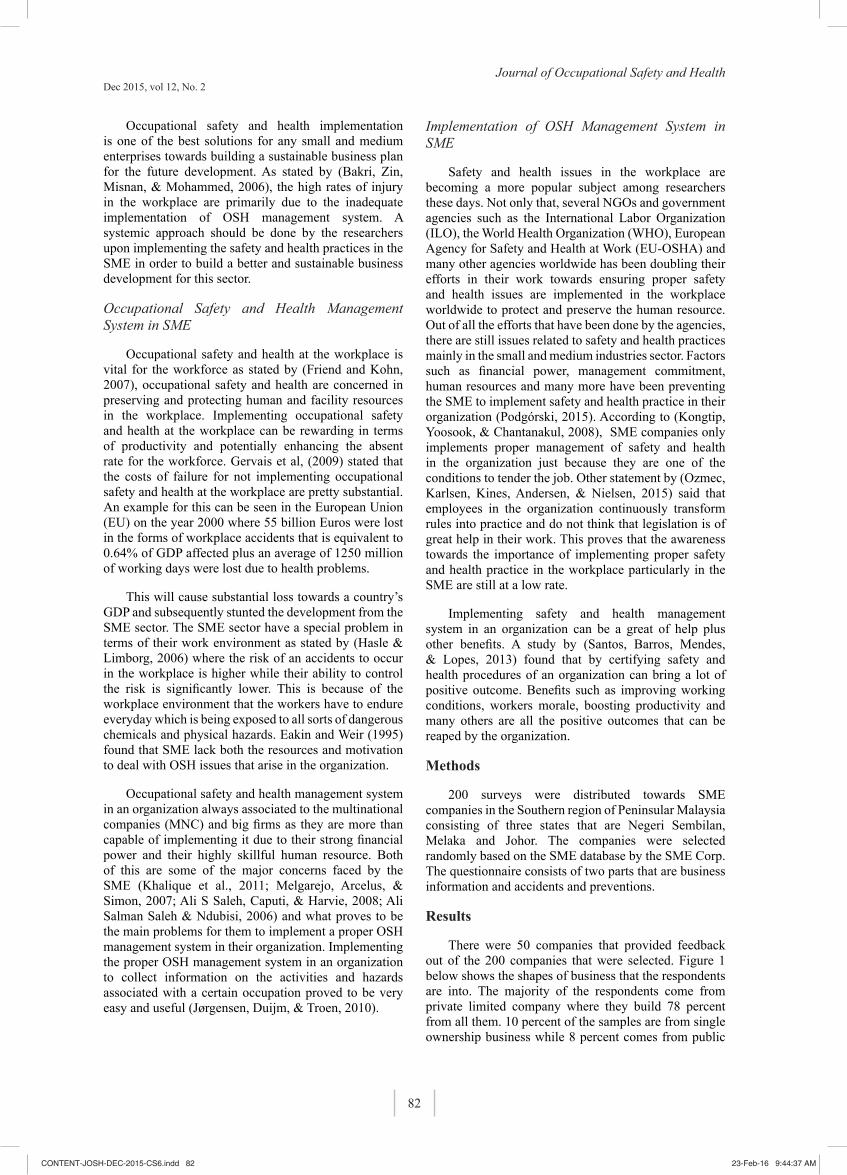
Dec 2015, vol 12, No. 2Journal of Occupational Safety and Health
82
Occupational safety and health implementation is one of the best solutions for any small and medium enterprises towards building a sustainable business plan for the future development. As stated by (Bakri, Zin, Misnan, & Mohammed, 2006), the high rates of injury in the workplace are primarily due to the inadequate implementation of OSH management system. A systemic approach should be done by the researchers upon implementing the safety and health practices in the SME in order to build a better and sustainable business development for this sector.
Occupational Safety and Health Management System in SME
Occupational safety and health at the workplace is vital for the workforce as stated by (Friend and Kohn, 2007), occupational safety and health are concerned in preserving and protecting human and facility resources in the workplace. Implementing occupational safety and health at the workplace can be rewarding in terms of productivity and potentially enhancing the absent rate for the workforce. Gervais et al, (2009) stated that the costs of failure for not implementing occupational safety and health at the workplace are pretty substantial. An example for this can be seen in the European Union (EU) on the year 2000 where 55 billion Euros were lost in the forms of workplace accidents that is equivalent to 0.64% of GDP affected plus an average of 1250 million of working days were lost due to health problems.
This will cause substantial loss towards a country’s GDP and subsequently stunted the development from the SME sector. The SME sector have a special problem in terms of their work environment as stated by (Hasle & Limborg, 2006) where the risk of an accidents to occur in the workplace is higher while their ability to control the risk is significantly lower. This is because of the workplace environment that the workers have to endure everyday which is being exposed to all sorts of dangerous chemicals and physical hazards. Eakin and Weir (1995) found that SME lack both the resources and motivation to deal with OSH issues that arise in the organization.
Occupational safety and health management system in an organization always associated to the multinational companies (MNC) and big firms as they are more than capable of implementing it due to their strong financial power and their highly skillful human resource. Both of this are some of the major concerns faced by the SME (Khalique et al., 2011; Melgarejo, Arcelus, & Simon, 2007; Ali S Saleh, Caputi, & Harvie, 2008; Ali Salman Saleh & Ndubisi, 2006) and what proves to be the main problems for them to implement a proper OSH management system in their organization. Implementing the proper OSH management system in an organization to collect information on the activities and hazards associated with a certain occupation proved to be very easy and useful (Jørgensen, Duijm, & Troen, 2010).
Implementation of OSH Management System in SME
Safety and health issues in the workplace are becoming a more popular subject among researchers these days. Not only that, several NGOs and government agencies such as the International Labor Organization (ILO), the World Health Organization (WHO), European Agency for Safety and Health at Work (EU-OSHA) and many other agencies worldwide has been doubling their efforts in their work towards ensuring proper safety and health issues are implemented in the workplace worldwide to protect and preserve the human resource. Out of all the efforts that have been done by the agencies, there are still issues related to safety and health practices mainly in the small and medium industries sector. Factors such as financial power, management commitment, human resources and many more have been preventing the SME to implement safety and health practice in their organization (Podgórski, 2015). According to (Kongtip, Yoosook, & Chantanakul, 2008), SME companies only implements proper management of safety and health in the organization just because they are one of the conditions to tender the job. Other statement by (Ozmec, Karlsen, Kines, Andersen, & Nielsen, 2015) said that employees in the organization continuously transform rules into practice and do not think that legislation is of great help in their work. This proves that the awareness towards the importance of implementing proper safety and health practice in the workplace particularly in the SME are still at a low rate.
Implementing safety and health management system in an organization can be a great of help plus other benefits. A study by (Santos, Barros, Mendes, & Lopes, 2013) found that by certifying safety and health procedures of an organization can bring a lot of positive outcome. Benefits such as improving working conditions, workers morale, boosting productivity and many others are all the positive outcomes that can be reaped by the organization.
Methods
200 surveys were distributed towards SME companies in the Southern region of Peninsular Malaysia consisting of three states that are Negeri Sembilan, Melaka and Johor. The companies were selected randomly based on the SME database by the SME Corp. The questionnaire consists of two parts that are business information and accidents and preventions.
Results
There were 50 companies that provided feedback out of the 200 companies that were selected. Figure 1 below shows the shapes of business that the respondents are into. The majority of the respondents come from private limited company where they build 78 percent from all them. 10 percent of the samples are from single ownership business while 8 percent comes from public
CONTENT-JOSH-DEC-2015-CS6.indd 82 23-Feb-16 9:44:37 AM
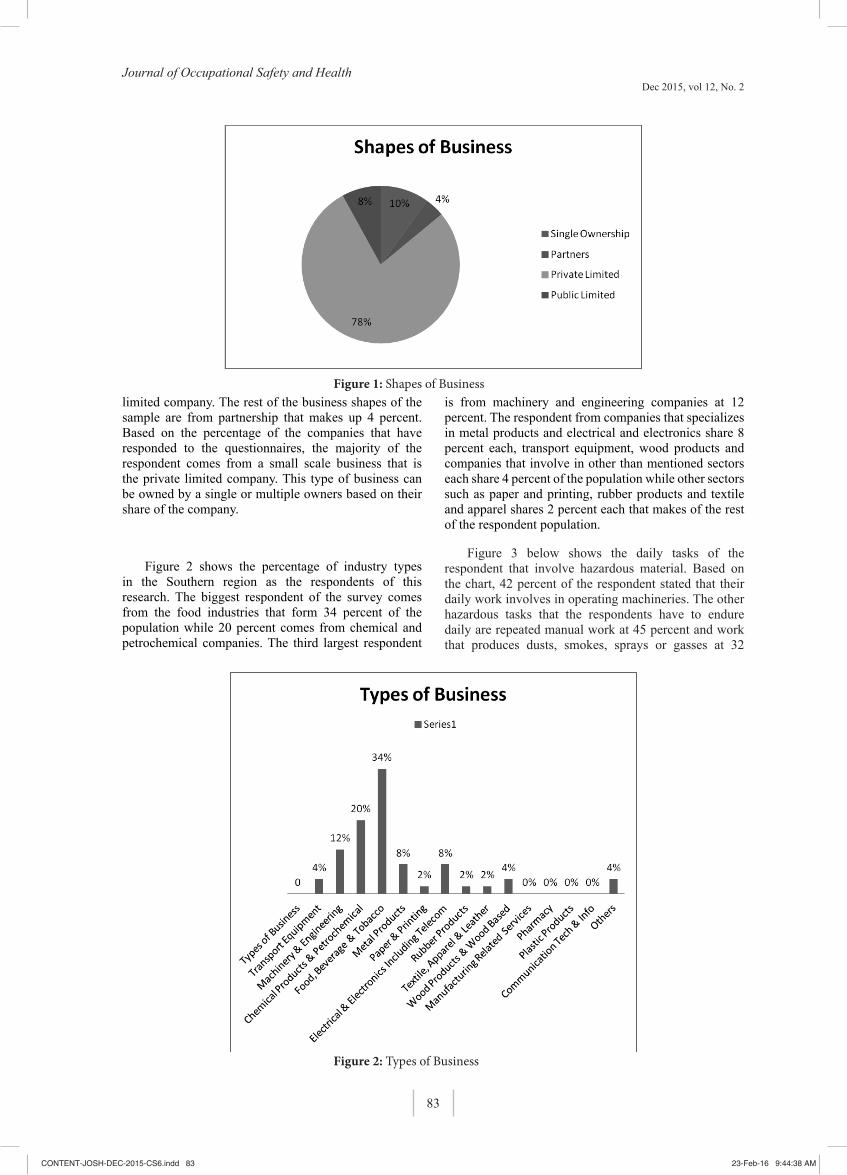
Dec 2015, vol 12, No. 2Journal of Occupational Safety and Health
83
limited company. The rest of the business shapes of the sample are from partnership that makes up 4 percent. Based on the percentage of the companies that have responded to the questionnaires, the majority of the respondent comes from a small scale business that is the private limited company. This type of business can be owned by a single or multiple owners based on their share of the company.
Figure 2 shows the percentage of industry types in the Southern region as the respondents of this research. The biggest respondent of the survey comes from the food industries that form 34 percent of the population while 20 percent comes from chemical and petrochemical companies. The third largest respondent
is from machinery and engineering companies at 12 percent. The respondent from companies that specializes in metal products and electrical and electronics share 8 percent each, transport equipment, wood products and companies that involve in other than mentioned sectors each share 4 percent of the population while other sectors such as paper and printing, rubber products and textile and apparel shares 2 percent each that makes of the rest of the respondent population.
Figure 3 below shows the daily tasks of the respondent that involve hazardous material. Based on the chart, 42 percent of the respondent stated that their daily work involves in operating machineries. The other hazardous tasks that the respondents have to endure daily are repeated manual work at 45 percent and work that produces dusts, smokes, sprays or gasses at 32
3.0 Methods
200 surveys were distributed towards SME companies in the Southern region of Peninsular Malaysia consisting of three states that are Negeri Sembilan, Melaka and Johor. The companies were selected randomly based on the SME database by the SME Corp. The questionnaire consists of two parts that are business information and accidents and preventions.
4.0 Results
There were 50 companies that provided feedback out of the 200 companies that were selected. Figure 1 below shows the shapes of business that the respondents are into. The majority of the respondents come from private limited company where they build 78 percent from all them. 10 percent of the samples are from single ownership business while 8 percent comes from public limited company. The rest of the business shapes of the sample are from partnership that makes up 4 percent. Based on the percentage of the companies that have responded to the questionnaires, the majority of the respondent comes from a small scale business that is the private limited company. This type of business can be owned by a single or multiple owners based on their share of the company.
Figure 1: Shapes of Business
Figure 2 shows the percentage of industry types in the Southern region as the respondents of this research. The biggest respondent of the survey comes from the food industries that form 34 percent of the population while 20 percent comes from chemical and petrochemical companies. The third largest respondent is from machinery and engineering companies at 12 percent. The respondent from companies that specializes in metal products and electrical and electronics share 8 percent each, transport equipment, wood products and companies that involve in other than mentioned sectors each share 4 percent of the population while other sectors such as paper and printing, rubber products and textile and apparel shares 2 percent each that makes of the rest of the respondent population.
Figure 2: Types of Business
Figure 3 below shows the daily tasks of the respondent that involve hazardous material. Based on the chart, 42 percent of the respondent stated that their daily work involves in operating
Figure 1: Shapes of Business
Figure 2: Types of Business
CONTENT-JOSH-DEC-2015-CS6.indd 83 23-Feb-16 9:44:38 AM

Dec 2015, vol 12, No. 2Journal of Occupational Safety and Health
84
percent. There are other tasks that the respondent stated that they frequently do such as task involving mobile electrical appliances at 23 percent, and task involving machineries and flammable liquid and gas at 22 percent each. Based on the data, there are several hazardous task than can cause substantial damage in the sector such as task involving machineries, mobile electrical appliances, flammable liquid and gas and work that produce dusts, smokes, sprays or gasses. This tasks, if not dealt properly can cause severe injuries or worse, fatality in the workplace.
Figure 4 below shows the accidents and prevention measures done by the respondent in their organization to ensure occupational safety and health practices are properly implemented. 74 percent of the respondent stated that they provide accidents record book in their premises to ensure every accidents that happened at the workplace are properly documented for future references. All of the respondents also provided first aid kit in their premises for early treatment in case accidents that causes injuries occurred. The figure shows that the respondents are committed to provide a safe environment in their business premises and 62 percent of them also go as far as providing their workers a health screening. Although 76 percent of them agree that their daily tasks requires them to use personal protective equipment (PPE), the respondent also agree that the company have done their best in providing them with the proper PPE in order for them to complete their jobs. However, the number of accidents that happened in the last six months is a little bit alarming where 62 percent of the company
admits that there are accidents that happened in their business premises. Some prevention measure needs to be addressed into this matter, although the accidents does not require hospitalization of the workers, but the effort may prevent bigger issues to arise such as major accidents or the worst is fatality.
Conclusion
Issues regarding occupational safety and health issues in the small and medium enterprises need to be more understands so that their capabilities in implementing OSH management system can be improved in the future. Further studies should be focusing on factors that affected the ability of the organization to implement proper safety and health management practice so that more issues can be learn towards building a sustainable business development for this sector.
Reference
(1). Bakri, A., Zin, R. M., Misnan, M., & Mohammed, A. (2006). Occupational Safety and Health (OSH) management systems: towards development of safety and health culture, (September), 5–6. Retrieved from http://eprints.utm.my/520/
(2). Croucher, R., Stumbitz, B., Vickers, I., Quinlan, M., Hanfield, W., et a.l (2013). Can better working conditions improve the performance of SMEs?: An international Literature Review. ILO
machineries. The other hazardous tasks that the respondents have to endure daily are repeated manual work at 45 percent and work that produces dusts, smokes, sprays or gasses at 32 percent. There are other tasks that the respondent stated that they frequently do such as task involving mobile electrical appliances at 23 percent, and task involving machineries and flammable liquid and gas at 22 percent each. Based on the data, there are several hazardous task than can cause substantial damage in the sector such as task involving machineries, mobile electrical appliances, flammable liquid and gas and work that produce dusts, smokes, sprays or gasses. This tasks, if not dealt properly can cause severe injuries or worse, fatality in the workplace.
Figure 3: Daily Task Involving Hazardous Item
Figure 4 below shows the accidents and prevention measures done by the respondent in their organization to ensure occupational safety and health practices are properly implemented. 74 percent of the respondent stated that they provide accidents record book in their premises to ensure every accidents that happened at the workplace are properly documented for future references. All of the respondents also provided first aid kit in their premises for early treatment in case accidents that causes injuries occurred. The figure shows that the respondents are committed to provide a safe environment in their business premises and 62 percent of them also
Figure 3: Daily Task Involving Hazardous Item
CONTENT-JOSH-DEC-2015-CS6.indd 84 23-Feb-16 9:44:38 AM

Dec 2015, vol 12, No. 2Journal of Occupational Safety and Health
85
go as far as providing their workers a health screening. Although 76 percent of them agree that their daily tasks requires them to use personal protective equipment (PPE), the respondent also agree that the company have done their best in providing them with the proper PPE in order for them to complete their jobs. However, the number of accidents that happened in the last six months is a little bit alarming where 62 percent of the company admits that there are accidents that happened in their business premises. Some prevention measure needs to be addressed into this matter, although the accidents does not require hospitalization of the workers, but the effort may prevent bigger issues to arise such as major accidents or the worst is fatality.
Figure 4: Accident and Prevention
5.0 Conclusion
Issues regarding occupational safety and health issues in the small and medium enterprises need to be more understands so that their capabilities in implementing OSH management system can be improved in the future. Further studies should be focusing on factors that affected the ability of the organization to implement proper safety and health management practice so that more issues can be learn towards building a sustainable business development for this sector.
Figure 4: Accident and Prevention
(3). Eakin, J.M. and Weir, N. (1995). Canadian approaches to the promotion of health in small business. Canadian Journal of Public Health. 86: 109-122.
(4). Friend M. A and Kohn J. P. (2007). Fundamentals of Occupational Safety and Health. Fourth Edition. Government Institute. The Scarecrow Press, Maryland. United States of America. pp 1-7.
(5). Gervais, L.R., Pawlowska, Z., Bojanowski, R., Kouvonen, A., Murray, M.K., Greef, M.D., &Broek, K.v.D., (2009). Occupational Health and Safety and economic performance in small and medium-sized enterprise: a review. European Agency for Safety and Health at Work (EU-OSHA)
(6). Hasle, P., & Limborg, H. J. (2006). A review of the literature on preventive occupational health and safety activities in small enterprises. Industrial Health, 44(1), 6–12. doi:10.2486/indhealth.44.6
(7). Jørgensen, K., Duijm, N. J., & Troen, H. (2010). Accident prevention in SME using ORM. Safety Science, 48(8), 1036–1043. doi:10.1016/j.ssci.2010.02.008
(8). Khalique, M., Abdul, J., Shaari, N., & Ageel, A. (2011). Challenges faced by the small and medium enterprises (SMEs) in Malaysia: An intellectual capital perspective. International Journal of Current Research, 3(2011), 398–401.
(9). Kongtip, P., Yoosook, W., & Chantanakul, S. (2008). Occupational health and safety management in small and medium-sized enterprises: An overview of the situation in Thailand. Safety Science, 46(9),
1356–1368. doi:10.1016/j.ssci.2007.09.001
(10). Melgarejo, Z., Arcelus, F. J., & Simon, K. (2007). Measuring performance: differences between capitalist and labour-owned enterprises. International Journal of Social Economics, 34(7), 485–501. doi:10.1108/03068290710760254
(11). Ozmec, M. N., Karlsen, I. L., Kines, P., Andersen, L. P. S., & Nielsen, K. J. (2015). Negotiating safety practice in small construction companies. Safety Science, 71, 275–281. http://doi.org/10.1016/j.ssci.2014.03.016
(12). Podgórski, D. (2015). Measuring operational performance of OSH management system – A demonstration of AHP-based selection of leading key performance indicators. Safety Science, 73, 146–166. http://doi.org/10.1016/j.ssci.2014.11.018
(13). Saleh, A. S., Caputi, P., & Harvie, C. (2008). Perceptions of business challenges facing Malaysian SMEs : some preliminary results, 2008, 79–106.
(14). Saleh, A. S., & Ndubisi, N. O. (2006). An Evaluation of SME Development in Malaysia, 2(1), 1–14.
(15). Santos, G., Barros, S., Mendes, F., & Lopes, N. (2013). The main benefits associated with health and safety management systems certification in Portuguese small and medium enterprises post quality management system certification. Safety Science, 51(1), 29–36.
CONTENT-JOSH-DEC-2015-CS6.indd 85 23-Feb-16 9:44:38 AM

Dec 2015, vol 12, No. 2Journal of Occupational Safety and Health
86
CONTENT-JOSH-DEC-2015-CS6.indd 86 23-Feb-16 9:44:38 AM

Dec 2015, vol 12, No. 2Journal of Occupational Safety and Health
87
Introduction
The braking system is considered by many people to be most importance system involve in the operation of a vehicle. The braking system provides to slow down or to stop a vehicle. There are two various braking tools which are using disk brake and drum brake (Erjavec 2004, Halderman et al., 2003, Roslan 2001). Disc brake usually use for front wheel while the drum brake use for rare wheel. The advantages of disc brake are more stable, brake rotor will stay cleaner, freer of water, dust or dirt and it will cause no distortion of the rotor than a drum brake. It has much cooler operation than a drum brake because of the area that exposed to the air flowing pass it increased (Roslan 2001, Arunachalam and gokuldass 2001). The simplest way to stop a car is to convert the kinetic energy become heat energy. Brakes are essentially heat machine. They generate heat from friction by rubbing the lining against the rotating rotors or drums. This friction can generate a large amount of heat but its depending on the brake pad and disc material (Arunachalam and gokuldass 2001, Darius 2007).
Generally, until today there are no brake pads testing apparatus which determine the entire different pad and help in teaching and learning application. As long the information and knowledge is only based on the theory, the important thing of practical results is not achieved. Therefore, this research is designed in order to complete the student knowledge about the braking process. This
apparatus is designed complete with several sensors such as thermocouple, pressure gauge and tachometer.
Literature Review
Brake pad is the part of a automobile system that actually takes the brunt of the frictional force necessary to stop the vehicle. Disk brake pad has friction material attached to the steel backing (Erjavec 2004). Several method to attach the friction material into the steel backing such as riveted, bonded and integrally molded. Nowadays, the brake pad material uses the non-asbestos material, it become replacement of asbestos material
because it contribute to the health hazard (Novotny and Raymond 2006, Darius 2007). However, it still used as replacement lining. The friction coefficient of the several types of brake pad material is classed into two which are cold and warm condition as listed in Table 1.
Design and Fabrication of Brake Pad Testing Apparatus For Teaching and Learning Application
A.M. Leman1, Dafit Feriyanto2, Che Wan Izzudin1 and Md Zin Ibrahim1
1 Faculty of Engineering Technology, Universiti Tun Hussein Onn Malaysia (UTHM) 86400, Parit Raja, Batu Pahat, Johor, Malaysia 2 Faculty of Mechanical and Manufacturing Engineering, Universiti Tun Hussein Onn Malaysia (UTHM) 86400, Parit
Raja, Batu Pahat, Johor, Malaysia
Corresponding Author : Email: [email protected], [email protected]
_____________________________________________________________________________
Abstract
Brake pad apparatus is designed for help student and instructor in teaching and learning application. The objective of this research is to differentiate the pressure effect and braking temperature condition of different pad. This apparatus also aimed for learning the safety car and motorcycle braking system. This apparatus can to compare with theoretical calculation in order to approve that this apparatus is useful. The main concept in this apparatus is thermocouple use to detect the temperature gain while braking process. Speed motor controller used for set the angular velocity of the motor in braking process. Pressure applied at brake pedal detected by pressure gauge and data logger function as a connector. This apparatus also designed based on valid data for average of teenager in Malaysia which made on a sample university student. Result show that the apparatus can function effectively by defines the different temperature when applied the different pressure and different pad. Pad C shows the 880C for thermocouple 1 and 790C for thermocouple 2 at the 20 psi and infrared thermometer show 1130C for pad C. Graph from calculation shows that the pad A have 216.480C at 1000 rpm which have low temperature than pad B, C and D. high efficiency of friction and pressure applied will cause more heat generate than low coefficient of friction and pressure applied.
Keywords : Brake pad, braking temperature, teaching and learning, safety and health
_____________________________________________________________________________
Dec 2015, vol 12, No. 2 : 87-92
Design and Fabrication of Brake Pad Testing Apparatus for Teaching And Learning Application
amount of heat but its depending on the brake pad and disc material (Arunachalam and gokuldass 2001, Darius 2007).
Generally, until today there are no brake pads testing apparatus which determine the entire different pad and help in teaching and learning application. As long the information and knowledge is only based on the theory, the important thing of practical results is not achieved. Therefore, this research is designed in order to complete the student knowledge about the braking process. This apparatus is designed complete with several sensors such as thermocouple, pressure gauge and tachometer.
LITERATURE REVIEW
Brake pad is the part of a automobile system that actually takes the brunt of the frictional force necessary to stop the vehicle. Disk brake pad has friction material attached to the steel backing (Erjavec 2004). Several method to attach the friction material into the steel backing such as riveted, bonded and integrally molded. Nowadays, the brake pad material
uses the non-asbestos material, it become replacement of asbestos material because it contribute to the health hazard (Novotny and Raymond 2006, Darius 2007). However, it still used as replacement lining. The friction coefficient of the several types of brake pad material is classed into two which are cold and warm condition as listed in Table 1.
Material types Cold Warm Organic 0.44 0.48 Semi metallic 0.38 0.40 Metallic 0.25 0.35 Synthetic 0.38 0.45
Table 1: Friction coefficient of brake pad materials in cold and warm condition
(Erjavec 2004)
METHODOLOGY
This research is carried out based on the calculation and efficiency design as shown in Figure 1. The design is adapted by the average of human height in order to achieve the smoothly experiment. The calculation is conducted in order to develop the accuracy when the brake pads apparatus operated.
Figure 1: Flow chart of developing brake pad apparatus
CONTENT-JOSH-DEC-2015-CS6.indd 87 23-Feb-16 9:44:38 AM
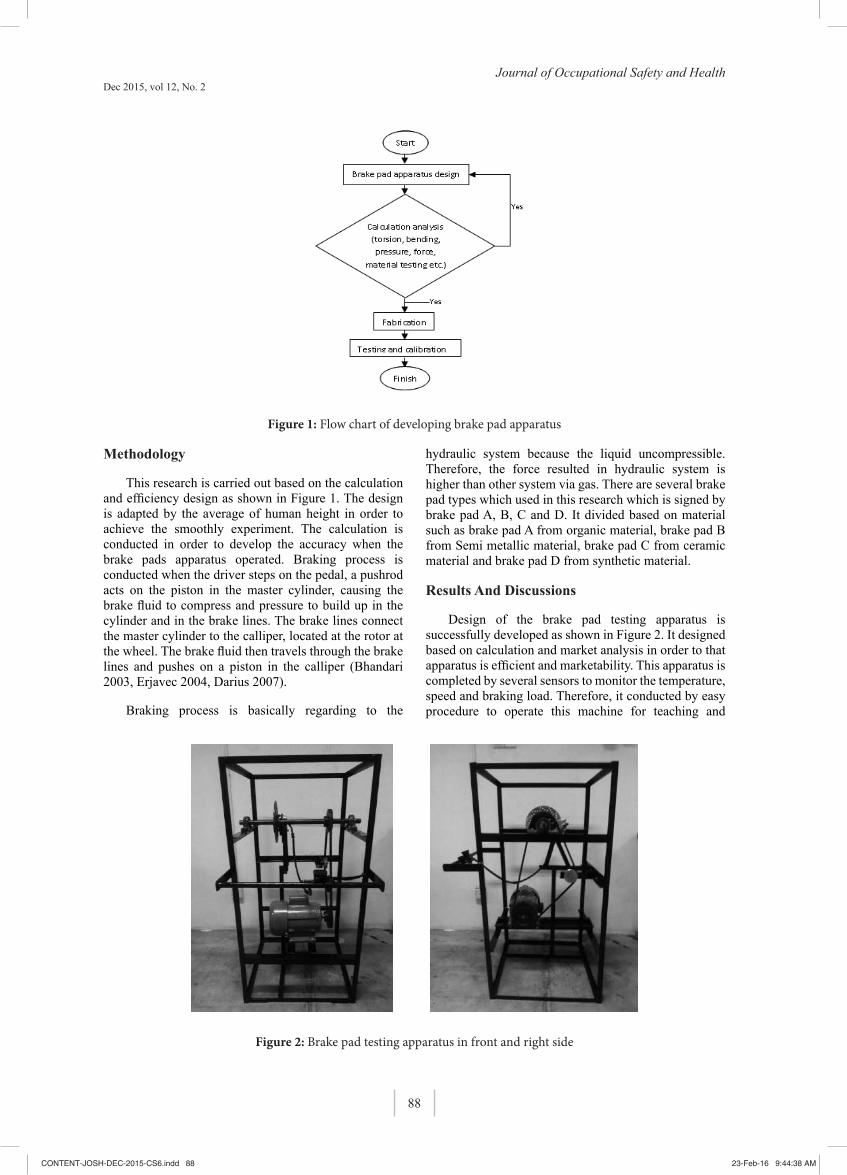
Dec 2015, vol 12, No. 2Journal of Occupational Safety and Health
88
Methodology
This research is carried out based on the calculation and efficiency design as shown in Figure 1. The design is adapted by the average of human height in order to achieve the smoothly experiment. The calculation is conducted in order to develop the accuracy when the brake pads apparatus operated. Braking process is conducted when the driver steps on the pedal, a pushrod acts on the piston in the master cylinder, causing the brake fluid to compress and pressure to build up in the cylinder and in the brake lines. The brake lines connect the master cylinder to the calliper, located at the rotor at the wheel. The brake fluid then travels through the brake lines and pushes on a piston in the calliper (Bhandari 2003, Erjavec 2004, Darius 2007).
Braking process is basically regarding to the
hydraulic system because the liquid uncompressible. Therefore, the force resulted in hydraulic system is higher than other system via gas. There are several brake pad types which used in this research which is signed by brake pad A, B, C and D. It divided based on material such as brake pad A from organic material, brake pad B from Semi metallic material, brake pad C from ceramic material and brake pad D from synthetic material.
Results And Discussions
Design of the brake pad testing apparatus is successfully developed as shown in Figure 2. It designed based on calculation and market analysis in order to that apparatus is efficient and marketability. This apparatus is completed by several sensors to monitor the temperature, speed and braking load. Therefore, it conducted by easy procedure to operate this machine for teaching and
Design and Fabrication of Brake Pad Testing Apparatus for Teaching And Learning Application
amount of heat but its depending on the brake pad and disc material (Arunachalam and gokuldass 2001, Darius 2007).
Generally, until today there are no brake pads testing apparatus which determine the entire different pad and help in teaching and learning application. As long the information and knowledge is only based on the theory, the important thing of practical results is not achieved. Therefore, this research is designed in order to complete the student knowledge about the braking process. This apparatus is designed complete with several sensors such as thermocouple, pressure gauge and tachometer.
LITERATURE REVIEW
Brake pad is the part of a automobile system that actually takes the brunt of the frictional force necessary to stop the vehicle. Disk brake pad has friction material attached to the steel backing (Erjavec 2004). Several method to attach the friction material into the steel backing such as riveted, bonded and integrally molded. Nowadays, the brake pad material
uses the non-asbestos material, it become replacement of asbestos material because it contribute to the health hazard (Novotny and Raymond 2006, Darius 2007). However, it still used as replacement lining. The friction coefficient of the several types of brake pad material is classed into two which are cold and warm condition as listed in Table 1.
Material types Cold Warm Organic 0.44 0.48 Semi metallic 0.38 0.40 Metallic 0.25 0.35 Synthetic 0.38 0.45
Table 1: Friction coefficient of brake pad materials in cold and warm condition
(Erjavec 2004)
METHODOLOGY
This research is carried out based on the calculation and efficiency design as shown in Figure 1. The design is adapted by the average of human height in order to achieve the smoothly experiment. The calculation is conducted in order to develop the accuracy when the brake pads apparatus operated.
Figure 1: Flow chart of developing brake pad apparatus Figure 1: Flow chart of developing brake pad apparatus
Figure 2: Brake pad testing apparatus in front and right side
Original Article J. Occu. Safety & Health 2015
Braking process is conducted when the driver steps on the pedal, a pushrod acts on the piston in the master cylinder, causing the brake fluid to compress and pressure to build up in the cylinder and in the brake lines. The brake lines connect the master cylinder to the calliper, located at the rotor at the wheel. The brake fluid then travels through the brake lines and pushes on a piston in the calliper (Bhandari 2003, Erjavec 2004, Darius 2007). Braking process is basically regarding to the hydraulic system because the liquid uncompressible. Therefore, the force resulted in hydraulic system is higher than other system via gas. There are several brake pad types which used in this research which is signed by brake pad A, B, C and D. It divided based on material such as brake pad A from
organic material, brake pad B from Semi metallic material, brake pad C from ceramic material and brake pad D from synthetic material. RESULTS AND DISCUSSIONS
Design of the brake pad testing apparatus is successfully developed as shown in Figure 2. It designed based on calculation and market analysis in order to that apparatus is efficient and marketability. This apparatus is completed by several sensors to monitor the temperature, speed and braking load. Therefore, it conducted by easy procedure to operate this machine for teaching and learning process.
Figure 2: Brake pad testing apparatus in front and right side
Several analyses are carried out in order to investigate the performance and the mechanical properties of the brake pad testing apparatus. Those analyses are torque, bending and welding analysis. Torque analysis involves the diameter and the length of the shaft. Fail torque analysis will affect the shaft broken. Bending occur when the load attach
along the long plate with high weight. Analysis for this problem was important to make sure the thickness and the long of the plate which hold the shaft suitable and safe to operate. Meanwhile, welding analysis is done at the tip of the support plate which holds the shaft. Support plate had weld with the main structure. Thickness and size of the welds
CONTENT-JOSH-DEC-2015-CS6.indd 88 23-Feb-16 9:44:38 AM

Dec 2015, vol 12, No. 2Journal of Occupational Safety and Health
89
learning process.
Several analyses are carried out in order to investigate the performance and the mechanical properties of the brake pad testing apparatus. Those analyses are torque, bending and welding analysis. Torque analysis involves the diameter and the length of the shaft. Fail torque analysis will affect the shaft broken. Bending occur when the load attach along the long plate with high weight. Analysis for this problem was important to make sure the thickness and the long of the plate which hold the shaft suitable and safe to operate. Meanwhile, welding analysis is done at the tip of the support plate which holds
the shaft. Support plate had weld with the main structure. Thickness and size of the welds were important to make sure the support plate can sustain the weight of shaft. Permissible shear stress in the weld is limited to 70 N/mm2. The data result of that analysis is listed in Table 2.
In this brake pad testing apparatus, material used for fabricate based on steel and plastic. Steel used for main structure and movement component when plastic use for cover the apparatus. There are four (4) factors need to be considering while selecting the material such as:
• Availability: material should be available in the market
• Cost: consider the limiting cost beyond. There are two factors normally which are cost of material and cost of processing the material into finished look. Cost for the two normally factors should be low
• Mechanical properties: the mechanical properties for the structure should be more strength
• Manufacturing consideration: material should be easier to machine or joint
According to the factors above, the material properties for brake pad testing installation is selected based on ASTM-A36 as listed in Table 3. That property is considered to achieve the optimum brake pad testing apparatus performance.
Analysis for speed of shaft in rpm and Hz unit
Speed of motor was measured by motor converter. Unit of motor converter is Hz and tachometer was used to get the speed in rpm unit. The testing process was showed the speed of motor is shown by 2 different units which are Hz and rpm as listed in Table 4.
Testing analysis
Braking testing is monitored by 3 sensors which are thermocouple 1, thermocouple 2 and infrared thermometer. It installed for investigating the temperature in various force and time as listed in Table 5 to 8.
Force of 20 psi generally generates large temperature while braking process. It caused by high friction between the brake pad and the rotor. High surface contact is influenced to the decreasing brake pad and the disc brake. Largest value of the temperature in brake pad A of 92, 88 and 113 0C is showed by thermocouple 1, 2 and infrared thermometer, respectively. The temperature of 100, 96 and 114 0C is showed by brake pad B which monitored by thermocouple 1, 2 and infrared thermometer, respectively. In addition, thermocouple 1, 2 and infrared thermometer in brake pad C test shown 88, 79 and 125 0C, respectively. Brake pad D testing shows the temperature of 98, 88 and 133 0C when monitored by thermocouple 1, 2 and infrared thermometer, respectively. Lower force is produce lower heating temperature caused by decreasing surface contact of both materials.
This experimental result is influenced by friction coefficient while braking process in same diameters of 0.045 meter. This experiment is conducted using different speed and pressure/braking load. It investigates the effect of that parameter to the friction coefficient of each brake pad as shown in Table 9.
Different friction coefficient in various brake pads is caused by several factors such as brake pad material,
Design and Fabrication of Brake Pad Testing Apparatus for Teaching And Learning Application
were important to make sure the support plate can sustain the weight of shaft. Permissible shear stress in the weld is limited to 70 N/mm2. The data result of that analysis is listed in Table 2.
No Parameter Unit Value 1. Diameter, D Mm 26 2. Power, P kW 4 3. Speed, N rpm 2870 4. Length, L Mm 190 5. Young modulus, G Gpa 77.2 6. Weight, W Newton 98.1
Table 2: Data results of torque, bending and welding analysis
In this brake pad testing apparatus, material used for fabricate based on steel and plastic. Steel used for main structure and movement component when plastic use for cover the apparatus. There are four (4) factors need to be considering while selecting the material such as:
Availability: material should be available in the market
Cost: consider the limiting cost beyond. There are two factors normally which are cost of material and cost of processing the material into finished look. Cost for the two normally factors should be low
Mechanical properties: the mechanical properties for the structure should be more strength
Manufacturing consideration: material should be easier to machine or joint
According to the factors above, the material properties for brake pad testing installation is selected based on ASTM-A36 as listed in
Table 3. That property is considered to achieve the optimum brake pad testing apparatus performance.
Material properties Structure steel (ASTM-A36)
Density 7860 kg/m3 Tension (ultimate strength)
400 Mpa
Tension (yield strength)
250Mpa
Shear (yield strength) 145 Mpa Modulus of elasticity 200 Gpa Modulus of rigidity 77.2 Gpa
Table 3: Material properties of brake pad testing installation
Analysis for speed of shaft in rpm and Hz unit
Speed of motor was measured by motor converter. Unit of motor converter is Hz and tachometer was used to get the speed in rpm unit. The testing process was showed the speed of motor is shown by 2 different units which are Hz and rpm as listed in Table 4.
Speed (Hz) Speed (rpm) 30 1779 20 1201 10 600
Table 4: Motor speed in Hz and rpm units
Testing analysis
Braking testing is monitored by 3 sensors which are thermocouple 1, thermocouple 2 and infrared thermometer. It installed for investigating the temperature in various force and time as listed in Table 5 to 8.
CONTENT-JOSH-DEC-2015-CS6.indd 89 23-Feb-16 9:44:39 AM
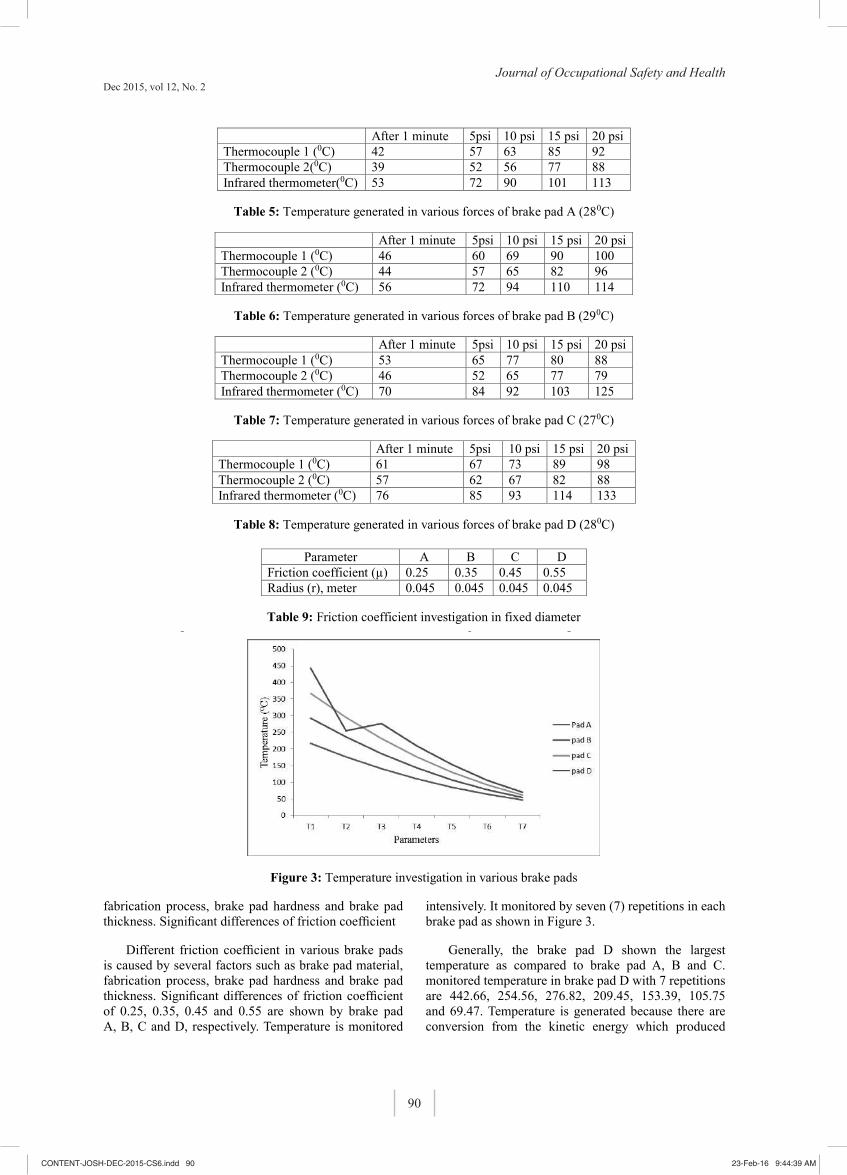
Dec 2015, vol 12, No. 2Journal of Occupational Safety and Health
90
Original Article J. Occu. Safety & Health 2015
After 1 minute 5psi 10 psi 15 psi 20 psi Thermocouple 1 (0C) 42 57 63 85 92 Thermocouple 2(0C) 39 52 56 77 88 Infrared thermometer(0C) 53 72 90 101 113
Table 5: Temperature generated in various forces of brake pad A (280C)
After 1 minute 5psi 10 psi 15 psi 20 psi Thermocouple 1 (0C) 46 60 69 90 100 Thermocouple 2 (0C) 44 57 65 82 96 Infrared thermometer (0C) 56 72 94 110 114
Table 6: Temperature generated in various forces of brake pad B (290C)
After 1 minute 5psi 10 psi 15 psi 20 psi Thermocouple 1 (0C) 53 65 77 80 88 Thermocouple 2 (0C) 46 52 65 77 79 Infrared thermometer (0C) 70 84 92 103 125
Table 7: Temperature generated in various forces of brake pad C (270C)
After 1 minute 5psi 10 psi 15 psi 20 psi Thermocouple 1 (0C) 61 67 73 89 98 Thermocouple 2 (0C) 57 62 67 82 88 Infrared thermometer (0C) 76 85 93 114 133
Table 8: Temperature generated in various forces of brake pad D (280C)
Force of 20 psi generally generates large temperature while braking process. It caused by high friction between the brake pad and the rotor. High surface contact is influenced to the decreasing brake pad and the disc brake. Largest value of the temperature in brake pad A of 92, 88 and 113 0C is showed by thermocouple 1, 2 and infrared thermometer, respectively. The temperature of 100, 96 and 114 0C is showed by brake pad B which monitored by thermocouple 1, 2 and infrared thermometer, respectively. In addition, thermocouple 1, 2 and infrared thermometer in brake pad C test shown 88, 79 and 125 0C, respectively. Brake pad D testing
shows the temperature of 98, 88 and 133 0C when monitored by thermocouple 1, 2 and infrared thermometer, respectively. Lower force is produce lower heating temperature caused by decreasing surface contact of both materials.
This experimental result is influenced by friction coefficient while braking process in same diameters of 0.045 meter. This experiment is conducted using different speed and pressure/braking load. It investigates the effect of that parameter to the friction coefficient of each brake pad as shown in Table 9.
Design and Fabrication of Brake Pad Testing Apparatus for Teaching And Learning Application
Parameter A B C D Friction coefficient (µ) 0.25 0.35 0.45 0.55 Radius (r), meter 0.045 0.045 0.045 0.045
Table 9: Friction coefficient investigation in fixed diameter
Different friction coefficient in various brake pads is caused by several factors such as brake pad material, fabrication process, brake pad hardness and brake pad thickness. Significant differences of friction coefficient
of 0.25, 0.35, 0.45 and 0.55 are shown by brake pad A, B, C and D, respectively. Temperature is monitored intensively. It monitored by seven (7) repetitions in each brake pad as shown in Figure 3.
Figure 3: Temperature investigation in various brake pads
Generally, the brake pad D shown the largest temperature as compared to brake pad A, B and C. monitored temperature in brake pad D with 7 repetitions are 442.66, 254.56, 276.82, 209.45, 153.39, 105.75 and 69.47. Temperature is generated because there are conversion from the kinetic energy which produced by disc brake to the heat energy. The kinetic energy from rotor is converted into thermal energy via friction between brake pad and rotor.
CONCLUSIONS
Highest coefficient of friction, speed and temperature increased will effect to the
increasing temperature. Installation of thermocouple in the pad is not a hundred percent close to the actual condition, however it shown the same pattern in reading result. The producing and marketing this brake pad testing apparatus help the student and instructor in process of teaching and learning application.
ACKNOWLEDGMENT
The authors need to express thanks to ministry through the MTUN grant No vote C060, ORICC, UTHM and Community Relations Office for support this project.
fabrication process, brake pad hardness and brake pad thickness. Significant differences of friction coefficient
Different friction coefficient in various brake pads is caused by several factors such as brake pad material, fabrication process, brake pad hardness and brake pad thickness. Significant differences of friction coefficient of 0.25, 0.35, 0.45 and 0.55 are shown by brake pad A, B, C and D, respectively. Temperature is monitored
intensively. It monitored by seven (7) repetitions in each brake pad as shown in Figure 3.
Generally, the brake pad D shown the largest temperature as compared to brake pad A, B and C. monitored temperature in brake pad D with 7 repetitions are 442.66, 254.56, 276.82, 209.45, 153.39, 105.75 and 69.47. Temperature is generated because there are conversion from the kinetic energy which produced
CONTENT-JOSH-DEC-2015-CS6.indd 90 23-Feb-16 9:44:39 AM

Dec 2015, vol 12, No. 2Journal of Occupational Safety and Health
91
by disc brake to the heat energy. The kinetic energy from rotor is converted into thermal energy via friction between brake pad and rotor.
Conclusions
Highest coefficient of friction, speed and temperature increased will effect to the increasing temperature. Installation of thermocouple in the pad is not a hundred percent close to the actual condition, however it shown the same pattern in reading result. The producing and marketing this brake pad testing apparatus help the student and instructor in process of teaching and learning application.
Acknowledgment
The authors need to express thanks to ministry through the MTUN grant No vote C060, ORICC, UTHM and Community Relations Office for support this project.
References
(1). Arunachalam, V. and gokuldass T. V. 2001. On-road brake testing. Solution automation; EE-evaluating Eng.
(2). Bhandari, V. B. 2003. Introduction machine design.]2nd ed. McGraw-Hill, New Delhi.
(3). Darius, G. S.. 2007. Brake pad and disc material. Universiti Teknologi MARA, Syah Alam, Malaysia
(4). Erjavec, J. 2004. Automotive brakes. Clifton Park. N.Y; Delmar learning.
(5). Halderman, J. D., Chase D. and Mitchell Jr. 2003. Automotive technology principle diagnosis and service. 2nd ed. Columbus, Ohio; Delmar publisher
(6). Novotny and Raymond J. 2006. Brake block temperature and wear measuring device; European patent application.
(7). Roslan Abd. Rahman. 2001. Mekanik mesin 3. 3rd ed. UTM skudai, Johor, Malaysia.
CONTENT-JOSH-DEC-2015-CS6.indd 91 23-Feb-16 9:44:39 AM

Dec 2015, vol 12, No. 2Journal of Occupational Safety and Health
92
CONTENT-JOSH-DEC-2015-CS6.indd 92 23-Feb-16 9:44:39 AM
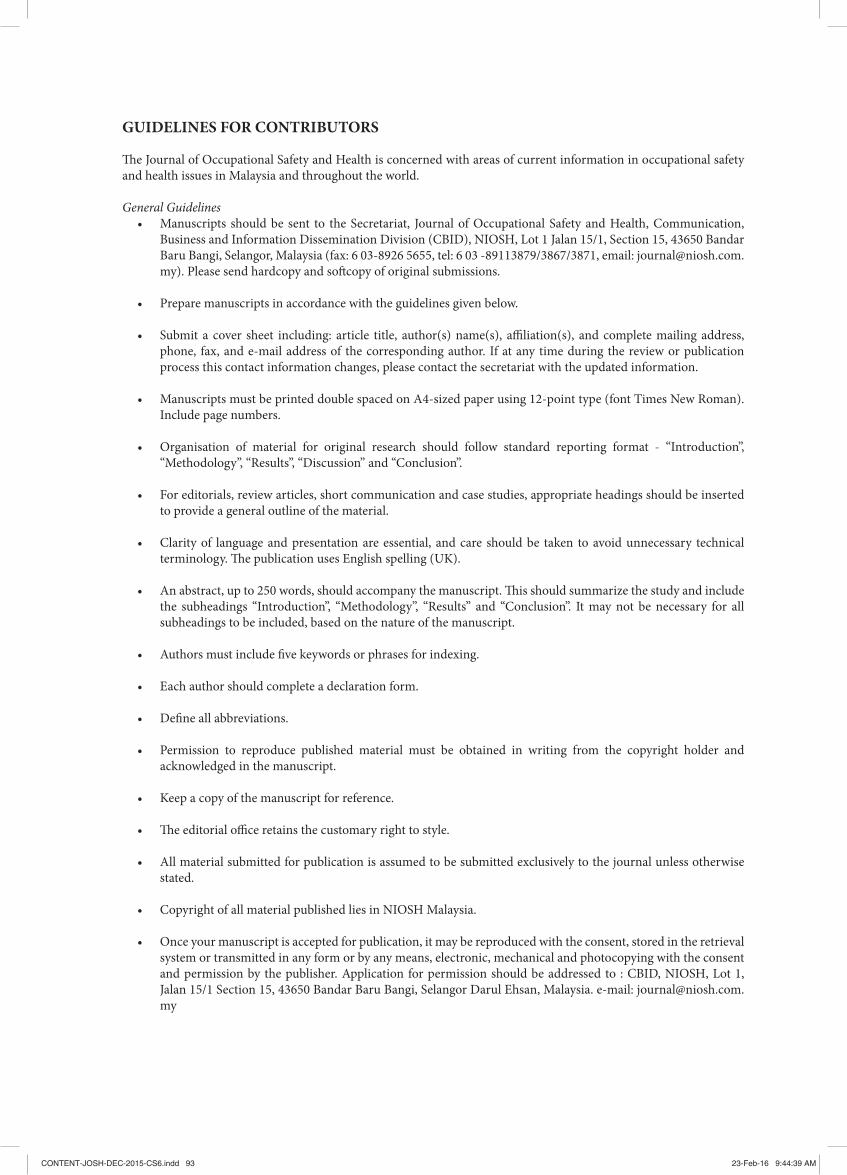
Dec 2015, vol 12, No. 2Journal of Occupational Safety and Health
93
GUIDELINES FOR CONTRIBUTORS
The Journal of Occupational Safety and Health is concerned with areas of current information in occupational safety and health issues in Malaysia and throughout the world.
General Guidelines• Manuscripts should be sent to the Secretariat, Journal of Occupational Safety and Health, Communication,
Business and Information Dissemination Division (CBID), NIOSH, Lot 1 Jalan 15/1, Section 15, 43650 Bandar Baru Bangi, Selangor, Malaysia (fax: 6 03-8926 5655, tel: 6 03 -89113879/3867/3871, email: [email protected]). Please send hardcopy and softcopy of original submissions.
• Prepare manuscripts in accordance with the guidelines given below.
• Submit a cover sheet including: article title, author(s) name(s), affiliation(s), and complete mailing address, phone, fax, and e-mail address of the corresponding author. If at any time during the review or publication process this contact information changes, please contact the secretariat with the updated information.
• Manuscripts must be printed double spaced on A4-sized paper using 12-point type (font Times New Roman). Include page numbers.
• Organisation of material for original research should follow standard reporting format - “Introduction”, “Methodology”, “Results”, “Discussion” and “Conclusion”.
• For editorials, review articles, short communication and case studies, appropriate headings should be inserted to provide a general outline of the material.
• Clarity of language and presentation are essential, and care should be taken to avoid unnecessary technical terminology. The publication uses English spelling (UK).
• An abstract, up to 250 words, should accompany the manuscript. This should summarize the study and include the subheadings “Introduction”, “Methodology”, “Results” and “Conclusion”. It may not be necessary for all subheadings to be included, based on the nature of the manuscript.
• Authors must include five keywords or phrases for indexing.
• Each author should complete a declaration form.
• Define all abbreviations.
• Permission to reproduce published material must be obtained in writing from the copyright holder and acknowledged in the manuscript.
• Keep a copy of the manuscript for reference.
• The editorial office retains the customary right to style.
• All material submitted for publication is assumed to be submitted exclusively to the journal unless otherwise stated.
• Copyright of all material published lies in NIOSH Malaysia.
• Once your manuscript is accepted for publication, it may be reproduced with the consent, stored in the retrieval system or transmitted in any form or by any means, electronic, mechanical and photocopying with the consent and permission by the publisher. Application for permission should be addressed to : CBID, NIOSH, Lot 1, Jalan 15/1 Section 15, 43650 Bandar Baru Bangi, Selangor Darul Ehsan, Malaysia. e-mail: [email protected]
CONTENT-JOSH-DEC-2015-CS6.indd 93 23-Feb-16 9:44:39 AM

Dec 2015, vol 12, No. 2Journal of Occupational Safety and Health
94
References:All references must be formatted in accordance with the Publication Manual of the American Psychological Association (APA), Fifth Edition.
For example:Journal Articles:Smith, A.B., Adams, K.D., & Jones, L.J. (1992). The hazards of living in a volcano. Journal of Safety Research, 23(1),81-94.
Book:Perez, A.K., Little, T.H., & Brown, Y.J. (1999). Safety in numbers. Itasca, IL: National Safety Council.
On-line Publication:National Institute of Occupational Safety and Health. Sick Building Syndrome. www.niosh.com.my/safetytips.asp?safetyid=1 (accessed October 2004)
Government Publication:Ministry of Health Malaysia & Academy of Medicine Malaysia (2003). Clinical Practise Guidelines on Management of Obesity 2003.
Tables and Figures:Tables and figures should be on separate sheets from the text, in accordance with APA style, numbered consecutively and given a short but explicit title. Title for table should be above table. Title for figures should be below figure, Figures must be supplied as glossy photographs or professionally or electronically drawn artwork using heavy white paper and black ink. A notation should be made in the text showing approximately where each table or figure should appear (e.g., Insert Table 3 here). When referring to a particular table or figure in the text always use its number. All tables will be re-set in the production process. All figures will be scanned from the original.
Computer Disks:If you send a computer disk with your submission, please label it with the author(s) name(s) and manuscript title. Disks will not be returned. Only Microsoft Word format is accepted.
Contributor’s copy:Each author will receive 1 copy of the journal.
Subscription InformationJournal of Occupational Safety and Health (ISSN 1675-5456) is published bi-annually
by Communication, Business and Information Dissemination Division (CBID), NIOSH,Malaysia. Subscription prices are available upon request from the publisher or from
www.niosh.com.my Issues are sent by standard mail. For orders, claims, productenquiries and advertising information, contact Ms Roslina / Ms Siti Badariah
603-8911 3879 / 3866 or [email protected]
Advertising RatesEnquiries to be directed to the secretariat.
Secretariat AddressNational Institute of Occupational Safety and Health
Lot 1, Jalan 15/1, Section 15, 43650 Bandar Baru BangiSelangor Darul Ehsan, Malaysia
Tel.: 603-8911 3879 / 3867 / 3871 Fax.: 603-8926 5655Email: [email protected] Website: www.niosh.com.my
CONTENT-JOSH-DEC-2015-CS6.indd 94 23-Feb-16 9:44:39 AM

Dec 2015, vol 12, No. 2Journal of Occupational Safety and Health
95
New book… Now Available!
Organizational Psychology
Author: H.L. KailaISBN: 9789384588731Pages: 328Date of Publication: 21 Nov. 2015Binding: Paperback Dimension: 18cm x 24cm Weight: 420grams Price: Rs.345.00
About the Book:
This book presents theoretical background, comprehensive literature review, interviews, case studies, and lot of application exercises on all major topics of Industrial/Organizational Psychology. The main objective of the book is to help students to acquire knowledge and skills, which they would apply in organizations during their professional careers.
It covers all major topics such as human resource planning, employee recruitment and selection, training and development, employee engagement and organizational commitment, organizational culture, motivation and job satisfaction, work-life balance, leadership and group dynamics, performance management, employee counseling. The coverage of research methods and statistical techniques is a major highlight of the book. The book is up-to-date in terms of cited references and list of suggested readings and captures all recent researches in this area.
Learning Aids:• The introductory chapter covers the evolution of Industrial/Organizational (I/O) Psychology as a discipline and gives a foundational prologue.• Each chapter contains an interesting “opening story” which sets the tone of the chapter subsequently.• All chapters contain margin notes annotated as “good to know” features, which will help the students to get a quick reference for the accompanying material.• Each chapter has well laid out exercises for classroom discussion, practice, undertaking projects and surveys and so on.
This book is targeted at the undergraduate and postgraduate students of Psychology and Management. It will be also useful to researchers, practitioners and academics in I/O Psychology.
Advance praises for the book: “The book on ‘Industrial & Organizational Psychology’ authored by Professor (Dr) H.L.Kaila will bridge the gap of long-felt need for students and researchers in the area. It is singularly different from the other academic publications of the area with its distinct focus on applied aspects with updated review of recent researches and studies in the field of industrial and organizational psychology. It will be extremely helpful for students and members of academic community. The examples will enrich readers to apply the learned concepts in practice.” -- Dr Abhijit Gangopadhyay, Formerly Professor & Head, Personnel Management & Industrial Relations, Tata Institute of Social Sciences, Mumbai
CONTENT-JOSH-DEC-2015-CS6.indd 95 23-Feb-16 9:44:39 AM

Dec 2015, vol 12, No. 2Journal of Occupational Safety and Health
96
“In his book, Dr Kaila has cared much to include the theoretical concepts, researches, case studies and applications of organizational psychology which are of much interest and use to not only the students who would study this subject matter in much depth, but also to the practicing managers in organizations. The content coverage is quite wider than the books available currently. The best aspect about this book is ‘the research cases based on Indian organizations’ included in every chapter of this text book which is very useful for students.”– Professor Jitendra Mohan, Professor Emeritus of Psychology, Panjab University, Chandigarh
“Dr. Kaila in this book on Industrial/organizational psychology has adopted a very practical approach to make theoretical concepts easy to understand through case studies in Indian perspective. The book written by Dr. Kaila keeping in mind the students is actually also very useful for HR practitioners and anyone having interest in and keen to know all about Industry, Management, Organisation and its psychology. The topics are comprehensive, relevant and generate interest. An Interesting read indeed!”, -- Anil Kaushik, Management Expert & Chief Editor ‘Business Manager’ - HR Magazine, Alwar (Rajasthan).
Contents : 1. An Introduction to Industrial/Organizational Psychology 2. Research Methods 3. Human Resource Planning / Human Resource Management 4. Employee Recruitment and Selection 5. Training and Development 6. Employee Engagement and Organizational Commitment 7. Organizational Culture and Performance 8. Motivation and Job Satisfaction 9. Work-Life Balance10. Safety at Workplace11. Leadership and Group Dynamics 12. Performance Management 13. Employee Counselling 14. Statistical Techniques Index.
Audience: BA and MA Psychology, B.Tech (Industrial Psychology), MBA, HR/OB students, researchers in I/O Psychology, and Executives.
link: http://www.ikbooks.com/product_info.php?currency=INR&products_id=1780#.VllWT3YrLow
Publishers CORPORATE OFFICEI.K. International Publishing House Pvt. Ltd.S-25, Green Park Extn., Uphaar Cinema Market, New Delhi - 110 016, India Phone: 91) (011) 43205400 Fax: (91) (011) 41755551 Email: [email protected]
KRISHAN MAKHIJANI(Managing Director)Email: [email protected]
Order Today!
CONTENT-JOSH-DEC-2015-CS6.indd 96 23-Feb-16 9:44:39 AM

iii
COVER-JOSH-DEC-2015-CS6-Final.pdf 2 22-Jan-16 5:19:00 PM

iv
COVER-JOSH-DEC-2015-CS6-Final.pdf 1 22-Jan-16 5:19:00 PM